stars:invdividual (LY CMa, HD 54786) — stars:Be — supergiant – stars:neutron — X-rays:binaries
Discovery of a new supergiant fast X-ray transient MAXI J0709159 associated with the Be star LY CMa
Abstract
We report on the discovery of a new supergiant fast X-ray transient (SFXT), MAXI J0709159, and its identification with LY CMa (also known as HD 54786). On 2022 January 25, a new flaring X-ray object named MAXI J0709159, was detected by Monitor of All-sky X-ray Image (MAXI). Two flaring activities were observed in the two scans of hours apart, where the 2–10 keV flux reached erg cm-2 s-1. During the period, the source exhibited a large spectral change suggesting that the absorption column density increased from cm-2 to cm-2. NuSTAR follow-up observation on January 29 identified a new X-ray source with a flux of erg cm-2 s-1 at the position consistent with LY CMa, which has been identified as B supergiant as well as Be star, located at the 3 kpc distance. The observed X-ray activity characterized by the short ( several hours) duration, the rapid ( a few seconds) variabilities accompanied with spectral changes, and the large luminosity swing (– erg s-1) agree with those of SFXT. On the other hand, optical spectroscopic observations of LY CMa revealed a broad emission line, which may indicate the existence of a Be circumstellar disk. These obtained results suggest that the optical companion, LY CMa, certainly has a complex circumstellar medium including dense clumps.
1 Introduction
MAXI (Monitor of All-sky X-ray Image: [Matsuoka et al. (2009)]) on the International Space Station (ISS) has been continuously scanning the almost entire sky every ISS orbital cycle (92 minutes) since the in-orbit operation started in 2009. It provides us a unique opportunity to discover new objects and study their transient behaviors. In fact, we have discovered 31 new X-ray objects including 14 black-hole binaries, 13 neutron-star binaries, and one white-dwarf binary, that appeared in our Galaxy and the Small Magellanic Cloud (e.g. [Mihara et al. (2022)]). The data also enable us to study their variabilities in time scales from hours to over the 12 years. To uncover the nature of these new transient objects, prompt follow-up observations with large-area X-ray telescopes as well as multi-wavelength observations from both space and ground observatories are essential. The MAXI nova-alert system (Negoro et al., 2016) and prompt coordinated observations with Swift, NICER, NuSTAR satellites, have been working effectively for these transient studies such as an ignition of a classical nova, MAXI J0158744 (Morii et al., 2013), a new Be X-ray binary pulsar, MAXI J0903531 (Tsygankov et al., 2021), and a faint and short-duration back-hole binary candidate, MAXI J1848015 (Pike et al., 2022).
On 2022 January 25, MAXI discovered a new X-ray transient with an instantaneous 4–10 keV flux of 270 mCrab ( erg cm-2 s-1), named MAXI J0709159 (hereafter MAXI J0709), in the constellation Canis Majoris (Serino et al., 2022). The source was first detected during the scan transit at UT 10:42, but not detected in the next scan transit at UT 12:15. However, it was detected again in the other next scan at UT 13:48 (Kobayashi et al., 2022). This means that the source exhibited a large intensity variation within the 3 hours. Three hours after the MAXI discovery, NICER (The Neutron star Interior Composition ExploreR; Gendreau et al. (2012)) started multiple pointing observations covering almost the entire region of the MAXI position error (circle of radius ). The new transient was successfully detected with the pointing observation carried out 6 minutes after the MAXI scan at UT 13:46. The NICER observations refined the source position with the error of and also revealed that the X-ray flux had declined by a factor of from the MAXI observations (Iwakiri et al., 2022).
From 2022 January 19 to February 18, the Swift X-ray satellite (Gehrels et al., 2004) stopped the normal operation because the attitude control system was troubled111https://swift.gsfc.nasa.gov/news/2022/safe_mode.html. Hence, we applied for the NuSTAR (Nuclear Spectroscopic Telescope Array; Harrison et al. (2013)) ToO (Time of Opportunity) observation. The NuSTAR observation was carried out on 2022 January 29, 4 days after the discovery. The result revealed a new point source within the error circle of the MAXI J0709 position uncertainty. The position of the new source is consistent with LY CMa (also known as HD 54786), which has been identified as a Be star (Negoro et al., 2022; Nesci, 2022). In Gaia Early Data Release 3, the distance is estimated to be kpc (Bailer-Jones et al., 2021)222 https://vizier.u-strasbg.fr/viz-bin/VizieR-3?-source=I/352 . From optical follow-up observations and archival data analysis, Bhattacharyya et al. (2022) suggested that LY CMa would be an evolved Be star, rather than a main sequence star or a supergiant. A radio observation was carried out on 2022 January 31 with the MerrKAT radio telescope, but no significant emission was detected at 1.28 GHz and the 3- upper limit was estimated to be 57 Jy (Rhodes et al., 2022) Finally, the Swift ToO observation was carried out on 2022 February 23.
In this paper, we report the discovery of the new transient MAXI J0709 and results of the MAXI, NuSTAR, Swift, and eROSITA observations of the identified X-ray object. We also report an optical follow-up observation of the optical counterpart in the Chuo University. Based on the obtained results, we discuss the nature of the new X-ray object. In the following throughout the paper, errors represent 90% confidence limits of statistical uncertainties unless otherwise specified.
2 MAXI observations and data analysis
MAXI Gas Slit Camera (GSC; Mihara et al. (2011); Sugizaki et al. (2011)) consists of 12 identical camera units, namely GSC_0, …, GSC_9, GSC_A, GSC_B. Utilizing the two wide () FOVs, GSC scans the whole sky every 92 minutes. We investigated X-ray activities of a new transient MAXI J0709 in time scales shorter than each scan transit ( s) and longer than the scan cycle ( minutes), using the GSC data. We here employed GSC event files of the process version 2.1, taken via the low-speed telemetry interface, and performed the data analysis using MAXI software included in HEASoft version 6.29 the calibration database (CALDB) version 20210504 released from JAXA data archive333https://www.darts.isas.jaxa.jp/astro/maxi/data.html.
2.1 GSC light curve
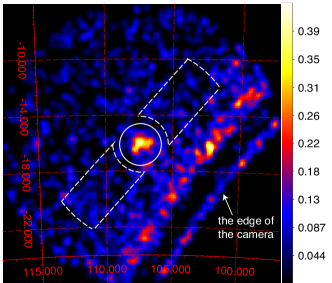
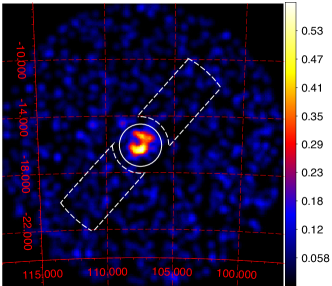
We extracted GSC light curves of MAXI J0709 by fitting each GSC scan image with a model consisting of a point-spread function (PSF) for the target source and a uniform background (Morii et al., 2016). The source position was fixed at the position parameters refined by the NuSTAR observation (section 3.1). Figure 1 shows GSC 2–20 keV images taken by the GSC_4 and GSC_5 units, when MAXI J0709 was first detected on 2022 January 25 (MJD 59604). Within 10 days before and after the first detection, the source had been observed by either or both of these two GSC units.
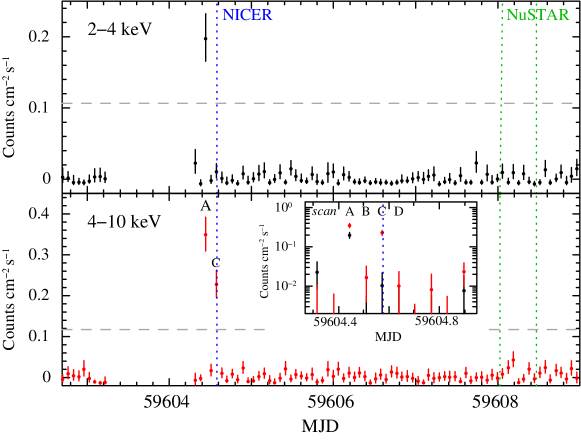
Figure 2 shows the obtained 2–4 keV and 4–10 keV light curves from the 2 days before to the 5 days after the first detection. The data gap from MJD 59603.2 to 59604.3 corresponds to the period when the source position was shadowed by the frame structure in the GSC detector444 Also see the light curve in the MAXI homepage http://maxi.riken.jp/pubdata/v7lrkn/J0709-161/. . After the data gap, there was no significant flux in the two scans. Then, the first X-ray activity was detected in the scan transit at UT 10:42 (MJD 59604.446, Scan-A). The source count rates averaged over the scan transit were counts cm-2 s-1 (180 mCrab) in 2–4 keV and counts cm-2 s-1 (300 mCrab) in 4–10 keV. In the next scan transit at UT 12:15 (MJD 59604.510, Scan-B), there was no significant flux over the background with the upper limits of 0.005 counts cm-2 s-1 (5 mCrab) in 2–4 keV and 0.032 counts cm-2 s-1 (27 mCrab) in 4–10 keV. In the other next scan transit at UT 13:48 (MJD 59604.575, Scan-C), the source was detected again but only in the 4–10 keV band with counts cm-2 s-1 (200 mCrab). Those mean that the source intensity changed every scan transit by a factor of and also the spectrum changed. In the following scans after MJD 59604.639 (Scan-D), the source activity went down below the GSC sensitivity limit.
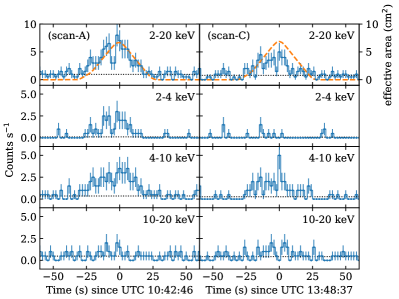
We then investigated the source variability within each scan transit of Scan-A and Scan-C, which include significant source photons. Figure 3 shows count rate variations during Scan-A and Scan-C, compared with the effective-area variations for the source position and the backgrounds estimated from the data in the adjacent source-free region. In Scan-A, the 2–20 keV count rate roughly traces the effective-area variation, indicating that the photon flux was approximately constant during the scan transit. However, at the middle of the transit, a dip-like structure lasting for s is clearly seen. We fitted the data around the dip with a constant-flux model, i.e. a normalized effective-area curve plus background. The result gives Cash statistic (C-stat; Cash (1979)) for 3 degrees of freedom (d.o.f), meaning that the constant model is rejected with a confidence of %. In Scan-C, the 4–10 keV count rate shows a sharp peak at the center of the scan. We performed the model fit same as in Scan-A and obtained the similar result that the constant-flux model is rejected with a confidence of %. These results suggest the source has a rapid time variability on time scales of a few seconds or less.
We also investigated the past source activity from the beginning of the MAXI in-orbit operation in 2009 August. At the distance of from the refined MAXI J0709 position, another X-ray source, 3MAXI J0708-155, was reported in the 7-year MAXI/GSC source catalog (Hori et al., 2018). There, the object is identified as the Blazar, PKS 0706-15. Although this nearby X-ray object can be distinguished from MAXI J0709 with the MAXI/GSC position accuracy (), the PSFs of these two objects have an overlap, which causes the source confusion. We carefully estimate the amount of the possible confusion and confirmed that MAXI J0709 had not shown any significance () flaring activity until the present event.
2.2 X-ray spectra of two flaring events
Next, we analyzed GSC energy spectra in Scan-A and Scan-C in detail. Source spectra were extracted from a circular region within from the source position. To avoid high background area near the edge of the detector in GSC_4 (figure 1), background spectra were extracted from the overlap region between an annulus of inner and outer radii of and , and a rectangle along the scan direction, both centered at the source position. These source and background regions are illustrated in figure 1. We confirmed that background subtracted spectra were consistent between GSC_4 and GSC_5, and then added them into GSC_4GSC_5 spectra.
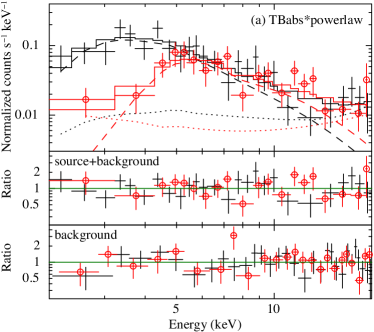
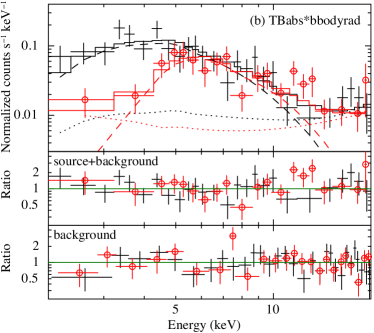
Figure 4 shows the obtained source-region spectra in Scan-A and Scan-C. As expected from the light curves in figure 2, the Scan-C spectrum has a lower-energy cutoff below 4 keV. We performed model fitting on XSPEC version 12.11.1 (Arnaud, 1996) employing the C-statistic method. The energy response matrix for each data was calculated with mxgrmfgen included in HEASoft. Also, spectral data were binned so that each bin contains at least one event. We first checked that background spectra were well represented by a two-powerlaw model. Then, we fitted source-region spectra including backgrounds and background spectra simultaneously to determine the source spectral model.
Firstly, we fitted each of Scan-A and Scan-C spectra with a power-law with an interstellar-medium (ISM) absorption. We hereafter employed the Tuebingen-Boulder ISM absorption model (TBabs) with the solar abundances provided by Wilms et al. (2000). Both fits to the Scan-A and Scan-C spectra were acceptable. Table 1 summarizes the best-fit model parameters. While the power-law photon indices, in Scan-A and in Scan-C, are consistent within the errors, the absorption column densities, cm-2 in Scan-A and cm-2 in Scan-C, are significantly different. The value in Scan-A is larger than the Galactic density, cm-2, in the source direction (HI4PI Collaboration et al., 2016). We then fitted the two spectra with a common simultaneously. The fit was accepted similarly, and the best-fit was obtained. In this case, the absorption-corrected 2–10 keV fluxes are consistent between Scan-A and Scan-C at erg cm-2 s-1.
We also fitted the two spectra with a blackbody model (bbodyrad) with an interstellar absorption. The fits were acceptable in both Scan-A and Scan-C, as in the same way as the fits with a powerlaw model. The obtained model parameters are summarized in table 1. There, the blackbody model normalizations are given by a source radius . of Scan-A was constrained only by the upper limit ( cm-2). Although the blackbody temperatures, keV in Scan-A and keV in Scan-C, were slightly different, we tried a simultaneous fit to the two spectra with a common . The fit was still acceptable and the best-fit keV was obtained.
| Model: TBabs*powerlaw | ||
|---|---|---|
| Parameter | Scan-A | Scan-C |
| ( cm-2) | ||
| a | ||
| b | ||
| C-stat/d.o.f | 202/267 | 177/210 |
| ( cm-2) | ||
| a | ||
| b | ||
| C-stat/d.o.f | 379/478 | |
| Model: TBabs*bbodyrad | ||
| Parameter | Scan-A | Scan-C |
| ( cm-2) | ||
| (keV) | ||
| c (km) | ||
| a | ||
| b | ||
| C-stat/d.o.f | 202/267 | 179/210 |
| ( cm-2) | ||
| (keV) | ||
| c (km) | ||
| a | ||
| b | ||
| C-stat/d.o.f | 385/478 | |
-
a
Absorbed 2–10 keV flux in erg cm-2 s-1
-
b
Unabsorbed 2–10 keV flux in erg cm-2 s-1
-
c
Blackbody radius in km. Distance of 3 kpc assumed.
3 NuSTAR observation and data analysis
The NuSTAR observation of MAXI J0709 was carried out in 2022 January 29 UT 00:21–11:21 (OBSID: 90801304002), with a net exposure of 18 ks. We performed data analysis using NuSTAR Data Analysis Software nustardas version 2.1.1 included in HEASoft version 6.29 and the CALDB version 20220215, following the NuSTAR Data Analysis Quick Start Guide555https://heasarc.gsfc.nasa.gov/docs/nustar/analysis/nustar_quickstart_guide.pdf and the NuSTAR Data Analysis Software Guide666https://heasarc.gsfc.nasa.gov/docs/nustar/analysis/nustar_swguide.pdf. The unfiltered event files were first reprocessed by nupipeline. According to the recommendations given by the NuSTAR team, we screened high background-rate data taken during the South Atlantic Anomaly (SAA) passages by combining options SAAMODEoptimized and TENTACLEyes with the default SAA calculation option (saacalc3). The resultant cleaned event files were used to obtain the image, light curve and time-averaged spectrum.
3.1 Localization and optical identification with NuSTAR image
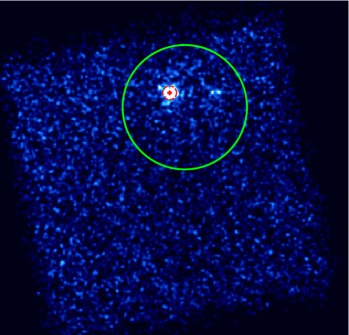
We produced the NuSTAR images from the cleaned event files using nuproducts. In figure 5 (left panel), we show the NuSTAR 3–20 keV image. A significant point source was solely detected within the error circle (radius ) of the MAXI J0709 position determined by the NICER observation (Iwakiri et al., 2022). To determine the accurate source position, we performed image fit using sherpa included in the Chandra Interactive Analysis of Observation (ciao; version 4.14). To improve photon statistics, images of FPMA and FPMB are combined and binned by 22 pixels. The obtained image in the region around the count peak was then fitted with a model consisting of a 2-dimensional (2-D) Gaussian function for the target point source and a flat surface for the background. There, we employed the Cash statistics. Because the ellipticity of the 2-D Gaussian was not significantly detected, the ellipticity parameter was fixed at 0 (circular). The best-fit model parameters are the source position (, )(J2000) (\timeform7h09m37.1s, \timeform-16D05’47”) with errors of , and the full width at half maximum (FWHM) of , where errors include only statistic uncertainties. The systematic error of the NuSTAR position accuracy is estimated at , which slightly depends on the source brightness (Lansbury et al., 2017).
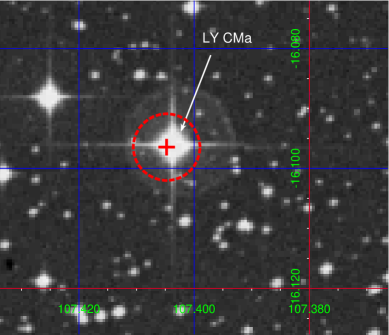
Comparing the obtained NuSTAR image with the DSS (Original Digitized Sky Survey) optical image provided via the Skyview website777http://skyview.gsfc.nasa.gov in the same region (the right panel of figure 5), we identified a possible optical counterpart, LY CMa (also known as HD 54786), which is identified as a Be star (Chojnowski et al., 2015) with a spectral type of B1.5I(b), i.e. B supergiant (Houk & Smith-Moore, 1988). By Gaia Early Data Release 3, its celestial position (, )(J2000) (\timeform7h09m36.9791095248s, \timeform-16D05’46.801897476”), and distance kpc are well determined (Gaia Collaboration et al., 2016, 2020; Bailer-Jones et al., 2021). The position is only \timeform1.8” from the NuSTAR best-fit parameters. The direction and distance suggest that the object locates on the Perseus Arm, a major spiral arm of our Galaxy.
3.2 Light curve
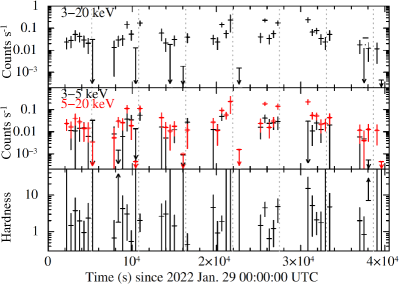
We produced the NuSTAR light curves in 3 energy bands, 3–20 keV, 3–5 keV, and 5–20 keV, with nuproducts. Source data were extracted from a circular region with a radius of centered at the LY CMa position, and background data were extracted from another circle with a radius of in a source-free region. In this step, a barycentric time correction was applied to event files, assuming the source position of LY CMa. The data of FPMA and FPMB were combined with the ftool lcmath. In figure 6 we plotted the obtained light curves in the 3 energy bands and the 5–20 keV to 3–5 keV hardness ratio, with 512 s bins. The 3–20 keV light curve shows flux variation by factor of on timescales of s. The middle panel suggests that the variation is larger in the higher band (i.e., the source becomes harder with increasing flux), although it is not clear in the hardness-ratio variation.
3.3 Pulsation search
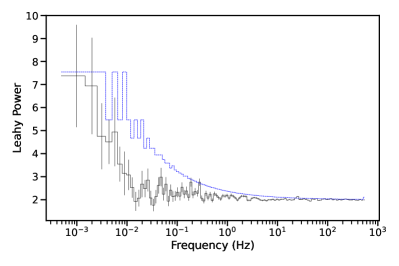
In order to search for coherent pulsations, we produced a power density spectrum (PDS) from the FPMAFPMB data, which is shown in figure 7. We first barycenter corrected the time of arrival for each photon using the source position as determined using the automatic centroiding function in DS9 (Joye & Mandel, 2003). We used JPL ephemeris DE-430 and NuSTAR clockfile v138. We extracted events with energy 3-20 keV using a source region with radius . Next we used the Python package Stingray (Huppenkothen et al., 2019) to produce the Frequency Amplitude Difference-corrected PDS (Bachetti & Huppenkothen, 2018), which corrects for timing effects due to deadtime. We specified a time resolution of s and a light-curve segment size of 1024 s, resulting in 13 individual PDS, which we averaged to produce the PDS shown. The PDS has been rebinned logarithmically for clarity. We also calculated the detection level per logarithmic frequency bin using the formalism described in Leahy et al. (1983), which we show as a blue dashed line.
We did not detect any periodicity significantly, but we note that our timing analysis is severely limited due to a small number of photons ( total). As such we cannot rule out the presence of pulsations or other timing signatures.
3.4 Time-averaged spectrum
Figure 8 shows the time-averaged NuSTAR spectrum, which was extracted with nuproducts using the same source and background regions as in the light curve analysis (section 3.2). The FPMA and FPMB spectra were combined with the ftool addspec to improve statistics, and binned so that each bin contains at least one count. We confirmed that the results did not change even if the data of FPMA and FPMB were analyzed separately.
We fitted the obtained spectrum with an absorbed power-law model (TBabs*powerlaw) on XSPEC employing W statistic. The results showed the fit statistic for 184 d.o.f. and the best-fit . was constrained only by the upper limit, cm-2, which is consistent with the result of the MAXI/GSC Scan-A spectrum (table 1 in section 2.2). From the best-fit model, the absorbed and absorption-corrected 2–10 keV fluxes were estimated to be and erg cm-2 s-1, respectively. These spectral parameters are consistent with those given by Bhattacharyya et al. (2022) which utilized the same NuSTAR data.
Although there is no emission-line feature in the NuSTAR spectrum, we tested the possibility of a narrow iron-K emission line. We added a Gaussian function with a fixed centroid of 6.4 keV and a fixed width of 0 eV to the power-law model, and then fit it to the data. As the result, the 90 % upper limit on the iron-K line flux was estimated to be photons cm-2 s-1, which corresponds to the equivalent width (EW) of 0.6 keV.

4 Swift observation and upper limit
A ToO observation of the Neil Gehrels Swift Observatory (Gehrels et al., 2004) was carried out on 2022 February 23 (MJD 59634.62), 30 days after the discovery, with a total exposure time of 989 s. No X-ray source was detected with the upper limit of 0.008 XRT counts s-1 at the position of LM CMa. Assuming spectral parameters given in table 1, this provides an upper limit on the flux of erg cm-2 s-1 (0.3–10 keV) for the Scan-A parameters, and erg cm-2 s-1 (0.3–10 keV) for the Scan-B parameters, where the flux is not corrected for absorption. These upper limits are consistent with the detected flux by NuSTAR.
5 eROSITA upper limits on the past activity
The Spectrum-Roentgen-Gamma (Spektr-RG, SRG) X-ray observatory (Sunyaev et al., 2021) has been performing an all-sky survey since 2019 December. The satellite carries two kinds of X-ray telescopes, extended ROentogen Survey with an Imaging Telescope Array (eROSITA; Predehl et al. (2021)), and Mikhail Pavllinsky Astronomical Roentgen Telescope (ART-XC; Pavlinsky et al. (2021)), which cover 0.2–8 keV and 4–30 keV energy bands, respectively. The eROSITA all-sky survey (eRASS) has been carried out by consecutive scans of the entire sky, each of which is completed by six months. It currently archives the best sensitivity among all-sky X-ray surveys that have ever been performed.
The sky position of MAXI J0709 was covered by eROSITA in the past four eRASSs as listed in Table 2. All of eROSITA data are calibrated and cleaned using the pipeline version 946 of the eROSITA Science Analysis Software System (eSASS, Brunner et al. (2022)). No significant X-ray emission at the position of LY CMa was detected in either the individual eRASS or the combined dataset. We estimated the 3- upper limit of erg cm-2 s-1 in 2–10 keV band using all the eRASS data and assuming the typical power-law spectrum of and the interstellar absorption corresponding to the Galactic density cm-2.
| #a | Start time | End time | |
|---|---|---|---|
| 1 | 2020-04-17 09:34:14 | 2020-04-18 01:34:44 | 173 |
| 2 | 2020-10-20 08:25:17 | 2020-10-21 00:25:41 | 156 |
| 3 | 2021-04-18 02:34:27 | 2021-04-19 06:34:33 | 234 |
| 4 | 2021-10-20 13:25:24 | 2021-10-21 13:25:39 | 219 |
-
a
eRASS survey number.
-
b
Exposure time (s).
6 Optical spectroscopy with SCAT
The Spectroscopic Chuo university Astronomical Telescope (SCAT) is a 355-mm diameter optical telescope equipped with an ATIK 460EX CCD camera and a Shelyak Alpy 600 spectrometer, located at the Chuo Univeristy Korakuen campus, Tokyo, Japan (Kawai et al., 2022). The spectral resolution is R600.
The SCAT observation of LY CMa was carried out on 2022 January 28 from UT 11:32 to 14:48 (approximately 3 days after the MAXI trigger) with a net exposure of 8610 s. The result showed a strong H emission line clearly. The FWHM of the H line was 19 Å, which is significantly larger than that of the Ne line in the calibration lamp (FWHM Å). Next, we estimated the line EW. To determine the continuum level, we fitted the observed spectrum excluding the H-line range with a linear function. Figure 9 shows the line profile normalized by the best-fit continuum model, where the H-line range was assumed to be from 6520 Å to 6605 Å. By integrating the profile, the EW was estimated to be Å. It is consistent with the result of the Foligno Observatory low-resolution (R50) spectrum taken on the same day (Nesci, 2022). We repeated the EW calculation by shifting the assumed H-line range, and found that the obtained EW value has an uncertainty of %.

7 Discussion
7.1 Summary of MAXI J0709-159 activities with past and follow-up observations
We here summarize long-term activities of MAXI J0709 identified with the past and follow-up observations in the present analysis. Based on the results, we consider the nature of the new X-ray object in the next section.
The new transient MAXI J0709 was first discovered by the MAXI GSC all-sky survey on 2022 January 25. As seen in figure 2, significant X-rays were detected only in the two GSC scans, Scan-A (UT 10:42) and Scan-C (UT 14:48). In both scans, it showed flare-like time variabilities in a time scale of a few seconds (figure 3) and the 2–10 keV flux reached erg cm-2 s-1. At Scan-B (UT 12:15) and after the Scan-C (UT 15:21), the source has not been detected with the GSC sensitivity limit of 80 mCrab ( erg cm-2 s-1 in 2–10 keV) per scan (Negoro et al., 2016). Therefore, the intensity swings between every adjacent scans from Scan-A to Scan-D exceed a factor of .
The NICER and NuSTAR follow-up observations successfully identified the new transient with a new X-ray source, whose position is consistent LY CMa (figure 5). When the NICER observed it at 6 minutes after the MAXI Scan-C, the X-ray flux became about 10 mCrab (in 0.2-12 keV), which is of that observed in Scan-C. When the NuSTAR identified the new object on January 29, 4 days after the MAXI detections, the X-ray flux became relatively stable at around erg cm-2 s-1. This means that the X-ray intensity decreased by a factor of in the 3 days.
We investigated the past source activity using archival data. Until the first MAXI detection, the source had not been recognized in the MAXI GSC data for over 12 years. The upper limit on the average source flux is erg cm-2 s-1 (Hori et al., 2018). The object had not been recorded in any X-ray source catalog including ROSAT all-sky survey catalog (Boller et al., 2016). Also, eROSITA all-sky surveys which observed the MAXI J0709 position four times from 2020 to 2021, did not find significant X-ray source with the 3- upper limit of erg cm-2 s-1 (section 5), which is lower than the flux observed by NuSTAR. This suggests that the source activity at the NuSTAR observation was still higher than that before the discovery.
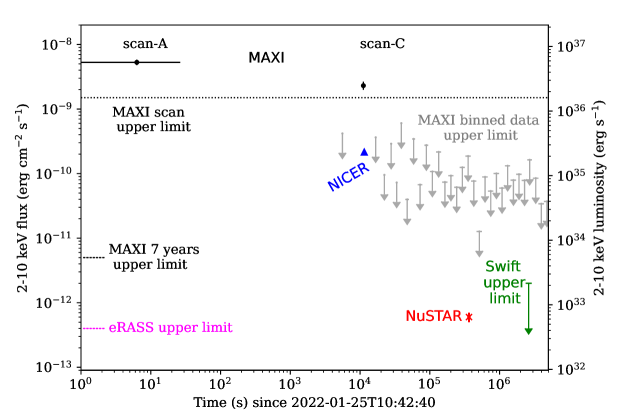
In figure 10, the long-term activities after the discovery of MAXI J0709 are summarized. The X-ray intensity variation clearly reveals that the activity declined at s ( hours). In the figure, the right-hand ordinate represents the luminosity calculated from the flux at the source distance of 3 kpc. The observed flux range of – erg cm-2 s-1 corresponds to – erg s-1 in the luminosity.
We also carried out an optical spectroscopic observation of the optical counterpart LY CMa on January 28, 3 days after the discovery, and then confirmed the H emission line (section 6) as reported in Nesci (2022). The EW of the H line was estimated to be Å with an uncertainty of %. Bhattacharyya et al. (2022) also performed optical follow-up observations and reported that the H EW was Å on February 2 and Å on February 3. The results suggest that the EW might change in these 3 days.
7.2 Classification of the new X-ray object in high-mass X-ray binaries
As discussed in the previous section and summarized in figure 10, the observed X-ray activity of MAXI J0709 is characterized by the initial flaring phase of hours with a rapid ( few seconds) variability reaching the peak luminosity erg s-1, and the following decay phase lasting for at least several days with a luminosity – erg s-1 and a moderate variation. The rapid variability naturally lead us an idea of X-ray binaries embedding compact objects, neutron stars or black holes, where the transient behavior can be explained by the change in the mass accretion onto the compact object. In the present MAXI J0709 case, the mass-donating stellar companion is identified with LY CMa, which has a spectral type of B1.5I(b) (Houk & Smith-Moore, 1988) and also the identification as Be star (Chojnowski et al., 2015). Hence, we consider the detail scenario to explain all the observed results in comparison with other high-mass X-ray binaries (HMXBs) that have been well studied.
The initial flaring behavior of the short duration ( several hours) and the rapid variability (in a time scale of a few seconds), agree well with the properties of Supergiant Fast X-ray Transients (SFXTs), a possible subclass of HMXBs that consist of OB supergiants and neutron stars showing sporadic short-duration ( several hours) outbursts (Sguera et al. (2006); Bozzo et al. (2015); Sidoli & Paizis (2018); review in Kretschmar et al. (2019)). The observed luminosity range from to erg s-1 agree with those from their quiescent value to the flaring peak. The X-ray spectra fitted with a power law of in both MAXI and NuSTAR data are also typical as SFXTs which have power-law spectra with (Pradhan et al., 2018).
During the initial flaring phase, the X-ray spectrum changed dramatically so that changed from to cm-2 in hours (figure 4). The cm-2 at the MAXI GSC Scan-C is significantly higher than the Galactic density cm-2, and also comparable to the highest among those of SFXTs that have ever been reported (Pradhan et al., 2018). So far, a similar spectral change has been observed in IGR J18410-0535, and it was explained by a scenario that the compact object (neutron star) just plunged into a dense clump in the circumstellar medium (Bozzo et al., 2011). The present result can be considered similarly.
Also, iron-K line was not significantly detected in either MAXI or NuSTAR spectrum. From the NuSTAR data, the upper limit on the equivalent width keV was estimated. In general, X-ray spectra of the SFXTs have lower and lower than those of the classical supergiant HMXBs with persistent X-ray activities (Giménez-García et al., 2015; Pradhan et al., 2018). This implies that the SFXTs have more sparse and clumpy circumstellar media than the classical supergiant HMXBs. The present results support the scenario.
To explain the short duration (several hours) and the extremely large dynamic range (–) from the quiescence to the peak in the SFXT outbursts, some mechanism to inhibit accretion such as magnetic and/or centrifugal barriers (Grebenev & Sunyaev, 2007; Bozzo et al., 2008) are required. If compact objects in SFXTs are magnetized neutron stars, observed X-ray variations may relate to the neutron star rotation. In fact, coherent pulsations were detected in several SFXTs. We performed the period search with the NuSTAR data, but could not find a significant periodicity (section 3.3). The results are consistent with the most of major well-known SFXTs, on which the periodicity have not been detected even though deep observations were carried out (e.g. Bozzo et al. (2010); Ferrigno et al. (2020)). This may indicate that the neutron stars have very long spin periods and the X-ray variations only comes form the magnetic and centrifugal gating mechanism (Bozzo et al., 2008), or the accretions are in a quasi-spherical accretion regime (Shakura et al., 2012).
7.3 Is MAXI J0709-159 an evolved Be Fast X-ray Transient ?
So far, we have discussed the nature of MAXI J0709 based on the X-ray results that agree well with the typical SFXTs. Meanwhile, the optical counterpart LY CMa is also identified as Be star (Chojnowski et al., 2015). In fact, optical follow-up observations confirmed the broad H line, which indicates the Be circumstellar disk (section 6). Bhattacharyya et al. (2022) proposed that LY CMa would be an evolved Be star located between main sequence stars and supergiants on the optical color-magnitude diagram. If it is so, MAXI J0709 should have an intermediate character between Be X-ray binaries (BeXBs) and supergiant X-ray binaries (sgXBs).
BeXBs usually cause outbursts lasting for several weeks (type-I) to a few months (type-II), according to the interaction between the neutron-star magnetosphere and the Be disk (e.g. Reig (2011); Sugizaki et al. (2017)). The behavior is quite different from the present MAXI J0709 results. However, a few BeXBs, such as X Persei, are known to show short time-scale variabilities like flares (Delgado-Martí et al., 2001; Acuner et al., 2014). MAXI J0709 could be considered as its extreme case.
Recently, another new subclass of HMXBs involving supergiant B[e] (sgB[e]) stars as mass-donating companions, is getting a hot topic (e.g. Kraus (2019)). The sgB[e] stars are thought to accompany dense, dusty disks. The two members of this subclass, CI Cam (Bartlett et al., 2019) and IGR J163184848 (Fortin et al., 2020), are known to exhibit extremely high ( cm-2) and variable on their persistent X-ray activities. Although LY CMa is not definitely categorized into sgB[e], the thick and variable X-ray absorption feature in these two objects is quite similar with that observed in MAXI J0709 (section 2.2). This naturally induces an idea that some sgB[e] HMXBs may behave like SFXT. A candidate of such objects, namely sgB[e]FXTs, has been already reported (Sidoli et al., 2022). Further observations of LY CMa would give us useful hints about possible relations among these HMXB subclasses.
8 Conclusion
On 2022 January 25, MAXI discovered the new bright X-ray transient MAXI J0709-159 lasting for hours in the constellation Canis Majoris. Prompt follow-up observations with NICER and NuSTAR confirmed the new X-ray object and refined the source position with the accuracy. Then, the optical counterpart was identified with LY CMa, which has been identified as B supergiant and also Be star. Detail analysis of MAXI and NuSTAR data revealed the characteristic X-ray outburst represented by the short duration ( hours), the rapid ( a few seconds) variability accompanied with the spectral change, and large luminosity swing from the quiescence ( erg s-1) to the flare peak ( erg s-1). These features agree well with the typical SFXTs. The spectral change during the short outburst period suggests that the increased from to cm-2, which can be explained by a scenario that the compact object (neutron star) just plunged into a dense clump in the circumstellar medium. Meanwhile, the optical spectroscopic observation of LY CMa reveals the broad H emission line suggesting the existence of the circumstellar Be disk. However, the observed X-ray behavior agrees with the SFXT, i.e. supergiant X-ray binaries rather than Be X-ray binaries. Thus, LY CMa is surrounded by complex circumstellar medium including dense clumps. These facts suggests that the object would be classified into the intermediate position between these HMXB subclasses, namely evolved Be Fast X-ray Transient.
The authors thank the MAXI team members for their dedicated work on the mission operation. M. Sugizaki acknowledges support from the Chinese Academy of Sciences (CAS) President’s International Fellowship Initiative (PIFI) (grant No. 2020FSM004). Part of this work was financially supported by Grants-in-Aid for Scientific Research 19K14762 (M. Shidatsu) and 21K03620 (H. Negoro) from the Ministry of Education, Culture, Sports, Science and Technology (MEXT) of Japan. We thank the NuSTAR and Swift operation teams for performing the ToO observations, and Brian Grefenstette for the quick look analysis of the NuSTAR data. This work is based on data from eROSITA, the soft X-ray instrument aboard SRG, a joint Russian-German science mission supported by the Russian Space Agency (Roskosmos), in the interests of the Russian Academy of Sciences represented by its Space Research Institute (IKI), and the Deutsches Zentrum für Luft- und Raumfahrt (DLR). The SRG spacecraft was built by Lavochkin Association (NPOL) and its subcontractors, and is operated by NPOL with support from the Max Planck Institute for Extraterrestrial Physics (MPE). The development and construction of the eROSITA X-ray instrument was led by MPE, with contributions from the Dr. Karl Remeis Observatory Bamberg & ECAP (FAU Erlangen-Nuernberg), the University of Hamburg Observatory, the Leibniz Institute for Astrophysics Potsdam (AIP), and the Institute for Astronomy and Astrophysics of the University of Tübingen, with the support of DLR and the Max Planck Society. The Argelander Institute for Astronomy of the University of Bonn and the Ludwig Maximilians Universität Munich also participated in the science preparation for eROSITA. This work has also made use of data from the European Space Agency (ESA) mission Gaia (https://www.cosmos.esa.int/gaia), processed by the Gaia Data Processing and Analysis Consortium (DPAC, https://www.cosmos.esa.int/web/gaia/dpac/consortium). Funding for the DPAC has been provided by national institutions, in particular the institutions participating in the Gaia Multilateral Agreement. The Digitized Sky Surveys were produced at the Space Telescope Science Institute under U.S. Government grant NAG W-2166. The images of these surveys are based on photographic data obtained using the Oschin Schmidt Telescope on Palomar Mountain and the UK Schmidt Telescope. The plates were processed into the present compressed digital form with the permission of these institutions. The National Geographic Society - Palomar Observatory Sky Atlas (POSS-I) was made by the California Institute of Technology with grants from the National Geographic Society. The Second Palomar Observatory Sky Survey (POSS-II) was made by the California Institute of Technology with funds from the National Science Foundation, the National Geographic Society, the Sloan Foundation, the Samuel Oschin Foundation, and the Eastman Kodak Corporation. The Oschin Schmidt Telescope is operated by the California Institute of Technology and Palomar Observatory. The UK Schmidt Telescope was operated by the Royal Observatory Edinburgh, with funding from the UK Science and Engineering Research Council (later the UK Particle Physics and Astronomy Research Council), until 1988 June, and thereafter by the Anglo-Australian Observatory. The blue plates of the southern Sky Atlas and its Equatorial Extension (together known as the SERC-J), as well as the Equatorial Red (ER), and the Second Epoch [red] Survey (SES) were all taken with the UK Schmidt. Supplemental funding for sky-survey work at the ST ScI is provided by the European Southern Observatory.
References
- Acuner et al. (2014) Acuner, Z., İnam, S. Ç., Şahiner, Ş., et al. 2014, MNRAS, 444, 457. doi:10.1093/mnras/stu1351
- Arnaud (1996) Arnaud, K. A. 1996, in ASP Conf. Ser., 101, Astronomical Data Analysis Software and Systems V, ed. G. H. Jacoby & J. Barnes (San Francisco, CA: ASP), 17
- Bachetti & Huppenkothen (2018) Bachetti, M. & Huppenkothen, D. 2018, ApJ, 853, L21. doi:10.3847/2041-8213/aaa83b
- Bailer-Jones et al. (2021) Bailer-Jones, C. A. L., Rybizki, J., Fouesneau, M., et al. 2021, AJ, 161, 147. doi:10.3847/1538-3881/abd806
- Bartlett et al. (2019) Bartlett, E. S., Clark, J. S., & Negueruela, I. 2019, A&A, 622, A93. doi:10.1051/0004-6361/201834315
- Bhattacharyya et al. (2022) Bhattacharyya, S., Mathew, B., Ezhikode, S. H., et al. 2022, arXiv:2206.04473
- Boller et al. (2016) Boller, T., Freyberg, M. J., Trümper, J., et al. 2016, A&A, 588, A103. doi:10.1051/0004-6361/201525648
- Bozzo et al. (2008) Bozzo, E., Falanga, M., & Stella, L. 2008, ApJ, 683, 1031. doi:10.1086/589990
- Bozzo et al. (2010) Bozzo, E., Stella, L., Ferrigno, C., et al. 2010, A&A, 519, A6. doi:10.1051/0004-6361/201014095
- Bozzo et al. (2011) Bozzo, E., Giunta, A., Cusumano, G., et al. 2011, A&A, 531, A130. doi:10.1051/0004-6361/201116726
- Bozzo et al. (2015) Bozzo, E., Romano, P., Ducci, L., et al. 2015, Advances in Space Research, 55, 1255. doi:10.1016/j.asr.2014.11.012
- Brunner et al. (2022) Brunner, H., Liu, T., Lamer, G., et al. 2022, A&A, 661, A1. doi:10.1051/0004-6361/202141266
- Cash (1979) Cash, W. 1979, ApJ, 228, 939
- Chojnowski et al. (2015) Chojnowski, S. D., Whelan, D. G., Wisniewski, J. P., et al. 2015, AJ, 149, 7
- Delgado-Martí et al. (2001) Delgado-Martí, H., Levine, A. M., Pfahl, E., et al. 2001, ApJ, 546, 455. doi:10.1086/318236
- Ferrigno et al. (2020) Ferrigno, C., Bozzo, E., & Romano, P. 2020, A&A, 642, A73. doi:10.1051/0004-6361/202038278
- Fortin et al. (2020) Fortin, F., Chaty, S., & Sander, A. 2020, ApJ, 894, 86. doi:10.3847/1538-4357/ab881c
- Gaia Collaboration et al. (2016) Gaia Collaboration et al., 2016, A&A, 595, 1
- Gaia Collaboration et al. (2020) Gaia Collaboration et al., 2020, A&A, 649, 1
- Gehrels et al. (2004) Gehrels, N., Chincarini, G., Giommi, P., et al. 2004, ApJ, 611, 1005. doi:10.1086/422091
- Gendreau et al. (2012) Gendreau, K. C., Arzoumanian, Z., & Okajima, T. 2012, Proc. SPIE, 8443, 844313
- Giménez-García et al. (2015) Giménez-García, A., Torrejón, J. M., Eikmann, W., et al. 2015, A&A, 576, A108. doi:10.1051/0004-6361/201425004
- Grebenev & Sunyaev (2007) Grebenev, S. A. & Sunyaev, R. A. 2007, Astronomy Letters, 33, 149. doi:10.1134/S1063773707030024
- Harrison et al. (2013) Harrison, F. A., Craig, W. W., Christensen, F. E., et al. 2013, ApJ, 770, 103
- HI4PI Collaboration et al. (2016) HI4PI Collaboration, Ben Bekhti, N., Flöer, L., et al. 2016, A&A, 594, A116. doi:10.1051/0004-6361/201629178
- Houk & Smith-Moore (1988) Houk, N. & Smith-Moore, M. 1988, Michigan Catalogue of Two-dimensional Spectral Types for the HD Stars. Volume 4, Declinations -26°.0 to -12°.0.. N. Houk, M. Smith-Moore.Department of Astronomy, University of Michigan, Ann Arbor, MI 48109-1090, USA. 14+505 pp. Price US 25.00 (USA, Canada), US 28.00 (Foreign) (1988).
- Hori et al. (2018) Hori, T., Shidatsu, M., Ueda, Y., et al. 2018, ApJS, 235, 7. doi:10.3847/1538-4365/aaa89c
- Huppenkothen et al. (2019) Huppenkothen, D., Bachetti, M., Stevens, A. L., et al. 2019, ApJ, 881, 39. doi:10.3847/1538-4357/ab258d
- Iwakiri et al. (2022) Iwakiri, W., Gendreau, K., Arzoumanian, Z., et al. 2022, The Astronomer’s Telegram, 15181
- Joye & Mandel (2003) Joye, W. A. & Mandel, E. 2003, Astronomical Data Analysis Software and Systems XII, 295, 489
- Kawai et al. (2022) Kawai, H., Tsuboi, Y., Iwakiri, W. B., et al. 2022, PASJ, 74, 477. doi:10.1093/pasj/psac008
- Kobayashi et al. (2022) Kobayashi, K., Negoro, H., Sugita, S., et al. 2022, The Astronomer’s Telegram, 15188
- Kraus (2019) Kraus, M. 2019, Galaxies, 7, 83. doi:10.3390/galaxies7040083
- Kretschmar et al. (2019) Kretschmar, P., Fürst, F., Sidoli, L., et al. 2019, New A Rev., 86, 101546. doi:10.1016/j.newar.2020.101546
- Lansbury et al. (2017) Lansbury, G. B., Stern, D., Aird, J., et al. 2017, ApJ, 836, 99
- Leahy et al. (1983) Leahy, D. A., Darbro, W., Elsner, R. F., et al. 1983, ApJ, 266, 160. doi:10.1086/160766
- Matsuoka et al. (2009) Matsuoka, M., et al.2009, PASJ, 61, 999
- Mihara et al. (2011) Mihara, T., et al. 2011, PASJ, 63, S623
- Mihara et al. (2022) Mihara, T., Tsunemi, H. & Negoro, H. 2022, ”MAXI: Monitor of All-sky X-ray Image” in Handbook of X-ray and Gamma-ray Astrophysics ed. C. Bambi & A. Santangelo, arXiv:2206.01505
- Morii et al. (2013) Morii, M., Tomida, H., Kimura, M., et al. 2013, ApJ, 779, 118. doi:10.1088/0004-637X/779/2/118
- Morii et al. (2016) Morii, M., Yamaoka, H., Mihara, T., et al. 2016, PASJ, 68, S11. doi:10.1093/pasj/psw007
- Negoro et al. (2016) Negoro, H., Kohama, M., Serino, M., et al. 2016, PASJ, 68, S1. doi:10.1093/pasj/psw016
- Negoro et al. (2022) Negoro, H., Mihara, T., Pike, S., et al. 2022, The Astronomer’s Telegram, 15193
- Nesci (2022) Nesci, R. 2022, The Astronomer’s Telegram, 15194
- Pavlinsky et al. (2021) Pavlinsky, M., Tkachenko, A., Levin, V., et al. 2021, A&A, 650, A42. doi:10.1051/0004-6361/202040265
- Pike et al. (2022) Pike, S. N., Negoro, H., Tomsick, J. A., et al. 2022, ApJ, 927, 190. doi:10.3847/1538-4357/ac5258
- Pradhan et al. (2018) Pradhan, P., Bozzo, E., & Paul, B. 2018, A&A, 610, A50. doi:10.1051/0004-6361/201731487
- Predehl et al. (2021) Predehl, P., Andritschke, R., Arefiev, V., et al. 2021, A&A, 647, A1. doi:10.1051/0004-6361/202039313
- Reig (2011) Reig, P. 2011, Ap&SS, 332, 1
- Rhodes et al. (2022) Rhodes, L., van den Eijnden, J., Fender, R., et al. 2022, The Astronomer’s Telegram, 15209
- Serino et al. (2022) Serino, M., Negoro, H., Nakajima, M., et al. 2022, The Astronomer’s Telegram, 15178
- Sguera et al. (2006) Sguera, V., Bazzano, A., Bird, A. J., et al. 2006, ApJ, 646, 452. doi:10.1086/504827
- Shakura et al. (2012) Shakura, N., Postnov, K., Kochetkova, A., et al. 2012, MNRAS, 420, 216. doi:10.1111/j.1365-2966.2011.20026.x
- Sidoli & Paizis (2018) Sidoli, L. & Paizis, A. 2018, MNRAS, 481, 2779. doi:10.1093/mnras/sty2428
- Sidoli et al. (2022) Sidoli, L., Sguera, V., Esposito, P., et al. 2022, MNRAS, 512, 2929. doi:10.1093/mnras/stac691
- Sugizaki et al. (2011) Sugizaki, M., et al. 2011, PASJ, 63, S635
- Sugizaki et al. (2017) Sugizaki, M., Mihara, T., Nakajima, M., et al. 2017, PASJ, 69, 100.
- Sunyaev et al. (2021) Sunyaev, R., Arefiev, V., Babyshkin, V., et al. 2021, A&A, 656, A132. doi:10.1051/0004-6361/202141179
- Tsygankov et al. (2021) Tsygankov, S. S., Molkov, S. V., Doroshenko, V., et al. 2021, arXiv:2108.06365
- Wilms et al. (2000) Wilms, J., Allen, A., McCray, R. 2000, ApJ, 542, 914