Quiet Sun Center to Limb Variation of the Linear Polarization Observed by
CLASP2 Across the Mg II h & k Lines
Abstract
The CLASP2 (Chromospheric LAyer SpectroPolarimeter 2) sounding rocket mission was launched on 2019 April 11. CLASP2 measured the four Stokes parameters of the Mg ii & spectral region around 2800Å along a 200″ slit at three locations on the solar disk, achieving the first spatially and spectrally resolved observations of the solar polarization in this near ultraviolet region. The focus of the work presented here is the center-to-limb variation of the linear polarization across these resonance lines, which is produced by the scattering of anisotropic radiation in the solar atmosphere. The linear polarization signals of the Mg ii & lines are sensitive to the magnetic field from the low to the upper chromosphere through the Hanle and magneto-optical effects. We compare the observations to theoretical predictions from radiative transfer calculations in unmagnetized semi-empirical models, arguing that magnetic fields and horizontal inhomogeneities are needed to explain the observed polarization signals and spatial variations. This comparison is an important step in both validating and refining our understanding of the physical origin of these polarization signatures, and also in paving the way toward future space telescopes for probing the magnetic fields of the solar upper atmosphere via ultraviolet spectropolarimetry.
80 pt
1 Introduction
Our ability to acquire empirical information on the magnetic fields that permeate the atmospheres of the Sun and of other stars largely relies on two key components: the instrumentation needed to measure the polarization of the emitted spectral line radiation, and knowledge gained from theoretical modeling investigations which is required to interpret these spectropolarimetric observations. The advent of routine monitoring of solar surface magnetic fields using the polarization produced by the Zeeman effect in photospheric spectral lines catalyzed many new advances in solar physics. It is now a routine matter to estimate the magnetic field throughout the solar atmosphere by combining these photospheric measurements with extrapolation techniques based on simplifying assumptions of force-free fields, which is a reasonable approximation in the solar corona. However, the chromosphere is not a force-free region, and this leads to large errors in the extrapolated field (e.g., De Rosa et al., 2009). Routine measurements of the magnetic field at the base of the corona—or the top of the chromosphere—would significantly improve our ability to accurately model the coronal field and provide key information on the physics of the chromosphere and transition region. This magnetic field is the key missing measurement needed to advance our understanding of the solar atmosphere as it drives the mass and energy flow, and dominates the energy budget.
The CLASP (Chromospheric Lyman-Alpha Spectro-Polarimeter, Kobayashi et al., 2012; Kano et al., 2012) and CLASP2 (Chromospheric LAyer Spectro-Polarimeter 2, Narukage et al., 2016; Ishikawa et al., 2021) sounding rocket missions were developed to explore the possibility of mapping the magnetic field in the upper solar chromosphere by providing the first measurements of polarization in prominent ultraviolet (UV) lines. In 2015, the CLASP instrument measured the linear polarization of the hydrogen Lyman- line at Å (Kano et al., 2017) and of the Si iii resonance line at Å (Ishikawa et al., 2017)in a quiet region of the solar disk. In 2019, CLASP2 measured the linear and circular polarization of the Mg ii & doublet near Å in quiet and active regions of the solar disk (Figs. 1 & 2). The polarization observed in these lines is due to the combined action of anisotropic radiation pumping and the Hanle and Zeeman effects in the optically thick plasma of the solar chromosphere (for a review, see Trujillo Bueno et al., 2017).
Over the last few years, a number of theoretical investigations have enhanced our understanding of the physical mechanisms responsible for the polarization across the Mg ii & lines and its magnetic sensitivity (Belluzzi & Trujillo Bueno, 2012; Alsina Ballester et al., 2016; del Pino Alemán et al., 2016, 2020). The linear polarization—Stokes & —is controlled by the combined action of scattering processes and the Hanle and magneto-optical (MO) effects, while the circular polarization—Stokes —is dominated by the Zeeman effect.
In one-dimensional (1D) unmagnetized models of the solar atmosphere, the polarization is produced only by the scattering of anisotropic radiation, which produces broad 111As usual, the reference direction for is parallel to the nearest solar limb. profiles with a clear center-to-limb variation (CLV), and everywhere. The red line in Figure 3 shows this theoretical line profile near the limb. At the center of the Mg ii line (Fig. 3, A), whereas at the very center of the (intrinsically unpolarizable) line (Fig. 3, C). The Mg ii line near-wings have negative peaks (Fig. 3, B), with the blue negative peak deeper than the red one, while shows an antisymmetric feature in the near wings around the center of the line. Such near-wing features are produced by the joint action of partial frequency redistribution (PRD) and quantum-mechanical interference between the substates pertaining to the two upper levels of the Mg ii & lines (hereafter, -state interference). The combined action of these physical ingredients is also the cause of the predicted negative in the wing wavelengths between the & lines (Fig. 3, D), and of the large positive values expected for the far blue and red wings of the and lines (Fig. 3, E).
In 1D magnetized models of the solar atmosphere, the Hanle effect modifies the line-center and signals of the Mg ii line, while the and magneto-optical terms of the Stokes and transfer equations create wing signals and introduce magnetic sensitivity in the wings of both and (Alsina Ballester et al., 2016; del Pino Alemán et al., 2016, 2020). In contrast to 1D models, the plasma of the solar atmosphere is dynamic and inhomogeneous in both the horizontal and vertical directions, and the ensuing breaking of the axial symmetry of the incident radiation field at each point within the medium can produce changes in the and line-center and wing signals even in the absence of a magnetic field (e.g., Manso Sainz & Trujillo Bueno, 2011; Štěpán & Trujillo Bueno, 2016).
Very few observations of the solar Mg ii & polarization exist. A linear polarization dataset taken at different times close to the limb at 10 wavelengths in the far wings of the Mg ii & lines was obtained by the Ultraviolet Spectrometer and Polarimeter (UVSP; Woodgate et al., 1980) on board the Solar Maximum Mission (SMM; Bohlin et al., 1980). This dataset was useful to test the theoretical predictions of Auer et al. (1980) for the linear polarization in the far wings of the lines, namely positive signals in the far blue and red wings of the lines and negative in the wing between the lines (these predictions were obtained using the approximation of coherent scattering in the observer’s frame). The data were initially analyzed by Henze & Stenflo (1987), who found the strong positive signals that Auer et al. (1980) had estimated for the far blue and red wings of the & lines, respectively. Recently, a re-calibration of the same limb data has detected the expected negative signals between the & lines (Manso Sainz et al., 2019), the true physical origin of which is the joint action of PRD effects and -state interference (Belluzzi & Trujillo Bueno, 2012). Before CLASP2, this UVSP data was the only existing observation of the Mg ii far wings polarization, albeit at very low spectral and spatial resolution. The CLASP2 data are the first spectrally and spatially resolved polarization observations of this important line doublet for chromospheric plasma and magnetic field diagnostics; the CLASP2 spatial resolution is less than 2″ and the spectral resolution is 0.1 Å.
The CLASP sounding rocket, the precursor to CLASP2, measured the linear polarization around the hydrogen Ly- line at Å, with the radially oriented spectrograph’s slit extending from 20″ off the solar limb to 380″ on the solar disk (Kano et al., 2017). CLASP found a clear center-to-limb variation (CLV) in the near wings of the Ly- profile, in agreement with the theoretical predictions that included PRD effects and -state interference (Belluzzi et al., 2012). However, the data did not show any clear CLV at the center of the Ly- profile, which is also sensitive to the magnetic field of the chromosphere-corona transition region for fields between approximately 10 and 100 gauss via the Hanle effect. This lack of CLV in the line center contrasts with the clear CLV found there in 1D semi-empirical models of the solar chromosphere (Trujillo Bueno et al., 2011) and in a 3D model of an enhanced network region (Štěpán et al., 2015). Recently, Trujillo Bueno et al. (2018) applied a statistical approach to show that the lack of CLV at the center of the Ly- profile can be reproduced by increasing the geometrical complexity (corrugation of the transition region surface) of the 3D atmospheric model. Other chromospheric lines do show line-center CLV, such as the Ca ii K line (Holzreuter & Stenflo, 2007), but their line-center originates well below the transition region—much deeper than the center of Ly-.
The ultimate goal of the CLASP and CLASP2 missions is to obtain UV spectropolarimetric observations to infer the magnetic field in the upper chromosphere. The magnetic field modifies the spectral line polarization, and thus to extract the magnetic information it is important to understand how the polarization is modified by the presence of magnetic fields in different regions of the solar atmosphere. As mentioned above, recent theoretical work has led to significant advances in understanding the predicted polarization in the vicinity of the Mg ii & lines; CLASP2 has provided the first ever data with which to verify these new theoretical advances. We present here the first resolved observations of the CLV of the chromospheric Mg ii & linear polarization and compare these to theoretical predictions of the expected CLV in a semi-empirical model of the quiet solar atmosphere. These insights have resulted in a better understanding of the spectral line polarization produced by the solar chromosphere, and are an important part of our efforts towards the goal of measuring the chromospheric magnetic field.
2 CLASP2 Instrument, Flight, and Data Reduction
The details of the CLASP2 instrument can be found in Tsuzuki et al. (2020). CLASP2 re-uses most of the hardware from CLASP (Narukage et al., 2015), but there are a few significant changes. The cm aperture Cassegrain telescope feeds into the spectrograph section after the collected light goes through a half-wave plate (for the Ly- wavelength, Ishikawa et al., 2013). For CLASP2, the primary mirror of the telescope has been re-coated (Yoshida et al., 2018) and the grating completely changed, so that with the same CLASP wave plate, the dual-bandpass spectropolarimeter measures the four Stokes parameters across the Mg ii lines, while the slit-jaw imager maintains the same Ly- bandpass as in CLASP. A 196″ long slit sits behind a Polarization Modulation Unit (PMU, Ishikawa et al., 2015), which continuously rotates the wave plate. The light that passes through the slit hits the new grating in the spectrograph section which splits the light into two channels which are fed to two cameras (SP1 and SP2). The individual SP camera polarization analyzers are oriented orthogonal to each other. The linear polarizers just before the CCD (charge coupled device) cameras were also changed, and a re-imaging optic was also introduced to accommodate the change in wavelength from Ly- to Mg ii & using the same CCD cameras. In CLASP2, the period of the PMU was changed from 4.8 seconds per rotation to 3.2 seconds per rotation to accommodate the higher intensity of the Mg ii & lines.
CLASP2 was launched from White Sands Missile Range in New Mexico on April 11, 2019 at 16:51:00 UT and took science-quality data spanning m s. During its flight, three solar locations were targeted: disk center for calibration purposes ( sec, 16:52:52-16:53:07 UT), the edge of a strong-field plage region ( sec, 16:53:40-16:56:16 UT), and quiet sun at the limb ( sec 16:56:25-16:58:46 UT). The top panel in Figure 1 shows these locations superposed on an SDO/AIA (Solar Dynamics Observatory/Atmospheric Imaging Assembly, Lemen et al., 2012) 304 Å image. The slit is oriented , , and degrees counter-clock-wise from solar north in the three pointings respectively, less than from radial to where the slit crosses the solar limb. IRIS (Interface Region Imaging Spectrograph, De Pontieu et al., 2014) also took several co-observation raster scans. Shown in Figure 1 is a large dense 400-step limb context raster that overlays most of the CLASP2 slit (OBS 3620106078). The IRIS Raster time period is (19:06:11-19:40:37 UT), approximately two hours after the CLASP2 flight.
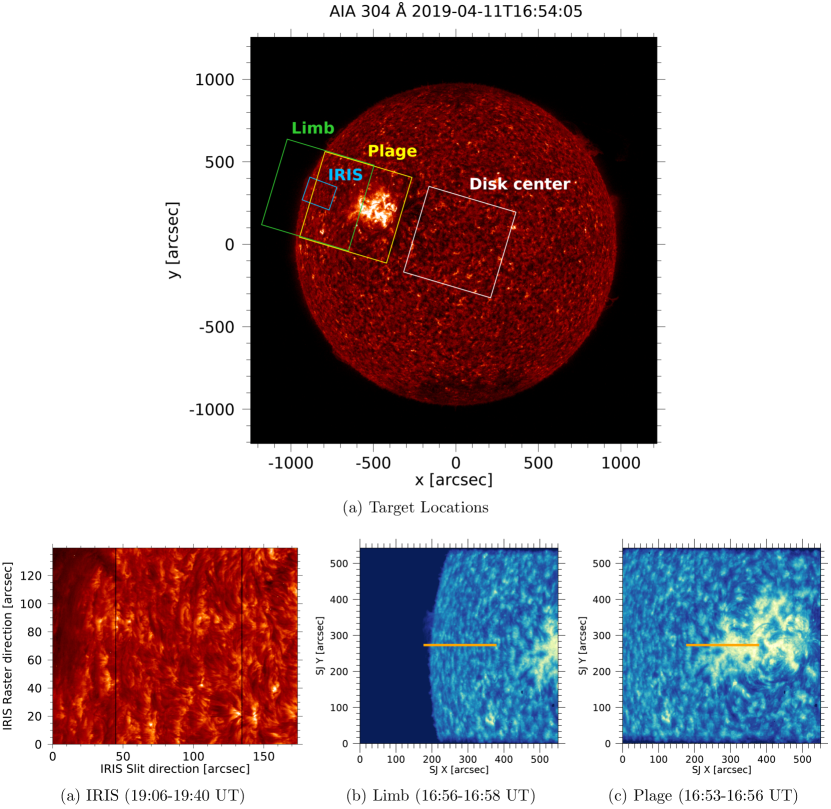
This paper focuses on the spectropolarimetric (SP) slit data from the 2nd and 3rd targets, Plage and Limb, respectively. All of the data taken at these targets has been calibrated, demodulated, and combined into a single measurement at each target to increase the signal-to-noise ratio. Coordinates were cross-correlated with AIA and IRIS. Calibration performed to the data presented here consists of bias and dark current removal, gain correction, frame transfer smear correction, demodulation, application of the polarization response matrix for cross-talk correction (Song et al. in prep.), combining SP1 and SP2, correction of +Q to parallel to the solar limb, and time averaging. The instrumental polarization was confirmed to be negligibly small (Song et al. in prep.) using data taken from the 1st target (Disk Center). In this paper we only take into account the photon noise as polarization error, which is the dominant error source. For each plot, we indicate the 3 error taking into account averaging in the time, spatial, and spectral directions as appropriate for the plot. The spectropolarimetric data presented here is a combination of both SP cameras. Individual SP images have an exposure time of ms and images are taken during a full PMU rotation period ( s). PMU rotations worth of data were averaged for the plage target and PMU rotations were averaged for the limb target. The calibrated SP data have a spectral plate scale of 0.04988 Å/pix and a spatial plate scale of 0.527 ″/pix. The resolutions are 0.1 Å, and 1.2″ respectively (Yoshida et al., 2018; Song et al., 2018).
To extend the range of the CLV beyond a single ″ slit length, we combined the data from the plage and limb targets. The slits are not exactly co-linear between those two pointings (see Figure 1), however the ″ offset (perpendicular to the slit direction) is small; together the two slits cover ″ (), with a break of ″ between the two pointings. All location coordinates here are presented as a distance from solar disk center. The slit data disk-ward of ″ samples a strong-field plage region, and these data are not used in the quiet sun CLV analysis that follows but are shown in the plots and figures for completeness. The analyses of the circular polarization data in the active region plage are presented in Ishikawa et al. (2021). An overview of the demodulated Mg ii signal at the plage and limb targets is shown in Figure 2, with the limb near the left edge of the plot. A piece of dust obscured a small portion (″) of the slit. The data under the dust has been excluded in this analysis (thin gaps at ″ and ″ in Figure 2).

3 Observational Results

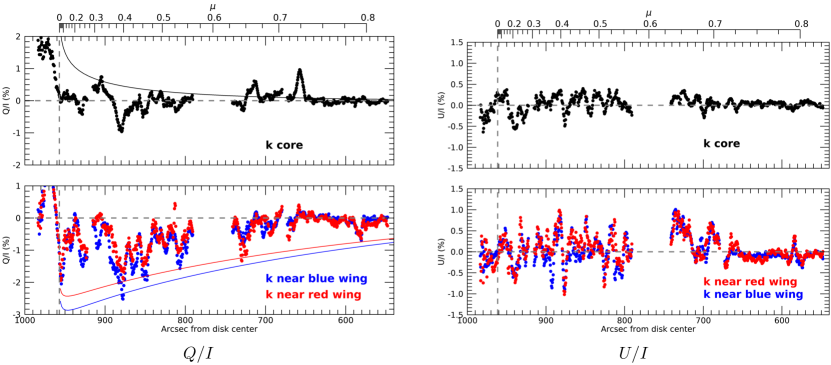
Figure 3 shows a comparison of the profile observed by CLASP2 near the limb () with the theoretical profile for the zero field case obtained by Belluzzi & Trujillo Bueno (2012) in the semi-empirical model C of Fontenla et al. (1993) (hereafter, FAL-C model). The theoretical profile includes PRD effects and -state interference when solving the radiative transfer problem. The combined action of these two physical ingredients results in significant signals in the near and far wings of the Mg ii & lines, which become stronger near the limb. As mentioned in §1, the presence of a magnetic field and/or the symmetry breaking produced by the horizontal inhomogeneities and macroscopic velocity gradients of the solar chromospheric plasma can have an impact on the and signals, and neither is included in the model results shown in Figure 3. Nevertheless, several key features in the theoretical profile corresponding to the unmagnetized FAL-C semi-empirical model (hereafter, the B=0 case) are clearly validated by the CLASP2 data (Figure 3):
- A:
-
B:
Negative troughs are measured on either side of the Mg ii line-center (the near wings), the blue wing is more negative than the red wing. The trough-peak-trough nature is caused by PRD effects and this lack of symmetry between the troughs results from the joint action of PRD and -state interference (Belluzzi & Trujillo Bueno, 2012).
-
C:
The Mg ii line-center observation has zero polarization with a low-amplitude anti-symmetric signal in the near wings. The center of the line is intrinsically unpolarizable because the upper and lower levels both have total angular momentum . The anti-symmetric signal is caused by the joint action of PRD and -state interference (Belluzzi & Trujillo Bueno, 2012).
-
D:
A negative trough observed between the Mg ii & centers is also produced by the combined action of PRD and -state interference in the B=0 case (Belluzzi & Trujillo Bueno, 2012). The addition of a magnetic field, as in the solar case, would lead to a weaker (and give rise to a signal) in this wavelength range due to magneto-optical effects (Alsina Ballester et al., 2016; del Pino Alemán et al., 2016, 2020).
- E:
The magnetic sensitivity of the signal at the center and wings of the lines is dominated by different effects, and the height of the surface is wavelength dependent. In the far wings, the Mg ii radiation samples plasma in the upper photosphere, at an altitude of a few hundred km above the continuum surface (see Figure 1 of Belluzzi & Trujillo Bueno, 2012). In the line-center of both & , the light comes from the upper chromosphere. This wide range of formation heights implies that the polarization across the Mg ii & lines is sensitive to solar magnetic fields from the upper photosphere up to close to the chromosphere-corona transition region (see also del Pino Alemán et al., 2020). The challenging task of determining the full stratification of the magnetic field from the intensity and polarization observed across the Mg ii resonance lines is out of the scope of this paper. The comparisons of the observed results to the theoretically predicted results for the FAL-C model nonetheless prove important theoretical predictions about the nature of the polarization and the solar chromosphere, and it suggests that the inclusion of magnetic fields in the FAL-C model is needed to explain the lower polarization amplitudes observed by CLASP2.
The linear polarization signal at the Mg ii line-center is modified by the Hanle effect in the presence of upper chromospheric magnetic fields with strengths of approximately 5 to 50 gauss (Belluzzi & Trujillo Bueno, 2012; Alsina Ballester et al., 2016; del Pino Alemán et al., 2016, 2020). Unlike the very clear CLV of the profile at the line-center calculated in 1D semi-empirical models of the solar atmosphere (solid curve in the top left panel of Fig. 4), CLASP2 shows a signal that has strong variations along the slit (dots in Fig. 4). Given that the linear polarization at the line center is modified by magnetic fields via the Hanle effect, this lack of a clear CLV may indicate that a fluctuating B in the upper chromosphere significantly modifies the CLV predicted by a simple plane parallel model atmosphere. The spatial scale of the fluctuation of Stokes along the slit is on the order of 10″, consistent with network/internetwork spacing which would correspond with field changes. However, the solar chromosphere is highly inhomogeneous and dynamic; the magnetic field is not the only cause of symmetry breaking capable of modifying the scattering line polarization. CLASP also did not observe any clear CLV at Ly- line center, which was shown to be consistent with 3D model atmospheres having a highly corrugated transition region surface (Trujillo Bueno et al., 2018).
The Mg ii blue and red near wings of the profile show a clear CLV between about ″ and ″, though this trend does not appear to continue to the limb (lower left panel of Fig. 4). Via the magneto-optical effects, these near wing signals are sensitive to the depolarizing effect caused by the presence of magnetic fields in the lower solar chromosphere, with strengths similar to those that produce the Hanle effect at the line center. This explanation would be consistent with the observations. The theoretical CLV calculated in the unmagnetized FAL-C semi-empirical model of the quiet sun (the solid curves in the same figure panel) generally have a stronger polarization signature than the CLASP2 measurements.
The center of the neighboring Mg ii line is intrinsically unpolarizable and the distinctive antisymmetric signal observed around the line center is only obtained in theoretical calculations that include both PRD effects and -state interference (Belluzzi & Trujillo Bueno, 2012).
As expected, all signals of the Mg ii line (both, at the center and at the near wings) fluctuate around zero, without any CLV (right panels of Fig. 4). The corresponding signals also fluctuate along the spatial direction of the radially oriented slit (left panels), but the wing signals do not fluctuate around zero. These and spatial fluctuations are likely caused by the local symmetry breaking due to the three-dimensional nature of the solar chromosphere, but the amplitudes of the fluctuations themselves appear to be sensitive to the magnetic field strength—note that these polarization amplitudes are damped inside the plage region disk-ward of ″, where the magnetic field is stronger. As mentioned above, the Hanle effect (which operates at the line center) and the magneto-optical effects (which operate in the near and far wings all across the Mg ii doublet) tend to significantly reduce the scattering polarization amplitudes. This occurs mainly for magnetic fields with strengths at or above the critical field ( G) for the onset of the Hanle effect at the line center (Alsina Ballester et al., 2016; del Pino Alemán et al., 2016, 2020).
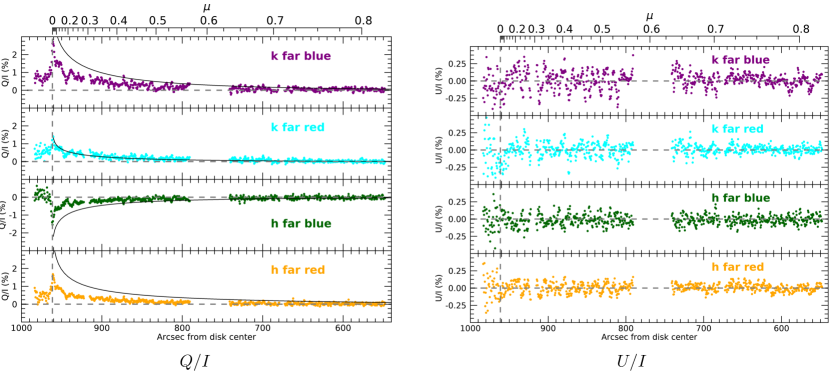
Although this was not explicitly included in the theoretical paper by Belluzzi & Trujillo Bueno (2012), another result from their calculations with the FAL-C semi-empirical model is that the far wings of the lines have a clear CLV in ; the solid black curves in the left panels of Fig. 5 show the CLV at the four far-wing wavelength bands. The points in the same panels show the CLV observed by CLASP2 at these wavelengths. Interestingly, while the observed and calculated CLV match in the far red wavelength, the amplitudes of the observed CLV in the other far wing wavelengths are smaller than the theoretical ones. As shown by del Pino Alemán et al. (2016, 2020) magneto-optical effects introduce magnetic sensitivity in the far wings of the Mg ii & lines, depolarizing the wing signals for magnetic fields as weak as 22 G. These far wing signals originate in the upper photosphere, and we interpret the smaller amplitudes of the observed CLV curves as due to magneto-optical depolarization by the magnetic fields of the upper solar photosphere.
The far wing signals fluctuate around zero (right panels of Fig. 5), which is mostly as expected. As stated earlier, theoretical models predict that when a magnetic field is present, the magneto-optical effects can transfer signal from Stokes to Stokes in the far wings (Alsina Ballester et al., 2016; del Pino Alemán et al., 2016, 2020). The effect increases when the longitudinal component of the magnetic field is stronger and when is greater, such as very close to the limb where the wing signal rises according to its CLV. The amplitude of the signals very near the limb () in the far wings may thus show a CLV due to these magneto-optical effects (Fig. 5, right), but the observations are not conclusive. More work is in progress to explore this possibility.
4 Discussion
We have presented the first ever spectrally resolved measurements of the linear polarization across the Mg ii & lines of the solar chromosphere, with a spatial resolution of less than 2″. These unprecedented measurements provide unique data to confirm or refute our current theoretical understanding of the physical mechanisms that control the polarization of these strong ultraviolet lines, which encode important information on the magnetism of the solar chromosphere. The focus of this paper is the linear polarization observed by CLASP2 in the quiet sun, with emphasis on the center-to-limb variation (CLV).
The key findings are summarized as follows:
- (1)
-
(2)
Although no clear CLV is seen at the line center of Mg ii (Fig. 4, upper left panel), the observed line-center signal does not fluctuate around the zero polarization level as clearly as CLASP measured for the Ly- line-center signal (Kano et al., 2017). The center of the hydrogen Ly- line originates very close to the corrugated surface that delineates the chromosphere-corona transition region, and the observational fact that the CLV of its line center signal fluctuates around zero could be explained in terms of the geometrical complexity of such transition region layer (Trujillo Bueno et al., 2018). The Mg ii line center patterns observed by CLASP2 could indicate that both magnetic field variations and corrugation of the originating surface contribute to the observation.
-
(3)
CLV is found in the near wings of Mg ii in (Fig. 4, lower left panel). The CLV is clearly inferred disk-ward of , but there is a break in the pattern closer to the limb. Depolarization by magneto-optical effects produced by chromospheric magnetic fields could be responsible for the disparity between the model and observations, but more theoretical work is needed to be able to model the linear polarization in the wings of strong resonance lines taking into account the combined action of magneto-optical effects and symmetry breaking caused by horizontal atmospheric inhomogeneities.
- (4)
- (5)
More work is needed to fully understand these new observations. Nevertheless, the comparison of the unique data provided by CLASP2 with the theoretical results from the 1D radiative transfer investigations carried out over the last few years (Belluzzi & Trujillo Bueno, 2012; Alsina Ballester et al., 2016; del Pino Alemán et al., 2016, 2020) clearly show that we have a good physical understanding of the mechanisms that control the linear and circular polarization across the Mg ii & lines.
The next challenge on the theoretical front will be to solve the 3D radiative transfer problem taking into account the PRD effects and -state interference. Regarding observations, it is clear that routine spectropolarimetric observations of this sort would result in rich scientific information about the magnetic field that would benefit to a broad solar community, and so we strongly advocate for a solar space telescope equipped with a CLASP-like spectropolarimeter for probing the upper solar chromosphere.
References
- Alsina Ballester et al. (2016) Alsina Ballester, E., Belluzzi, L., & Trujillo Bueno, J. 2016, ApJ, 831, L15, doi: 10.3847/2041-8205/831/2/L15
- Auer et al. (1980) Auer, L. H., Rees, D. E., & Stenflo, J. O. 1980, A&A, 88, 302
- Belluzzi & Trujillo Bueno (2012) Belluzzi, L., & Trujillo Bueno, J. 2012, ApJ, 750, L11, doi: 10.1088/2041-8205/750/1/L11
- Belluzzi et al. (2012) Belluzzi, L., Trujillo Bueno, J., & Štěpán, J. 2012, ApJ, 755, L2, doi: 10.1088/2041-8205/755/1/L2
- Bohlin et al. (1980) Bohlin, J. D., Frost, K. J., Burr, P. T., Guha, A. K., & Withbroe, G. L. 1980, Sol. Phys., 65, 5, doi: 10.1007/BF00151380
- De Pontieu et al. (2014) De Pontieu, B., Title, A. M., Lemen, J. R., et al. 2014, Sol. Phys., 289, 2733, doi: 10.1007/s11207-014-0485-y
- De Rosa et al. (2009) De Rosa, M. L., Schrijver, C. J., Barnes, G., et al. 2009, ApJ, 696, 1780, doi: 10.1088/0004-637X/696/2/1780
- del Pino Alemán et al. (2016) del Pino Alemán, T., Casini, R., & Manso Sainz, R. 2016, ApJ, 830, L24, doi: 10.3847/2041-8205/830/2/L24
- del Pino Alemán et al. (2020) del Pino Alemán, T., Trujillo Bueno, J., Casini, R., & Manso Sainz, R. 2020, ApJ, 891, 91, doi: 10.3847/1538-4357/ab6bc9
- Fontenla et al. (1993) Fontenla, J. M., Avrett, E. H., & Loeser, R. 1993, ApJ, 406, 319, doi: 10.1086/172443
- Henze & Stenflo (1987) Henze, W., & Stenflo, J. O. 1987, Sol. Phys., 111, 243, doi: 10.1007/BF00148517
- Holzreuter & Stenflo (2007) Holzreuter, R., & Stenflo, J. O. 2007, A&A, 472, 919, doi: 10.1051/0004-6361:20077627
- Ishikawa et al. (2013) Ishikawa, R., Kano, R., Bando, T., et al. 2013, Applied Optics, 52, 8205, doi: 10.1364/AO.52.008205
- Ishikawa et al. (2017) Ishikawa, R., Trujillo Bueno, J., Uitenbroek, H., et al. 2017, ApJ, 841, 31, doi: 10.3847/1538-4357/aa6ca9
- Ishikawa et al. (2021) Ishikawa, R., Trujillo Bueno, J., del Pino Alemán, T., et al. 2021, Science Advances, 7, eabe8406, doi: 10.1126/sciadv.abe8406
- Ishikawa et al. (2015) Ishikawa, S., Shimizu, T., Kano, R., et al. 2015, Sol. Phys., 290, 3081, doi: 10.1007/s11207-015-0774-0
- Kano et al. (2012) Kano, R., Bando, T., Narukage, N., et al. 2012, in Society of Photo-Optical Instrumentation Engineers (SPIE) Conference Series, Vol. 8443, Space Telescopes and Instrumentation 2012: Ultraviolet to Gamma Ray, ed. T. Takahashi, S. S. Murray, & J.-W. A. den Herder, 84434F, doi: 10.1117/12.925991
- Kano et al. (2017) Kano, R., Trujillo Bueno, J., Winebarger, A., et al. 2017, ApJ, 839, L10, doi: 10.3847/2041-8213/aa697f
- Kobayashi et al. (2012) Kobayashi, K., Kano, R., Trujillo-Bueno, J., et al. 2012, in Astronomical Society of the Pacific Conference Series, Vol. 456, Fifth Hinode Science Meeting, ed. L. Golub, I. De Moortel, & T. Shimizu, 233
- Lemen et al. (2012) Lemen, J. R., Title, A. M., Akin, D. J., et al. 2012, Sol. Phys., 275, 17, doi: 10.1007/s11207-011-9776-8
- Manso Sainz et al. (2019) Manso Sainz, R., del Pino Alemán, T., Casini, R., & McIntosh, S. 2019, ApJ, 883, L30, doi: 10.3847/2041-8213/ab412c
- Manso Sainz & Trujillo Bueno (2011) Manso Sainz, R., & Trujillo Bueno, J. 2011, ApJ, 743, 12, doi: 10.1088/0004-637X/743/1/12
- Narukage et al. (2015) Narukage, N., Auchère, F., Ishikawa, R., et al. 2015, Appl. Opt., 54, 2080, doi: 10.1364/AO.54.002080
- Narukage et al. (2016) Narukage, N., McKenzie, D. E., Ishikawa, R., et al. 2016, in Society of Photo-Optical Instrumentation Engineers (SPIE) Conference Series, Vol. 9905, Space Telescopes and Instrumentation 2016: Ultraviolet to Gamma Ray, ed. J.-W. A. den Herder, T. Takahashi, & M. Bautz, 990508, doi: 10.1117/12.2232245
- Song et al. (2018) Song, D., Ishikawa, R., Kano, R., et al. 2018, Proc. SPIE, 10699, 106992W, doi: 10.1117/12.2313056
- Trujillo Bueno et al. (2017) Trujillo Bueno, J., Landi Degl’Innocenti, E., & Belluzzi, L. 2017, Space Sci. Rev., 210, 183, doi: 10.1007/s11214-016-0306-8
- Trujillo Bueno et al. (2011) Trujillo Bueno, J., Štěpán, J., & Casini, R. 2011, ApJ, 738, L11, doi: 10.1088/2041-8205/738/1/L11
- Trujillo Bueno et al. (2018) Trujillo Bueno, J., Štěpán, J., Belluzzi, L., et al. 2018, ApJ, 866, L15, doi: 10.3847/2041-8213/aae25a
- Tsuzuki et al. (2020) Tsuzuki, T., Ishikawa, R., Kano, R., et al. 2020, in Society of Photo-Optical Instrumentation Engineers (SPIE) Conference Series, Vol. 11444, Society of Photo-Optical Instrumentation Engineers (SPIE) Conference Series, 114446W, doi: 10.1117/12.2562273
- Štěpán & Trujillo Bueno (2016) Štěpán, J., & Trujillo Bueno, J. 2016, ApJ, 826, L10, doi: 10.3847/2041-8205/826/1/L10
- Štěpán et al. (2015) Štěpán, J., Trujillo Bueno, J., Leenaarts, J., & Carlsson, M. 2015, ApJ, 803, 65, doi: 10.1088/0004-637X/803/2/65
- Woodgate et al. (1980) Woodgate, B. E., Tandberg-Hanssen, E. A., Bruner, E. C., et al. 1980, Sol. Phys., 65, 73, doi: 10.1007/BF00151385
- Yoshida et al. (2018) Yoshida, M., Song, D., Ishikawa, R., et al. 2018, Proc. SPIE, 10699, 1069930, doi: 10.1117/12.2312463