11email: {bjiang14, psheth5, baoxin.li, huanliu}@asu.edu
CoVaxNet: An Online-Offline Data Repository for COVID-19 Vaccine Hesitancy Research
Abstract
Despite the astonishing success of COVID-19 vaccines against the virus, a substantial proportion of the population is still hesitant to be vaccinated, undermining governmental efforts to control the virus. To address this problem, we need to understand the different factors giving rise to such a behavior, including social media discourses, news media propaganda, government responses, demographic and socioeconomic statuses, and COVID-19 statistics, etc. However, existing datasets fail to cover all these aspects, making it difficult to form a complete picture in inferencing about the problem of vaccine hesitancy. In this paper, we construct a multi-source, multi-modal, and multi-feature online-offline data repository CoVaxNet111https://github.com/jiangbohan/CoVaxNet. We provide descriptive analyses and insights to illustrate critical patterns in CoVaxNet. Moreover, we propose a novel approach for connecting online and offline data so as to facilitate the inference tasks that exploit complementary information sources.
Keywords:
Repository Online-Offline Data COVID-19 Vaccine.1 Introduction
The COVID-19 pandemic has killed over six million people and infected 536 million globally as of mid-June, 2022222https://covid19.who.int/. It has been pointed out that the FDA-authorized COVID-19 vaccines are highly effective at protecting against severe illness and reinfection[12]. However, according to a recent KFF survey333https://www.kff.org/coronavirus-covid-19/dashboard/, 32% of people in the U.S. showed hesitancy to receive at least one dose of the COVID-19 vaccine. SARS-CoV-2 is constantly mutating to highly contagious variants and subvariants, causing the number of cumulative cases of infection continues to grow in most countries. Therefore, the effort to end the pandemic will be severely hindered if a substantial proportion of the population still show vaccine hesitancy.
Mitigating the ongoing COVID-19 vaccine hesitancy presents unique challenges. First, as defined in [15], vaccine hesitancy is a continuum between full acceptance (pro-vaccine) and outright refusal of all vaccines (anti-vaccine), and the COVID-19 vaccine hesitancy is driven by a complex set of dynamic context-specific factors, including social media influence, public stance and sentiment, structural inequality, risk of the disease, and trust toward government, etc. All these make the characterization of COVID-19 vaccine hesitancy a non-trivial task. Second, the research community lacks comprehensive COVID-19 vaccine datasets containing adequate information to support effective analysis of the factors mentioned above and their impact on COVID-19 vaccine hesitancy. Given the complexity of the problem, a data repository capturing online-offline COVID-19 vaccine information would be critical to the analysis.
In this paper, we present a multi-source, multi-modal, and multi-feature online-offline data repository CoVaxNet. As shwon in Figure 1, it contains two online datasets: (i) a social media dataset and (ii) a fact-checking dataset; and four offline datasets: (i) COVID-19 statistics, (ii) U.S. Census Bureau data, (iii) government responses, and (iv) local news reports. To the best of our knowledge, we are the first to build such a diverse online-offline COVID-19 vaccine repository. We aim to continuously update this data repository with new sources and features, as well as maintain completeness. The main contributions of this work are:
-
We construct a multi-source, multi-modal, and multi-feature online-offline repository to facilitate COVID-19 vaccine hesitancy related research such as (i) detecting COVID-19 vaccine misinformation and stance, (ii) exploring the effect of online activities on offline outcomes and vice-versa, and (iii) finding correlations between structural inequality and vaccine hesitancy;
-
We provide descriptive analyzes of the repository from different perspectives. We illustrate insights of various features and characteristics in each dataset, which covers textual, visual, spatio-temporal, and network information; and
-
We propose a new online and offline data connection approach with examples from CoVaxNet and demonstrate baseline performances for stance detection.
2 Related Work
Previous studies have investigated vaccine hesitancy on vaccine-preventable diseases such as HPV, H1N1, and Flu [16, 17]. However, vaccine hesitancy can vary on different diseases. The SAGE Working Group on Vaccine Hesitancy (WG) suggests that a complex set of behavioral and social factors should be considered to construct vaccine hesitancy determinants. [15].
To better understand the COVID-19 vaccine hesitancy, previous works have been conducted on online data. [6] released the first English Twitter dataset and an online dashboard about COVID-19 vaccines. [7] presented a large-scale multilingual Twitter dataset about COVID-19 vaccines. [19] collected 1.8 million anti-vaccine tweets. They investigated the online implicit communities on topic network using the Louvain algorithm. [13] adopt a human-guided machine learning framework on social media data to analyze public opinions on COVID-19 vaccines. [11] proposed a sentiment analysis framework to understand the public attitude and concerns on mainstream social media toward COVID-19 vaccines.
Researchers also analyzed the COVID-19 vaccine hesitancy on offline data. The Oxford COVID-19 Government Response Tracker (OxCGRT) involved over 200 volunteers from the Oxford community to collect publicly available global information on 21 indicators of government response, including data on vaccination policies [10]. [18] studied the COVID-19 vaccine hesitancy by analyzing the association between vaccination rates and Social Vulnerability Index (SVI) from CDC on a county level. [20] examined the geospatial trends in COVID-19 incidence of the neighborhood-level U.S. Census data. [9] used human mobility data from Google to analyze the relationship of vaccination rates to mobility and new COVID-19 cases.
3 Construction: What is in CoVaxNet?
3.1 Data in the Digital World (Online Data)
Tweets: Inspired by [7], we utilize a snowball sampling method in our crawling strategy. First, we start with collecting publicly available tweets with the two most relevant keywords, covid and vaccine [6], as the initial seeds using Tweepy API444https://www.tweepy.org/. Next, we run n-gram and tf-idf on the collected tweets to identify the most representative and frequent keywords and hashtags for pro-COVID-19-vaccine and anti-COVID-19-vaccine stances. Then, we collect more tweets with newly added keywords and hashtags to expand the list of seeds. We repeat this process until no new seeds can be extracted. We also carefully analyze the sampled tweets for each keyword and hashtag to check whether they are labeled correctly. For example, #Antivaxxers is initially considered as an anti-vaccine hashtag. However, we find that the sampled tweets are primarily posted by pro-vaxxers to criticize anti-vaxxers. Therefore, we eventually categorize #Antivaxxers as one of the pro-vaccine search keywords. Finally, we remove keywords and hashtags that are not closely related to the COVID-19 vaccine.
As shown in Table 1, the shortlisted keywords and hashtags are well-classified to collect COVID-19 pro-vaccine and anti-vaccine tweets. A complete list of them is available in our data repository, which includes 25 pro-vaccine seeds and 28 anti-vaccine seeds. In agreement with Twitter’s Terms of Service, we only release the tweets IDs which can be used to retrieve more objects via APIs.
| Stance | Keywords & Hashtags |
|---|---|
| Pro-vaccine | get vaccinated, vaccine mandate, vaccination work, fully vaccinated, vaccines save lives, vaccinated for covid, #GetVaccinatedOrGetCovid, #Antivacinidiots, #Antivaxxers, #GetYourBooster, … (25) |
| Anti-vaccine | no vaccine, f**k vaccines, no forced vaccines, no vaccine mandates, #NoVaccineForMe, #CovidVaccineIsPoison, #NoVaccinePassports, #StopVaccination, #VaccineSideEffects, … (28) |
Twitter User Profiles:
We collect metadata from Twitter user profiles, as listed in Figure 1. Due to the lack of geotagged tweets, we leverage the self-reported locations in the users’ profiles to tag non-geotagged tweets for data enrichment. Observing that 70.3% of the collected tweets contain either tweet-level or user-level geo-location information. Furthermore, we use GeoPy [1] to convert the unstructured self-reported locations to structured geographical places with coordinates. We also employ state-of-the-art computer vision and natural language processing tools to infer the demographics of social media users. We use OpenCV [4] and DeepFace [22] to detect human faces and predict age, gender, and race on the profile images. For textual features such as usernames and profile descriptions/bio, by applying Nameparser [3] and Ethnicolr [21], we extract human names to infer race and gender.
Fact-checking Reports and Malicious URLs:
Fact-checking reports can illustrate how COVID-19-vaccine-related mis- and disinformation, rumors, and conspiracy theories spread online. In this dataset, we collect 4,263 COVID-19 vaccine-related fact-checking reports from Poynter555https://www.poynter.org/ifcn-covid-19-misinformation/, where the journalists carefully check the authenticity of news pieces and social media posts. Poynter provides an international fact-checking network (IFCN) alliance collaborating with 100 fact-checking agencies such as FactCheck.org, PolitiFact, and Science Feedback in more than 70 countries and 40 languages. The fact-checkers labeled the articles and social media posts as false, partially false, misleading, or no evidence according to the reports. We also obtain 813 low credibility sources from Iffy+666https://iffy.news/iffy-plus/ dataset, which merges lists of sites that regularly publish mis- and disinformation, as identified by major fact-checking and journalism organizations.
3.2 Data in the Physical World (Offline Data)
COVID-19 Statistics:
We adopt the COVID-19 data repository operated by the Center for Systems Science and Engineering (CSSE) at Johns Hopkins University [8]. This data repository obtained statewide, nationwide, and global streaming COVID-19 statistics from reliable sources, including daily confirmed cases, deaths, recoveries, hospitalizations, and vaccinations since January, 2020.
U.S. Census Bureau Data:
We comprise the historical state-level and 5-digit zip code-level census records from the U.S. Census Bureau777https://data.census.gov/cedsci/ such as the population’s age, gender, race, income, health insurance coverage, and employment status. Moreover, the Household Pulse Survey(HPS), which focused on estimating how people’s lives have been impacted by the COVID-19 pandemic, is available in our data repository. It is worth noting that it consists of survey questions such as “reasons for children ages 5-17 and adults not receiving or planning to receive a COVID-19 vaccine”, which is valuable for COVID-19 vaccine hesitancy research. Besides, the COVID-19 Vaccination Tracker from the Census Bureau is also included for a high-level data visualization.
Government Responses:
During the COVID-19 vaccine campaign, government policies and responses play an essential role. We obtain the COVID-19-vaccine-related federal and state policies from Ballotpedia888https://ballotpedia.org/Documenting_America%27s_Path_to_Recovery. It contains spatio-temporal information about COVID-19 vaccine authorization, distribution, and legislation.
Local News:
We use the GoogleNews [2] library to collect real-world events and local news pieces from Google News, which aggregates news articles from more than 4.5k sites in English and 50k news sources worldwide [5]. In this study, after filtering out low-credibility sources, we acquired around 4.8k news reports with keyword COVID-19 vaccine from Jan 2020 to Jan 2022.
4 Insight: What is in the Data?
4.1 Social Media Data
| Pro-vaccine | Anti-vaccine | |
| Time period | 01.2020 - 01.2022 | 01.2020 - 01.2022 |
| # Tweets | 1,495,991 | 335,229 |
| # Retweets, Replies | 317,683/433,465 | 101,059/73,369 |
| # Users | 480,327 | 87,405 |
| # Tweets with URL | 233,673 | 48,635 |
| # Tweets with image | 283,365 | 43,127 |
| # Tweets with video/GIF | 310,699 | 55,550 |
| Avg # tweets per user | 3.11 | 3.84 |
| Avg # followings per user | 1,354 | 1,473 |
| Avg # followers per user | 4,590 | 3,392 |
| Avg # favourites per user | 1,374 | 1,506 |
| Avg # lists per user | 36.2 | 28.1 |
| Avg accounts age (years) | 7.91 | 6.55 |
| Avg # replies per tweet | 1.08 | 1.42 |
| Avg # retweets per tweet | 2.73 | 6.53 |
| Avg # likes per tweet | 13.04 | 21.09 |
| Avg # words per tweet | 25.67 | 23.67 |
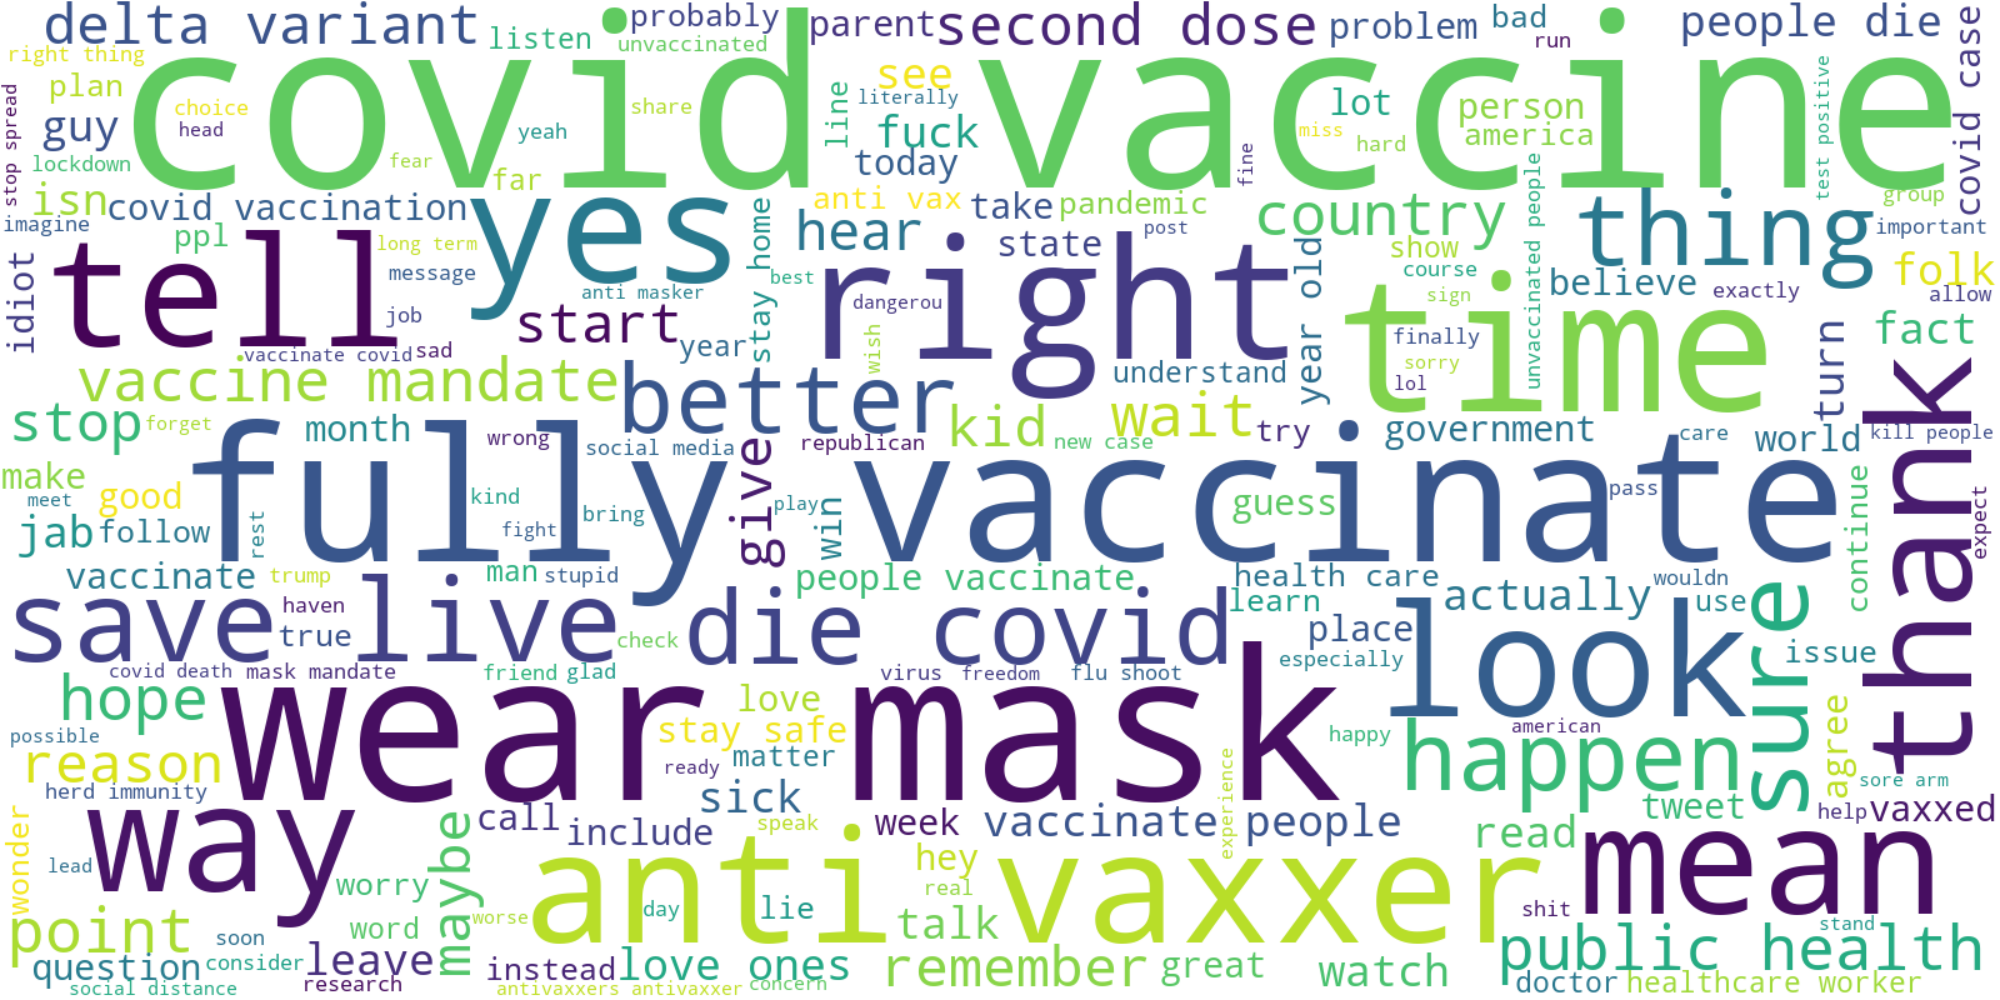
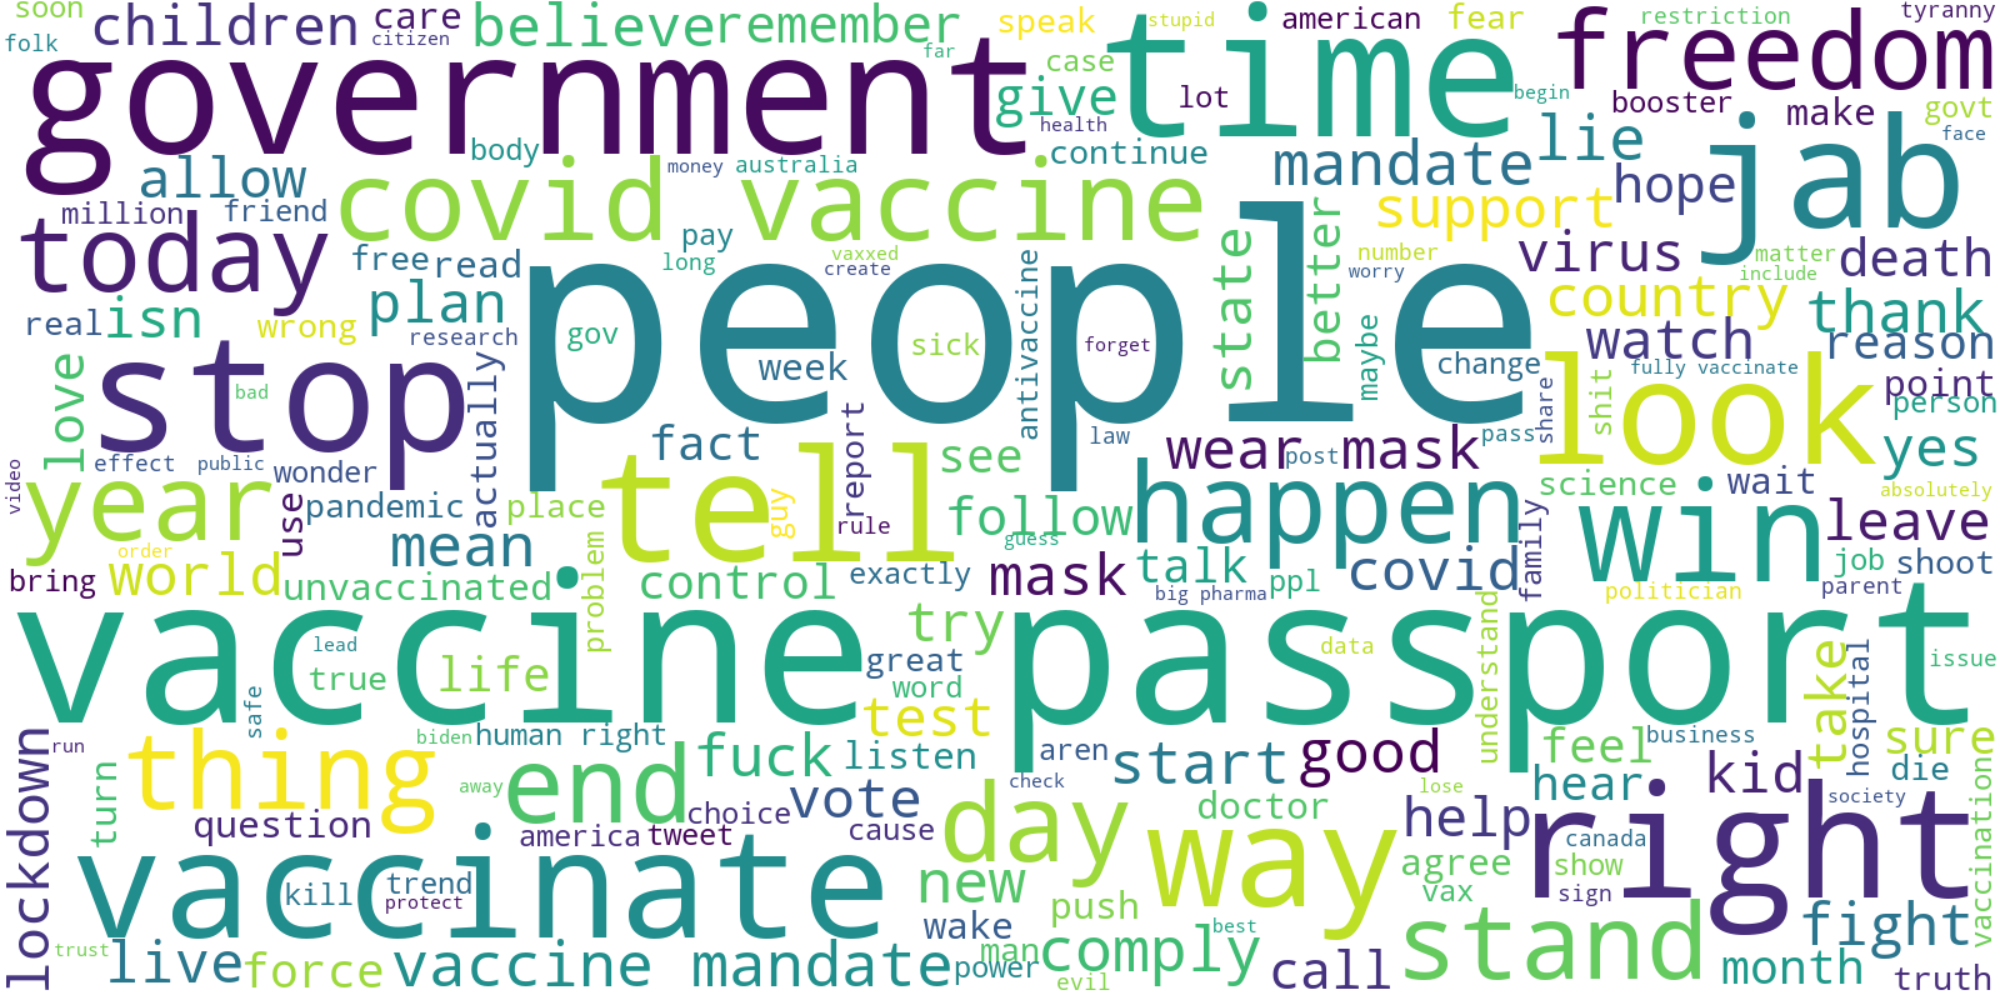
The general statistics on our Twitter dataset are presented in Table 2. The Twitter dataset contains 1,831,220 tweets, 366,276 (20) of which have both textual and visual (images or videos) information for multi-modal studies. Figure 2 reveals the textual characteristics within pro- and anti-COVID-19-vaccine tweets. In the pro-vaccine group, a sufficiently large number of tweets encourage people to get the COVID-19 vaccines and wear masks to save lives. Thus, we can observe that the words frequently appear in this group include fully, vaccinate, wear, mask, save. The frequent words from the anti-COVID-19-vaccine tweets, such as people, stop, freedom, government, passport, show concern about excessive government control and people’s freedom during the pandemic.
4.2 Fact-checking and Local News Data
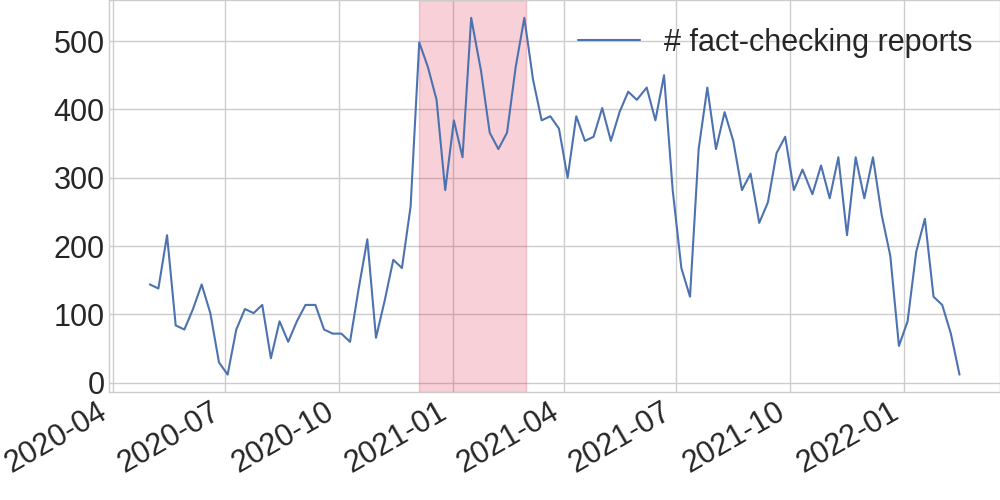
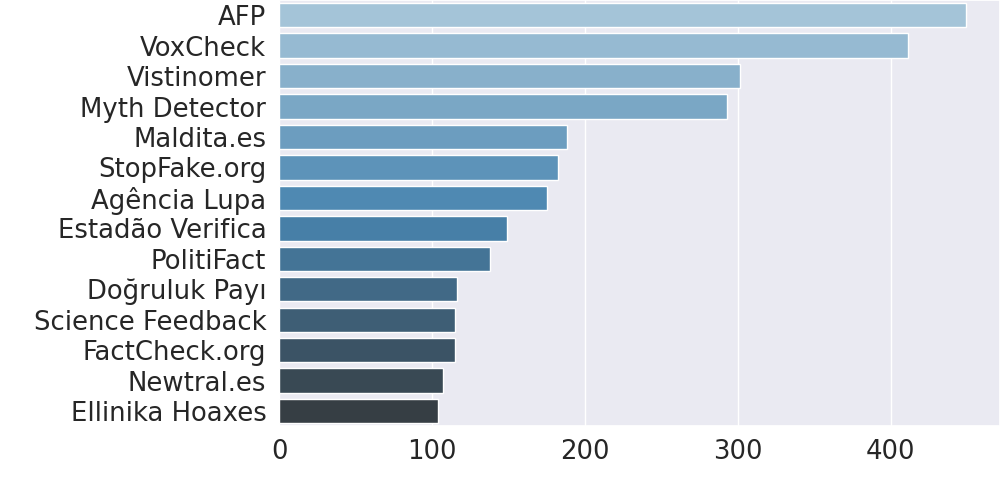
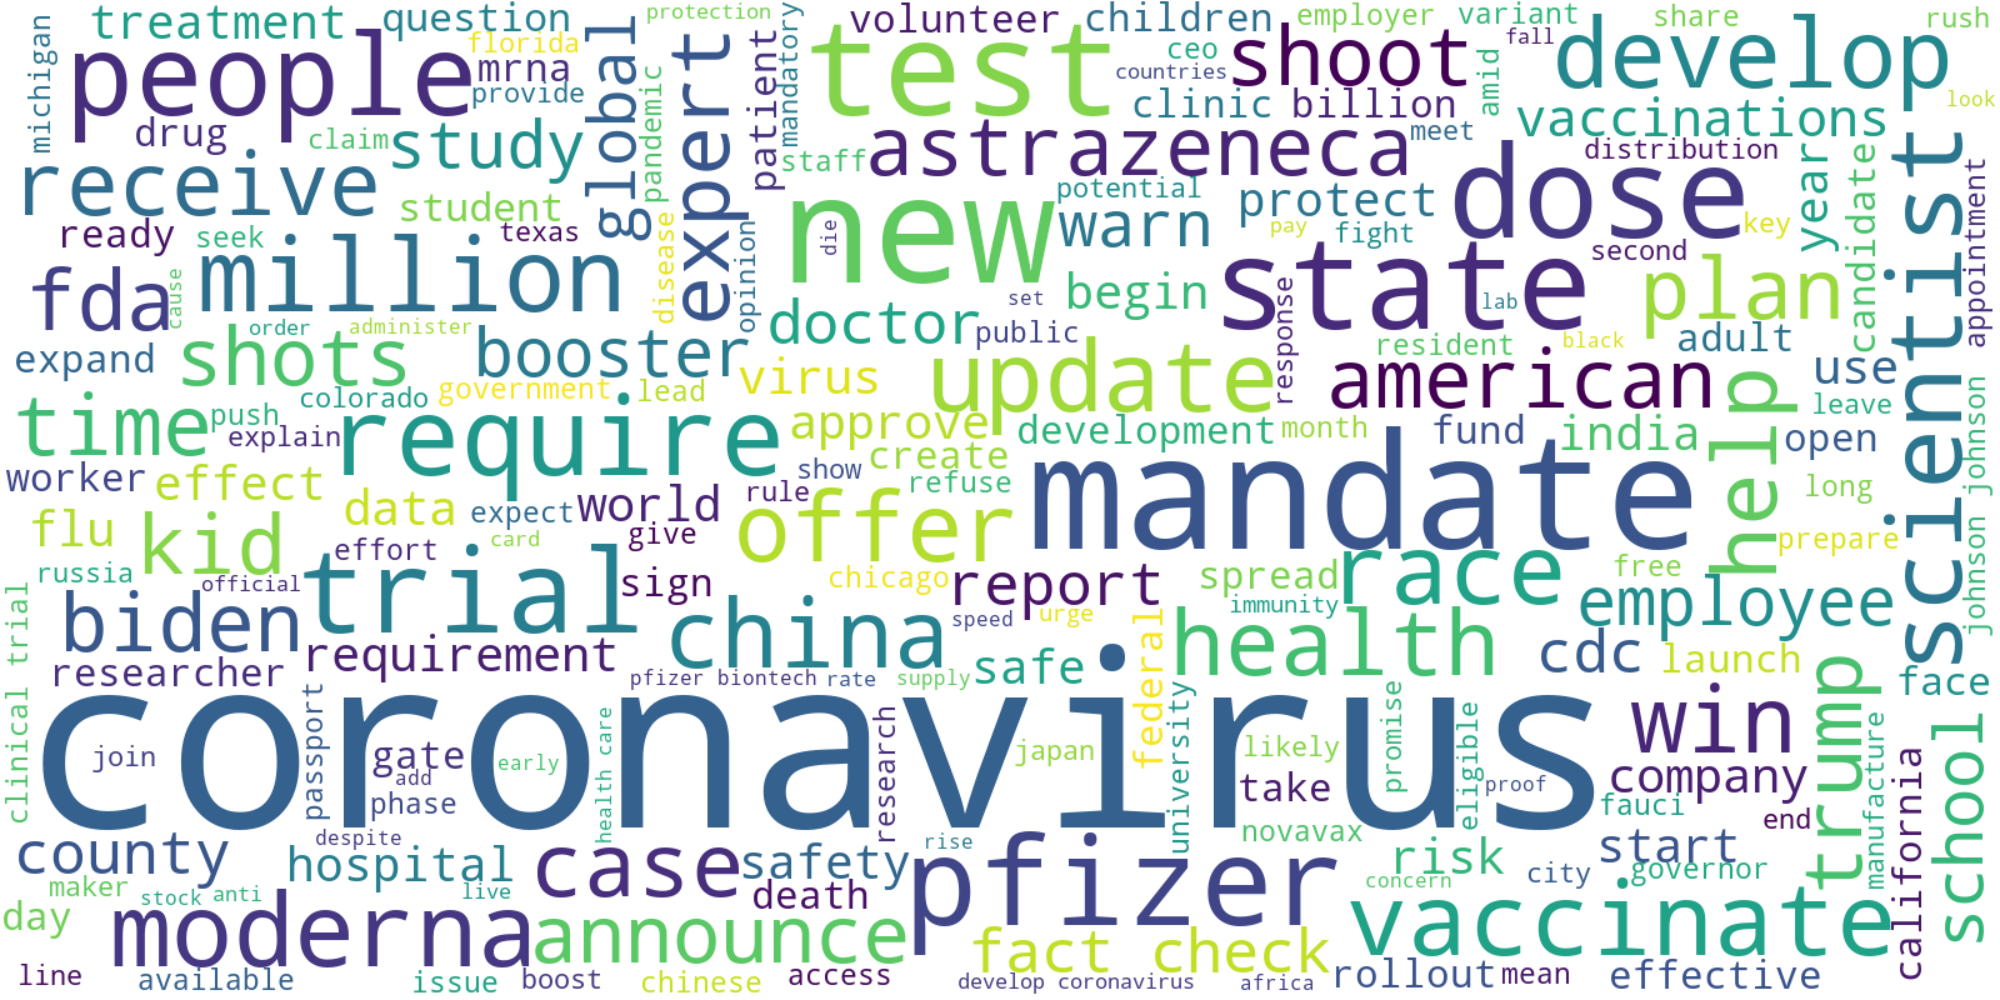
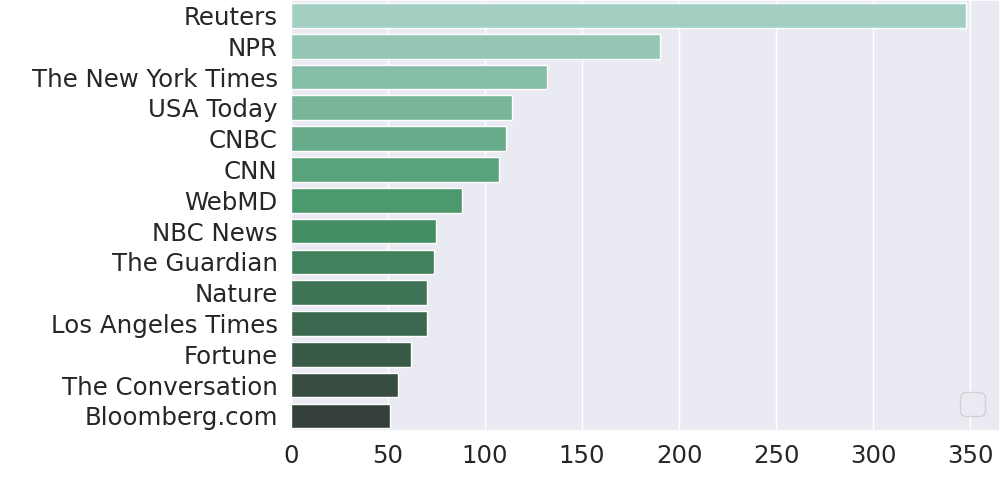
Figure 3 shows the number of weekly fact-checking reports about COVID-19 vaccines from Poynter and the distribution of active fact-checking websites. We can observe that the number of COVID-19 fact-checking articles published is significantly increased from December 2020 to March 2020, highlighted with a pink rectangle. Note that the emergency use authorization (EUA) approved the first COVID-19 vaccine from Pfizer and BioNTech on December 11, 2020, which potentially led to a massive spread of misinformation about vaccine safety, effectiveness, and adverse reactions. Furthermore, this dataset contains fact-checking websites from various countries, which provides an potential for multilingual misinformation studies on COVID-19 vaccines. Figure 4 presents the word cloud and top news publishers of the local news dataset. We can observe that news authors’ frequently used topics and vocabularies are more neutral and objective than those of Twitter users. A possible explanation is that the news articles collected are from multiple sources, including cross-domain for-profit and non-profit news outlets, multidisciplinary science journals, and international health magazines.
4.3 Offline Statistics
In the repository, CSV files are well-documented with sufficient offline statistics. The JHU COVID-19 dashboard[8] provides easy-access, interactive, and comprehensive data visualization of spatio-temporal COVID-19 statistics. Note that COVID-19 statistics and Census data have shown to be correlated with vaccine hesitancy in a quantitative study[14]. Similar findings from surveys can be good validations. For example, Kaiser Family Foundation (KFF) compares public attitudes towards COVID-19 vaccines among different demographic and socioeconomic statuses through a monthly survey. We can observe that: (i) political lean is correlated with vaccine attitudes Republicans tend to refuse the COVID-19 vaccine more than Democrats; (ii) The vaccine attitudes are similar among different races across time; (iii) People in rural areas are more likely to be anti-vaxxers than those in suburban and urban areas; (iv) People with a college degree are more willing to vaccinate than those with less than a college degree; and (v) The percentage of pro-vaxxers is increasing while anti-vaxxers’ remains stable and low over time among all demographic and socioeconomic groups.
5 Online and Offline Data Connection and Application
The COVID-19 vaccine campaign gave rise to a surplus of online and offline data expressing people’s views and different policies imposed by the government to promote the vaccine. These two kinds of data share a strong relationship. For example, offline COVID-19 statistics can alter the vaccine stance of the online crowd [13]. Thus, online and offline data can complement each other to optimize the information capture. However, connecting online and offline data is challenging because they reside in different sources, modalities, and dimensions. To this end, we first discuss how to connect COVID-19 online and offline data in CoVaxNet. Furthermore, we conduct COVID-19 vaccine stance detection to (i) verify the quality and compatibility of our datasets for various downstream tasks, including stance detection; (ii) demonstrate the necessity for employing online-offline data; and (iii) encourage researchers to develop state-of-the-art models and incorporate various online and offline data provided by CoVaxNet to facilitate the COVID-19 vaccine hesitancy study.
5.1 Data Connection
An online-offline dataset contains (i) an online dataset and (ii) an offline dataset. Thus, we denote the online-offline dataset as
| (1) |
where denotes the set of online data and is the set of offline data. Then an online-offline data connection which establishes a link between the online and offline dataset, presented by implicit or explicit features, can be extracted. In this work, we connect online social media dataset with offline COVID-19 statistics dataset through a geolocation-based online-offline connection . For example, given two online social media posts and from and two offline COVID-19 statistics and from , and a connection such that
Therefore, the online-offline dataset , can be formulated as
| (2) |
where the tuple indicates the post and the statistics are linked to each other through the geolocation indicator .
5.2 COVID-19 Vaccine Stance Detection
We adopt , , and in the last subsection to perform vaccine stance detection. For data preprocessing, we encode the tabular COVID-19 statistics into text representations so as to make them consistent with the modality of tweets. First, we compute the weekly COVID-19 severity of each city
| (3) |
where is the number of days before a tweet is posted. , , , , and denote the daily growth rate of cases, deaths, hospitalizations, recoveries, and vaccinations. Second, for a given list of cities, we categorize the severity level of each city as low, medium, or high by sorting the Severity values in an ascending order and then splitting the list based on the proportion of . Third, we encode the severity level at the end of each tweet. For example, a encoded tweet will be “mRNA is made from Human DNA. It’s designed to attach to your DNA. The COVID-19 severity of my city is <severity level>.” In addition, we encode the user demographics, including age, gender, and race, from the user profile into the tweets. For instance, "I am a age years old race gender." Now we have three types of data: (i) online data (tweets); (ii) offline data (encoded COVID-19 statistics); and (iii) online-offline data (tweets encoded COVID-19 statistics and user demographics).
We randomly selected 70% data as the training set and 30% as the testing set, as well as a balanced distribution () between pro- and anti-vaccine tweets. We deploy four well-established baselines including Support Vector Machines (SVM), Naive Bayes (NB), Logistic Regression (LR), and BERT in our experiments. The experimental results are listed in Table 3. We observe that four baselines have reasonably good performance results in terms of F1-score and accuracy. This validates the quality of labels and collected features in CoVaxNet. Moreover, we can find that models trained on online-offline data outperform models trained on either online or offline data. This demonstrates that online-offline data can provide more critical information than online or offline data, which can be learned by the baseline models. However, the experimental results of these baselines are still limited and shows great potential for improvements.
| Method | SVM | NB | LR | BERT | ||||
| Metric | Accuracy | F1 | Accuracy | F1 | Accuracy | F1 | Accuracy | F1 |
| Online | 0.736 | 0.763 | 0.758 | 0.751 | 0.776 | 0.777 | 0.784 | 0.788 |
| Offline | 0.630 | 0.602 | 0.658 | 0.667 | 0.674 | 0.676 | 0.675 | 0.680 |
| Online-Offline | 0.759 | 0.769 | 0.782 | 0.777 | 0.789 | 0.788 | 0.796 | 0.793 |
6 Conclusion
To combat the COVID-19 pandemic, we present a multi-source, multi-modal, and multi-feature online-offline repository for COVID-19 vaccine hesitancy research. We introduce our strategy for constructing a high-quality online-offline data repository. We share sufficient insights, which detail textual, visual, spatio-temporal, and network features in the data. Furthermore, we propose a geolocation-based online-offline data generation approach. We believe CoVaxNet would facilitate the research of analyzing the impact of various online and offline data on COVID-19 vaccine hesitancy and help policymakers prioritize resource allocation in the ongoing and future pandemics. There are several promising future directions. First, we will improve our labeling strategy to reduce noise and provide ground truth of “vaccine hesitancy” in our Twitter dataset. Second, we intend to extend the CoVaxNet to include more relevant data from other reliable sources. For example, we will collect data from countries with similar and dissimilar COVID-19 vaccine roll-out plans. This will help researchers study the structural inequalities and the correlation among all information regarding vaccine uptake during the pandemic.
References
- [1] Geopy, https://geopy.readthedocs.io/en/stable/, accessed June 22
- [2] Googlenews, https://github.com/Iceloof/GoogleNews, accessed June 22
- [3] Nameparser, https://nameparser.readthedocs.io/en/latest/, accessed June 22
- [4] Bradski, G., et al.: Learning OpenCV: Computer vision with the OpenCV library
- [5] Das, A.S., et al.: Google news personalization: scalable online collaborative filtering. In: WWW (2007)
- [6] DeVerna, M.R., et al.: Covaxxy: A collection of english-language twitter posts about covid-19 vaccines. In: ICWSM (2021)
- [7] Di Giovanni, M., et al.: Vaccineu: Covid-19 vaccine conversations on twitter in french, german and italian. In: ICWSM (2022)
- [8] Dong, E., et al.: An interactive web-based dashboard to track covid-19 in real time. Lancet Infect. Dis. (2020)
- [9] Guo, J., et al.: Vaccinations, mobility and covid-19 transmission. IJERPH (2021)
- [10] Hale, T., et al.: A global panel database of pandemic policies (oxford covid-19 government response tracker). Nature human behaviour (2021)
- [11] Hussain, A., et al.: Artificial intelligence–enabled analysis of public attitudes on facebook and twitter toward covid-19 vaccines in the united kingdom and the united states: Observational study. JMIR (2021)
- [12] Kim, J.H., et al.: Looking beyond covid-19 vaccine phase 3 trials. Nat. Med. (2021)
- [13] Lyu, H., et al.: Social media study of public opinions on potential covid-19 vaccines: informing dissent, disparities, and dissemination. Intelligent medicine (2021)
- [14] Lyu, H., et al.: Misinformation versus facts: Understanding the influence of news regarding covid-19 vaccines on vaccine uptake. Health Data Science (2022)
- [15] MacDonald, N.E., et al.: Vaccine hesitancy: Definition, scope and determinants. Vaccine (2015)
- [16] McRee, A.L., et al.: Hpv vaccine hesitancy: findings from a statewide survey of health care providers. JPHC (2014)
- [17] Mesch, G.S., et al.: Social and political determinants of vaccine hesitancy: Lessons learned from the h1n1 pandemic of 2009-2010. AJIC (2015)
- [18] Mollalo, A., et al.: Spatial modeling of covid-19 vaccine hesitancy in the united states. IJERPH (2021)
- [19] Muric, G., et al.: Covid-19 vaccine hesitancy on social media: Building a public twitter data set of antivaccine content, vaccine misinformation, and conspiracies. JPHS (2021)
- [20] Oluyomi, A.O., et al.: Covid-19 community incidence and associated neighborhood-level characteristics in houston, texas, usa. IJERPH (2021)
- [21] Sood, G., et al.: Predicting race and ethnicity from the sequence of characters in a name. arXiv preprint arXiv:1805.02109 (2018)
- [22] Taigman, Y., et al.: Deepface: Closing the gap to human-level performance in face verification. In: CVPR (2014)