Restoring cosmological concordance with early dark energy and massive neutrinos?
Abstract
The early dark energy (EDE) solution to the Hubble tension comes at the cost of an increased clustering amplitude that has been argued to worsen the fit to galaxy clustering data. We explore whether freeing the total neutrino mass , which can suppress small-scale structure growth, improves EDE’s fit to galaxy clustering. Using Planck Cosmic Microwave Background and BOSS galaxy clustering data, a Bayesian analysis shows that freeing does not appreciably increase the inferred EDE fraction : we find the 95% C.L. upper limits and . Similarly, in a frequentist profile likelihood setting (where our results support previous findings that prior volume effects are important), we find that the baseline EDE model (with ) provides the overall best fit. For instance, compared to baseline EDE, a model with maintains the same (km/s/Mpc)=(70.08, 70.11, respectively) whilst decreasing =(0.837, 0.826) to the CDM level, but worsening the fit significantly by . For the datasets used, these results are driven not by the clustering amplitude, but by background modifications to the late-time expansion rate due to massive neutrinos, which worsen the fit to measurements of the BAO scale.
keywords:
cosmic background radiation — large-scale structure of the universe — dark energy — cosmological parameters — cosmology: observations1 Introduction
The Hubble tension, i.e. the disagreement between independent measurements of the Hubble constant , is arguably among cosmology’s main open problems (Di Valentino et al., 2021; Perivolaropoulos & Skara, 2022; Abdalla et al., 2022). While systematics cannot be excluded (Freedman et al., 2019; Efstathiou, 2020; Mortsell et al., 2022), serious consideration has been given to the possibility of new physics being at the origin of the tension, given its persistence (Mörtsell & Dhawan, 2018; Guo et al., 2019; Vagnozzi, 2020). Consistency with Baryon Acoustic Oscillation (BAO) and uncalibrated SNeIa data requires new physics to preferably operate before recombination, in order to reduce the sound horizon by (Bernal et al., 2016; Addison et al., 2018; Lemos et al., 2019; Aylor et al., 2019; Knox & Millea, 2020).
One scenario invoked in this context is early dark energy (EDE), a model which introduces a pre-recombination dark energy (DE)-like component that boosts the expansion rate (reducing the sound horizon) before decaying (Poulin et al., 2019). EDE fares well when confronted with Cosmic Microwave Background (CMB) and low- background data (see however Krishnan et al., 2020), but was argued to be in tension with weak lensing (WL) and Large-Scale Structure (LSS) data (Hill et al., 2020; Ivanov et al., 2020c; D’Amico et al., 2021). It was hinted in Murgia et al. (2021); Smith et al. (2021) and shown in Herold et al. (2022) that marginalization effects affect these analyses: a frequentist profile likelihood analysis found that large EDE fractions are not ruled out by galaxy clustering data. However, parameter shifts in high cosmologies lead to an increase in the clustering amplitude and the related parameter , worsening the “ discrepancy” (Di Valentino & Bridle, 2018; Nunes & Vagnozzi, 2021).
In this work, we study the influence of massive neutrinos on EDE, motivated by their free-streaming nature, whose associated power suppression might counteract the EDE-induced enhancement and provide a better fit to LSS data. We find no clear benefits for EDE resulting from massive neutrinos, neither in a Bayesian nor frequentist setting. We investigate prior volume effects, and physical effects driving our parameter constraints, which overall motivate further studies of EDE cosmologies with massive neutrinos.
2 EDE and massive neutrinos
The simplest EDE models envisage an ultra-light scalar field initially displaced from the minimum of its potential and frozen by Hubble friction, behaving as a DE component boosting the pre-recombination expansion rate. 111For examples of other EDE(-like) models, see Karwal & Kamionkowski (2016); Agrawal et al. (2019); Alexander & McDonough (2019); Lin et al. (2019); Niedermann & Sloth (2021); Ye & Piao (2020); Zumalacarregui (2020); Gogoi et al. (2021); Ballesteros et al. (2020); Braglia et al. (2020a, b, 2021); Oikonomou (2021); Freese & Winkler (2021); Nojiri et al. (2021); Karwal et al. (2022); Khosravi & Farhang (2022); Niedermann & Sloth (2022); Sabla & Caldwell (2022); Benevento et al. (2022). Once the Hubble rate drops below its effective mass, the field becomes dynamical, rolls down and oscillates around the minimum of its potential. The canonical EDE model features a pseudoscalar (axion-like) field with the following potential:
| (1) |
where and are the EDE mass and decay constant. With this choice of potential, EDE later decays as a fluid with effective equation of state .
The fundamental particle physics parameters and can be traded for the phenomenological parameters and : at redshift , EDE’s fractional contribution to the energy density is maximal and equal to , where is EDE’s energy density, is the Planck mass, and is the Hubble rate. The physics of the EDE model is then governed by four parameters: , , , and the initial misalignment angle , with the initial field value. For simplicity we set , corresponding to the best-fit value reported by Poulin et al. (2019). Increasing reduces , the sound horizon at the drag epoch, and solving the Hubble tension requires .
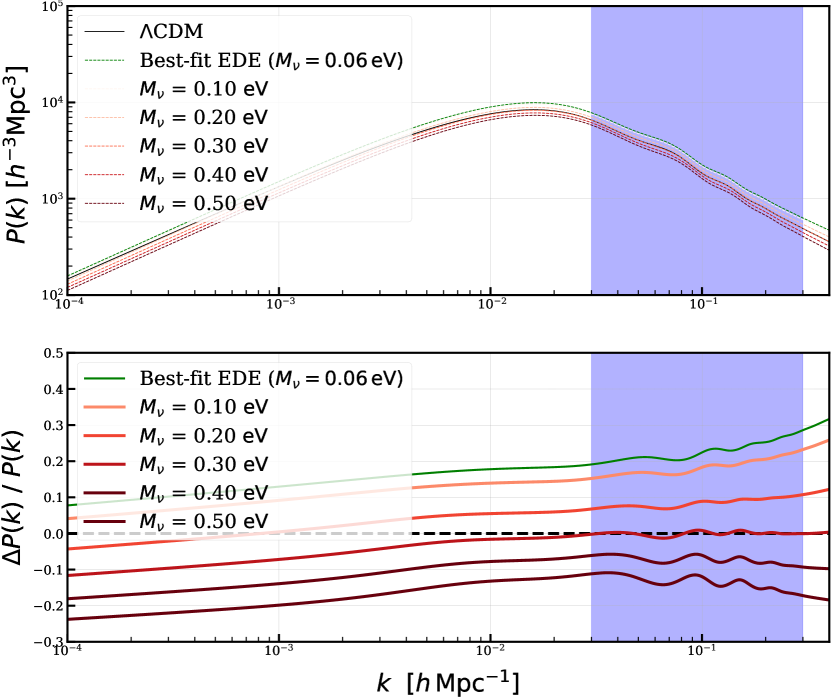
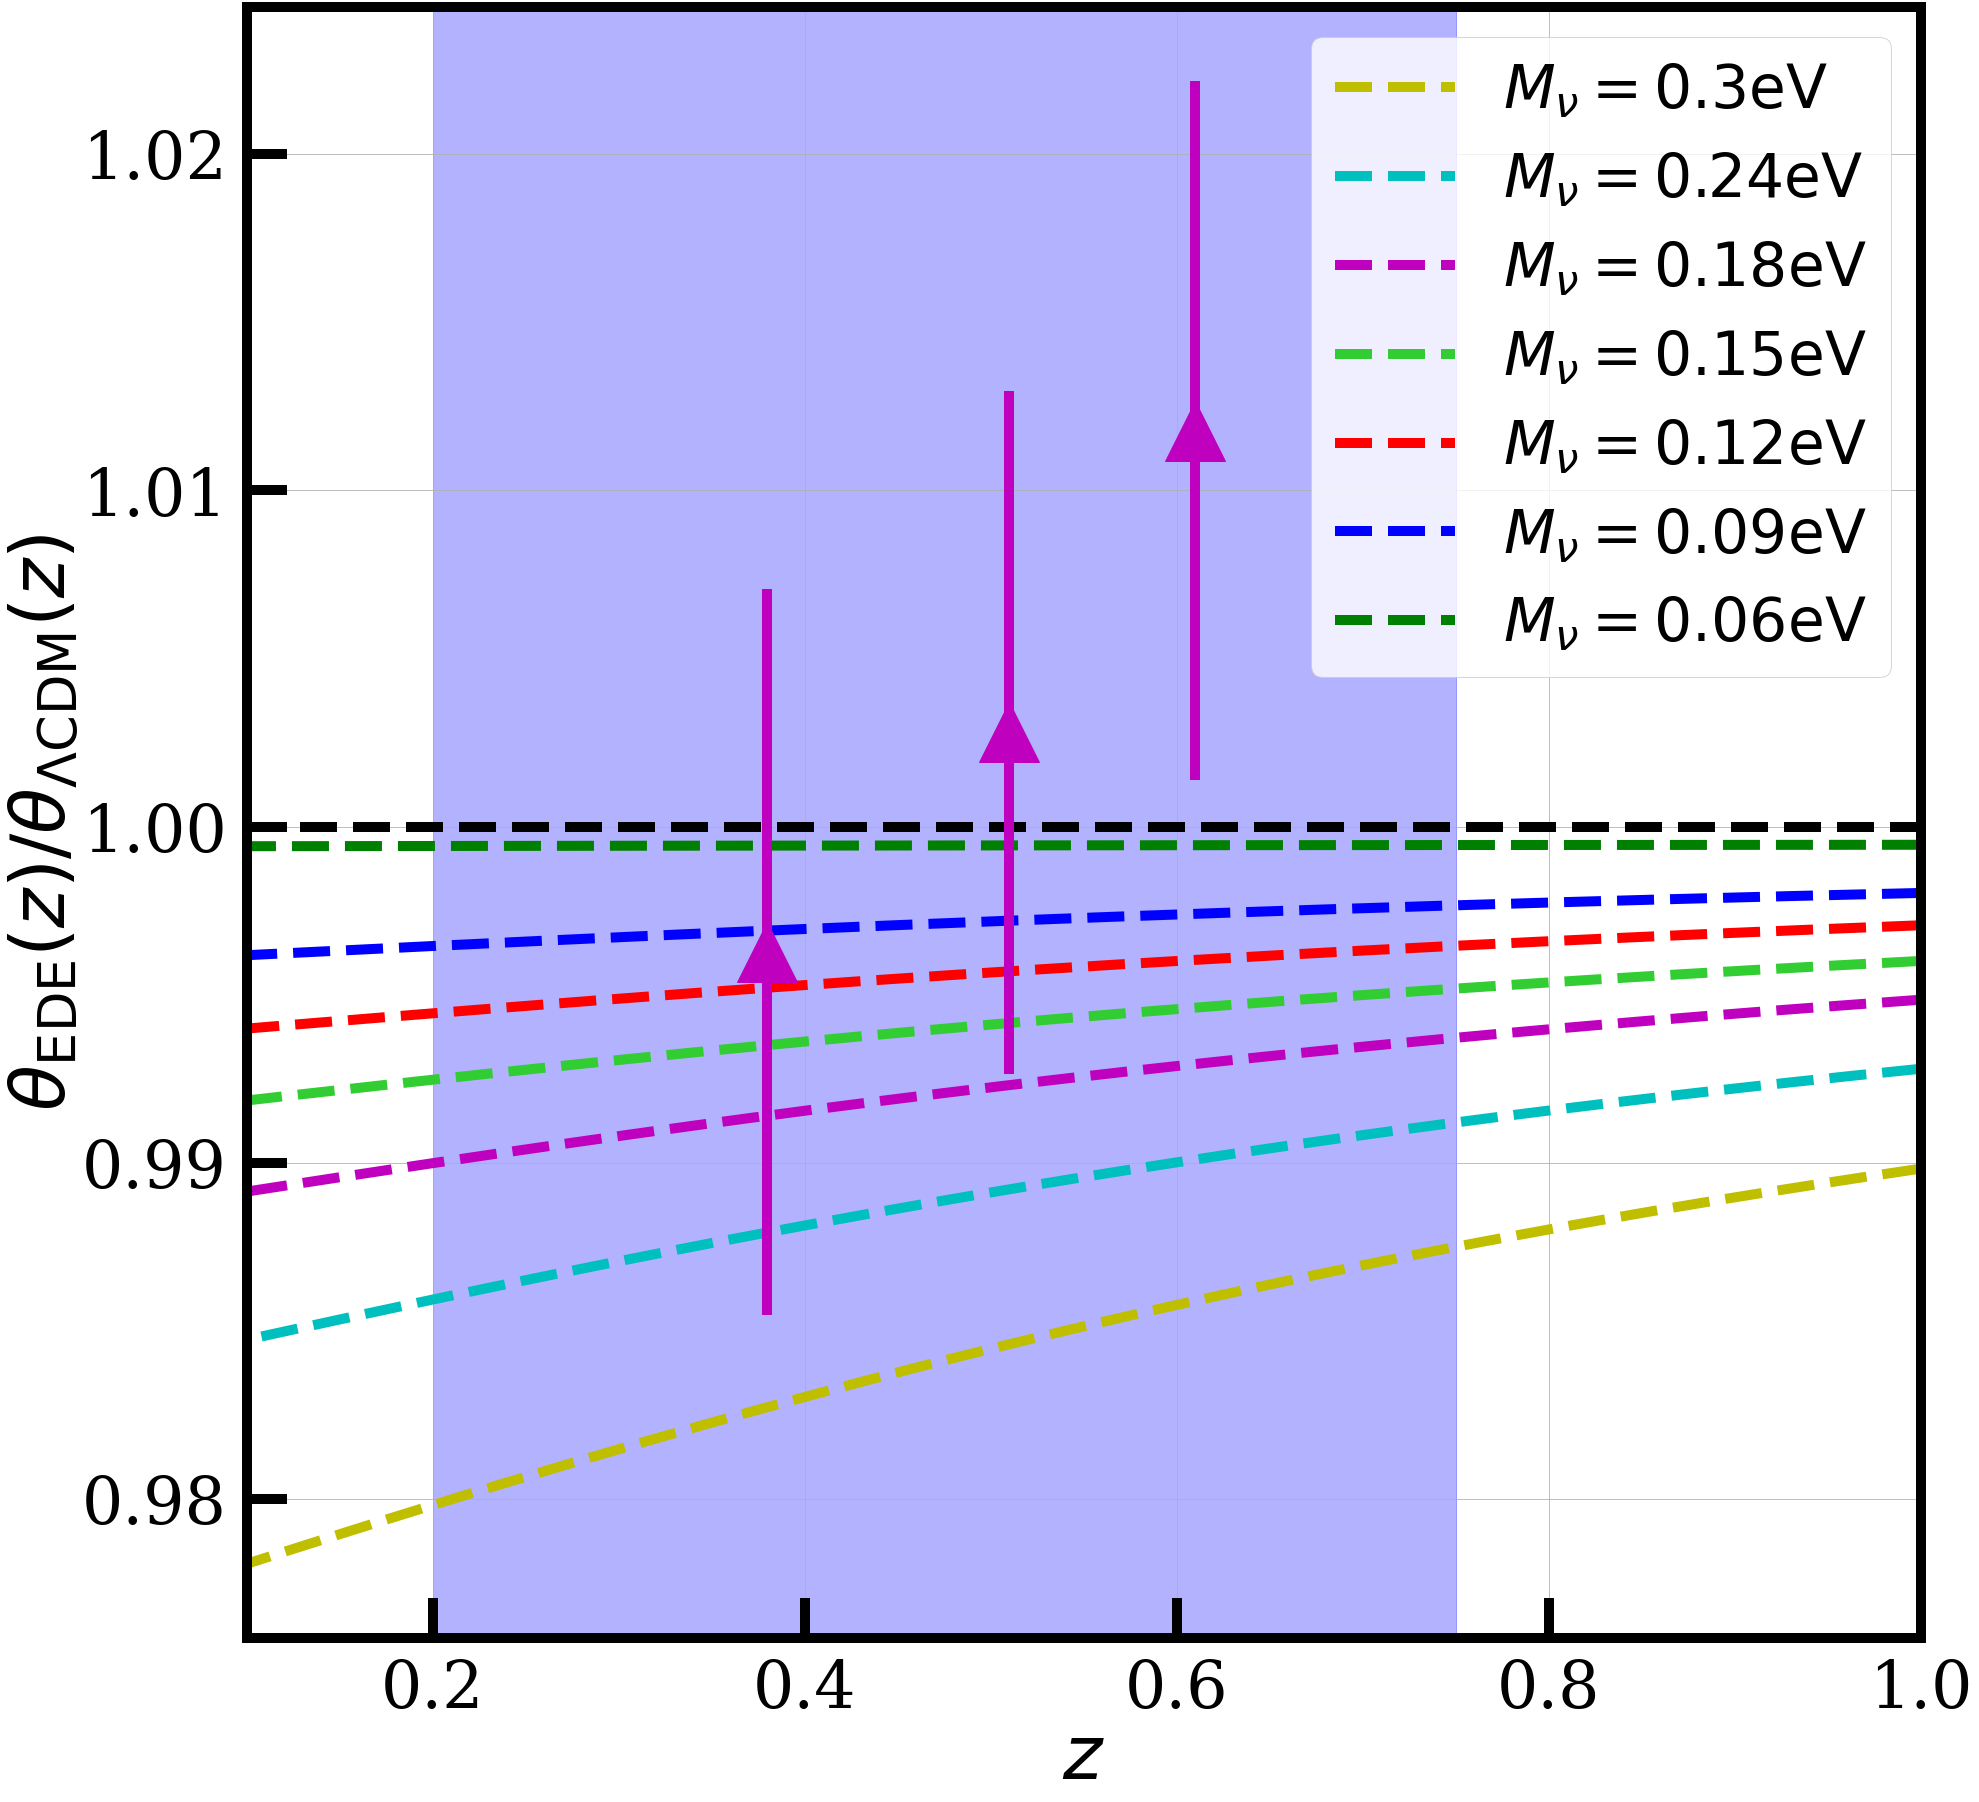
To compensate for the EDE-induced enhancement of the early integrated Sachs-Wolfe (eISW) effect and preserve the fit to the CMB (Vagnozzi, 2021), EDE’s success comes at the significant cost of an increase in the dark matter (DM) density . This boosts the matter power spectrum and raises , worsening the discrepancy present within CDM (see Fig. 1). EDE was thus argued to be disfavored by WL and galaxy clustering data (Hill et al., 2020), although Murgia et al. (2021), Smith et al. (2021), Herold et al. (2022), and Gómez-Valent (2022) argued that this is in part due to prior volume effects (PVEs). 222In the above, the CMB data is from Planck. Mild preferences for EDE have been found from ACT or SPT data, or dropping Planck high- data (Hill et al., 2022; Chudaykin et al., 2020a; Jiang & Piao, 2021; Poulin et al., 2021; La Posta et al., 2022; Jiang & Piao, 2022; Ye et al., 2022; Jiang et al., 2022), but consensus on these results is lacking, due to possible systematics (e.g. Handley & Lemos, 2021; Smith et al., 2022).
A possible remedy is to add extra components absorbing the excess power (e.g. Allali et al., 2021; Ye et al., 2021; Clark et al., 2021). Massive neutrinos are an economical and conservative candidate in this sense as we know oscillation experiments show that at least two neutrino mass eigenstates are massive. Including a free neutrino mass sum (rather than fixing it to the minimum allowed value of as in baseline EDE) can thus be justified invoking only known physics and this inclusion has not been explored in this context so far. Due to their free-streaming nature, massive neutrinos suppress small-scale power (Lesgourgues & Pastor, 2006): Fig. 1 shows how values of can in principle absorb the EDE-induced excess power in a wavenumber range relevant to current surveys. Note that models connecting EDE to neutrinos and predicting high have been studied (Sakstein & Trodden, 2020; Carrillo González et al., 2021), alongside the role of neutrino physics in relation to cosmic tensions (Ilić et al., 2019; Das et al., 2022; Di Valentino & Melchiorri, 2022; Sakr et al., 2022; Chudaykin et al., 2022).
Adding as a free parameter within CDM induces well-known parameter degeneracies at the CMB level: a negative - correlation related to the geometrical degeneracy, and a positive - correlation connected to the CMB lensing amplitude (Vagnozzi et al., 2018; Roy Choudhury & Hannestad, 2020). BAO data partially aid in breaking these degeneracies (especially the - one). At fixed acoustic scale , increasing reduces the BAO angular scale (Hou et al., 2014; Archidiacono et al., 2017; Boyle & Komatsu, 2018), with the volume-averaged distance at the effective redshift .
3 Datasets and methodology
We use Planck 2018 CMB temperature, polarization, and lensing measurements, combining the Plik TTTEEE, lowl, lowE, and lensing likelihoods (Aghanim et al., 2020a). We add the joint pre-reconstruction full-shape (FS) plus post-reconstruction BAO likelihood for the BOSS DR12 galaxies (see Ivanov et al., 2020a; Philcox et al., 2020).333In future work we will study the impact of updates in the modeling of the window function (Beutler & McDonald, 2021). We do not expect a big impact on our constraints, which are driven by the BAO scale. The cross-covariance between FS and BAO is fully taken into account in the likelihood. The FS measurements include both the monopole and quadrupole moments. We do not include a distance ladder prior to not bias towards high values (see also Efstathiou, 2021).
We consider a 10-parameter EDE+ model where, besides the 6 CDM parameters, and 3 EDE parameters (, , and , fixing ) are varied. The neutrino mass spectrum is modelled following the degenerate approximation, sufficiently accurate for the precision of current data (Vagnozzi et al., 2017; Giusarma et al., 2018; Roy Choudhury & Hannestad, 2020; Archidiacono et al., 2020; Tanseri et al., 2022). For comparison, we also consider 3 related models: 9-parameter EDE (), 7-parameter CDM+ (), and the standard 6-parameter CDM.
Theoretical predictions are computed using the EDE-CLASS-PT Boltzmann solver444https://github.com/Michalychforever/EDE_class_pt, itself a merger of CLASS_EDE (Hill et al., 2020) and CLASS-PT (Philcox et al., 2020), themselves both extensions to the Boltzmann solver CLASS (Blas et al., 2011). The underlying galaxy power spectrum model is based on the Effective Field Theory of LSS (EFTofLSS, Baumann et al., 2012), which is the most general, symmetry-driven model for the mildly non-linear clustering of biased tracers of the LSS, accounting for the complex and poorly-known details of short-scale physics which are integrated out.
We follow two analysis methods. We begin with a standard Bayesian analysis, adopting Monte Carlo Markov Chain (MCMC) methods and using the MontePython MCMC sampler (Audren et al., 2013; Brinckmann & Lesgourgues, 2019). We impose the same (flat) priors on the EDE parameters as in Hill et al. (2020), whereas for the EFTofLSS nuisance parameters we follow Philcox et al. (2020). We monitor the convergence of the generated MCMC chains via the Gelman-Rubin parameter Gelman & Rubin (1992), with the chains considered to be converged if (which, we note, is a more stringent requirement than that adopted by several other EDE works). Following the conclusions of Herold et al. (2022); Herold & Ferreira (2022), and the analysis in Ade et al. (2014) for varying neutrino mass sum, we then perform a profile likelihood (PL) analysis in : for a given (fixed) value of , after minimizing the with respect to all other parameters, the PL is given by . We follow the minimization method of Schöneberg et al. (2022), referred to as S21, running a series of MCMCs with decreased temperature and enhanced sensitivity to likelihood differences. For comparison we also use the gradient descent-based Migrad algorithm (James & Roos, 1975), finding that S21 always outperforms it for the EDE model.
4 Results
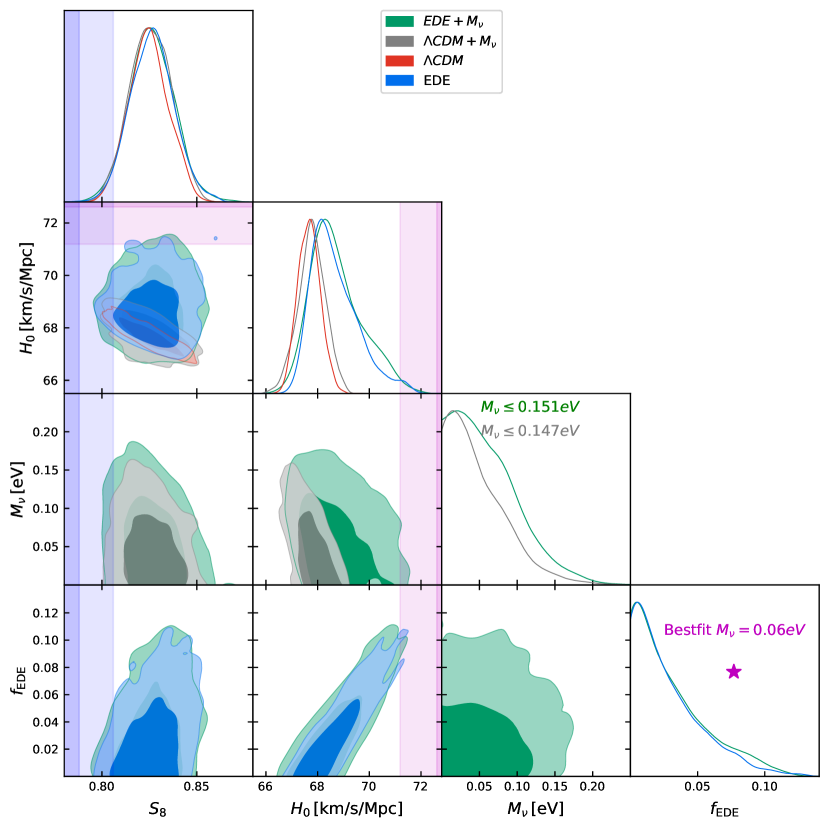
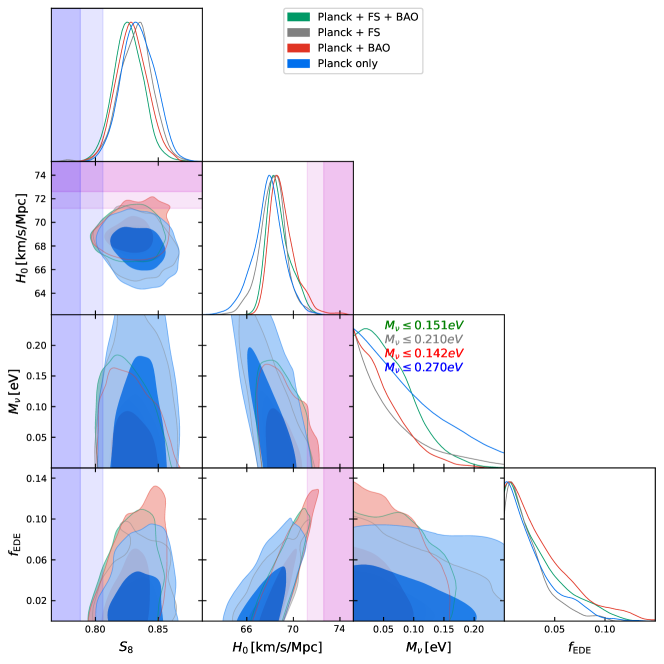
From the Planck+BOSS combination, a Bayesian analysis of the EDE+ model returns the 95% confidence level (C.L.) upper limit . This is only slightly weaker than the corresponding CDM+ limit from the same dataset (), safely excluding the ballpark region required to compensate the EDE enhancement (). This reflects in sub- shifts and slightly broader uncertainties in , , and , compared to their baseline EDE () counterparts [in brackets]: , , , see also Fig. 2. These sub- shifts show that, in a Bayesian setting, freeing does not significantly increase the inferred , with the peak of the posterior still being close to zero.
We then perform a PL analysis, fixing to seven values between and and dissecting each likelihood’s contribution to the total . We aim to identify a) which dataset(s) prevent high values, and b) whether PVEs are playing a role. Smith et al. (2020), Herold et al. (2022), and Gómez-Valent (2022) argued that PVEs play a key role with EDE, as in the limit CDM is recovered, so the likelihood is approximately flat in the and directions. This leads to a larger prior volume in the low region, resulting in a preference for small upon marginalization. The PL is not impacted by these PVEs.
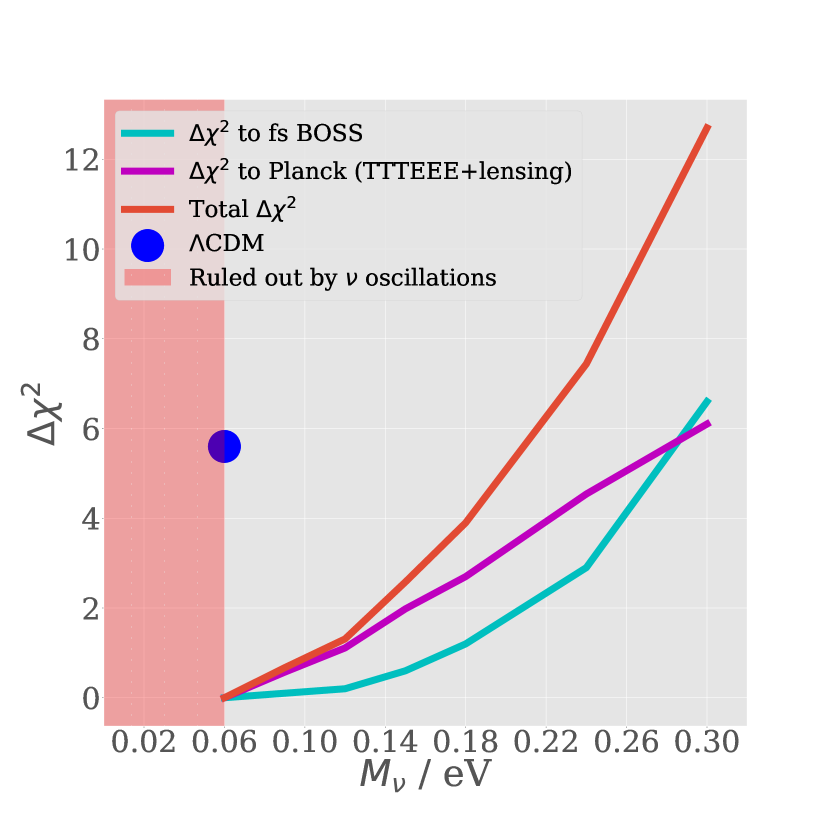
Our PL analysis results are shown in Fig. 3 and Fig. 4. We find that the baseline EDE model () with fits the data best. This has a compared to the baseline CDM model although we have introduced three extra parameters (when fixing ). Following Akaike (1974), we can compute the Akaike information criterion (AIC), a measure of statistical preference for models. It accounts for a differing number of free parameters, penalizing a higher number of free parameters, which does not lead to a sufficient improvement in fit. For a given model it is given by:
| (2) |
where is the number of model parameters, and where a lower AIC indicates a model which is statistically preferred. For the EDE model with we find compared to CDM, indicating a mild statistical preference for CDM despite the overall reduction in . The best-fit for this model is significantly higher than the mean value expected from the Bayesian results for the baseline model with (see also the purple star in Fig. 2) hence we reconfirm the results of Herold et al. (2022); Gómez-Valent (2022) that PVEs could have an impact on the Bayesian constraints of the baseline EDE model. However, even once this effect is accounted for in the PL analysis, there is no evidence of benefit from a raised in the EDE scenario. Lowering to the CDM level within EDE requires (, ). This comes at the cost of a substantially worse fit quality (), clearly disfavouring this model.
The profile likelihood in , broken down into the contributions from the individual datasets in our analysis is shown in the blue and purple lines in Fig. 3 (related information is shown in Fig. 4). We find that the fit to both the Planck TTTEEE + lensing and the BOSS data worsens as is increased. For the Planck data the strong constraining power on is expected (Aghanim et al. (2020b) for CDM). More interestingly, the fit to the BOSS dataset also degrades monotonically with : this suggests that the benefits of increased in the EDE scenario in terms of a reduction in clustering amplitude are being outweighed by an increasing mismatch to the geometric features of the FS spectrum. We find that most of the effect of EDE-induced parameter shifts and on the FS clustering amplitude is re-absorbed by nuisance parameter shifts, as pointed out in Ivanov et al. (2020c) within baseline EDE. The remaining differences in the galaxy power spectrum multipoles are due to a mismatch in the location of the BAO wiggles. Hence, the derived constraints on the EDE+ model are mostly driven by shifts in the BAO scale , rather than the -driven small-scale power suppression (see further discussion in Appendix Appendix B: Data comparisons). In Fig. 5 we show how the fit to the BAO scale gradually worsens as increases, reflecting the increasing trend in the BOSS likelihood .
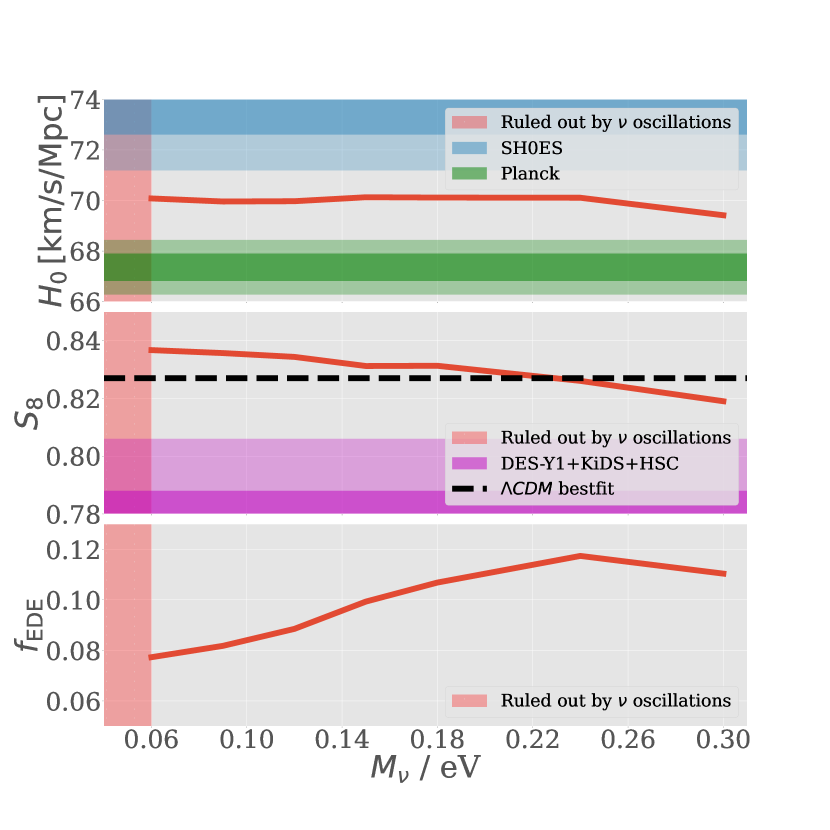
The increase in is accompanied by different parameter shifts as demonstrated in Fig. 4. We find a - correlation which can be understood as follows. Increasing at fixed and results in the expansion rate decreasing relative to a model (see a complete explanation in Hou et al., 2014; Archidiacono et al., 2017), decreasing . In contrast, raising leads to a fractional decrease in which, as a result of the accompanying increase in , results in a larger fractional decrease in . The overall effect is to (re-)increase , as we checked numerically. The net result is that still decreases when increasing and simultaneously, but less so than if we had kept fixed. The extent to which can compensate for the -induced reduction of is strongly limited by the accompanying increase in (compensating the eISW boost), whose effect is similar to that of raising , overall (re-)decreasing . As a result, the best-fit barely shifts when is raised. These arguments easily extend to anisotropic BAO measurements (see also Klypin et al., 2021).See Lattanzi & Gerbino (2018); Vagnozzi (2019); Sakr (2022) for more complete discussions on the effect of massive neutrinos on various cosmological probes.
For the increases more steeply, mostly driven by the BOSS likelihood due to the gradually worsened BAO scale fit. However, remains stable within across the whole range, due to two competing effects: while increasing pulls upwards, increasing lowers it due to the geometrical degeneracy. As discussed earlier, increasing is accompanied by decreases in and .
5 Conclusions
It is well known that introducing early dark energy (EDE) in order to resolve the tension worsens the “ tension”. Our paper re-examines this issue in light of an extension including massive neutrinos, driven by the possibility of their small-scale power suppression counteracting the EDE-induced excess power, which leads to the increase in .
A standard Bayesian analysis of CMB and galaxy clustering data shows that freeing does not increase the inferred , and has no effect on EDE’s standings relative to the and tensions. A frequentist profile likelihood analysis also finds no clear benefits for EDE resulting from a higher , as the best fit is achieved within baseline EDE (), but supports earlier claims of PVEs playing a key role in these Bayesian constraints using BOSS data (Smith et al., 2021; Herold et al., 2022; Gómez-Valent, 2022). Values of lowering to the CDM level are not preferred statistically; a model with worsens the fit by in comparison to baseline EDE. We find a correlation between and , along with the expected negative - correlation. 555As a caveat, we note that the perturbation theory and mode-coupling kernels used in CLASS-PT have been computed assuming an Einstein-de Sitter Universe, whereas here we are including both EDE and neutrino masses: as these new physics contributions do not violate the equivalence principle, this is a reasonable approximation (although one that would need to be refined for future more precise data), see e.g. more complete recent discussions in Sec. IVF of Chudaykin et al. (2020b) and Sec. IIB of Nunes et al. (2022), with similar considerations holding for the IR resummation procedure.
Contrary to initial expectations, our limits are driven not by the full-shape clustering amplitude (re-absorbed by nuisance parameters), but by shifts in the BAO scale . As the clustering amplitude plays a minor role, our analysis is not very sensitive to the benefits of the -driven power suppression. One possible avenue for further work would be to explore the inclusion of WL data or WL-derived priors which, without freeing , appear to slightly decrease the value of and consequently (Herold & Ferreira, 2022); it will be interesting to study whether freeing can improve the consistency of EDE with WL measurements. A related recent paper by some of us, which appeared after ours was posted on arXiv, has derived new PL-based confidence intervals on EDE using additional datasets (including a Gaussian likelihood centered on the of the Dark Energy Survey Year 3 analysis, see Herold & Ferreira, 2022).
Acknowledgements
We thank George Efstathiou, Colin Hill, Eiichiro Komatsu and Oliver Philcox for many useful discussions. S.V. was partially supported by the Isaac Newton Trust and the Kavli Foundation through a Newton-Kavli Fellowship, and by a grant from the Foundation Blanceflor Boncompagni Ludovisi, née Bildt. B.D.S. is supported by the European Research Council (Grant agreement No. 851274) and an STFC Ernest Rutherford Fellowship. The Kavli IPMU is supported by World Premier International Research Center Initiative (WPI), MEXT, Japan.
Data availability
The data underlying this article will be shared upon request to the corresponding author(s).
Appendix A: Frequentist table
We present the full table of frequentist results considering the combination of Planck and BOSS data. Some of this information is displayed graphically in Fig. 3 and Fig. 4.
| Individual best-fit contributions | ||||||||
|---|---|---|---|---|---|---|---|---|
| CDM0.06 | EDE0.06 | EDE0.09 | EDE0.12 | EDE0.15 | EDE0.18 | EDE0.24 | EDE0.3 | |
| BOSS (BAO+FS) | 297.2 | 295.3 | 295.4 | 295.5 | 295.9 | 296.5 | 298.2 | 301.9 |
| Planck TTTEEE | 2345.5 | 2342.6 | 2343.2 | 2343.7 | 2345.1 | 2345.5 | 2347.2 | 2348.3 |
| Planck lowE | 396.3 | 396.1 | 396.4 | 396.8 | 396.5 | 397.0 | 397.3 | 397.7 |
| Planck lowl | 23.2 | 21.9 | 21.7 | 21.5 | 21.3 | 21.2 | 21.1 | 21.1 |
| Planck lensing | 8.8 | 9.47 | 9.34 | 9.18 | 9.15 | 9.07 | 9.01 | 9.07 |
| Total (S21) | 3071.0 | 3065.4 | 3065.9 | 3066.7 | 3067.9 | 3069.3 | 3072.9 | 3078.1 |
| (Migrad) | 3078.6 | 3070.7 | 3072.7 | 3073.0 | 3073.4 | 3076.0 | 3076.5 | 3088.3 |
| Best-fit parameters | ||||||||
| 67.59 | 70.08 | 69.96 | 69.97 | 70.12 | 70.12 | 70.11 | 69.42 | |
| 0.811 | 0.828 | 0.824 | 0.820 | 0.814 | 0.811 | 0.802 | 0.787 | |
| 0.312 | 0.306 | 0.309 | 0.311 | 0.312 | 0.315 | 0.319 | 0.325 | |
| 0.827 | 0.837 | 0.836 | 0.834 | 0.831 | 0.831 | 0.826 | 0.819 | |
| 0.120 | 0.127 | 0.128 | 0.128 | 0.129 | 0.130 | 0.131 | 0.130 | |
| – | 0.077 | 0.082 | 0.089 | 0.099 | 0.107 | 0.117 | 0.117 | |
The full set of frequentist results showing the breakdown of the and parameter shifts is shown in Tab. 1. The baseline results for this work were produced following the minimisation routine of Schöneberg et al. (2022). We checked that Migrad recovers a similar trend, albeit with values consistently higher than S21.
Appendix B: Data comparisons
We checked how different combinations of BOSS data affect the results presented in this analysis. Fig. 6 shows corner plots for different combinations of the datasets we used. There is a clear gain in the constraining power of the data on when moving from Planck alone (blue) to any of the contours that contain BOSS data in addition. However, there is little difference between the Planck+BAO and Planck+BAO+FS constraints, confirming earlier results in the literature (Ivanov et al., 2020b). The most stringent constraint on is obtained when in addition to Planck data we consider the post-reconstruction BAO likelihood (), which suggests that geometric features in BOSS data are what drives the constraints in the full FS+BAO likelihood for which we find (on the other hand from the Planck+FS combination we find the looser constraint ). These results all agree with earlier findings in the literature (see e.g. Ivanov et al., 2020b; Tanseri et al., 2022), confirming that the constraining power for of BOSS data is mostly contained in the geometrical, rather than shape information. This explains the marginal role the amplitude of clustering (as opposed to the position of the BAO peaks) appears to play in our constraints, as discussed throughout the paper. Finally, it is worth pointing out that the FS and combined FS+BAO likelihoods feature seven additional EFTofLSS nuisance parameters compared to the BAO-only likelihood.
References
- Abdalla et al. (2022) Abdalla E., et al., 2022, JHEAp, 34, 49
- Abitbol et al. (2019) Abitbol M. H., et al., 2019, Bull. Am. Astron. Soc., 51, 147
- Addison et al. (2018) Addison G. E., Watts D. J., Bennett C. L., Halpern M., Hinshaw G., Weiland J. L., 2018, Astrophys. J., 853, 119
- Ade et al. (2014) Ade P. A. R., et al., 2014, Astron. Astrophys., 566, A54
- Ade et al. (2019) Ade P., et al., 2019, JCAP, 02, 056
- Aghanim et al. (2020a) Aghanim N., et al., 2020a, Astron. Astrophys., 641, A5
- Aghanim et al. (2020b) Aghanim N., et al., 2020b, Astron. Astrophys., 641, A6
- Agrawal et al. (2019) Agrawal P., Cyr-Racine F.-Y., Pinner D., Randall L., arXiv:1904.01016
- Akaike (1974) Akaike H., 1974, IEEE Transactions on Automatic Control, 19, 716
- Alam et al. (2017) Alam S., et al., 2017, Mon. Not. Roy. Astron. Soc., 470, 2617
- Alexander & McDonough (2019) Alexander S., McDonough E., 2019, Phys. Lett. B, 797, 134830
- Allali et al. (2021) Allali I. J., Hertzberg M. P., Rompineve F., 2021, Phys. Rev. D, 104, L081303
- Archidiacono et al. (2017) Archidiacono M., Brinckmann T., Lesgourgues J., Poulin V., 2017, JCAP, 02, 052
- Archidiacono et al. (2020) Archidiacono M., Hannestad S., Lesgourgues J., 2020, JCAP, 09, 021
- Audren et al. (2013) Audren B., Lesgourgues J., Benabed K., Prunet S., 2013, JCAP, 02, 001
- Aylor et al. (2019) Aylor K., Joy M., Knox L., Millea M., Raghunathan S., Wu W. L. K., 2019, Astrophys. J., 874, 4
- Ballesteros et al. (2020) Ballesteros G., Notari A., Rompineve F., 2020, JCAP, 11, 024
- Baumann et al. (2012) Baumann D., Nicolis A., Senatore L., Zaldarriaga M., 2012, JCAP, 07, 051
- Benevento et al. (2022) Benevento G., Kable J. A., Addison G. E., Bennett C. L., 2022, Astrophys. J., 935, 156
- Bernal et al. (2016) Bernal J. L., Verde L., Riess A. G., 2016, JCAP, 10, 019
- Beutler & McDonald (2021) Beutler F., McDonald P., 2021, JCAP, 11, 031
- Blas et al. (2011) Blas D., Lesgourgues J., Tram T., 2011, JCAP, 07, 034
- Boyle & Komatsu (2018) Boyle A., Komatsu E., 2018, JCAP, 03, 035
- Braglia et al. (2020a) Braglia M., Ballardini M., Emond W. T., Finelli F., Gumrukcuoglu A. E., Koyama K., Paoletti D., 2020a, Phys. Rev. D, 102, 023529
- Braglia et al. (2020b) Braglia M., Emond W. T., Finelli F., Gumrukcuoglu A. E., Koyama K., 2020b, Phys. Rev. D, 102, 083513
- Braglia et al. (2021) Braglia M., Ballardini M., Finelli F., Koyama K., 2021, Phys. Rev. D, 103, 043528
- Brinckmann & Lesgourgues (2019) Brinckmann T., Lesgourgues J., 2019, Phys. Dark Univ., 24, 100260
- Carrillo González et al. (2021) Carrillo González M., Liang Q., Sakstein J., Trodden M., 2021, JCAP, 04, 063
- Chudaykin et al. (2020a) Chudaykin A., Gorbunov D., Nedelko N., 2020a, JCAP, 08, 013
- Chudaykin et al. (2020b) Chudaykin A., Ivanov M. M., Philcox O. H. E., Simonović M., 2020b, Phys. Rev. D, 102, 063533
- Chudaykin et al. (2022) Chudaykin A., Gorbunov D., Nedelko N., arXiv:2203.03666
- Clark et al. (2021) Clark S. J., Vattis K., Fan J., Koushiappas S. M., arXiv:2110.09562
- D’Amico et al. (2021) D’Amico G., Senatore L., Zhang P., Zheng H., 2021, JCAP, 05, 072
- Das et al. (2022) Das S., Maharana A., Poulin V., Sharma R. K., 2022, Phys. Rev. D, 105, 103503
- Di Valentino & Bridle (2018) Di Valentino E., Bridle S., 2018, Symmetry, 10, 585
- Di Valentino & Melchiorri (2022) Di Valentino E., Melchiorri A., 2022, Astrophys. J. Lett., 931, L18
- Di Valentino et al. (2021) Di Valentino E., et al., 2021, Class. Quant. Grav., 38, 153001
- Efstathiou (2020) Efstathiou G., arXiv:2007.10716
- Efstathiou (2021) Efstathiou G., 2021, Mon. Not. Roy. Astron. Soc., 505, 3866
- Freedman et al. (2019) Freedman W. L., et al., 2019, Astrophys. J., 882, 34
- Freese & Winkler (2021) Freese K., Winkler M. W., 2021, Phys. Rev. D, 104, 083533
- Gelman & Rubin (1992) Gelman A., Rubin D. B., 1992, Statistical Science, 7, 457
- Giusarma et al. (2018) Giusarma E., Vagnozzi S., Ho S., Ferraro S., Freese K., Kamen-Rubio R., Luk K.-B., 2018, Phys. Rev. D, 98, 123526
- Gogoi et al. (2021) Gogoi A., Sharma R. K., Chanda P., Das S., 2021, Astrophys. J., 915, 132
- Gómez-Valent (2022) Gómez-Valent A., 2022, Phys. Rev. D, 106, 063506
- Guo et al. (2019) Guo R.-Y., Zhang J.-F., Zhang X., 2019, JCAP, 02, 054
- Handley & Lemos (2021) Handley W., Lemos P., 2021, Phys. Rev. D, 103, 063529
- Herold & Ferreira (2022) Herold L., Ferreira E. G. M., arXiv:2210.16296
- Herold et al. (2022) Herold L., Ferreira E. G. M., Komatsu E., 2022, Astrophys. J. Lett., 929, L16
- Hill et al. (2020) Hill J. C., McDonough E., Toomey M. W., Alexander S., 2020, Phys. Rev. D, 102, 043507
- Hill et al. (2022) Hill J. C., et al., 2022, Phys. Rev. D, 105, 123536
- Hou et al. (2014) Hou Z., et al., 2014, Astrophys. J., 782, 74
- Ilić et al. (2019) Ilić S., Sakr Z., Blanchard A., 2019, Astron. Astrophys., 631, A96
- Ivanov et al. (2020a) Ivanov M. M., Simonović M., Zaldarriaga M., 2020a, JCAP, 05, 042
- Ivanov et al. (2020b) Ivanov M. M., Simonović M., Zaldarriaga M., 2020b, Phys. Rev. D, 101, 083504
- Ivanov et al. (2020c) Ivanov M. M., McDonough E., Hill J. C., Simonović M., Toomey M. W., Alexander S., Zaldarriaga M., 2020c, Phys. Rev. D, 102, 103502
- James & Roos (1975) James F., Roos M., 1975, Comput. Phys. Commun., 10, 343
- Jiang & Piao (2021) Jiang J.-Q., Piao Y.-S., 2021, Phys. Rev. D, 104, 103524
- Jiang & Piao (2022) Jiang J.-Q., Piao Y.-S., 2022, Phys. Rev. D, 105, 103514
- Jiang et al. (2022) Jiang J.-Q., Ye G., Piao Y.-S., arXiv:2210.06125
- Karwal & Kamionkowski (2016) Karwal T., Kamionkowski M., 2016, Phys. Rev. D, 94, 103523
- Karwal et al. (2022) Karwal T., Raveri M., Jain B., Khoury J., Trodden M., 2022, Phys. Rev. D, 105, 063535
- Khosravi & Farhang (2022) Khosravi N., Farhang M., 2022, Phys. Rev. D, 105, 063505
- Klypin et al. (2021) Klypin A., et al., 2021, Mon. Not. Roy. Astron. Soc., 504, 769
- Knox & Millea (2020) Knox L., Millea M., 2020, Phys. Rev. D, 101, 043533
- Krishnan et al. (2020) Krishnan C., Colgáin E. O., Ruchika Sen A. A., Sheikh-Jabbari M. M., Yang T., 2020, Phys. Rev. D, 102, 103525
- La Posta et al. (2022) La Posta A., Louis T., Garrido X., Hill J. C., 2022, Phys. Rev. D, 105, 083519
- Lattanzi & Gerbino (2018) Lattanzi M., Gerbino M., 2018, Front. in Phys., 5, 70
- Lemos et al. (2019) Lemos P., Lee E., Efstathiou G., Gratton S., 2019, Mon. Not. Roy. Astron. Soc., 483, 4803
- Lesgourgues & Pastor (2006) Lesgourgues J., Pastor S., 2006, Phys. Rept., 429, 307
- Lin et al. (2019) Lin M.-X., Benevento G., Hu W., Raveri M., 2019, Phys. Rev. D, 100, 063542
- Mörtsell & Dhawan (2018) Mörtsell E., Dhawan S., 2018, JCAP, 09, 025
- Mortsell et al. (2022) Mortsell E., Goobar A., Johansson J., Dhawan S., 2022, Astrophys. J., 933, 212
- Murgia et al. (2021) Murgia R., Abellán G. F., Poulin V., 2021, Phys. Rev. D, 103, 063502
- Niedermann & Sloth (2021) Niedermann F., Sloth M. S., 2021, Phys. Rev. D, 103, L041303
- Niedermann & Sloth (2022) Niedermann F., Sloth M. S., 2022, Phys. Rev. D, 105, 063509
- Nojiri et al. (2021) Nojiri S., Odintsov S. D., Saez-Chillon Gomez D., Sharov G. S., 2021, Phys. Dark Univ., 32, 100837
- Nunes & Vagnozzi (2021) Nunes R. C., Vagnozzi S., 2021, Mon. Not. Roy. Astron. Soc., 505, 5427
- Nunes et al. (2022) Nunes R. C., Vagnozzi S., Kumar S., Di Valentino E., Mena O., 2022, Phys. Rev. D, 105, 123506
- Oikonomou (2021) Oikonomou V. K., 2021, Phys. Rev. D, 103, 044036
- Perivolaropoulos & Skara (2022) Perivolaropoulos L., Skara F., 2022, New Astron. Rev., 95, 101659
- Philcox et al. (2020) Philcox O. H. E., Ivanov M. M., Simonović M., Zaldarriaga M., 2020, JCAP, 05, 032
- Poulin et al. (2019) Poulin V., Smith T. L., Karwal T., Kamionkowski M., 2019, Phys. Rev. Lett., 122, 221301
- Poulin et al. (2021) Poulin V., Smith T. L., Bartlett A., 2021, Phys. Rev. D, 104, 123550
- Riess et al. (2022) Riess A. G., et al., 2022, Astrophys. J. Lett., 934, L7
- Roy Choudhury & Hannestad (2020) Roy Choudhury S., Hannestad S., 2020, JCAP, 07, 037
- Sabla & Caldwell (2022) Sabla V. I., Caldwell R. R., 2022, Phys. Rev. D, 106, 063526
- Sakr (2022) Sakr Z., 2022, Universe, 8, 284
- Sakr et al. (2022) Sakr Z., Ilic S., Blanchard A., 2022, Astron. Astrophys., 666, A34
- Sakstein & Trodden (2020) Sakstein J., Trodden M., 2020, Phys. Rev. Lett., 124, 161301
- Schöneberg et al. (2022) Schöneberg N., Franco Abellán G., Pérez Sánchez A., Witte S. J., Poulin V., Lesgourgues J., 2022, Phys. Rept., 984, 1
- Smith et al. (2020) Smith T. L., Poulin V., Amin M. A., 2020, Phys. Rev. D, 101, 063523
- Smith et al. (2021) Smith T. L., Poulin V., Bernal J. L., Boddy K. K., Kamionkowski M., Murgia R., 2021, Phys. Rev. D, 103, 123542
- Smith et al. (2022) Smith T. L., Lucca M., Poulin V., Abellan G. F., Balkenhol L., Benabed K., Galli S., Murgia R., 2022, Phys. Rev. D, 106, 043526
- Tanseri et al. (2022) Tanseri I., Hagstotz S., Vagnozzi S., Giusarma E., Freese K., 2022, JHEAp, 36, 1
- Vagnozzi (2019) Vagnozzi S., arXiv:1907.08010
- Vagnozzi (2020) Vagnozzi S., 2020, Phys. Rev. D, 102, 023518
- Vagnozzi (2021) Vagnozzi S., 2021, Phys. Rev. D, 104, 063524
- Vagnozzi et al. (2017) Vagnozzi S., Giusarma E., Mena O., Freese K., Gerbino M., Ho S., Lattanzi M., 2017, Phys. Rev. D, 96, 123503
- Vagnozzi et al. (2018) Vagnozzi S., Dhawan S., Gerbino M., Freese K., Goobar A., Mena O., 2018, Phys. Rev. D, 98, 083501
- Ye & Piao (2020) Ye G., Piao Y.-S., 2020, Phys. Rev. D, 101, 083507
- Ye et al. (2021) Ye G., Zhang J., Piao Y.-S., arXiv:2107.13391
- Ye et al. (2022) Ye G., Jiang J.-Q., Piao Y.-S., 2022, Phys. Rev. D, 106, 103528
- Zumalacarregui (2020) Zumalacarregui M., 2020, Phys. Rev. D, 102, 023523