22email: {aberengu,tmukherj,mnbossa,ndeligia,hsahli}@etrovub.be
Representation Learning with Information Theory for COVID-19 Detection
Abstract
Successful data representation is a fundamental factor in machine learning based medical imaging analysis. Deep Learning (DL) has taken an essential role in robust representation learning. However, the inability of deep models to generalize to unseen data can quickly overfit intricate patterns. Thereby, we can conveniently implement strategies to aid deep models in discovering useful priors from data to learn their intrinsic properties. Our model, which we call a dual role network (DRN), uses a dependency maximization approach based on Least Squared Mutual Information (LSMI). LSMI leverages dependency measures to ensure representation invariance and local smoothness. While prior works have used information theory dependency measures like mutual information, these are known to be computationally expensive due to the density estimation step. In contrast, our proposed DRN with LSMI formulation does not require the density estimation step and can be used as an alternative to approximate mutual information. Experiments on the CT based COVID-19 Detection and COVID-19 Severity Detection benchmarks of the 2nd COV19D competition [16] demonstrate the effectiveness of our method compared to the baseline method of such competition.
1 Introduction
Reverse transcription polymerase chain reaction (RT-PCR) is a widely used screening method and currently adopted as the standard diagnostic method for suspected COVID-19 cases. Accounting for the high false positives in RT-PCR tests, readily available medical imaging methods, such as chest computed tomography (CT) have been advocated as a possibility to identify COVID-19 patients [38, 5, 9]. Deep learning (DL) has demonstrated impressive results in COVID-19 detection from CT [10]. However, performance generally depends on the prevalence of confounding lung pathologies within the patient cohort. Diseases such as community-acquired pneumonia or influenza have roughly similar visual manifestations in chest CT volumes, which increases the challenges for accurately detecting COVID-19. In addition, the COVID-19 Positives can have different degrees of infection severity. For example, higher severity is usually consistent with increased regions of multifocal and bilateral ground-glass opacities and consolidations [29]. Detecting different degrees of COVID-19 severity entails learning robust feature representations. This situation motivates researchers to apply strategies to enhance feature representations for effectively discriminating between COVID-19 Positives and COVID-19 Negatives, as well as for detecting the COVID-19 severity.
Tarvainen and Valpola [36] suggested that consistency regularization guides the two networks of the mean teacher model to adaptively correct their training errors and attain consistent predictions by improving each other feature representations. Consistency regularization has been widely used to learn meaningful feature representations [31, 7, 26]. For instance, in semi-supervised learning (SSL), consistency regularization based methods have proven useful in improving representation learning by harnessing unlabeled data [6, 8, 32, 24, 30, 23]. However, while successful, consistency based methods ignore the structure across different volumes and might impose incoherent consistency [27].
Mutual information (MI) based representation learning [14, 11] methods have been getting attention due to their ability to learn representations that can be employed for further downstream tasks. Though they have achieved promising results, MI estimation is computationally expensive due to the density estimation step. In this work, we argue that maximizing the mutual information on the latent space of DRN, which uses as input perturbated views of the same image, enhances the representations of intricate patterns to boost the ability of deep models to generalize to unseen data. In particular, we propose to use the least squared mutual information (LSMI) [34], a powerful density ratio method that has found applications across various domains in machine learning. Our contributions are:
-
•
We propose to use a dependency estimation regularization on the latent space and call our model dual role network (DRN). Our proposal involves a loss function that combines the supervised objective with consistency regularization and LSMI to ensure consistency across predictions and MI maximization on nonlinear projections of the DRN latent space.
-
•
We evaluate the proposed model on the COVID-19 Detection and COVID19 Severity Detection tasks.
2 Background and Proposed Method
In this section, we provide an overview of our method. While we are motivated by the COVID-19 Detection and COVID-19 Severity Detection problems, this method can be generalized across different medical imaging tasks.
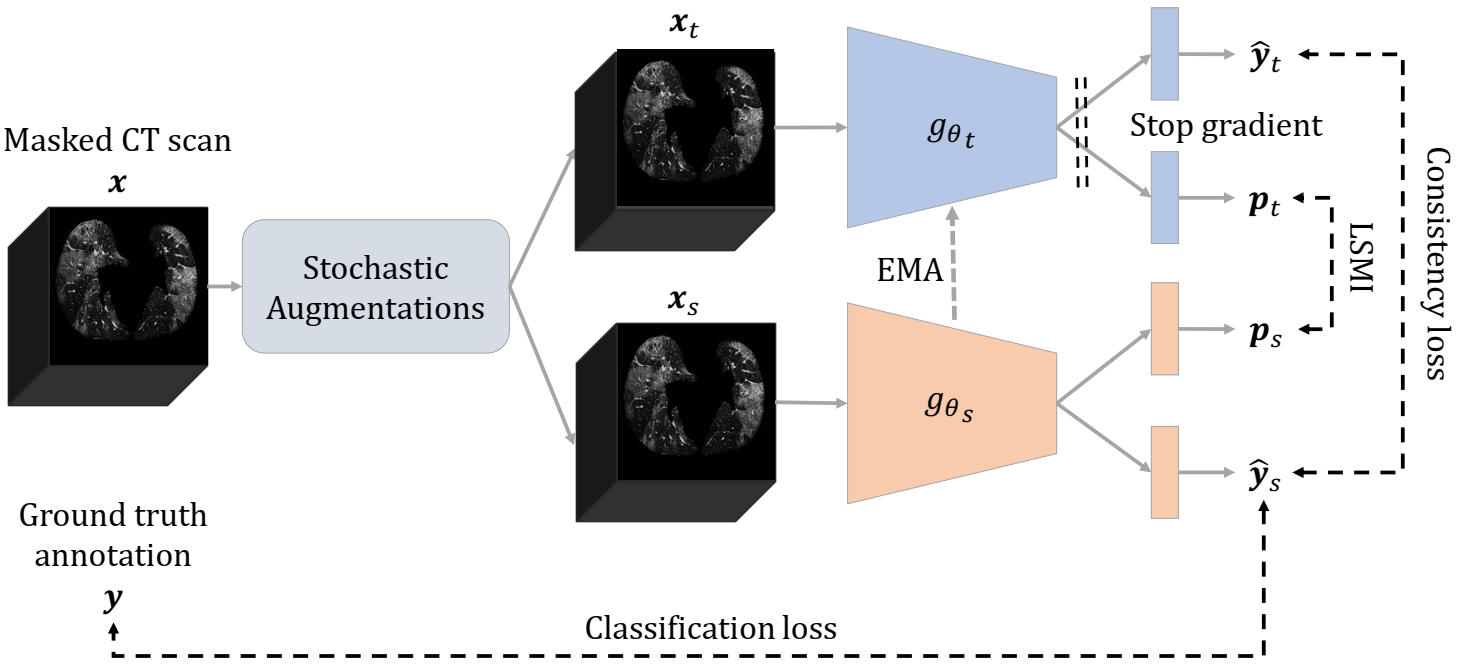
Fig. 1 provides a schema of the proposed method. Given an input masked chest CT scan , and its corresponding annotation label , we carry out a set of stochastic perturbations on to obtain two different views of the input instance, denoted as and . Subsequently, we train two networks and and encourage their output to consistently match. Both the networks share the same backbone architecture (ConvNeXt [25] in this work), but these are parameterized by and , respectively. During training, we optimize the parameters via backpropagation while are updated using exponential moving average (EMA):
| (1) |
where is the network decay rate coefficient and is the training step. One can notice that the teacher network operates like model ensembling with average exponential decay that have demonstrated usefulness to boost models performance [28].
To ensure learning robust feature representations, we equip both networks with a projection head on top of the last hidden layer that outputs the latent code used by the classification head. The outcomes of this construction are two. One head outputs for the mainstream predictions concerning the COVID-19 Detection tasks (i.e., COVID-19 Detection and COVID-19 Severity Detection). The second head outputs a -dimensional projection of the feature representation resulting from the last hidden layer, defined as . The projection heads are multilayer perceptrons with two linear layers followed by layer normalization and GELU.
To optimize , we use the following loss function:
| (2) |
where is the cross-entropy loss between the output, , and the ground truth label . The output of the two classification heads are and . is the mean squared error (MSE) and is the LSMI regularizer between the ouput from projection heads, and . For one can also use KL-divergence, and related information theoretic measures. and are hyper-parameters to control the contribution of the different regularizers.
2.1 Dependence Measure
In this work we use least squared loss mutual information (LSMI) as a dependence measure. LSMI is an -divergence [2], that is a non-negative measure and is zero only if the random variables are independent. Furthermore, to the best of our knowledge, there has not been previous work combining deep models with LSMI as a representation learning metric. To estimate LSMI we take a direct density ratio estimation approach [35]. This leads [39, 40] to the estimator:
where is the trace operator, is the Gram matrix for and is the Gram matrix for , and is the model parameter written by [35]:
where is a regularizer, and we use the Gaussian kernel:
where and are the Gaussian width.
Most dependency metrics based on -divergence require a kernel density estimator (KDE) step to calculate the numerator and denominator, corresponding to the joint probability and the product of its marginals [33]. However, the KDE estimation can be hard to implement and ineffective in practise [13]. To avoid the KDE estimation, an alternative approach involves estimation of the required quantities using -nearest neighbor (KNN) samples [22]. KNN approach was demonstrated to be better than KDE [15]. However, it requires one to choose an appropriate , which might not be straightforward.
LSMI estimator involves simple steps of using linear equations which makes LSMI computationally efficient. Our experiments on using LSMI prove and demonstrate its usefulness as an appropriate measure.
3 Experimental Results
3.1 Datasets Description
We conducted the experiments to validate the effectiveness of our model on the COVID19-CT-Database (COV19-CT-DB) [20, 21, 17, 19, 18, 16]. This dataset is provided to benchmark the models on the 2nd COV19D Competition of the ECCV2022 Workshop: AI-enabled Medical Image Analysis – Digital Pathology & Radiology/COVID19.
COVID-19 Detection Benchmark. The training set involves chest Computer Tomography (CT) scans: are COVID-19 Positives cases, and are COVID-19 Negatives cases. The validation set has a total of CT scans: COVID-19 Positives, and COVID-19 Negatives cases, respectively. Experienced radiologists made the annotations of the CT scans with about degree of agreement [17, 18, 16], which makes the COV19-CT-DB appealing to validate our methods because it was not built-up using RT-PCR results as ground truth labels. Further information on the dataset is available in [16].
COVID-19 Severity Detection Benchmark. The training set for severity detection comprises CT scans: are Mild severity, are Moderate severity, are Severe severity, and are Critical severity. The validation set has a total of CT scans: with Mild severity, Moderate severity, Severe severity, and as Critical severity. For more information about this dataset description, readers are referred to [16].
In addition to the data provided for the 2nd COV19D Competition, we used the publicly available111https://stoic2021.grand-challenge.org/ STOIC dataset to pretrain the backbone used in our model. The STOIC dataset consists of CT scans randomly selected from a cohort of subjects suspected of being COVID-19 Positives. The PCR of these subjects is provided, enabling us with COVID-19 Positives and COVID-19 Negatives subjects. We randomly split the data with stratification into training and validation. Finally, to pretrain our ConvNeXt backbone, we employed COVID-19 Positives and COVID-19 Negatives subjects in training, with COVID-19 Positives and COVID-19 Negatives used for validation.
3.2 Implementation and Training Details
We implemented our proposal using Pytorch222https://pytorch.org/ upon the PyTorch Image Models [37]. Altougth our method is backbone agnostic, in this implementation we adopt ConvNeXt [25]. To cope with the CT scans for COVID-19 Detection and severity, we extended the ConvNeXt [25] to 3D ConvNeXt to harness the spatial information within adjacent slices. Besides, we inflated the weights from the 2D ConvNeXt-B pre-trained on ImageNet to initialize the learning parameters. We also employed the U-net [12] to extract the lung masks from the CT scans to remove non-lung information. Hounsfield units were clipped to the intensity window and normalized to the range . The masked CT scans were subsequently rezized to .
We trained the models with AdamW during epoch and early stoping equal epochs. Following [25], we also used layer scale with initial value of . We linearly ramped up the learning rate during epochs to , subsequently cosine decaying schedule is used. The weight decay is also scheduled to go from to following a cosine schedule. The EMA decay, , is equal to . We also used stochastic drop lenght equal to . Besides, we employed label smoothing equal to . The consistency and constrastive costs were set equal to and , with a linear ramp up during the first epochs. To find these values we used the Tree-structured Parzen Estimator algorithms [4, 3] from Optuna333https://optuna.readthedocs.io/en/stable/index.html [1]. The values for and proved to have high impact on the performance of the proposed model. As a general rule, we found that good combinations are with , , and . The dimension, , of the projection vectors and is . We used Monai444https://monai.io/ to apply images transformations and the stochastic augmentations cosisting of Gaussian smoothness, constrast adjustment, random zooming and intensity shifting.
3.3 COVID-19 Detection
| Model |
|
|
|
Macro F1-score | |||||||||
| CE | MSE | InfoMax | KL | LSMI | JSD | ||||||||
| DRN-MSE-InfoMax | ✓ | ✓ | ✓ | ✗ | ✗ | ✗ | |||||||
| DRN-MSE-KL | ✓ | ✓ | ✗ | ✓ | ✗ | ✗ | |||||||
| DRN-MSE-JSD | ✓ | ✓ | ✗ | ✗ | ✓ | ✗ | |||||||
| DRN-MSE-LSMI | ✓ | ✓ | ✗ | ✗ | ✗ | ✓ | |||||||
We summarize the results of our DRN with consistency regularization and various information theory loss terms in Table 1. We use KL, InfoMax, JSD, and LSMI to assess their impact on the effectiveness of our model in coping with the COVID-19 Detection task. One can notice that our DRN combining consistency regularization and MI maximization is favorable to boosting the performance of deep models in COVID-19 Detection. Furthermore, LSMI regularization (DRN-MSE-LSMI) yielded the best Macro F1 score compared to InfoMax, KL and JSD. All the variants summarized in Table 1 outperformed the baseline of the COVID-19 Detection benchmark [16] whose Macro F1 score was reported equal to . Our outcomes support that contrastive learning can be considered as performing maximization of MI to learn representations of data properties beneficial for the mainstream task. The results also suggest that LSMI, used as a representation learning metric, has appealing advantages over other -divergences to reduce the discrepancy between two probability distributions with similar underlying factors while keeping their “relevant” information to improve deep models’ discriminative ability.
3.4 COVID-19 Severity Detection
In Table 2 we report the results of our DRN with consistency regularization and different dependency measures, i.e., KL, InfoMax, JSD, and LSMI, to evaluate their impact on the performance of COVID-19 Severity Detection. Similar to the trend exhibited by our DRN in the above section, combining the consistency regularization and the LSMI (DRN-MSE-LSMI) for MI maximization achieved the best Macro F1 score on the COVID-19 Severity Detection task. Our DRN also attained superior results compared to the Macro F1 score of corresponding to the baseline for COVID-19 Severity Detection benchmark [16]. The experimental results on the COVID-19 Severity Detection task also support the advantages of using LSMI for deep representation learning based on information theory.
| Model |
|
|
|
Macro F1-score | |||||||||
| CE | MSE | InfoMax | KL | LSMI | JSD | ||||||||
| DRN-MSE-InfoMax | ✓ | ✓ | ✓ | ✗ | ✗ | ✗ | |||||||
| DRN-MSE-KL | ✓ | ✓ | ✗ | ✓ | ✗ | ✗ | |||||||
| DRN-MSE-JSD | ✓ | ✓ | ✗ | ✗ | ✗ | ✓ | |||||||
| DRN-MSE-LSMI | ✓ | ✓ | ✗ | ✗ | ✗ | ✓ | |||||||
4 Conclusions
We presented a representation learning method using information theory for COVID-19 Detection and COVID-19 Severity Detection. The proposed estimator is non-parametric and does not require density estimation, unlike traditional MI based methods. Experiments demonstrate the effectiveness of our proposal. We found that DRN with Squared Mutual Information for enhancing representation learning encourages the dual networks to achieve adequate results. Our future work will study the effects of our choices for stochastic augmentations.
References
- [1] Akiba, T., Sano, S., Yanase, T., Ohta, T., Koyama, M.: Optuna: A next-generation hyperparameter optimization framework. In: Proceedings of the 25th ACM SIGKDD international conference on knowledge discovery & data mining. pp. 2623–2631 (2019)
- [2] Ali, S.M., Silvey, S.D.: A general class of coefficients of divergence of one distribution from another. Journal of the Royal Statistical Society. Series B (Methodological) 28(1), 131–142 (1966), http://www.jstor.org/stable/2984279
- [3] Bergstra, J., Bardenet, R., Bengio, Y., Kégl, B.: Algorithms for hyper-parameter optimization. Advances in neural information processing systems 24 (2011)
- [4] Bergstra, J., Yamins, D., Cox, D.: Making a science of model search: Hyperparameter optimization in hundreds of dimensions for vision architectures. In: International conference on machine learning. pp. 115–123. PMLR (2013)
- [5] Bernheim, A., Mei, X., Huang, M., Yang, Y., Fayad, Z.A., Zhang, N., Diao, K., Lin, B., Zhu, X., Li, K., Li, S., Shan, H., Jacobi, A., Chung, M.: Chest ct findings in coronavirus disease-19 (covid-19): Relationship to duration of infection. Radiology 295(3), 200463 (2020)
- [6] Bortsova, G., Dubost, F., Hogeweg, L., Katramados, I., Bruijne, M.d.: Semi-supervised medical image segmentation via learning consistency under transformations. In: International Conference on Medical Image Computing and Computer-Assisted Intervention. pp. 810–818. Springer (2019)
- [7] Chen, X., Lian, C., Wang, L., Deng, H., Kuang, T., Fung, S., Gateno, J., Yap, P.T., Xia, J.J., Shen, D.: Anatomy-regularized representation learning for cross-modality medical image segmentation. IEEE transactions on medical imaging 40(1), 274–285 (2020)
- [8] Cui, W., Liu, Y., Li, Y., Guo, M., Li, Y., Li, X., Wang, T., Zeng, X., Ye, C.: Semi-supervised brain lesion segmentation with an adapted mean teacher model. In: International Conference on Information Processing in Medical Imaging. pp. 554–565. Springer (2019)
- [9] Dong, D., Tang, Z., Wang, S., Hui, H., Gong, L., Lu, Y., Xue, Z., Liao, H., Chen, F., Yang, F., Jin, R., Wang, K., Liu, Z., Wei, J., Mu, W., Zhang, H., Jiang, J., Tian, J., Li, H.: The role of imaging in the detection and management of covid-19: A review. IEEE Reviews in Biomedical Engineering 14, 16–29 (2021)
- [10] Greenspan, H., San José Estépar, R., Niessen, W.J., Siegel, E., Nielsen, M.: Position paper on COVID-19 imaging and AI: From the clinical needs and technological challenges to initial ai solutions at the lab and national level towards a new era for ai in healthcare. Medical Image Analysis 66, 101800 (2020)
- [11] Hjelm, D., Fedorov, A., Lavoie-Marchildon, S., Grewal, K., Bachman, P., Trischler, A., Bengio, Y.: Learning deep representations by mutual information estimation and maximization. In: ICLR 2019. ICLR (April 2019), https://www.microsoft.com/en-us/research/publication/learning-deep-representations-by-mutual-information-estimation-and-maximization/
- [12] Hofmanninger, J., Prayer, F., Pan, J., Röhrich, S., Prosch, H., Langs, G.: Automatic lung segmentation in routine imaging is primarily a data diversity problem, not a methodology problem. European Radiology Experimental 4(1), 1–13 (2020)
- [13] Härdle, W.K., Müller, M., Sperlich, S., Werwatz, A.: Nonparametric and Semiparametric Models (01 2006). https://doi.org/10.1007/978-3-642-17146-8
- [14] Hu, W., Miyato, T., Tokui, S., Matsumoto, E., Sugiyama, M.: Learning discrete representations via information maximizing self-augmented training. In: International conference on machine learning. pp. 1558–1567. PMLR (2017)
- [15] Khan, S., Bandyopadhyay, S., Ganguly, A.R., Saigal, S., Erickson, D.J., Protopopescu, V., Ostrouchov, G.: Relative performance of mutual information estimation methods for quantifying the dependence among short and noisy data. Phys. Rev. E 76, 026209 (Aug 2007). https://doi.org/10.1103/PhysRevE.76.026209, https://link.aps.org/doi/10.1103/PhysRevE.76.026209
- [16] Kollias, D., Arsenos, A., Kollias, S.: Ai-mia: Covid-19 detection & severity analysis through medical imaging. arXiv preprint arXiv:2206.04732 (2022)
- [17] Kollias, D., Arsenos, A., Soukissian, L., Kollias, S.: Mia-cov19d: Covid-19 detection through 3-d chest ct image analysis. arXiv preprint arXiv:2106.07524 (2021)
- [18] Kollias, D., Arsenos, A., Soukissian, L., Kollias, S.: Mia-cov19d: Covid-19 detection through 3-d chest ct image analysis. In: Proceedings of the IEEE/CVF International Conference on Computer Vision. pp. 537–544 (2021)
- [19] Kollias, D., Bouas, N., Vlaxos, Y., Brillakis, V., Seferis, M., Kollia, I., Sukissian, L., Wingate, J., Kollias, S.: Deep transparent prediction through latent representation analysis. arXiv preprint arXiv:2009.07044 (2020)
- [20] Kollias, D., Tagaris, A., Stafylopatis, A., Kollias, S., Tagaris, G.: Deep neural architectures for prediction in healthcare. Complex & Intelligent Systems 4(2), 119–131 (2018)
- [21] Kollias, D., Vlaxos, Y., Seferis, M., Kollia, I., Sukissian, L., Wingate, J., Kollias, S.D.: Transparent adaptation in deep medical image diagnosis. In: TAILOR. p. 251–267 (2020)
- [22] Kraskov, A., Stögbauer, H., Grassberger, P.: Estimating mutual information. Phys. Rev. E 69, 066138 (Jun 2004). https://doi.org/10.1103/PhysRevE.69.066138, https://link.aps.org/doi/10.1103/PhysRevE.69.066138
- [23] Li, X., Yu, L., Chen, H., Fu, C.W., Xing, L., Heng, P.A.: Transformation-consistent self-ensembling model for semisupervised medical image segmentation. IEEE Transactions on Neural Networks and Learning Systems 32(2), 523–534 (2021). https://doi.org/10.1109/TNNLS.2020.2995319
- [24] Liu, Q., Yu, L., Luo, L., Dou, Q., Heng, P.A.: Semi-supervised medical image classification with relation-driven self-ensembling model. IEEE transactions on medical imaging 39(11), 3429–3440 (2020)
- [25] Liu, Z., Mao, H., Wu, C.Y., Feichtenhofer, C., Darrell, T., Xie, S.: A convnet for the 2020s. In: Proceedings of the IEEE/CVF Conference on Computer Vision and Pattern Recognition. pp. 11976–11986 (2022)
- [26] Ning, Z., Tu, C., Di, X., Feng, Q., Zhang, Y.: Deep cross-view co-regularized representation learning for glioma subtype identification. Medical Image Analysis 73, 102160 (2021)
- [27] Peng, J., Pedersoli, M., Desrosiers, C.: Boosting semi-supervised image segmentation with global and local mutual information regularization. CoRR abs/2103.04813 (2021), https://arxiv.org/abs/2103.04813
- [28] Polyak, B.T., Juditsky, A.B.: Acceleration of stochastic approximation by averaging. SIAM journal on control and optimization 30(4), 838–855 (1992)
- [29] Prokop, M., Van Everdingen, W., van Rees, V., et al.: Corads: a categorical ct assessment scheme for patients suspected of having covid-19—definition and evaluation. Radiology 296, E97–E104 (2020)
- [30] Seo, H., Yu, L., Ren, H., Li, X., Shen, L., Xing, L.: Deep neural network with consistency regularization of multi-output channels for improved tumor detection and delineation. IEEE Transactions on Medical Imaging 40(12), 3369–3378 (2021). https://doi.org/10.1109/TMI.2021.3084748
- [31] Sinha, S., Dieng, A.B.: Consistency regularization for variational auto-encoders. Advances in Neural Information Processing Systems 34, 12943–12954 (2021)
- [32] Su, H., Shi, X., Cai, J., Yang, L.: Local and global consistency regularized mean teacher for semi-supervised nuclei classification. In: International Conference on Medical Image Computing and Computer-Assisted Intervention. pp. 559–567. Springer (2019)
- [33] Sugiyama, M.: Machine learning with squared-loss mutual information. Entropy 15(1), 80–112 (2013). https://doi.org/10.3390/e15010080, https://www.mdpi.com/1099-4300/15/1/80
- [34] Sugiyama, M., Suzuki, T., Kanamori, T.: Density Ratio Estimation in Machine Learning. Cambridge University Press, New York, NY, USA, 1st edn. (2012)
- [35] Suzuki, T., Sugiyama, M.: Sufficient dimension reduction via squared-loss mutual information estimation. In: AISTATS (2010)
- [36] Tarvainen, A., Valpola, H.: Mean teachers are better role models: Weight-averaged consistency targets improve semi-supervised deep learning results. In: Proceedings of the 31st International Conference on Neural Information Processing Systems. pp. 1195–1204 (2017)
- [37] Wightman, R.: Pytorch image models. https://github.com/rwightman/pytorch-image-models (2019). https://doi.org/10.5281/zenodo.4414861
- [38] Xie, X., Zhong, Z., Zhao, W., Zheng, C., Wang, F., Liu, J.: Chest ct for typical coronavirus disease 2019 (covid-19) pneumonia: Relationship to negative rt-pcr testing. Radiology 296(2), E41–E45 (2020)
- [39] Yamada, M., Sigal, L., Raptis, M., Toyoda, M., Chang, Y., Sugiyama, M.: Cross-domain matching with squared-loss mutual information. IEEE TPAMI 37(9), 1764–1776 (2015)
- [40] Yamada, M., Sugiyama, M.: Cross-domain object matching with model selection. In: AISTATS (2011)