The diurnal cycle and temporal trends of surface winds
Abstract
Winds play an essential role in the climate system. In this study, we analyze the global pattern of the diurnal cycle of surface (10 m) winds from the ERA5 reanalysis data. We find that over the land and especially over sand dune regions, the maximal wind speed and wind drift potential (DP) occur during the hours around midday. However, over the ocean, the wind also peaks at night. Using the sensible heat flux, we show that the weaker winds over land at night are due to a nocturnal cooling that decouples upper atmospheric levels and their associated stronger winds from the surface—nocturnal cooling is much smaller over the ocean. We also analyze wind data from more than 400 meteorological stations in the USA and find a similar diurnal trend as in the reanalysis data. The timing (during the day) of the maximum wind speed has not varied much over the past 70 years. Yet, the wind speed, wind power, and wind drift potential exhibit significant increases with time over the ocean and, to a much lesser degree, over the land and sand dune regions. We compare the USA and Europe DP and wind speed of the ERA5 to that of meteorological stations and find that the ERA5 significantly underestimates real winds; however, the temporal patterns of the two are similar.
keywords:
Sand dunes , Drift Potential , wind , ERA5 , diurnal cycle , trends1 Introduction
Winds are generated, in part, due to pressure gradients associated with spatial and temporal temperature variations. They influence our daily life and are a major component of the climate system on a wide range of temporal and spatial scales. Winds drive the ocean and are a major source of oceanic energy Munk (1966); Munk and Wunsch (1998); Wunsch (2020). Extreme winds (as in hurricanes) are a major threat to human life and livelihood, causing substantial destruction. Thus, it is not surprising that many studies have investigated different aspects of wind dynamics and characteristics.
Winds are also the driving force of sand dunes Bagnold (1941) and dust emission and transport. Dunes cover a substantial area of the world’s deserts and form a unique physical and ecological system Pye (1982); Veste et al. (2001); Shanas et al. (2006); Pye and Tsoar (2008); Thomas and Wiggs (2008); Tsoar (2008). For example, active and stable dunes host various flora species Danin (1991, 1996); Maun (2009); Bel and Ashkenazy (2014), while some of these are endemic species Kutiel (2001); Rocha et al. (2004). While many studies have concentrated on the role played by wind power and direction in dune activity and type (shape) Fryberger (1979); Pye and Tsoar (2008), only a few have investigated the diurnal cycle Yang et al. (2013); Zhou et al. (2019); Gunn et al. (2021) of the winds and their impact on dune activity. More specifically Yang et al. (2013) studied 2-years saltation activity in the Taklimakan desert of China and found increased salt saltation during the middle of the day and attributed this increased activity mainly to stronger winds. Zhou et al. (2019) found a correlation between the air temperature and sand activity in the same region. Gunn et al. (2021) reported increased sand and dust activity during daytime at the White Sands National Park (New Mexico, USA) and associated this activity with stronger winds and drier conditions during the day. Concerning trends in wind activity, a previous study Young et al. (2011) analyzed 23 years of oceanic altimetry data and found a general increase in wind speed and wave height. These findings were confirmed in a later study Young and Ribal (2019) using satellite data that span a longer period, from 1983 to 2010. Increased wind speed trend over the ocean was also found based on several reanalysis data Wohland et al. (2019); the increasing trend of wind speed was less conclusive overland (e.g., Zeng et al., 2019). Another study which was based on the ERA-Interim reanalysis Yu et al. (2020) reported an increasing trend in wind speed over Antarctica and the Southern Ocean. The above studies did not focus on sand dune regions and did not use the most recent and detailed reanalysis data, ERA5, in their studies. Here we aim to explore both the diurnal variation of surface winds and the trends in wind activity since 1950; we mainly focus on surface winds over sand dune areas. We do so based on high resolution, relatively recent reanalysis data, the ERA5 Hersbach et al. (2020).
In brief, we find that over land, the winds are much stronger during the day than at night. Based on previous studies (e.g., Zhang and Zheng, 2004; Gunn et al., 2021), we attribute these stronger daytime winds to the small heat capacity (small thermal inertia) of the land (i.e., due to the fact that only the upper few cms of the soil are drastically affected by diurnal heating) and the temperature inversion at night, which decouples the upper and active atmospheric levels from the ground. Over the ocean, the heat capacity (thermal inertia) is much larger (i.e., due to the upper several tens of meters of the mixed layer, which are hardly affected by diurnal heating), and the situation is more complex. In some locations, there are two maxima during the 24-hour period, and their timing varies from one latitude to another. As for the trends in wind activity, we find a general increase with time, in which the increase is pronounced over the ocean and weak overland, especially over sand dune regions.
The paper is organized as follows. We first describe the data (Sec. 2.1) and methods (Sec. 2.2). We then present in Sec. 3.1 the results regarding the timing of the maximum wind activity (as reflected by the wind drift potential, wind speed, and wind power) and the results regarding the trend in wind activity as reflected by the annual value of the above measures (Sec. 3.2). We then summarize the results and draw some conclusions.
2 Data and Methods
2.1 Data.
The main results of this study are based on the ERA5 reanalysis Hersbach et al. (2020), the fifth-generation atmospheric reanalyses of the European Centre for Medium-Range Weather Forecasts (ECMWF). The spatial resolution of the ERA5 data is 0.25∘, and its temporal resolution is one hour. The ERA5 first spanned the time period from 1979 to the present day and then also included data from 1950 to 1978; we analyzed the entire period from the beginning of 1950 to the end of 2021, for a total of 72 years. Among the many variables and measurands of the ERA5, we focus on the surface (10 m) winds and sensible heat flux. To our knowledge, the ERA5 is the only reanalysis that provides hourly data, which are essential in analyzing the diurnal cycles of the wind. In addition, it provides high spatial resolution (0.25∘) global data in comparison to other global reanalysis sources.
In addition to the analysis of the ERA5 surface winds, we also analyzed the wind data of 406 meteorological stations in the USA, provided by the National Climatic Data Center (NCDC); see www.ncdc.noaa.gov. The temporal resolution of these stations is 20 minutes; most of the stations span the period from 2009 to 2018. We also analyze global wind data of the NCDC, from 1973 to 2021. We focus only on stations that had more than 80% of valid measurements. The number of analyzed stations (generally) increased with time, from 1281 in 1973 to 6718 in 2021, with variability over the years.
2.2 Methods.
The ERA5 provides the surface (10 m) zonal, , and meridional, , components of the wind, and based on this, we calculated the wind speed, . Then we calculated (which is proportional to the wind power, , where is the cross-section area and is the air density). In addition, we calculated the instantaneous (hourly) sand drift potential (DP), which is a measure for sand transport. It is defined as
| (1) |
where is the 10-m-height wind speed, and is the minimum wind speed required for sand transport where typically knots Fryberger (1979). represents an average over time (the sum of elements over the number of elements).
For each month, we calculated the diurnal cycle of the above three measures, , , and DP, i.e., we averaged the same hour within the day over all days of the month. The time within the day of the ERA5 is the Greenwich Mean Time (GMT), and we adjusted the time (in hours) at a longitude according to (i.e., one rotation over 24 hours) where and is the local time and GMT, respectively, and is the longitude.
We also used the instantaneous sensible heat flux to study the vertical stability of the air close to the surface. The sensible heat flux is proportional to surface wind speed and the temperature difference between the air and the surface Gill (1982). We note that other air stability measures can be used to explain the diurnal cycle of surface winds; yet, since we are dealing with surface winds, we study the sensible heat flux that is proportional to the temperature difference close to the surface. At each grid point, we calculated the annual mean of the difference between the daily maximum and minimum sensible heat flux and found the annual mean of this measure. We also found the time (within the day) of this measure.
We analyzed the meteorological (NCDC) station data to provide some support for the ERA5 analysis. We used two subsets of the NCDC data: one that includes 406 stations from the USA with 20-minute resolution. Here we simply constructed, for each station, the probability density function (pdf) of the time of maximum speed within the day. We then calculated the mean std of the pdfs of the different stations. Another much larger subset includes stations from the entire world, with a 1–hour (or less) temporal resolution. We used the data quality classification of the NCDC to filter out problematic data points and considered time series that have more than 80% valid data; see https://www.ncei.noaa.gov/data/global-hourly/doc/isd-format-document.pdf. We considered data from 1973 to 2021, with an increasing number of stations with time (from 1281 in 1973 to 6718 in 2021). Most of the stations are from the USA, Europe, Japan, and southeast Australia. We gridded the data of the different stations (falling on the same grid point) using Gaussian smoothing—see Sec. 3.1 of Ashkenazy et al. (2012) for more details. The spatial resolution of the gridded data is 1∘.
3 Results
3.1 The timing of the maximum wind.
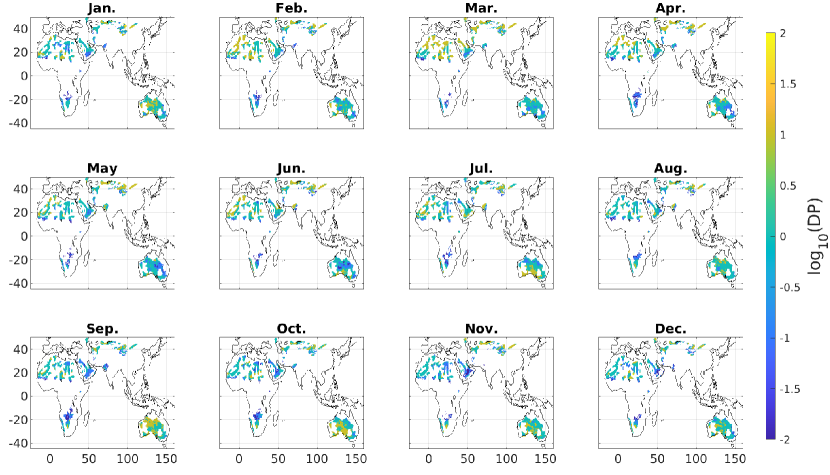
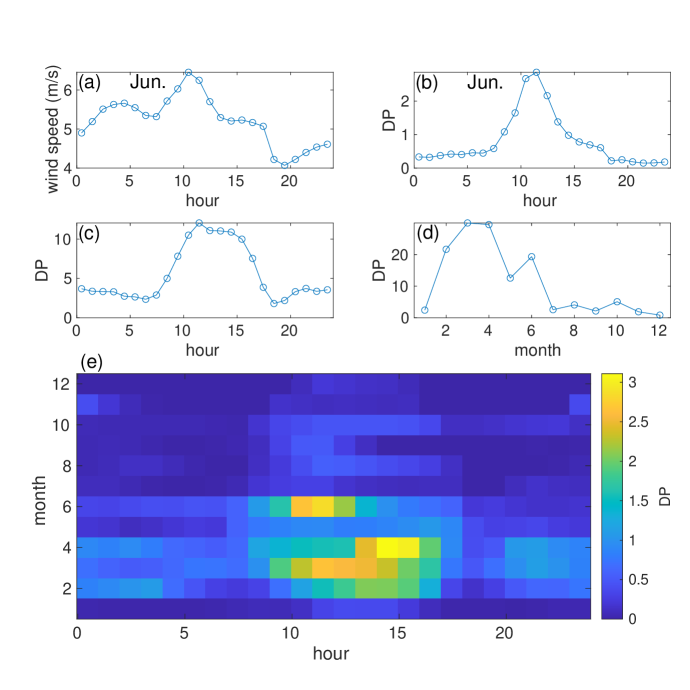
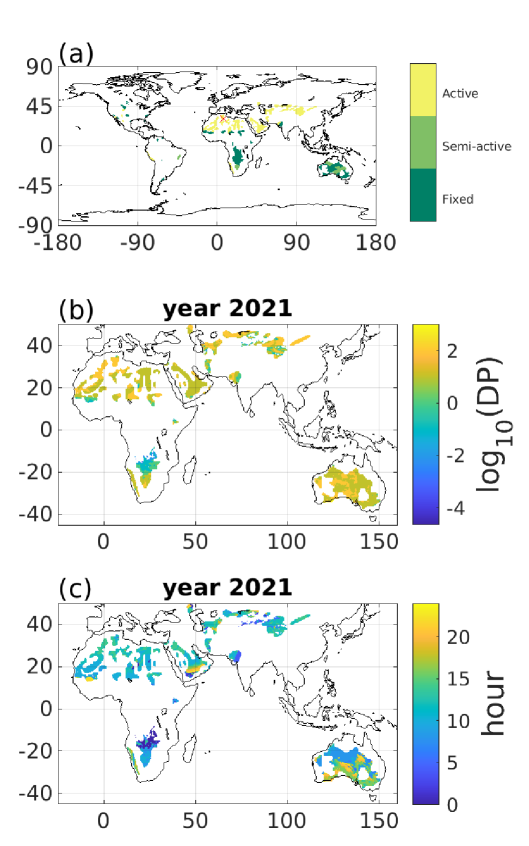
We first demonstrate our analysis (Fig. 1) in a specific, representative location of 6.75∘E and 30.75∘N, in the sandy region of southeastern Algeria (the northern Sahara); this location is indicated by the red “” in Fig. 2a. Fig. 1a,b presents the diurnal cycle of the wind speed and DP during June 2021. It is clear that the wind is the strongest at the midday hours and that it is much weaker at night. The DP exhibits a more pronounced day-night contrast, as it enhances the effect of stronger winds; see Eq. (1) of the Methods section. Fig. 1c shows the annual mean diurnal DP cycle, and also here, the stronger winds during the day are evident. We also present in Fig. 1d the annual DP cycle, which indicates that the winds are stronger from February–June, during which the winds peak during the daytime (Fig. 1e). Thus, we expect significant dune activity in these months, during the daytime.
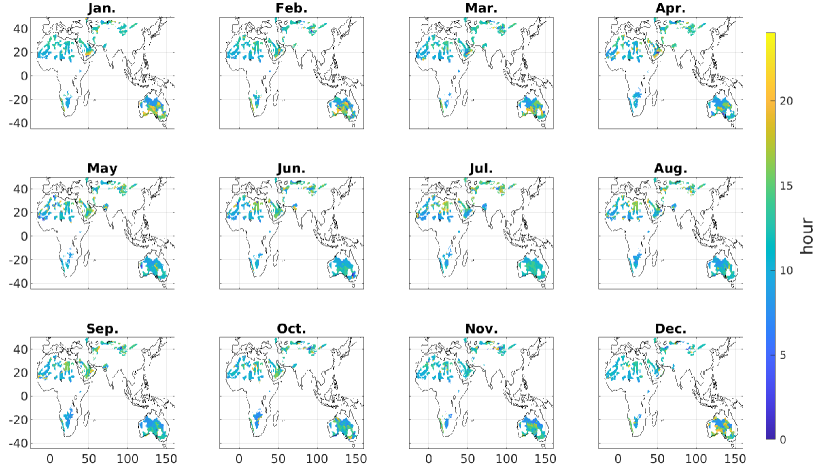
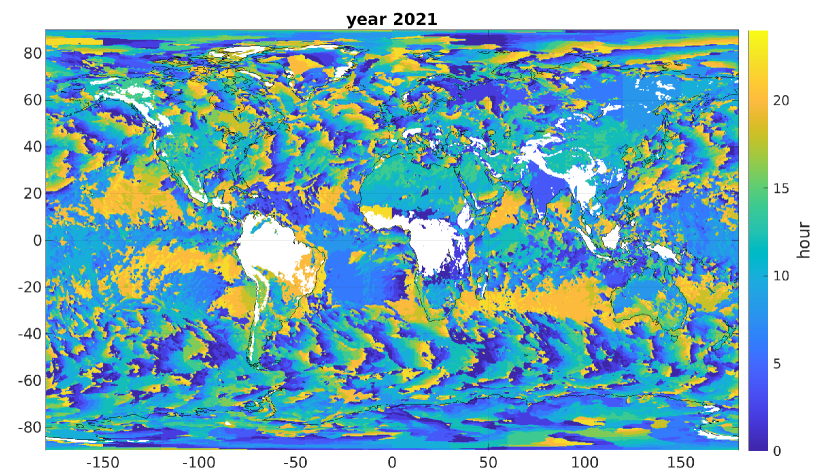
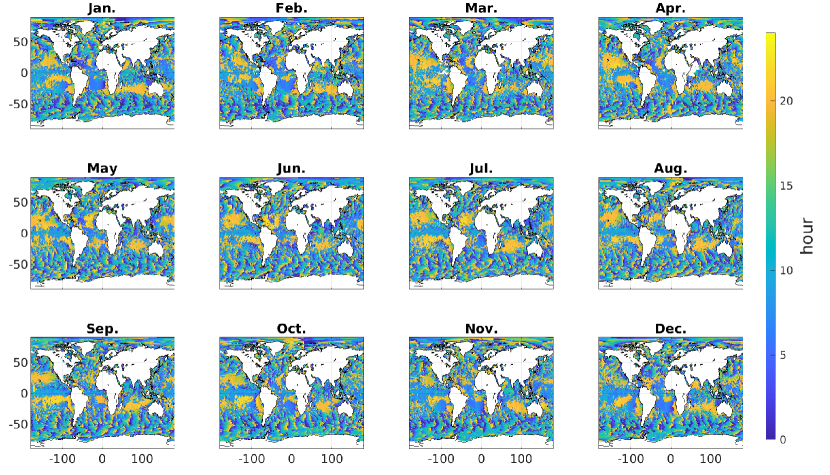
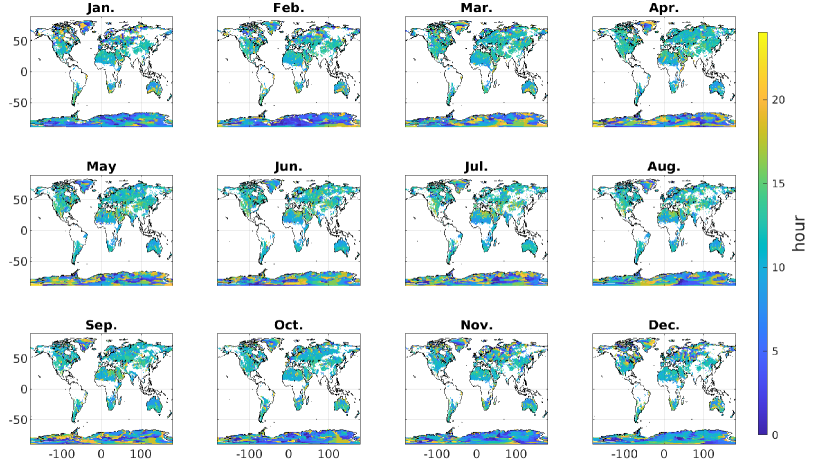
Next, we present the DP over the main dune fields (Fig. 2a); extended dune fields can be found mainly in Africa, Asia, and Australia, and thus, we first focus on these regions. The 2021 DP is presented in Fig. 2b, and a comparison with Fig. 2a suggests a link between the dunes’ activity and DP, as was discussed in detail in previous studies Fryberger (1979); Yizhaq et al. (2020). Fig. S1 depicts the DP of the different months. Fig. 2c presents the timing (the hour in the day) of the maximum DP in the year 2021; i.e., the time of the maximum in Fig. 1c for different locations. The results of the different months are depicted in Fig. S2. It is evident that over most dune areas, the maximum DP occurs during the daytime, and it is difficult to find locations in which the maximum DP occurs between midnight and early morning. We note that we did not find any clear relation between the dune activity (i.e., whether the dune is active or stable) and the timing (within the diurnal cycle) of maximum DP; the level of activity depends on the DP magnitude. The times of 2021’s maximum DP over the ocean and land are presented in Supplementary Figs. S3, S4, and S5. Over the ocean, there is no clear diurnal cycle (Fig. S4), while over the land, the winds peak during the daytime, except in icy regions of Antarctica and Greenland and other high elevation regions. These findings will be discussed below.
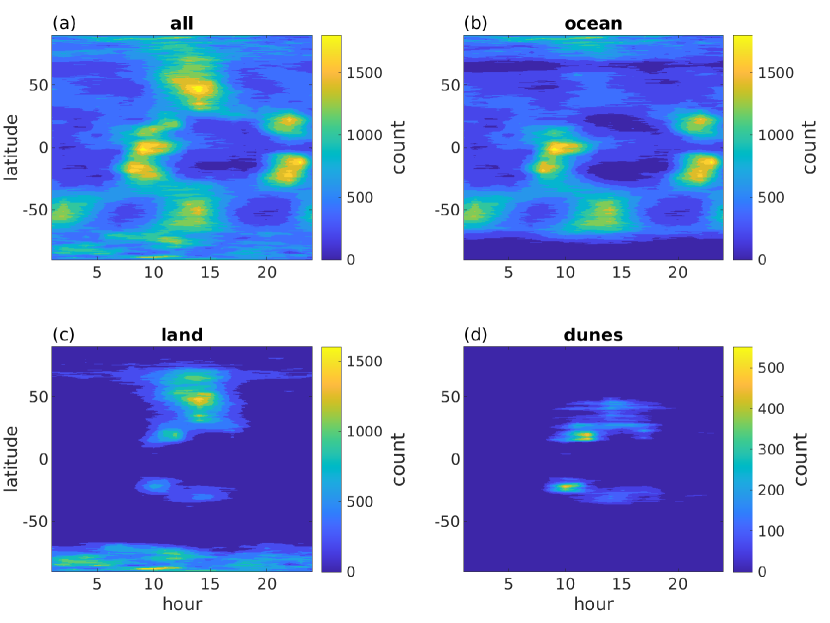
Next, we concentrate on the statistics of the time (within a day’s 24 hours) at which the maximum DP occurs. More specifically, for each grid point and each month, we find the time (hour) of maximum DP. Then, we plot, for each latitude, the frequency of these hours for the entire latitude band, separately for the ocean, land, and dune regions within the latitude band (Fig. 3). The time of 2021’s maximum DP over land and dune regions is during the daytime, with maximum frequency around 14:00 over land and earlier (around 11:00) over the dune regions (Fig. 3c,d). An exception is Antarctica, over which there is no clear preferred timing of maximum DP within the diurnal cycle. To a lesser extent, this is also true in the high latitudes of the northern hemisphere (60∘N). This will be discussed below. As for the ocean (Fig. 3b), there is no clear maximum; at a latitude band of 50∘S, there are two peaks, at midnight and at 14:00, while at another latitude band of 20∘S to the equator, we observe two peaks at 9:00 and 22:00. At other latitudes, there is no clear maximum. The results of the entire latitude band (Fig. 3a) mainly resemble, as expected, the results for the ocean, except for certain latitudes at which the relative ocean area is small (i.e., Antarctica).
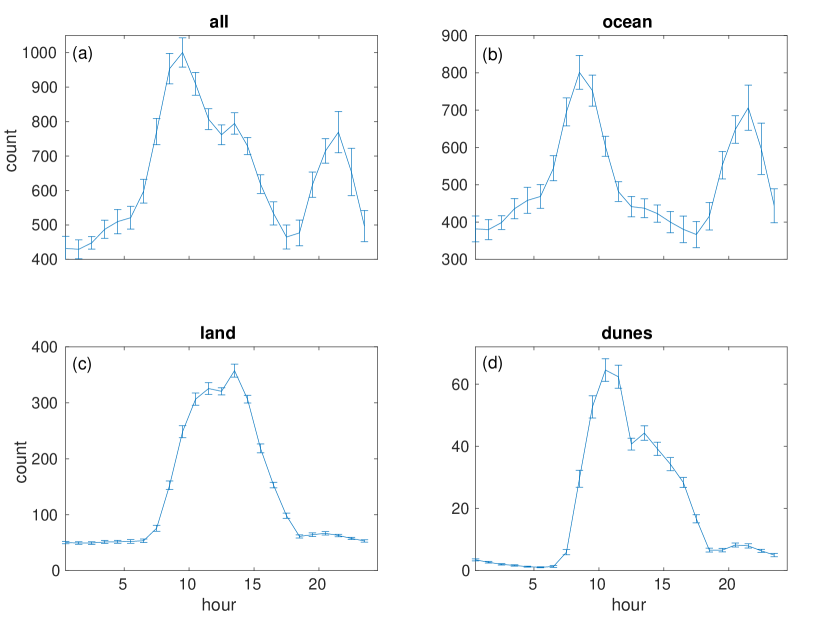
In the above, we concentrated on a specific year, 2021. In Fig. 4, we summarize the results of 72 years, from 1950–2021. For every year, we constructed the meridional mean of Fig. 3, taking into account the effect of the decreasing grid area poleward and presented the temporal mean 1 std. In all the plots, the error bars are relatively small, indicating the stability of the results over time. For the dune regions (Fig. 4d), it is clear that the DP peaks at 11:00 and that the surface winds are almost inactive during the nighttime hours, 18:00 to 7:00. The situation is similar for the land areas (Fig. 4c), with the following differences: (i) the counts do not drop to zero during the nighttime hours when they are around 50. These nocturnal counts are due to the Antarctic timing of the maximum DP, which in this continent, occurs over the entire 24 hours. For the ocean (Fig. 4b), in contrast to the single peak of the land and dune results, we observe two peaks, at 8:00 and 22:00. These two peaks reflect the low latitude results (see Fig. 3b), as this latitude range spans larger areas than the higher latitudes of the southern hemisphere (50∘S, Fig. 3b), for which there are two peaks, at midnight and at 14:00. The results of the entire globe mainly reflect, as expected, the results from the ocean. We also plotted the histograms of maximum DP times for all years from 1950-2021, and these indicate almost no variability with time (Fig. 5) for the land and dune regions and some minor variability for the ocean.
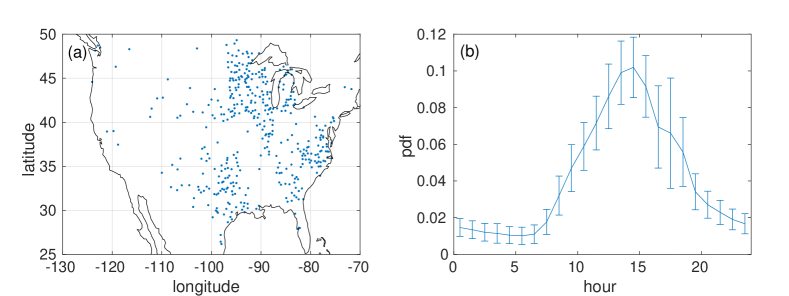
The analysis we presented above is based on the ERA5 reanalysis data. To validate these results, we repeated the analysis based on wind data of 406 meteorological stations in the USA. The distribution of the stations is presented in Fig. 6a, and the mean std of the pdf of the time of daily maximum speed in the different stations is shown in Fig. 6b. Also here, as for the reanalysis data, the wind speed is much stronger during the daytime and peaks around 14:00. The relatively small standard deviations in the pdf indicate the results’ robustness. These results are consistent with Fig. S5.
Why are winds over land stronger during the day? This question was discussed in ref. Gunn et al. (2021), in the context of a dune-field activity. These authors performed a field experiment at White Sands National Park (New Mexico, USA) and reported enhanced daytime sand and dust activity. They attributed this activity to stronger winds and drier conditions during the day. The atmospheric boundary layer extends to higher elevations after sunrise, as surface air warms and convects upward, making the air vertically unstable. They also found, based on 45 dune fields worldwide, a connection between surface winds and the diurnal temperature cycle.
Based on the paper discussed above, we suggest that the enhanced continental winds, during the daytime, are related to temperature-inversion, which, when present, disconnects the upper active atmospheric layers from the surface. Among the different types of inversions, we suggest that the ground inversion is the dominant one. The ground inversion is associated with the low heat capacity (low thermal inertia) of the ground, which cools rapidly after sunset. The low heat capacity is mainly due to the exponential decay of temperature with depth, such that only the upper few cms of the soil are affected by the daytime heating; soil’s smaller heat capacity (by about a factor of two), relative to that of seawater, plays a less significant role. The lower ground temperature at night cools the air above it, usually resulting in cold (and dense) air underlying warmer (and lighter) air, leading to stable atmospheric conditions, isolating the surface from a possibly active upper layer. After sunrise, the ground warms up within a few hours, warming the air above it and resulting in vertical convection, eventually connecting the surface with the upper, more active atmospheric levels. Over the ocean, the sea surface temperature hardly varies over the time scale of one day, due to the larger specific heat of seawater and, more importantly, due to the mixed layers of depths of tens of meters. For this reason, we do not observe a clear timing for the maximum wind over the ocean; we do not have an explanation for the two peaks observed over oceanic regions (Figs. 3, 4).
The air stability close to the surface may be examined through the sensible heat flux, which is proportional to the temperature difference between the air and the surface (water, soil, ice, etc.) and to the surface wind speed. The sensible heat flux is the conductive heat flux emitted from the earth’s surface to the atmosphere and plays an important role in the energy budget at the earth’s surface. Given the above, over land, during the daytime, the sensible heat flux is negative (i.e., the temperature of the air at the surface is warmer and possibly lighter than the air above it, possibly leading to unstable conditions and to the connection of the surface with the upper active atmospheric levels), whereas at night, it is positive (i.e., the temperature of the air at the surface is colder and heavier than the air above it, leading to stable conditions and to the disconnection of the surface from the upper active atmospheric levels). The surface’s small heat capacity leads to a large difference between the maximum sensible heat flux at night and the minimum flux during the daytime.
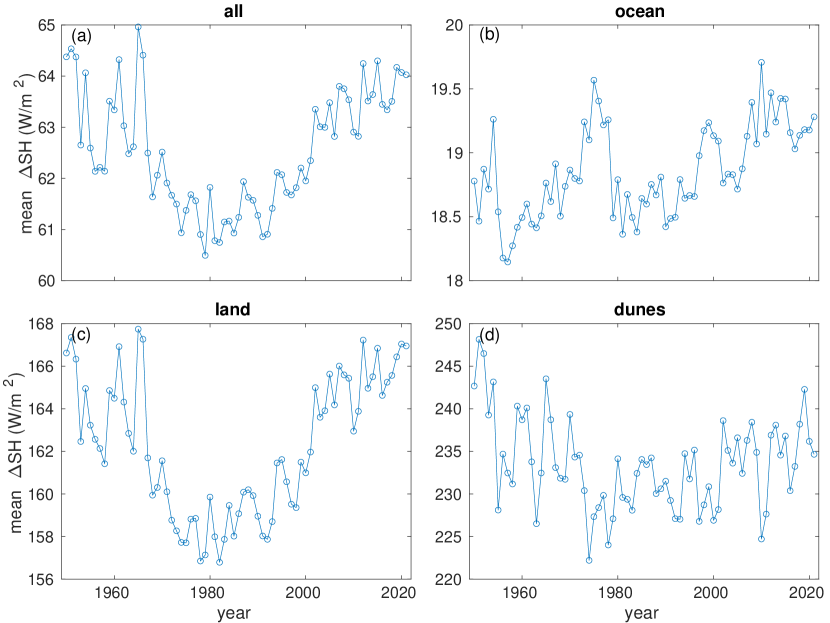
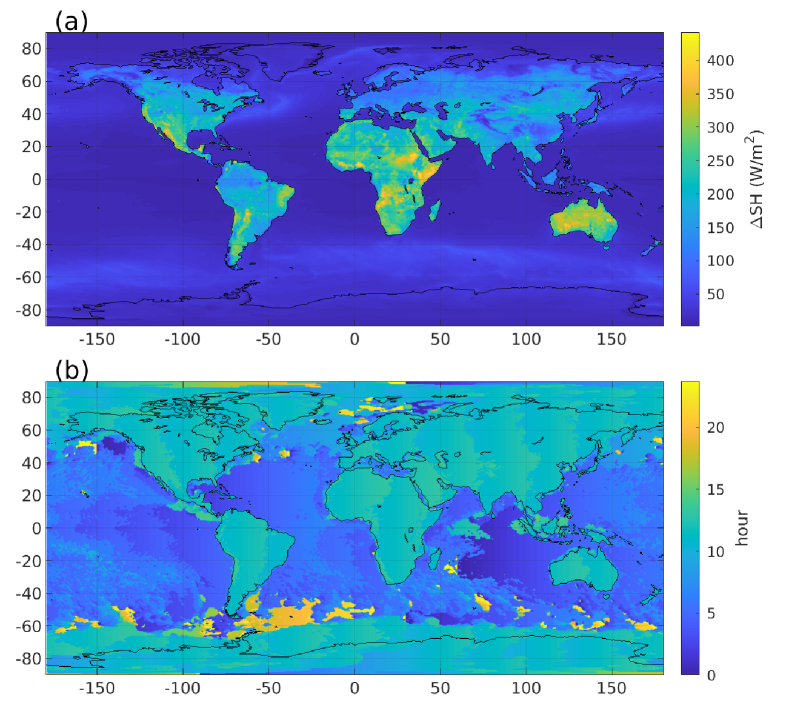
Over the ocean, this difference is expected to be small, due to the small variations in sea-surface temperature during the day, associated with the mixed layer’s large heat capacity. In Fig. 7a, we present the difference between the maximum and minimum sensible heat flux during the daytime, , and it is evident that indeed the difference is much larger over the land than over the ocean; this supports our explanation regarding the stability of the air over land and over the ocean and during the day and night hours. This is true, despite the stronger winds over the ocean that should have increased the sensible heat flux.
Interestingly, the night-day difference in sensible heat flux over Antarctica and Greenland is similar to that of the ocean and may explain the observation that maximum wind occurs over the entire 24 hours of the day (Fig. S3, S5, 3). This may be related to the high altitude of Antarctica and Greenland and to the high albedo of the ice/snow, which reduces the absorbed solar radiation; see more discussions in the next paragraph. In Fig. 7b, we present the timing of the minimum sensible heat flux, which can be related to greater vertical instability and, thus, stronger winds. Indeed, over land, the minimum occurs during the daytime, while over the ocean, the minimum occurs during the last hour of the night.
There is no clear timing for the maximum wind over Antarctica and Greenland, and to a lesser extent, the daytime maximum of surface winds is less clear at the high elevation continental latitudes. This might be related to the extended time of either the day or night at the high latitudes or to the high surface elevations of Antarctica and Greenland, which makes the surface too difficult to disconnect from the high–altitude atmospheric activity. The higher albedo of the ice results in less absorbed shortwave radiation, which can weaken the effect of surface heating/cooling that influences the daytime maximum wind over the land. The results regarding the sensible heat flux over these regions (Fig. 7b) are consistent with the results regarding the timing of the maximum wind.
3.2 The temporal trends of wind.
To complement the analysis of the timing of the maximum wind speed, we present below the results regarding the temporal variability of DP, wind power, and wind speed. Previous studies indicated a significant increase in surface wind speed over the ocean with time Young et al. (2011); Young and Ribal (2019); Yu et al. (2020) and, to a lesser degree, over land Yu et al. (2020). In addition, a general increase in wind speed was reported based on different reanalysis models Wohland et al. (2019) although, in some locations, the trends were not consistent; here, we focus on trends based on the relatively new and fine resolution reanalysis, the ERA5, and present results of the DP, which, to our knowledge, have not been previously presented. We note that reanalysis data does not always accurately reflect reality. More specifically, the wind speed of the ECMWF reanalysis underestimates real winds, while that of the NCAR/NCEP reanalysis overestimates real winds Ashkenazy et al. (2012); Stopa and Cheung (2014); Yizhaq et al. (2020). Below, we further analyze the difference between the ERA5 and measured data over the USA. We also show that although the DP magnitude is not well captured by the ERA5, the DP trends probably reflect real trends.
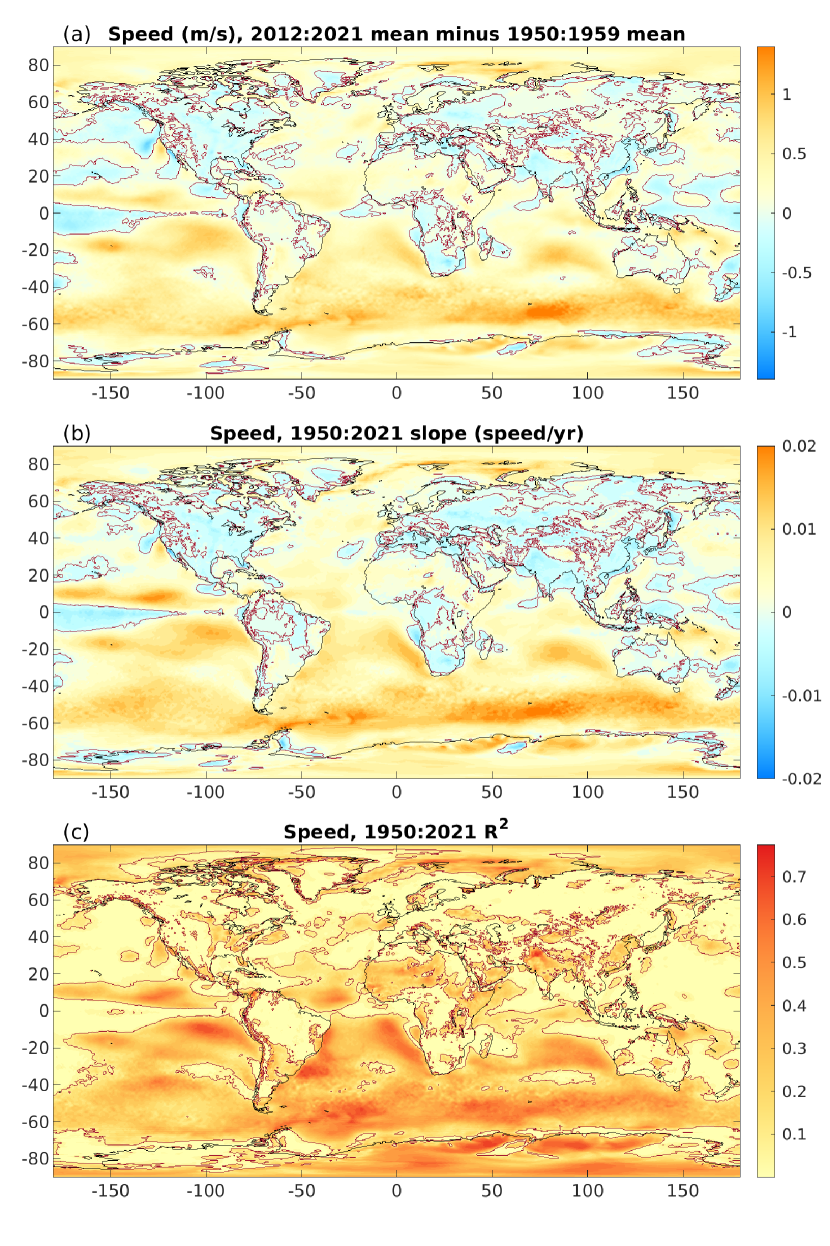
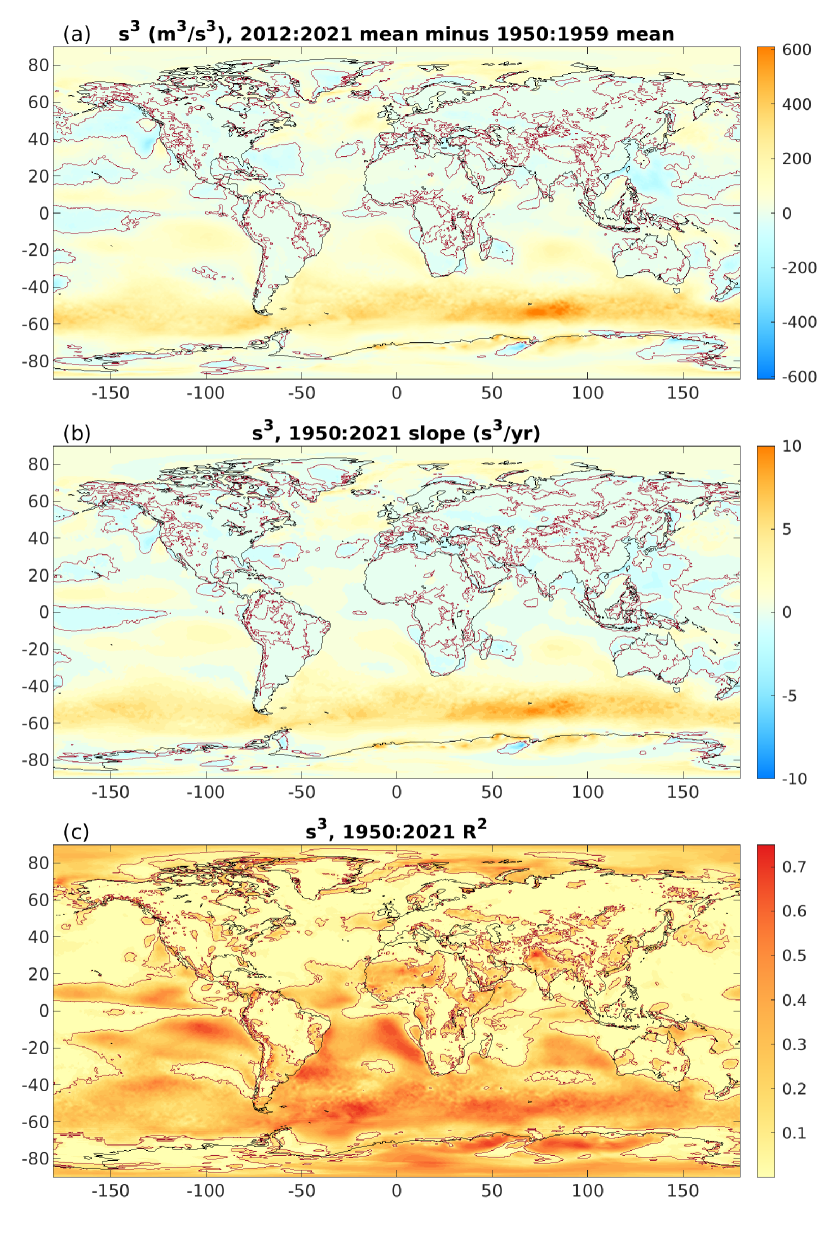
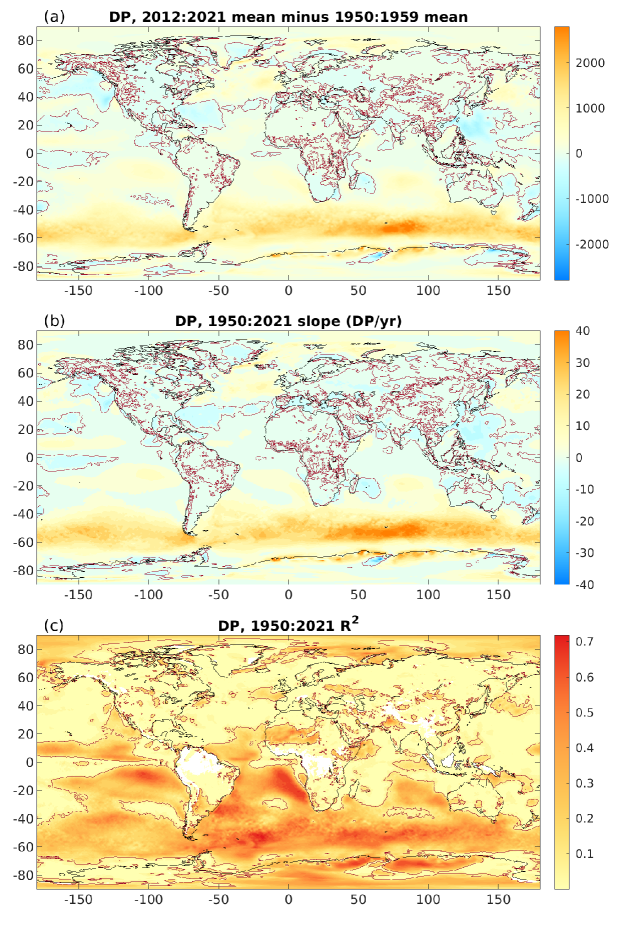
To estimate whether and by how much the wind varied over the years, we subtract (at each grid point) the mean DP of the first 10 years of the ERA5 (1950–1959) from the mean of the last 10 years (2012–2021). The results are shown in Fig. 8a and indicate that most of the globe experienced an increase in DP, especially over the ocean. The increase is more pronounced over the ocean than over continental regions. In addition, we estimated, at each grid point, the rate of the increase/decrease in DP over time, i.e., we have performed a linear regression for each time series (of each grid point) and considered the corresponding slope as the rate of the local grid point. The results are shown in Fig. 8b where also here the rate (slope) is positive over most of the world’s area, with more extensive regions with a positive slope and a significantly larger increase rate over the ocean. In some oceanic regions (e.g., the Southern Ocean), the increase exceeds 30 vector units of DP per year. This increase is consistent with previous studies Hande et al. (2012); Young and Ribal (2019).
Interestingly, extended oceanic regions experienced a decline in DP, including the western tropical Pacific, the central equatorial Pacific, the sub-tropical North Atlantic Ocean, and the Mediterranean Sea. To estimate the significance of the increase, we have also calculated the of the slope (Fig. 8c). To further estimate at what value of one can consider the slope as significant, we have randomly selected grid points and shuffled the time series of each of these points. The mean slope of these shuffled time series is around zero. Then, we calculated the of these shuffled time series and found the 99% percentile of these values; this percentile is , meaning that a time series with a has only a 1% probability to be associated with a random time series. It is apparent from Fig. 8c that extended oceanic regions experienced a significant increase in DP, while most of the continental regions have . Continental regions with a significant increase in DP include parts of the Sahara/Sahel and regions in South America. We have performed similar analyses on wind speed (Fig. S6) and on the cube of the wind speed (which is proportional to the wind power) and found similar results.
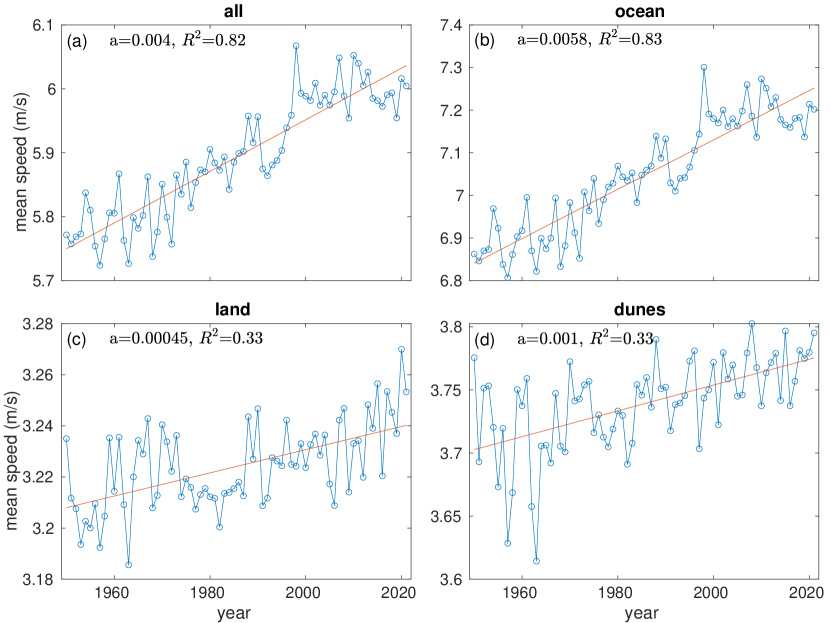
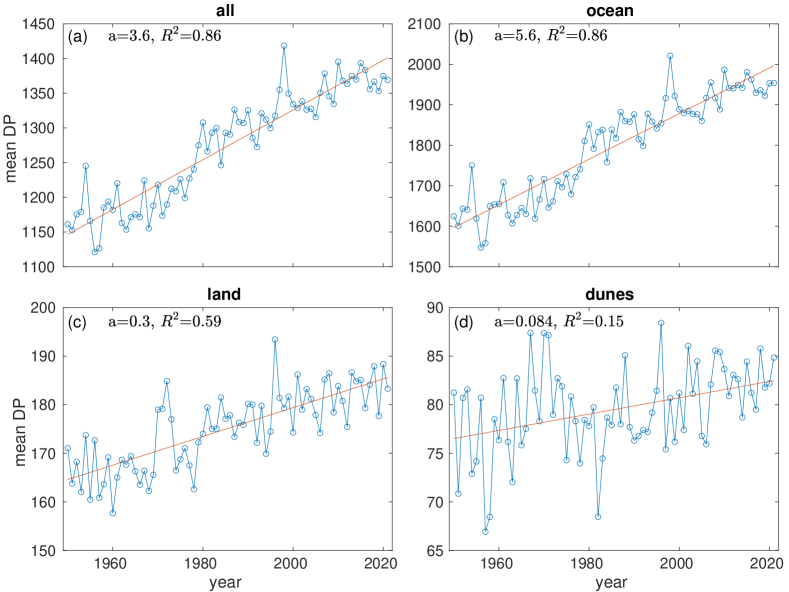
We next present the annual DP versus time (1950–2021) averaged over: (i) the entire globe, (ii) the ocean, (iii) the land, and (iv) dune regions; see Fig. 9. While over all regions the increase is significant, the increase over the ocean is the largest and most significant, the increase over land is less significant and less pronounced, and the increase over the dune regions is the least significant and pronounced. Indeed, the increase in DP over most of the continental regions is not significant, and in some regions like Greenland, North America, and China, DP decreases with time; see Fig. 8. Such a decrease in DP is consistent with studies regarding sand dunes in China Mason et al. (2008); Li et al. (2015); Wang et al. (2005); Zhang et al. (2018), in the Canadian prairies Hugenholtz and Wolfe (2005); Hugenholtz et al. (2010), and in the world’s largest sand island in Eastern Australia Levin (2011); Yizhaq et al. (2013). We have performed a similar analysis for the wind speed (Fig. S8) and found similar results, although here, the significance of the increase over the land is similar to that over the dunes.
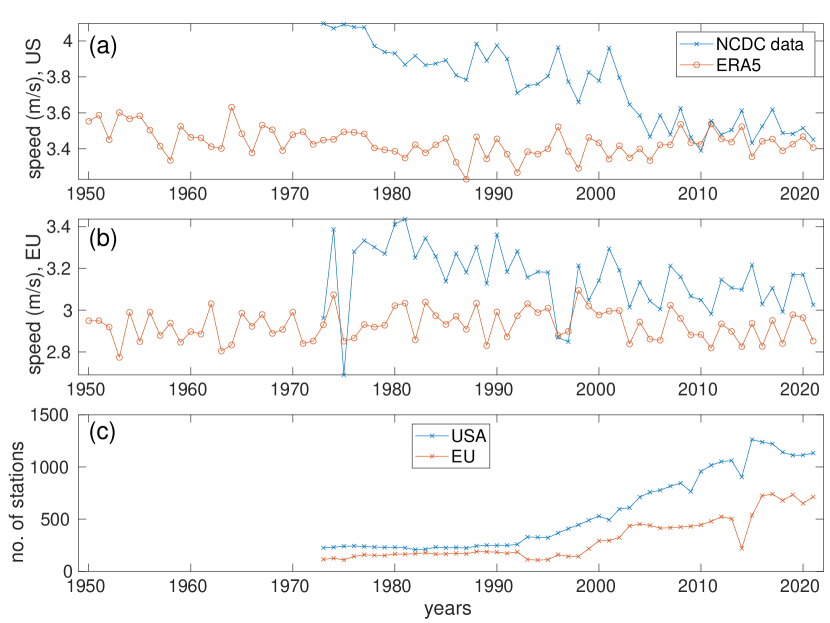
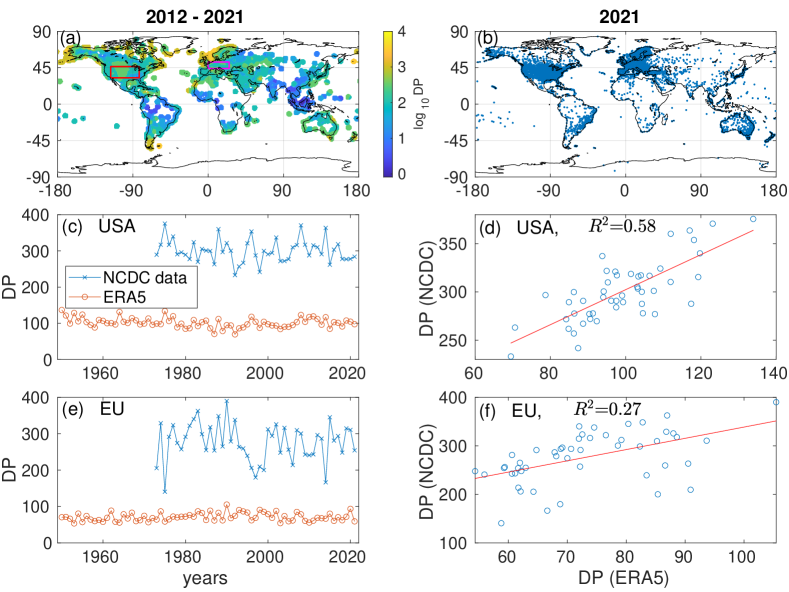
We have used the NCDC meteorological data to validate the trends observed in the ERA5; see Fig. 10. A map showing the mean DP over the past 10 years (2012–2021) is depicted in Fig. 10a. We focus on regions within the USA and Europe (indicated by the red and magenta rectangles in Fig. 10a), as there are many stations within these regions (Fig. 10b). Generally speaking, the DP of the ECMWF reanalysis (like the ERA5) underestimates the one that is based on measured data Ashkenazy et al. (2012). Fig. 10c,e shows the mean DP over the USA and Europe based on the ERA5 and NCDC data. First, there is no clear trend in DP in either data source. Second, the DP of the ERA5 is smaller than the DP of the NCDC by about a factor of 3. Yet, the pattern of the time series of the two data sources is similar (Fig. 10d,f), indicating that the trends of the ERA5 are most likely reliable, but their actual value is not. We also perform a similar analysis for the wind speed (Fig. S9), but here, there is a decreasing trend in the wind speed using the NCDC and a much weaker trend in the ERA5. The match between the two sources is good in the last 15 years (or so) of the data (Fig. S9a,b) and the difference between the NCDC data and the ERA5 is much smaller than the difference in the DP time series (Fig. 10c,e). This indicates that the ERA5 does not accurately capture the extreme winds, as DP signifies strong winds.
The increase in DP and wind speed over time may be explained in different ways that were previously discussed at length Wohland et al. (2019). First, the observed trends in the reanalysis data may be due to biases and measurement techniques that varied over time Cardone et al. (1990); Ward (1992); Ward and Hoskins (1996); Thomas et al. (2008), including the increase in heights of anemometers, the use of measured wind speed instead of estimated wind speed, and higher sampling rate as time advanced Wohland et al. (2019). Yet, the increase of wind speed over the ocean was reported based on measured data Young et al. (2011); Young and Ribal (2019); Yu et al. (2020), and indeed, such an increase was found here. The relatively high correlation between the DP of the NCDC and the ERA5 (Fig. 10d and to a lesser degree Fig. 10f) also indicates that the trends in the ERA5 are not artifacts. Thus, it is possible that the new advanced reanalysis ERA5, which we analyzed here, more accurately reflects reality and that the increasing trends in wind speed are indeed real. Previous studies had reported the weakening of surface terrestrial winds and attributed it to an increased roughness due to urbanization and changes in vegetation Vautard et al. (2010); Wu et al. (2018). However, a more recent study reported a decreasing trend in terrestrial wind activity till 2010 followed by a more rapid increasing trend Zeng et al. (2019) and suggested that the observed trends are associated with large-scale ocean-atmosphere decadal variability.
We also analyzed the trends of the sensible heat flux of the ERA5 (Fig. S10). Here, the trends are not similar to the trends in DP and wind speed. Yet, there is an increasing trend over the ocean. In addition, there is a difference between the trends in the first phase of the data (1950–1980) and the last part of the data (1980–2021); this may be related to the two phases of the ERA5, namely, 1950–1978 and 1979 to the present day.
4 Summary and Discussion.
In this study, we investigated two aspects of the wind field—the diurnal cycle of the wind and trends in wind activity over the past 70 years or so. We considered three measures of the wind: (i) wind drift potential (DP), which captures extreme wind activity and is used as a measure for potential sand transport over sand dunes, (ii) wind speed, and (iii) wind power, which is proportional to the cube of the wind speed. We mainly focus on the timing of the DP maximum and show that over land, especially over the dune regions, the wind peaks during the daytime, whereas it significantly weakens at night; these results are consistent with a recent study regarding the sand activity in the area of White Sands National Park in the US Gunn et al. (2021) and with studies regarding sand and dust activity in the Taklimakan and Gurbantunggut Deserts Yang et al. (2013, 2018); Zhou et al. (2019). We attributed the enhanced winds, over land and during the daytime, to the small heat capacity of the ground, which warms and cools quickly, resulting in convection during the daytime and inversion at night; this leads to active upper atmospheric levels that are disconnected from the surface at night, which eventually leads to weaker nighttime surface winds. Over the ocean, there is no clear diurnal cycle, most likely due to the almost constant sea surface temperature on time scales of 24 hours. These results are supported by the difference between the daily maximum and the daily minimum of sensible heat flux. There is no clear diurnal cycle over icy regions such as Antarctica and Greenland, which is consistent with the small sensible heat flux difference over these regions. We did not observe significant temporal variations in the timing of the maximum wind from 1950 to 2021; this is in contrast to the increasing temporal trends in DP, wind speed, and wind power.
We also analyzed the trends in DP, wind speed, and wind power during the period 1950–2021; we analyzed these trends over the entire globe, the ocean, the land, and sand dune regions. Increasing trends in wind speed were reported in several studies, both based on real data (e.g., Young et al., 2011; Young and Ribal, 2019; Yu et al., 2020) and reanalysis data (e.g., Wohland et al., 2019; Yu et al., 2020); these previous studies did not perform the analysis on the ERA5 data using DP and did not focus on dune regions. We find significantly increasing wind activity (as reflected by DP, wind speed, and wind power) over the ocean, especially over the Southern Ocean, less significant increasing trends over land, and even less significant increasing trends over the dune regions. We note, however, that in some specific locations, the wind has weakened over the past decades. The overall increasing trend may be the result of biases and measurement techniques that have changed over time. Yet, previous studies reported increasing wind speed over the ocean Young et al. (2011); Young and Ribal (2019), especially over the Southern Ocean Yu et al. (2020), strengthening the validity of our results. Results that are based on measured NCDC data indicate that the ERA5 underestimates real values, while the temporal trends are more reliable. Our results show that the increasing trend in DP over the dunes is weak, most likely indicating no (or weak) significant increase in dune mobility in the past 70 years or so; still, the above is valid on average, such that particular dune regions might experience a decreasing trend in wind activity. Winds are associated with pressure gradients, which are closely related to temperature gradients, which are, in turn, related to ocean-atmosphere interactions/oscillations Zeng et al. (2019); since the surface temperature has increased over the past decades, and in a spatially uneven manner, the temperature gradients may also have varied, leading to changes in wind activity.
In a recent study, Gunn et al. (2022) analyzed one of the Climate Model Intercomparison Project (CMIP6) models using different future Shared Socioeconomic Pathway (SSP) scenarios and predicted reduced activity and stagnation during the 21 century of the currently active dunes. According to this study, the stagnation process started around 1970. These findings are not fully consistent with the results we reported here, that the DP exhibited a slight increase over the dune regions from 1950 to 2021. The difference might be due to the different nature of ERA5 and the CMIP6 models, where the former is adjusted to the observed data every several hours while the latter starts from 1850 initial conditions and then integrated forward in time.
Winds play a central role in the climate system, on both global and local scales. Thus, it is important to study the wind’s characteristics. Moreover, winds are the driving force of dunes and determine the dune’s activity level and morphology Sun and Gao (2022), and dust emission. Our results indicate, as was proposed in a previous study Gunn et al. (2021), that dunes are active during the daytime and are almost completely inactive at night. Our results may have important consequences for wind energy production over the land and the ocean.
Acknowledgments
References
- Abbasi et al. (2019) Abbasi, H.R., Opp, C., Groll, M., Rohipour, H., Gohardoust, A., 2019. Assessment of the distribution and activity of dunes in Iran based on mobility indices and ground data. Aeolian Research 41, 100539.
- Ashkenazy et al. (2012) Ashkenazy, Y., Yizhaq, H., Tsoar, H., 2012. Sand dune mobility under climate change in the Kalahari and Australian deserts. Clim. Change 112, 901–923, doi:10.1007/s10584–011–0264–9.
- Bagnold (1941) Bagnold, R.A., 1941. The physics of blown sands and desert dunes. Chapmann and Hall, London.
- Bel and Ashkenazy (2014) Bel, G., Ashkenazy, Y., 2014. The effects of psammophilous plants on sand dune dynamics. J. Geophys. Res. 119, 1636–1650.
- Cardone et al. (1990) Cardone, V.J., Greenwood, J.G., Cane, M.A., 1990. On trends in historical marine wind data. Journal of Climate 3, 113–127.
- Danin (1991) Danin, A., 1991. Plant adaptation in desert dunes. J. Arid Environments 21, 193–212.
- Danin (1996) Danin, A., 1996. Plants of desert dunes. Springer, Berlin.
- Fryberger (1979) Fryberger, S.G., 1979. Dune forms and wind regime, in: McKee, E.D. (Ed.), A study of global sand seas. U.S. Geol. Surv.. volume 1052, pp. 137–169.
- Gill (1982) Gill, A.E., 1982. Atmosphere–ocean dynamics. Academic Press, London.
- Gunn et al. (2022) Gunn, A., East, A., Jerolmack, D.J., 2022. 21st-century stagnation in unvegetated sand-sea activity. Nature Communications 13, 1–7.
- Gunn et al. (2021) Gunn, A., Wanker, M., Lancaster, N., Edmonds, D.A., Ewing, R.C., Jerolmack, D.J., 2021. Circadian rhythm of dune-field activity. Geophysical Research Letters 48, e2020GL090924.
- Hande et al. (2012) Hande, L., Siems, S.T., Manton, M.J., 2012. Observed trends in wind speed over the Southern Ocean. Geophysical Research Letters 39.
- Hersbach et al. (2020) Hersbach, H., Bell, B., Berrisford, P., Hirahara, S., Horányi, A., Muñoz-Sabater, J., Nicolas, J., Peubey, C., Radu, R., Schepers, D., et al., 2020. The ERA5 global reanalysis. Quarterly Journal of the Royal Meteorological Society 146, 1999–2049.
- Hugenholtz et al. (2010) Hugenholtz, C.H., Bender, D., Wolfe, S.A., 2010. Declining sand dune activity in the southern Canadian prairies: Historical context, controls and ecosystem implications. Aeolian Research 2, 71–82.
- Hugenholtz and Wolfe (2005) Hugenholtz, C.H., Wolfe, S.A., 2005. Recent stabilization of active sand dunes on the Canadian prairies and relation to recent climate variations. Geomorphology 68, 131–147.
- Kutiel (2001) Kutiel, P., 2001. Conservation and management of the Mediterranean coastal sand dunes in Israel. Journal of Coastal Conservation 7, 183–192.
- Lancaster (1988) Lancaster, N., 1988. Development of linear dunes in the southwestern Kalahari, southern Africa. J. Arid Environs 14, 233–244.
- Levin (2011) Levin, N., 2011. Climate-driven changes in tropical cyclone intensity shape dune activity on Earth’s largest sand island. Geomorphology 125, 239–252.
- Li et al. (2015) Li, J., Liu, H., Su, Z., Fan, X., 2015. Changes in wind activity from 1957 to 2011 and their possible influence on aeolian desertification in northern China. Journal of Arid Land 7, 755–764.
- Mason et al. (2008) Mason, J.A., Swinehart, J.B., Lu, H., Miao, X., Cha, P., Zhou, Y., 2008. Limited change in dune mobility in response to a large decrease in wind power in semi-arid northern China since the 1970s. Geomorphology 102, 351–363.
- Maun (2009) Maun, M.A., 2009. The biology of coastal sand dunes. Oxford University Press.
- Munk (1966) Munk, W., 1966. Abyssal recipes. Deep Sea Res. 13, 707–730.
- Munk and Wunsch (1998) Munk, W., Wunsch, C., 1998. Abyssal recipes ii: energetics of tidal and wind mixing. Deep Sea Res. 45, 1977–2010.
- Pye (1982) Pye, K., 1982. Morpholgical development of coastal dunes in a humid trophical environment, cape bedford and cape flattery, north queensland. Geografiska Annaler. Series A. Physical Geography 64, 213–227.
- Pye and Tsoar (2008) Pye, K., Tsoar, H., 2008. Aeolian sand and sand dunes. Springer Science & Business Media.
- Rocha et al. (2004) Rocha, P.L.B.d., Queiroz, L.P.d., Pirani, J.R., 2004. Plant species and habitat structure in a sand dune field in the Brazilian Caatinga: a homogeneous habitat harbouring an endemic biota. Brazilian Journal of Botany 27, 739–755.
- Shanas et al. (2006) Shanas, U., Abu-Galyun, Y., Alshamlih, M., Cnaani, J., Guscio, D., Khoury, F., Mitler, S., Nassar, K., Shapira, I., Simon, D., Sultan, H., Topel, E., Ziv, Y., 2006. Reptile diversity and rodent community structure across a political border. Biological Conservation 132, 292–299.
- Stopa and Cheung (2014) Stopa, J.E., Cheung, K.F., 2014. Intercomparison of wind and wave data from the ECMWF Reanalysis Interim and the NCEP Climate Forecast System Reanalysis. Ocean Modelling 75, 65–83.
- Sun and Gao (2022) Sun, W., Gao, X., 2022. Geomorphology of sand dunes in the Taklamakan Desert based on ERA5 reanalysis data. Journal of Arid Environments 207, 104848.
- Thomas et al. (2008) Thomas, B.R., Kent, E.C., Swail, V.R., Berry, D.I., 2008. Trends in ship wind speeds adjusted for observation method and height. International Journal of Climatology: A Journal of the Royal Meteorological Society 28, 747–763.
- Thomas (1997) Thomas, D.S.G., 1997. Arid Zone Geomorphology. Wiley, New-York. chapter Sand seas and aeolian bedforms. pp. 373–412.
- Thomas et al. (2005) Thomas, D.S.G., Knight, M., Wiggs, G.F.S., 2005. Remobilization of southern African desert dune systems by twenty-first century global warming. Nature 435, 1218–1221.
- Thomas and Wiggs (2008) Thomas, D.S.G., Wiggs, G.F.S., 2008. Aeolian systems response to global change: challenges of scale, process and temporal integration. Earth Surface Processes and Landforms 33, 1396–141.
- Tsoar (2005) Tsoar, H., 2005. Sand dunes mobility and stability in relation to climate. Physica A 357, 50–56.
- Tsoar (2008) Tsoar, H., 2008. Land use and its effect on the mobilization and stabilization of the NW Negev sand dunes, in: Breckle, S.W., Yair, A., Veste, M. (Eds.), Arid Dune Ecosystems. Springer, Berlin. volume 200 of Ecological Studies, pp. 79–90.
- Vautard et al. (2010) Vautard, R., Cattiaux, J., Yiou, P., Thépaut, J.N., Ciais, P., 2010. Northern hemisphere atmospheric stilling partly attributed to an increase in surface roughness. Nature geoscience 3, 756–761.
- Veste et al. (2001) Veste, M., Littmann, T., Breckle, S.W., Yair, A., 2001. The role of biological soil crusts on desert sand dunes in the northwestern Negev, Israel, in: Breckle, S., Veste, M., Wucherer, W. (Eds.), Sustainable Land Use in Deserts. Springer, pp. 357–367.
- Wang et al. (2005) Wang, X., Dong, Z., Yan, P., Zhang, J., Qian, G., 2005. Wind energy environments and dunefield activity in the Chinese deserts. Geomorphology 65, 33–48.
- Ward (1992) Ward, M.N., 1992. Provisionally corrected surface wind data, worldwide ocean-atmosphere surface fields, and sahellan rainfall variability. Journal of Climate 5, 454–475.
- Ward and Hoskins (1996) Ward, M.N., Hoskins, B.J., 1996. Near-surface wind over the global ocean 1949–1988. Journal of Climate 9, 1877–1895.
- Wohland et al. (2019) Wohland, J., Omrani, N.E., Witthaut, D., Keenlyside, N.S., 2019. Inconsistent wind speed trends in current twentieth century reanalyses. Journal of Geophysical Research: Atmospheres 124, 1931–1940.
- Wu et al. (2018) Wu, J., Zha, J., Zhao, D., Yang, Q., 2018. Changes in terrestrial near-surface wind speed and their possible causes: an overview. Climate dynamics 51, 2039–2078.
- Wunsch (2020) Wunsch, C., 2020. Is the ocean speeding up? ocean surface energy trends. Journal of Physical Oceanography 50, 3205–3217.
- Yang et al. (2018) Yang, X., He, Q., Liu, X., Yang, F., Huo, W., Shen, S., Mamtimin, A., 2018. Saltation activity and its threshold velocity in the Gurbantunggut Desert, China. Natural Hazards 90, 349–364.
- Yang et al. (2013) Yang, X., He, Q., Mamtimin, A., Huo, W., Liu, X., 2013. Diurnal variations of saltation activity at Tazhong: the hinterland of Taklimakan Desert. Meteorology and Atmospheric Physics 119, 177–185.
- Yizhaq et al. (2013) Yizhaq, H., Ashkenazy, Y., Levin, N., Tsoar, H., 2013. Spatiotemporal model for the progression of transgressive dunes. Physica A , doi: 10.1016/j.physa.2013.03.066.
- Yizhaq et al. (2007) Yizhaq, H., Ashkenazy, Y., Tsoar, H., 2007. Why do active and stabilized dunes coexist under the same climatic conditions? Phys. Rev. Lett. 98, 188001.
- Yizhaq et al. (2009) Yizhaq, H., Ashkenazy, Y., Tsoar, H., 2009. Sand dune dynamics and climate change: A modeling approach. J. Geophys. Res. 114, F01023.
- Yizhaq et al. (2020) Yizhaq, H., Xu, Z., Ashkenazy, Y., 2020. The effect of wind speed averaging time on the calculation of sand drift potential: New scaling laws. Earth and Planetary Science Letters 544, 116373.
- Young et al. (2011) Young, I., Zieger, S., Babanin, A.V., 2011. Global trends in wind speed and wave height. Science 332, 451–455.
- Young and Ribal (2019) Young, I.R., Ribal, A., 2019. Multiplatform evaluation of global trends in wind speed and wave height. Science 364, 548–552.
- Yu et al. (2020) Yu, L., Zhong, S., Sun, B., 2020. The climatology and trend of surface wind speed over Antarctica and the Southern Ocean and the implication to wind energy application. Atmosphere 11, 108.
- Zeng et al. (2019) Zeng, Z., Ziegler, A.D., Searchinger, T., Yang, L., Chen, A., Ju, K., Piao, S., Li, L.Z., Ciais, P., Chen, D., et al., 2019. A reversal in global terrestrial stilling and its implications for wind energy production. Nature Climate Change 9, 979–985.
- Zhang and Zheng (2004) Zhang, D.L., Zheng, W.Z., 2004. Diurnal cycles of surface winds and temperatures as simulated by five boundary layer parameterizations. Journal of Applied Meteorology and Climatology 43, 157–169.
- Zhang et al. (2018) Zhang, H., Fan, J., Cao, W., Harris, W., Li, Y., Chi, W., Wang, S., 2018. Response of wind erosion dynamics to climate change and human activity in Inner Mongolia, China during 1990 to 2015. Science of the Total Environment 639, 1038–1050.
- Zhou et al. (2019) Zhou, C., Mamtimin, A., Pan, H., Yang, F., Huo, W., Meng, L., Jin, L., Yang, X., 2019. Relationship between air temperature and horizontal sand-dust flux observed in the Taklimakan Desert, China. Theoretical and Applied Climatology 138, 1845–1852.
Figures

Supplementary Figures