Prospects for Perovskite/Silicon tandem solar cells to outperform
c-Silicon solar cells at elevated temperatures
Abstract
Successful commercialization of Perovskite/Si tandem solar cells (P/Si TSCs) need a-priori estimation of technological benchmarks to outperform c-Si based technologies under field conditions. To this end, through detailed numerical simulations and analytical modeling, here we identify the limits of ion migration and lifetime degradation till which P/Si TSCs remain competitive. Our results unravel a unique scaling law for the evolution of the efficiency and the temperature coefficient of P/Si TSCs which allows us to anticipate the limiting annual degradation rates. Interestingly, we find that 4T cells are potentially more immune to the ill effects of ion migration as compared to 2T cells. These insights are of broad relevance for material/interface engineering approaches and physics based accelerated tests which are focused towards long term stability and module reliability.
I Introduction
Commercialization of Perovskite/Si Tandem Solar Cells (P/Si TSCs) appears a promising reality as the efficiencies reportedLaboratory [accessed 2022] ( ) are now comparable to the theoretical Shockley-Queisser limitsShockley and Queisser [1961] of single junction silicon solar cells. The economic viability of such tandem solar cells depend on the performance at elevated temperatures in field conditions. Accordingly, the parameters of most importance are the temporal evolution of power conversion efficiency () and temperature coefficient (). As several phenomena degrade perovskites, it is crucial to identify the phase space of critical parameters where P/Si TSCs retain an efficiency advantage over conventional c-Si solar cells under field conditions.
Efficiency of solar cells at elevated temperatures can be expressed in terms of its temperature coefficientMoot et al. [2021] () as follows
| (1) |
where and denote the efficiencies at high temperature () and room temperature (), respectively. Further, let denotes the ratio of efficiencies at room temperature, while denotes the ratio of the corresponding temperature coefficients. Note that the subscripts and denote tandem and c-Si, respectively. The corresponding efficiency ratio () under field conditions (i.e., at ) is defined as . Simple analysis using eq. 1 indicates that
| (2) |
For the economic viability of P/Si TSCs, it is essential that . Interestingly, however, both and could be time dependent due to the various degradation mechanisms. Hence, the event with could occur at conditions other than the trivial solution of which makes long term performance comparisons non-trivial. Under the influence of ion migration and lifetime degradation (due to interface recombination or bulk traps), here we show that
| (3) |
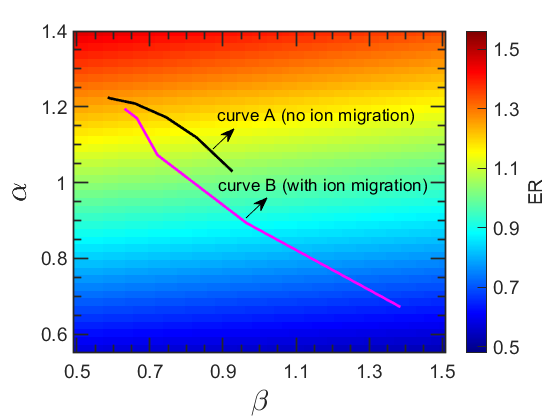
where and are constants influenced by various parameters including the properties of the c-Si bottom cell. Accordingly, Fig. 1 shows that while the P/Si TSCs could remain competitive (i.e., ) in the absence of ion migration (curve A), critical phenomena like interface degradation along with ion migration (curve B) influence the ER in non-trivial manners which could make P/Si TSCs progressively less appealing than c-Si solar cells (i.e., ).
The rest of the manuscript provides arguments which lead to the results shown in Fig. 1 and the implications of the same. These insights will allow us to identify critical limits of degradation till which P/Si tandem cells remain competitive. Indeed, such quantitative estimates could contribute towards mitigation and characterization strategies (including accelerated tests) from material and interface engineering perspectives.
II On the estimation of ,
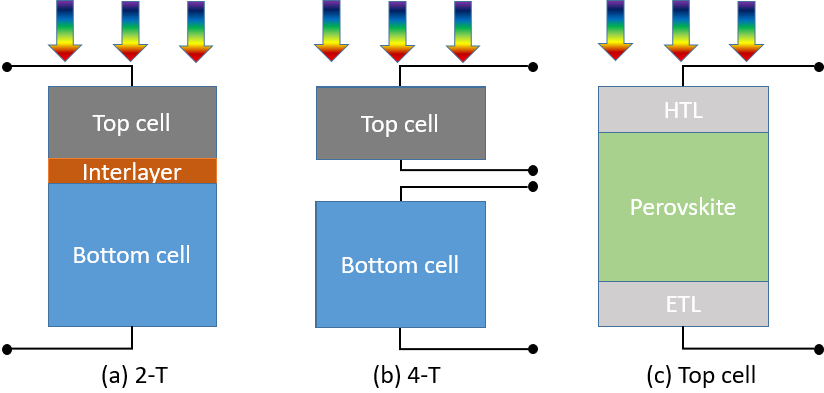
It is evident from eqs. 2-3 that the viability of P/Si TSCs is dictated by the dependence of parameters and on phenomena like ion migration and interface/lifetime degradation. Modeling the steady state current-voltage characteristics (see Fig. 2) with the perovskite top cell under the influence of ion migration is a formidable challenge due to scale of physical mechanisms involved. While the layer thicknesses in the top cell are of the order of hundreds of nm, the ionic screening lengths are of the order of a few nm. On the other hand, the physical dimensions and characteristic lengths of relevant phenomena like diffusion in c-Si bottom cell are of the order of hundreds of . In addition, the optimal architecture for Si bottom cell is still under debateMessmer et al. [2021].
Accordingly, here we first obtain the respective steady state J-V characteristics of the top cell and bottom cell with appropriate parameters. As the two cells are connected in series, the J-V characteristics of the tandem configuration is then obtained using the individual J-V characteristics (the validity of this approach was verified using detailed numerical simulations, see Suppl. Mat.). As solar cells are typically employed in maximum power point conditions, the most important parameter is the efficiency under steady conditions. Hence, here we address the steady state efficiency and not the transient or scan rate dependent efficiencies. Hysteresis of tandem solar cells will be addressed in future communications.
Perovskite top cell: Modeling strategy for perovskite solar cells under the influence of ion migration is well established in prior literaturevan Reenen et al. [2015], Kumar [2021], Courtier [2019] as well as our own previous publications Nandal and Nair [2017], Saketh Chandra et al. [2021], Sivadas et al. [2021]. Briefly, the electrostatics and transport of charge carriers as well as ions are addressed through the well-known self-consistent scheme of Poisson and continuity equations (see section A and Table S1 of Suppl. Mat. for equations and various parameters involved). Here, we consider negative mobile ions while positive ions are uniformly distributed in the active region. The photo-induced carrier generation rates are estimated through solution of Maxwell’s equations using TMM methodBurkhard et al. [2010]. We consider carrier recombination through trap assisted Shockley-Read-Hall (SRH), Auger, and radiative mechanisms. Further, carrier recombination at the interfaces between perovskite and transport layers are accounted though appropriate recombination velocitiesWang et al. [2018] ().
It is well known that band gap of the perovskites increases with temperatureMoot et al. [2021], Aydin et al. [2020]. The same is accounted through an empirical relation, , where K is extracted from the experimental dataMoot et al. [2021]. In addition, temperature dependence of other parameters like the density of states, capture coefficients, etc. are also considered as per literatureMoot et al. [2021]. Table II of Suppl. Mat. summarizes the functional dependence of such parameters. Details of the numerical simulation methodology including calibration with experimental results are available in our prior publications Saketh Chandra et al. [2021], Sivadas et al. [2021], Nandal and Nair [2017], Singareddy et al. [2021] and in Sec. A-D, Suppl. Mat.
Silicon bottom cell: A variety of Silicon cell architecturesMessmer et al. [2021] are under consideration for the bottom cell including PERC (Passivated Emitter Rear Cell), TOPCon (Tunnel Oxide Passivated Contact), and other carrier selective designs. However, the optimal configuration among them for tandem cells is yet to be identifiedMessmer et al. [2021]. Hence, it is important to employ a generic scheme which can anticipate the essential features at elevated temperatures for a variety of bottom cell architectures. In this regard, we describe the bottom cell using the well known ideal diode equation
| (4) |
Here, the parameters , and are appropriately chosen such that the temperature dependent characteristics are well calibrated against typical industry standard c-Si solar cellsGreen et al. [1982], Zhao et al. [1994]. See Sec. B of Suppl. Mat. for additional details.
III Influence of ion migration on ,
Based on the above described numerical simulation methodology, here we elucidate the functional dependence of and on critical phenomena like ion migration and interface recombination. To this end, the temperature dependent performance of tandem cell is obtained through the respective characteristics of the top and bottom cells.
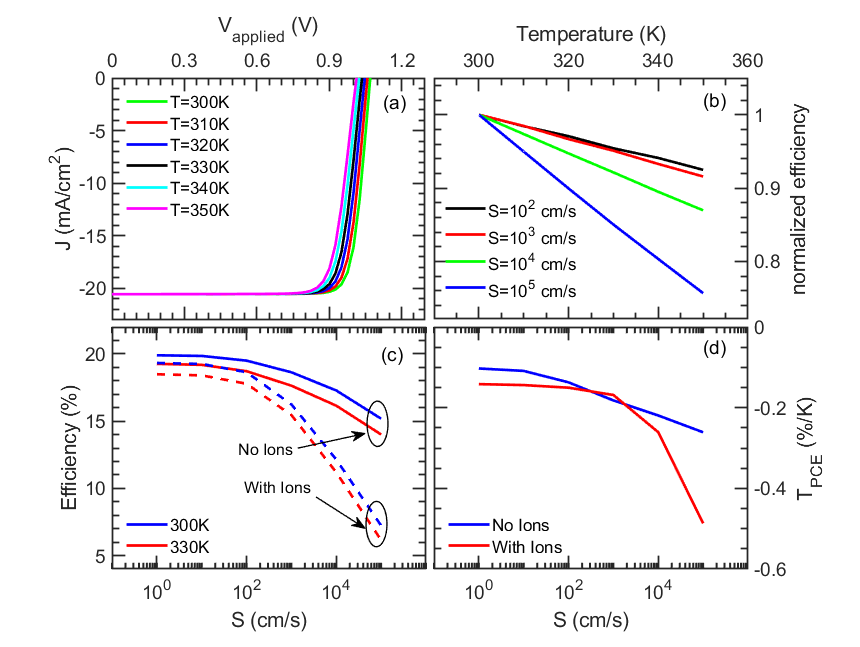
Perovskite top cell: Figure 3 shows the temperature dependent characteristics of the perovskite top cell in the presence of ion migration and interface degradation. Part (a) shows the JV characteristics for various temperatures while part (b) shows that interface degradation critically influences the temperature dependence of normalized efficiency. Importantly, the efficiency degradation is significant for cm/s.
Part (c) of Fig. 3 illustrates the influence of ions on the efficiency degradation of perovskite top cell. It is evident that the presence of ions exacerbates the influence of interface recombination. Accordingly, the temperature coefficient of efficiency is shown in part (d). Interestingly, we find that even for excellent interfaces (i.e., ), ion migration degrades the from to . In the absence of ions, degrades steadily in the mid range of (i.e., cm/s). For the same range, the corresponding variation in is rather insignificant in the presence of ions. For larger (i.e., cm/s), ion migration is significantly more detrimental and results in rapid degradation in both and .
Silicon bottom cell: Temperature dependent J-V characteristics of the Silicon solar cell are shown in Fig. 1, Sec. B of Suppl. Mat. Current matching conditions with top cell at room temperature is assumed. Accordingly, we use , which is the typical value reported for 2T configurationsAydin et al. [2020], De Bastiani et al. [2021]. Similarly, the Voc and FF of our simulations also compare well with results of same publication. In addition, our simulations compare well with the characteristics of typical Si solar cellsGreen et al. [1982], Zhao et al. [1994] with temperature coefficient of Jsc being and that of Voc being . Accordingly, the of silicon sub-cell is . This indicates that the simple model based on eq. 4 anticipates the temperature dependence of bottom cell. The same approach could be used to explore the effectiveness of a wide variety of c-Si based solar cells as the bottom cell.
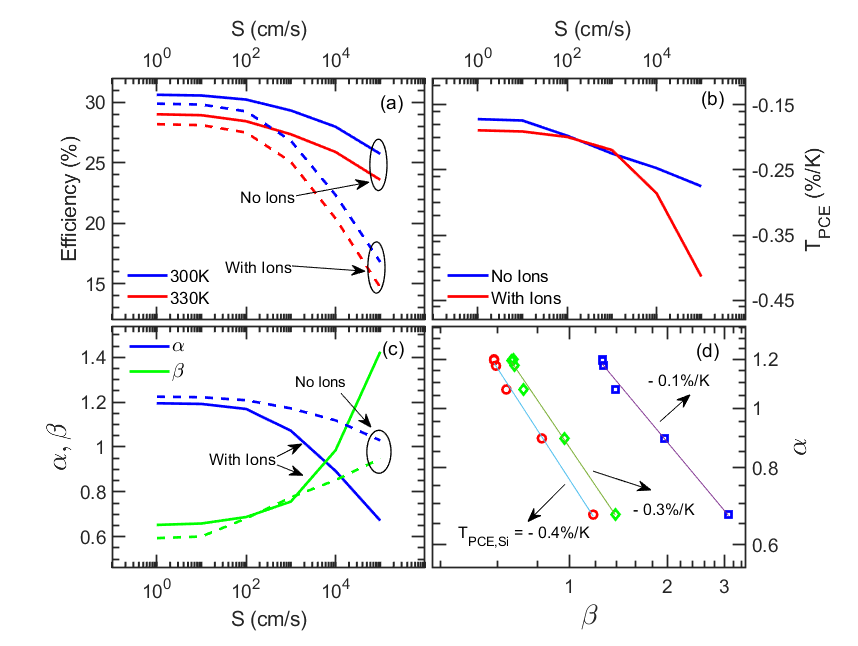
2-T tandem cell: As mentioned earlier, the characteristics of the tandem cell could be obtained as a combination of the top and bottom cell characteristics (the validity of this approach was verified using detailed numerical simulations, see Sec. C of Suppl. Mat.). Accordingly, the influence of interface recombination on efficiency and of tandem solar cells, both in the presence and absence of ions, are shown in parts (a) and (b) of Fig. 4, respectively. While both the top and bottom cell properties influence the of the tandem cell, the is always better than (or almost equal to) the worst performing sub-cell (see Fig. 4 of Suppl. Mat.).
Figure 4b indicates that the of tandem cells is of the order of -0.2 to -0.3 for cm/s. Re-assuringly, the experimentally reportedAydin et al. [2020] and of 2-T tandem cells are of the order of and , which compares very well with our simulation results - thus validating the methodology and the parameters involved (see Sec. D of Suppl. Mat. for additional discussion on the comparison with experimental data). Fig. 4b also indicates that interface degradation beyond cm/s under the presence of ion migration could prove severely critical for P/Si tandem solar cells.
The results shown in Fig. 4a,b allow us to gather insights on the degradation dependent variation of and . Part (c) of Fig. 4 indicates that reduces while increases with an increase in . Interestingly, as the device degrades due to ion migration and interface degradation, we find a unique trend between and for different (see Fig. 4d). Evidently, , with the being , and for and , respectively. This observation forms the basis of eq. 3 which allows us to estimate the competitiveness of P/Si TSC against various c-Si architectures. Similar scaling laws are found to be applicable for various other scenarios like degradation in the carrier lifetime of the perovskite active layer, etc. (details provided in Sec. F of Suppl. Mat.)
IV Implications
Ion migration and critical : The results in Fig. 4c clearly illustrates the ill effects of ion migration. In the absence of ion migration even for very large . On the other hand, in the presence of significant ion migration, degrades so much that P/Si TSCs could become noncompetitive. It is well known that mobile ions screen the electric field in the perovskite active layer. Calado et al. [2016], Moia et al. [2022] As a result, the interface recombination increases with significant ion migration resulting in efficiency loss. Accordingly, it can be analytically shown that the has a dependence and hence the variation of with , as shown in Fig. 4c.
Equations 2-3 and Fig. 4 allow to estimate the competitiveness of TSCs against - (a) c-Si cells of the same technology as the bottom cell of TSCs, or (b) c-Si cells with a technology other than that of the bottom cells. For part (a), we can rely on eqs. 2-3 along with the trends shown in Fig. 4d. Simple analysis (see Fig. 1) indicates that P/Si TSCs remain competitive till , with a weak dependence on of the bottom cell. For such cases cm/s represents the critical limiting interface degradation (as indicated in Fig. 4c). Sec. G of Suppl. Mat. provides additional theoretical analysis involving eqs. 2-3 which leads to the above limits for .
Admissible annual degradation rates: Direct comparison with other solar cell technologies, for example PERC solar cells, is possible using eq. 1 itself with the appropriate values of . However, the of commerical Si solar cells exhibit a broad range. For example, HITCorporation [May 18 2017] (Heterojunction with Intrinsic Thin layer) solar cells report a of while that for PERCWang et al. [2020] solar cells is . With such properties for the bottom cell, the results in Fig. 4c,d indicate that the of P/Si TSCs could vary over a range of to . Hence, as per eqs. 1-2, the competitiveness of TSCs is primarily dictated by the parameter . To be competitive over c-Si cells over a period of years, it can be shown that
| (5) |
where denotes the annual efficiency degradation rate. The subscripts and represents TSC and c-Si solar cells, respectively. A broad range for is reported for PV modules Jordan et al. [2016]. For example, the mean for c-Si based modules is year while the corresponding value for HIT solar cells is year. As a first order estimate, with year, years, , and , eq. 5 predicts that year.
It is evident that the energy yield of TSCs will be much more than the c-Si over the duration of N years under consideration. Unsurprisingly, improvements in can offset sub-optimal . Interestingly, recent LCOE (Levelized Cost of Electricity) analysisQian et al. [2019] indicate similar values for critical for P/Si TSCs (i.e., year). However, such LCOE analysis seldom correlate degradation rates with any physical mechanisms involved. On the other hand, our analysis clearly anticipate such critical degradation rates along with their correlation to physical degradation phenomena. Further, our analysis also indicates that the current state-of-the art P/Si TSCs (i.e., with ) have to be nearly as good as c-Si modules (in terms of annual degradation rates) with cm/s to remain competitive. Evidently, the same results also indicate the need to arrest ion migration for long term stability.
Lifetime degradation and trap density: The limiting value for can be, equivalently, interpreted in terms of interface trap density. Bulk trap density of the order of is routinely reported for perovskitesChen et al. [2019], Ng et al. [2020]. With minority carrier lifetimes of the order of , the carrier capture rates are of the order of . However, as indicated by recent experimentsAl Mamun et al. [2017] the interface trap density could be an order of magnitude higher (). Assuming thickness material interfaces, the is of the order of cm/s for good quality passivated interfaces - an estimate supported by experimental resultsGrant et al. [2017]. Degradation of the interface or lack/loss of passivation could result in cm/s - another trend supported by literatureYang et al. [2015], Wu et al. [2017].
In addition to the above, perovskites could have degradation in bulk carrier lifetime (). Here, the degradation could introduce different functional dependence on critical parameters like , , and result in current mismatch between top and bottom cell. Our simulations indicate that eq. 3 holds good for this scenario as well with distinct and other unique trends (see Sec. F of Suppl. Mat.). For example, while both and vary significantly with , we find that remains rather unvarying with changes in . Hence, the time evolution of and along with allows one to distinguish between interface vs. bulk degradation of the perovskite active layer. These insights could be useful to the development of novel characterization strategies.
Interface engineering and lifetime prediction: The non-linear variation of with has interesting implications towards interface engineering approaches. For example, the trends in Fig. 4c (and Fig. 3c) indicate that the remains stable till cm/s and rapidly deteriorate afterwards. Hence any interface engineering which results in cm/s might seem to be successful towards the challenge of stability improvement - at least during the early days of stability testing. Not surprisingly, such an improvement has been reported by multiple groups Wang et al. [2018], Wolff et al. [2019] - although long term stability under field conditions is yet to be thoroughly explored.
Given the non-linear dependence of on , it is crucial to accurately characterize the temporal evolution of trap density () near the interface. With for cm/s and , it is important to accurately characterize the time evolution of . For example, if generation follows a first order process (with various activation energies), the resulting degradation during early years could vary linearly with time. On the other hand, if varies as a power law with time (as seen in interface degradation of field effect devicesAlam et al. [2007]), it could result in a dependence for efficiency degradation (where is the time). Hence accurate characterization of the time evolution of is crucial to develop predictive models for lifetime and stability.
2T vs. 4T: The methodology described in this manuscript is well suited to compare the effectiveness of 2T configuration vs. 4T configuration. Evidently, 4T configurations are not limited by the current mismatch conditions as compared to 2T schemes. Accordingly, for many scenarios, the theoretical efficiency of 4T cells could be more than that of 2T cellsJiang et al. [2016], Futscher and Ehrler [2016], Cheng and Ding [2021] - eventhough there are additional system level complexities associated with interconnects and electronics. Our results indicate that for the set of parameters considered in this manuscript, the 4T cells outperform 2T cells. Specifically, the efficiency of 4T cells could be while the corresponding efficiency of 2T cells is (see Sec. H of Suppl. Mat.). We find that ion migration and lifetime degradation influences both configurations in a similar manner (with comparable ). However, the improved baseline efficiency of 4T cells allow them to remain competitive even for larger (or degradation in ). The critical , under the influence of ion migration, for 4T cells is cm/s which is an order of magnitude more than that of 2T cells and hence a significant advantage. In addition, 4T cells might have other advantages like possible replacement of perovskite top layers with additional system level costs.
In this manuscript, we explicitly considered the influence of inherent or internal degradation mechanisms on tandem cell efficiency while the overall degradation could be influenced by other factors including the bottom cell, encapsulants, metal corrosion, etc., In addition, aspects like interlayer degradation, band level alignments, energy level of traps, etc. could critically influence the performance of tandem cells (results to be communicated soon including the influence of voltage scan rates). Further, it is evident that phase changes/segregation and associated material degradation could be additional concerns for TSCs. Indeed, solar spectrum variations (seasonal vs. daily) and ambient climatic conditions (temperature, humidity, etc.) could be other interesting aspects which can influence the overall energy yield and hence the ideal locations favorable for futuristic solar power plants based on P/Si TSCs. Importantly, any deviation from a simple traditional annual linear degradation could have significant implications on methodology to estimate the viability of perovksites and P/Si tandem cells. Clearly more studies are needed in this direction which could result in a synergistic development of predictive models and accelerated tests.
V Conclusions
To summarize, ion migration and lifetime degradation are found to degrade the performance of P/Si TSCs. Through a combination of analytical modeling and detailed numerical simulations, here we identified the phase space of critical parameters which ensure competitiveness of P/Si TSCs. Our results clearly indicate the need to arrest either interface/lifetime degradation or ion migration or both. Further, our methodology allows facile comparison of P/Si TSCs against multiple c-Si technologies and indicates that 4T configuration could be more resilient to the ill-effects due to ion migration. Importantly, our results provide clear technological benchmarks to be met for P/Si TSCs to outperform c-Si based technologies under field conditions and hence could be of broad relevance to efforts on long term stability and accelerated tests.
VI Supplementary Materials
Additional details like simulation methodology, calibration against experimental trends, the influence of and on bulk lifetime degradation, theoretical arguments which lead to critical , and a comparison between 2T and 4T cells are available in Suppl. Mat.
VII Acknowledgements
This work was funded by Science and Engineering Research Board (SERB, project code CRG/2019/003163), Department of Science and Technology (DST), India. The authors acknowledge IITBNF and NCPRE for computational facilities and Abhimanyu S. for the calibration with TCAD simulations. P.R.N. acknowledges Visvesvaraya Young Faculty Fellowship.
References
References
- Laboratory [accessed 2022] National Renewable Energy Laboratory. Best research-cell efficiencies, accessed 2022.
- Shockley and Queisser [1961] William Shockley and Hans J Queisser. Detailed balance limit of efficiency of p-n junction solar cells. Journal of applied physics, 32(3):510–519, 1961.
- Moot et al. [2021] Taylor Moot, Jay B Patel, Gabriel McAndrews, Eli J Wolf, Daniel Morales, Isaac E Gould, Bryan A Rosales, Caleb C Boyd, Lance M Wheeler, Philip A Parilla, et al. Temperature coefficients of perovskite photovoltaics for energy yield calculations. ACS Energy Letters, 6(5):2038–2047, 2021.
- Messmer et al. [2021] Christoph Messmer, Baljeet S Goraya, Sebastian Nold, Patricia SC Schulze, Volker Sittinger, Jonas Schön, Jan Christoph Goldschmidt, Martin Bivour, Stefan W Glunz, and Martin Hermle. The race for the best silicon bottom cell: Efficiency and cost evaluation of perovskite–silicon tandem solar cells. Progress in Photovoltaics: Research and Applications, 29(7):744–759, 2021.
- van Reenen et al. [2015] Stephan van Reenen, Martijn Kemerink, and Henry J Snaith. Modeling anomalous hysteresis in perovskite solar cells. The journal of physical chemistry letters, 6(19):3808–3814, 2015.
- Kumar [2021] Atul Kumar. Numerical modelling of ion-migration caused hysteresis in perovskite solar cells. Optical and Quantum Electronics, 53(4):1–9, 2021.
- Courtier [2019] Nicola Elizabeth Courtier. Modelling ion migration and charge carrier transport in planar perovskite solar cells. PhD thesis, University of Southampton, 2019.
- Nandal and Nair [2017] Vikas Nandal and Pradeep R Nair. Predictive modeling of ion migration induced degradation in perovskite solar cells. ACS nano, 11(11):11505–11512, 2017.
- Saketh Chandra et al. [2021] Tirupati Saketh Chandra, Abhimanyu Singareddy, Kashimul Hossain, Dhyana Sivadas, Swasti Bhatia, Shivam Singh, Dinesh Kabra, and Pradeep R Nair. Ion mobility independent large signal switching of perovskite devices. Applied Physics Letters, 119(2):023506, 2021.
- Sivadas et al. [2021] Dhyana Sivadas, Swasti Bhatia, and Pradeep R Nair. Efficiency limits of perovskite solar cells with n-type hole extraction layers. Applied Physics Letters, 119(20):203502, 2021.
- Burkhard et al. [2010] George F Burkhard, Eric T Hoke, and Michael D McGehee. Accounting for interference, scattering, and electrode absorption to make accurate internal quantum efficiency measurements in organic and other thin solar cells. Advanced Materials, 22(30):3293–3297, 2010.
- Wang et al. [2018] Jian Wang, Weifei Fu, Sarthak Jariwala, Irika Sinha, Alex K-Y Jen, and David S Ginger. Reducing surface recombination velocities at the electrical contacts will improve perovskite photovoltaics. ACS Energy Letters, 4(1):222–227, 2018.
- Aydin et al. [2020] Erkan Aydin, Thomas G Allen, Michele De Bastiani, Lujia Xu, Jorge Ávila, Michael Salvador, Emmanuel Van Kerschaver, and Stefaan De Wolf. Interplay between temperature and bandgap energies on the outdoor performance of perovskite/silicon tandem solar cells. Nature Energy, 5(11):851–859, 2020.
- Singareddy et al. [2021] Abhimanyu Singareddy, Uday Kiran Reddy Sadula, and Pradeep R Nair. Phase segregation induced efficiency degradation and variability in mixed halide perovskite solar cells. Journal of Applied Physics, 130(22):225501, 2021.
- Green et al. [1982] MA Green, K Emery, and AW Blakers. Silicon solar cells with reduced temperature sensitivity. Electronics Letters, 18(2):97–98, 1982.
- Zhao et al. [1994] J Zhao, A Wang, SJ Robinson, and MA Green. Reduced temperature coefficients for recent high-performance silicon solar cells. Progress in Photovoltaics: Research and Applications, 2(3):221–225, 1994.
- De Bastiani et al. [2021] Michele De Bastiani, Alessandro J Mirabelli, Yi Hou, Fabrizio Gota, Erkan Aydin, Thomas G Allen, Joel Troughton, Anand S Subbiah, Furkan H Isikgor, Jiang Liu, et al. Efficient bifacial monolithic perovskite/silicon tandem solar cells via bandgap engineering. Nature Energy, 6(2):167–175, 2021.
- Calado et al. [2016] Philip Calado, Andrew M Telford, Daniel Bryant, Xiaoe Li, Jenny Nelson, Brian C O’Regan, and Piers RF Barnes. Evidence for ion migration in hybrid perovskite solar cells with minimal hysteresis. Nature communications, 7(1):1–10, 2016.
- Moia et al. [2022] Davide Moia, Ilario Gelmetti, Philip Calado, Yinghong Hu, Xiaoe Li, Pablo Docampo, John de Mello, Joachim Maier, Jenny Nelson, and Piers RF Barnes. The dynamics of internal electric field screening in hybrid perovskite solar cells probed using electroabsorption. arXiv preprint arXiv:2201.02175, 2022.
- Corporation [May 18 2017] Panasonic Corporation. Crystalline silicon solar cells,Japan Photovoltaic Energy Association’s Indication Guidelines (FY2017), May 18 2017.
- Wang et al. [2020] He Wang, Xiaoli Cheng, and Hong Yang. Temperature coefficients and operating temperature verification for passivated emitter and rear cell bifacial silicon solar module. IEEE Journal of Photovoltaics, 10(3):729–739, 2020.
- Jordan et al. [2016] Dirk C Jordan, Sarah R Kurtz, Kaitlyn VanSant, and Jeff Newmiller. Compendium of photovoltaic degradation rates. Progress in Photovoltaics: Research and Applications, 24(7):978–989, 2016.
- Qian et al. [2019] Jiadong Qian, Marco Ernst, Nandi Wu, and Andrew Blakers. Impact of perovskite solar cell degradation on the lifetime energy yield and economic viability of perovskite/silicon tandem modules. Sustainable Energy & Fuels, 3(6):1439–1447, 2019.
- Chen et al. [2019] Bingbing Chen, Hongwei Hu, Teddy Salim, and Yeng Ming Lam. A facile method to evaluate the influence of trap densities on perovskite solar cell performance. Journal of Materials Chemistry C, 7(19):5646–5651, 2019.
- Ng et al. [2020] Chi Huey Ng, Kengo Hamada, Gaurav Kapil, Muhammad Akmal Kamarudin, Zhen Wang, Qing Shen, Kenji Yoshino, Takashi Minemoto, Shuzi Hayase, et al. Reducing trap density and carrier concentration by a ge additive for an efficient quasi 2d/3d perovskite solar cell. Journal of Materials Chemistry A, 8(6):2962–2968, 2020.
- Al Mamun et al. [2017] Abdullah Al Mamun, Tanzila Tasnim Ava, Kai Zhang, Helmut Baumgart, and Gon Namkoong. New pcbm/carbon based electron transport layer for perovskite solar cells. Physical Chemistry Chemical Physics, 19(27):17960–17966, 2017.
- Grant et al. [2017] Nicholas E Grant, Tim Niewelt, Neil R Wilson, Evangeline C Wheeler-Jones, James Bullock, Mohammad Al-Amin, Martin C Schubert, Andre C van Veen, Ali Javey, and John D Murphy. Superacid-treated silicon surfaces: extending the limit of carrier lifetime for photovoltaic applications. IEEE Journal of Photovoltaics, 7(6):1574–1583, 2017.
- Yang et al. [2015] Ye Yang, Yong Yan, Mengjin Yang, Sukgeun Choi, Kai Zhu, Joseph M Luther, and Matthew C Beard. Low surface recombination velocity in solution-grown ch3nh3pbbr3 perovskite single crystal. Nature communications, 6(1):1–6, 2015.
- Wu et al. [2017] Bo Wu, Yuanyuan Zhou, Guichuan Xing, Qiang Xu, Hector F Garces, Ankur Solanki, Teck Wee Goh, Nitin P Padture, and Tze Chien Sum. Long minority-carrier diffusion length and low surface-recombination velocity in inorganic lead-free cssni3 perovskite crystal for solar cells. Advanced Functional Materials, 27(7):1604818, 2017.
- Wolff et al. [2019] Christian M Wolff, Pietro Caprioglio, Martin Stolterfoht, and Dieter Neher. Nonradiative recombination in perovskite solar cells: the role of interfaces. Advanced Materials, 31(52):1902762, 2019.
- Alam et al. [2007] Muhammad Ashraful Alam, Haldun Kufluoglu, Dhanoop Varghese, and Souvik Mahapatra. A comprehensive model for pmos nbti degradation: Recent progress. Microelectronics Reliability, 47(6):853–862, 2007.
- Jiang et al. [2016] Yajie Jiang, Ibraheem Almansouri, Shujuan Huang, Trevor Young, Yang Li, Yong Peng, Qicheng Hou, Leone Spiccia, Udo Bach, Yi-Bing Cheng, et al. Optical analysis of perovskite/silicon tandem solar cells. Journal of Materials Chemistry C, 4(24):5679–5689, 2016.
- Futscher and Ehrler [2016] Moritz H Futscher and Bruno Ehrler. Efficiency limit of perovskite/si tandem solar cells. ACS Energy Letters, 1(4):863–868, 2016.
- Cheng and Ding [2021] Yuanhang Cheng and Liming Ding. Perovskite/si tandem solar cells: Fundamentals, advances, challenges, and novel applications. SusMat, 1(3):324–344, 2021.