Distribution-based Sketching of Single-Cell Samples
Abstract.
Modern high-throughput single-cell immune profiling technologies, such as flow and mass cytometry and single-cell RNA sequencing can readily measure the expression of a large number of protein or gene features across the millions of cells in a multi-patient cohort. While bioinformatics approaches can be used to link immune cell heterogeneity to external variables of interest, such as, clinical outcome or experimental label, they often struggle to accommodate such a large number of profiled cells. To ease this computational burden, a limited number of cells are typically sketched or subsampled from each patient. However, existing sketching approaches fail to adequately subsample rare cells from rare cell-populations, or fail to preserve the true frequencies of particular immune cell-types. Here, we propose a novel sketching approach based on Kernel Herding that selects a limited subsample of all cells while preserving the underlying frequencies of immune cell-types. We tested our approach on three flow and mass cytometry datasets and on one single-cell RNA sequencing dataset and demonstrate that the sketched cells (1) more accurately represent the overall cellular landscape and (2) facilitate increased performance in downstream analysis tasks, such as classifying patients according to their clinical outcome. An implementation of sketching with Kernel Herding is publicly available at https://github.com/vishalathreya/Set-Summarization.
1. Introduction
Advances in high throughput single-cell technologies have transformed our understanding of cellular heterogeneity across a range of biological and clinical applications. For example, single-cell measurements have been used to construct whole organism cell atlases (Regev et al., 2017; Cao et al., 2019) that can serve as prototypical healthy references that assist in the discovery of novel disease cell states (Lotfollahi et al., 2021). Translationally, single-cell modalities have provided insight into complex immune responses linked to clinical outcomes, such as surgical recovery (Ganio et al., 2020), pregnancy (Aghaeepour et al., 2017), tumor heterogeneity (Levine et al., 2015), and infectious disease (Arunachalam et al., 2020).
Single-cell flow and mass cytometry (e.g. CyTOF) technologies have been particularly useful for gaining an in-depth understanding of the diversity of immune cell-types and their relation to disease, as they simultaneously profile 20-45 proteins collectively across all of the cells profiled in a multi-patient cohort (Bendall et al., 2012; Spitzer and Nolan, 2016; Liechti et al., 2021). This data can be leveraged in statistical models for identifying differentially abundant cell-populations (Weber et al., 2019; Lun et al., 2017; Dann et al., 2021), kernel density estimation methods to characterize treatment resistant cells (Burkhardt et al., 2021), and classification algorithms to predict a patient’s clinical outcome (Yi and Stanley, 2021). Similarly, genomic technologies such as single-cell RNA sequencing (scRNA-seq) technologies can profile or more gene expression measurements in thousands of cells (Luecken and Theis, 2019). Given the large number of cells measured in such datasets, downstream analysis tasks present a computational challenge and quickly become intractable. Traditional approaches for reducing the size of input data, such as uniform downsampling or clustering, may fail to identify rare but clinically meaningful cell-populations. This limits both the utility of these algorithms and the ability to obtain meaningful results.
Two alternative sketching-based approaches have been developed to intelligently select a subset of cells such that the overall cellular landscape of the full data is preserved. Geometric Sketching first approximates the underlying geometry of the data through a covering of equal volume hypercubes, then evenly samples points from each at random (Hie et al., 2019). Alternatively, Hopper constructs a sketch by iteratively minimizing the Hausdorff distance to ensure points in the full data are well-represented in the sketch (DeMeo and Berger, 2020). Both methods provide an even sampling of cells that focuses on capturing rare cell-types. However, as a result, they fail to preserve the overall distributions of cell-type frequencies which can be crucial for clinical outcome prediction and biological interpretation (Ganio et al., 2020; Mathew et al., 2020). In a philosophical divergence with this previous sketching work, here we prioritize the sketch’s ability to act as a stand-in for the original sample-set. That is, here we consider sketches that obtain similar downstream outcomes to the original sample-sets when analyzed. In some respects, this goal is a generalization of prior formulations, since rare-cell types must be preserved if the sketch can act as a stand-in. However, our formulation also allows for the preservation of general downstream analysis, which may not be entirely dependent on rare-cell types. Thus, this work presents a novel, more direct approach to sketching single-cell samples.
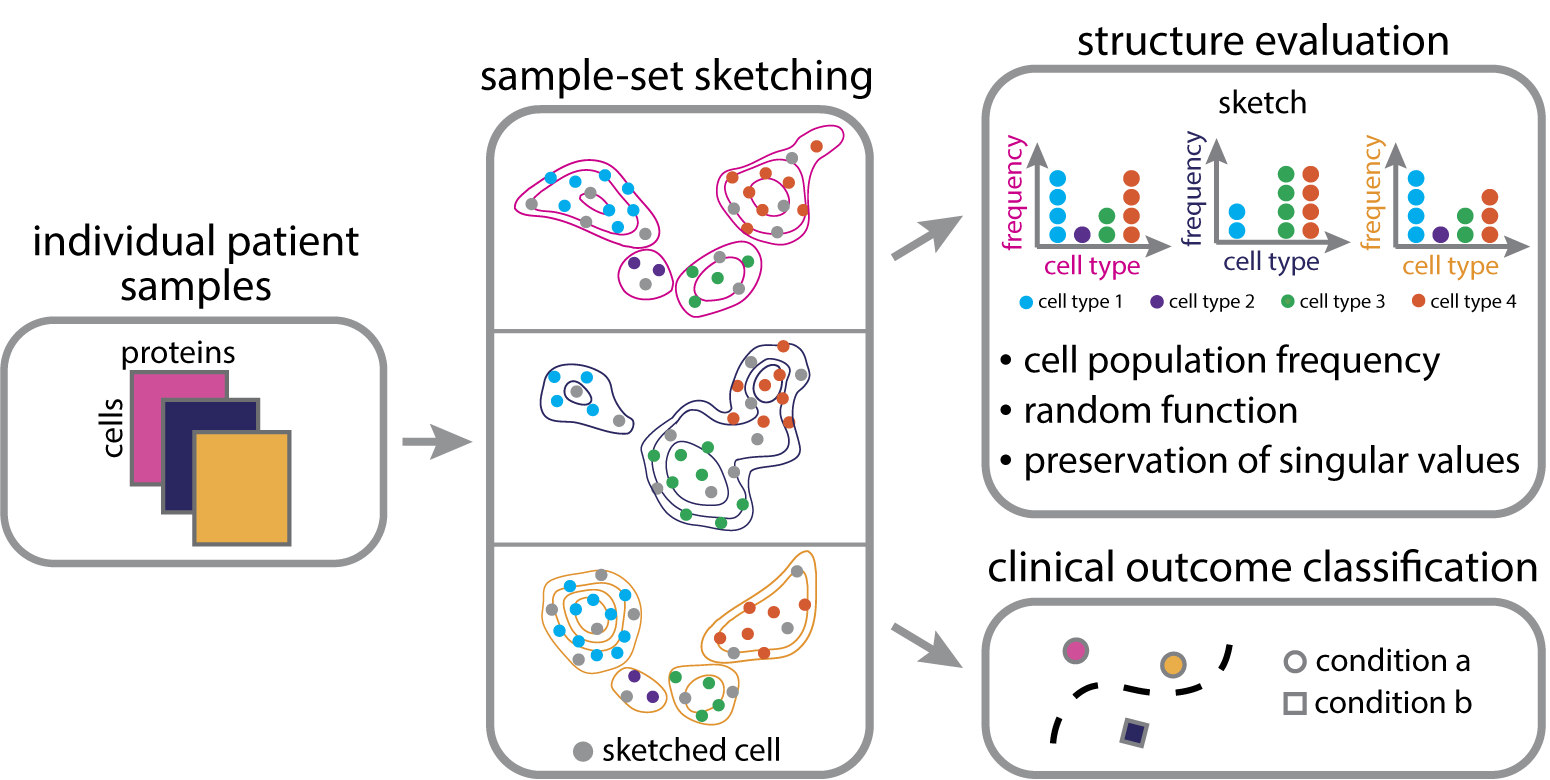
We propose to preserve downstream analysis of a single-cell sample by explicitly preserving the distribution in the sketched sample. In this work, we show that this can be achieved via Kernel Herding (Chen et al., 2010), a kernel-based approach to sub-sampling. Furthermore, we show how to efficiently compute Kernel Herding sketches through random Fourier features (Rahimi et al., 2007), which allows our sketch approach to scale to large sample-sets. We first evaluate our approach on three diverse flow and mass cytometry datasets by computing several statistics to quantify cellular landscape preservation and performance in downstream tasks, such as patient classification according to clinical outcome. Furthermore, we demonstrate how this approach can be used across single-cell data modalities with a single-cell RNA sequencing application. Our Kernel Herding sketching approach (outlined in Fig. 1) now makes it possible to select a limited subset of cells from each profiled sample-set that adequately represents immune cell-types and their relative frequencies.
2. Methods
Here we are considering the problem of finding a representative subset to an original sample-set of cells .
If subsets are to act as a stand-in for original sample-sets, then they should provide similar outcomes when processed as the original sets.
Thus, we consider a subset, , to be representative if it maintains the distribution of the original set and yields similar results to when processed.
Problem Formulation
At an abstract level, we shall construct a subset whose statistics match the original sample-set . Of course, for any finite number of statistics, there may be an ambiguity over the original distribution. For instance, a large variety of samples may share the same mean, thus simply finding a subset of a similar mean as the original set will not suffice to ensure a representative subsample. Instead, we shall use the kernel mean embedding (Muandet et al., 2017) as the target ‘statistic’ to match in the subset. We briefly explain kernels and kernel mean embedding below.
Kernel Mean Embedding Kernel methods have been successfully applied in a myriad of machine learning problems such as regression (Vovk, 2013), classification (Cortes and Vapnik, 1995), and dimensionality reduction (Mika et al., 1998). Underlying kernel methods is a positive definitive kernel function 111Kernels may also generalize over non-real domains, which induces a reproducing kernel Hilbert space (RKHS) (e.g. see (Berlinet and Thomas-Agnan, 2011) for further details). In addition to working over typical vector-values data, recently kernels have also been deployed to operate over distributions (e.g. (Muandet et al., 2017)). The kernel mean embedding represents a distribution, , as:
| (1) |
Note that is itself a function, defined by the expected kernel evaulation to points drawn from a distribution . For a special class of ‘characteristic’ kernels, , such as the common radial-basis function (RBF) kernel , if and only if . Thus, for characteristic kernels the kernel mean embedding will be unique to its distribution and matching the kernel embedding exactly guarantees that one matches a distribution. In general, the distance222Corresponding to the RKHS norm induces a divergence, the maximum mean discrepancy (MMD) (Gretton et al., 2008), between distributions, which has been useful in comparing distributions (e.g. (Gretton et al., 2012)).
In this work we sketch a sample-set with a subset that preserves the empirical distribution found in the original sample-set with the mean embedding where:
| (2) |
That is, we look for a subset whose empirical distribution has a small MMD from that of the original set , .
Note that a uniform subsample provides a reasonable approximation when the cardinality is large enough. That is , shall approximate when using enough uniformly subsampled points. However, as shown by (Chen et al., 2010), one may get a more representative subsample through Kernel Herding as described below.
Kernel Herding Kernel herding is a greedy algorithm to approximate a mean embedding with a subset of a set of samples , using a subset of points . Here, we consider the empirical distribution , where is the Dirac-delta function. Hence, we look to approximate with being our original sample. Kernel herding is especially applicable for synthesizing a large number of cells, due to the following properties. First, the rate of convergence for the error is , which is much faster than the rate for a uniformly random subsample. That is, Kernel Herding can provide a synthesized subset of points that approximates the target distribution as well as uniformly subsampled points. This property implies that the Kernel Herding subset shall maintain the distributional properties found in the original sample-set. Second, it can be shown that the Kernel Herding subset also approximates the expectation of any function 333In the corresponding reproducing kernel Hilbert space (RKHS)., , with a mean over , . This property enables one to obtain similar downstream models when using the summarized subset as the expectation of functions evaluated.
The Kernel Herding subset is computed as follows:
Random Fourier Features Performing Kernel Herding with a kernel function , however, may not scale since an iteration requires an computation (equivalent to computing the Gram matrix of pairwise kernel evaluations on ). To rectify this, we propose to use random Fourier frequency features (Rahimi et al., 2007). For a shift-invariant kernel (such as the RBF kernel), random Fourier features provide a feature map such that the dot product in feature space approximates the kernel evaluation, (e.g. see (Rahimi et al., 2007; Oliva et al., 2014; Rahimi et al., 2007) for further details). Using the dot product of , our mean embedding becomes , where . In practice, the random features are constructed by drawing frequencies, , at random (iid column-wise) once, and holding them fixed to construct the features
| (3) |
where denotes concatenation. For instance, to approximate the RBF kernel, , we would draw the -dimensional frequencies (Rahimi et al., 2007). It is simple to show that when using the approximation , one may compute Algorithm 1 with iterates by avoiding pairwise kernel computations (Chen et al., 2010); we detail this below.
2.1. Single-Cell Datasets Used in Experiments
In all experiments, we used publicly available, multi-sample flow, mass cytometry (CyTOF), and single-cell RNA sequencing datasets. For the flow and mass cytometry datasets, each sample-set consists of a collection of protein markers (up to 45) measured across individual cells. For the single-cell RNA sequencing dataset, each sample-set consists of a collection of gene expression measurements (20k) measured across individual cells. Here, we briefly introduce the multi-sample publicly available datasets used in our experiments. All preprocessed data are available in the Zenodo repository: https://zenodo.org/record/6546964.
-
•
Preeclampsia The preeclampsia CyTOF dataset (Han et al., 2019) includes samples collected longitudinally from 12 healthy women and 11 women with preeclampsia throughout their pregnancies. All patient samples were downloaded from Flow Repository under Repository ID FR-FCM-ZYRQ (http://flowrepository.org/id/FR-FCM-ZYRQ). Classification tasks distinguished between healthy from preeclamptic women.
-
•
HVTN The HIV Vaccine Trials Network (HVTN) is a Flow Cytometry dataset and consists of 96 total sample-sets of T-cells that were each subjected to stimulation with either Gag or Env (Aghaeepour et al., 2013) (downloaded from Flow Repository, ID FR-FCM-ZZZV http://flowrepository.org/id/FR-FCM-ZZZV). Classification tasks distinguished Gag from Env stimulated samples
-
•
NK-Cell The NK-Cell CyTOF dataset profiled NK-Cells across 21 individuals who were either positive or negative for Cytomegalovirus (CMV) (Arvaniti and Claassen, 2017) (downloaded from https://github.com/eiriniar/CellCnn). Classification tasks distinguished CMV positive (CMV+) from CMV negative (CMV-) samples.
-
•
MS The multiple sclerosis (MS) single-cell RNA sequencing dataset (Schafflick et al., 2020) consists of peripheral blood samples collected from 4 MS patients and 4 healthy controls. Patient samples were accessed from the Gene Expression Omnibus using the accession code GSE138266. We performed standard single-cell RNA sequencing data preprocessing, including filtering cells according to read depth and distribution of molecular counts, removing cells with greater than 20 percent mitochondrial transcripts, and retaining genes that were expressed amongst a minimum of 5 cells. Following quality control filtering, we normalized the data to account for differences in sequencing depth by estimating size factors using Scran pooling normalization v1.20.1 (Lun et al., 2016) and scaling them across batches using Batchelor v1.8.0. We then performed batch effect correction using ComBat (Johnson et al., 2007). Lastly, we restricted the feature space by selecting for highly variable genes on log+1 transformed data using a normalized dispersion measure in Scanpy v1.8.1 (flavor = Seurat, minimum mean = 0.012, minimum dispersion = 0.25, maximum mean = 5). In our subsequent experiments, we performed principal component analysis on the preprocessed dataset and used the top 50 components for downstream tasks.
3. Results
We compared the performance of Kernel Herding to sketches obtained using Geometric Sketching, Hopper, and IID subampling for tasks related to the overall preservation and usefulness of the resulting immunological landscape. That is, we sought to evaluate whether or not the sketches adequately represented all major immune cell-types and their relative frequencies and could be used to produce meaningful immunological features for downstream tasks. Code for reproducing the results of all subsequent experiments is publicly available at https://github.com/vishalathreya/Set-Summarization.
3.1. Description of Related Algorithms
Here, we briefly define the sketching approaches that were compared to in our experiments.
-
•
Geometric Sketching Geometric Sketching introduced in Ref. (Hie et al., 2019) infers a plaid covering of cells in the high-dimensional space. Cells are sketched through volume-dependent sampling by selecting the same number of cells from sections of the high-dimensional plaid covering.
-
•
Hopper Hopper introduced in Ref. (DeMeo and Berger, 2020) forms a sketch by using fastest first traversal, which is a greedy approximation to the -center problem. Intuitively, this sketching approach sequentially adds cells to the sketch that are sufficiently different from those that were already included in the sketch.
-
•
Independent and Identically Distributed Subsampling (IID) IID sketches were generated by simply selecting a random subsample of cells from each sample-set. Here, each cell had the same probability of being selected in the sketch.
3.2. t-SNE Visualizations of Sketched Regions of the Cellular Landscape
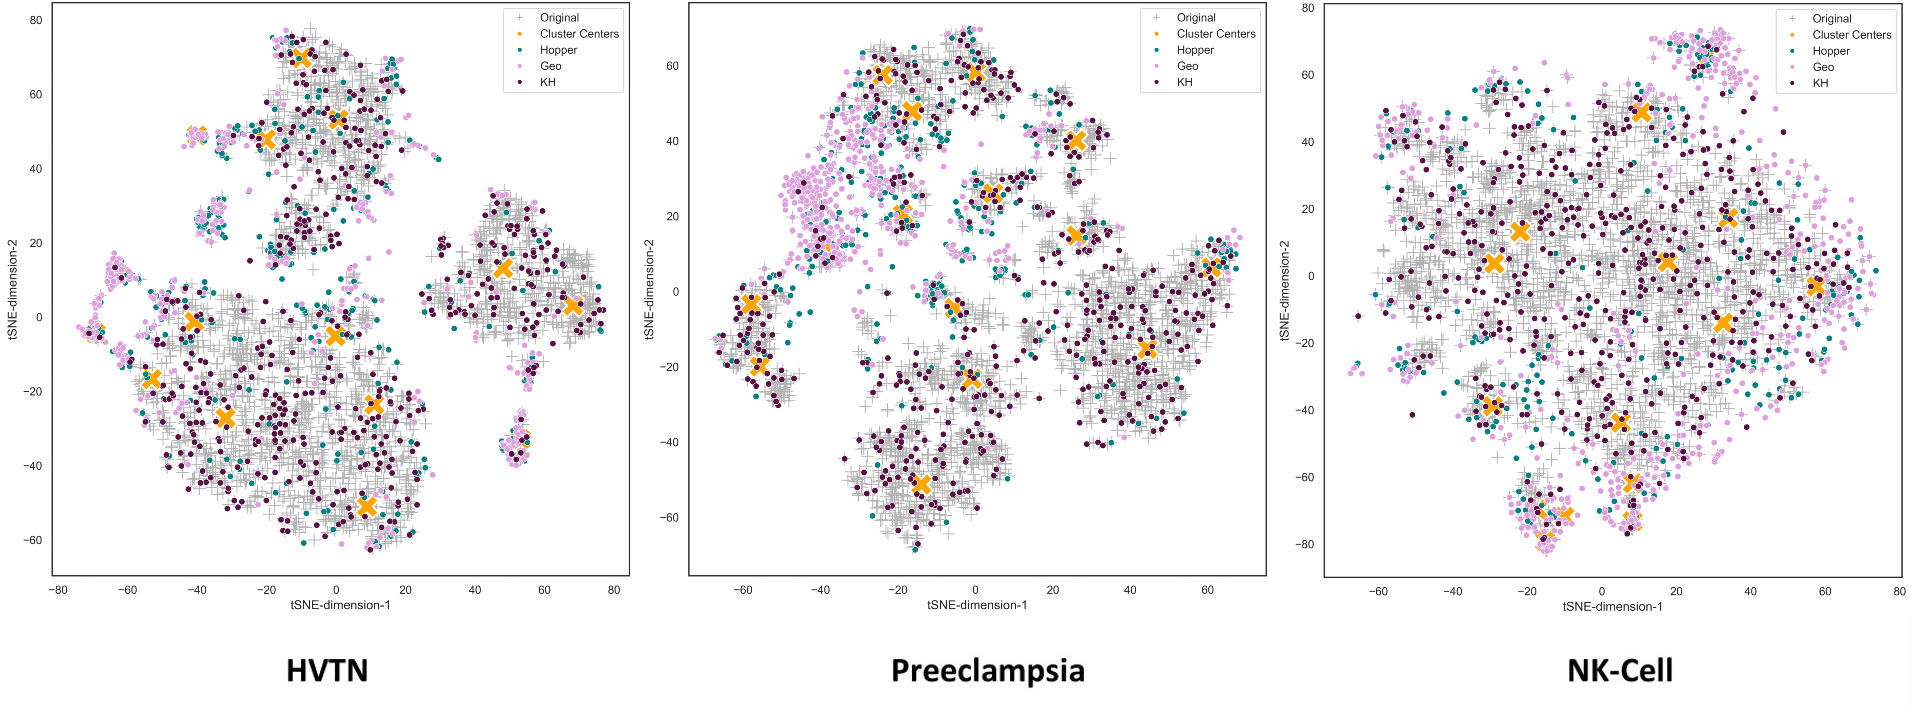
We begin with a qualitative assessment of sketching approaches on cytometry data (Fig. 2). In order to get a visual understanding of the regions of the cellular landscape included in the sketches produced by each method, we plotted a t-SNE projection of respective sketches (colored points) along with a set of overall cells from a large sub-sample of the original set (gray-colored points). I.e. Fig. 2, plots cells from three samples, one for each respective dataset (similar results may be obtained from other samples). Furthermore, we projected cluster centroids (15, from k-means) as large yellow crosses. Taken together, the respective plots give an overview of the cells found in each original sample-set (gray), and which cells were then included in sketches (colored). Note that an IID sketch would stem from a uniform sub-sample of the gray points, which was omitted for visual clarity. One can observe that the Geometric Sketching (Geo, pink, Fig. 2) sketches concentrate over a few sub-regions of the cellular-space, leaving large regions of cells underrepresented in the sketch. This is also true of Hopper (Hopper, green, Fig. 2), though to slightly lesser extent. Finally, we can observe that our proposed Kernel Herding (KH, purple, Fig. 2) sketches yield a more representative coverage of the cell-space. Following our philosophical goal of obtaining sketches that may act as general stand-ins for original sample-sets, it is intuitive that the discrepancy in representation of sketches to the original shall result in discrepancies of outputs of downstream analysis. Moreover, following the insights gained from Kernel Herding (Sec. 2), it is intuitive that IID sketches shall be less representative than those from Kernel herding. In subsequent experiments below, we show that these intuitions hold empirically.
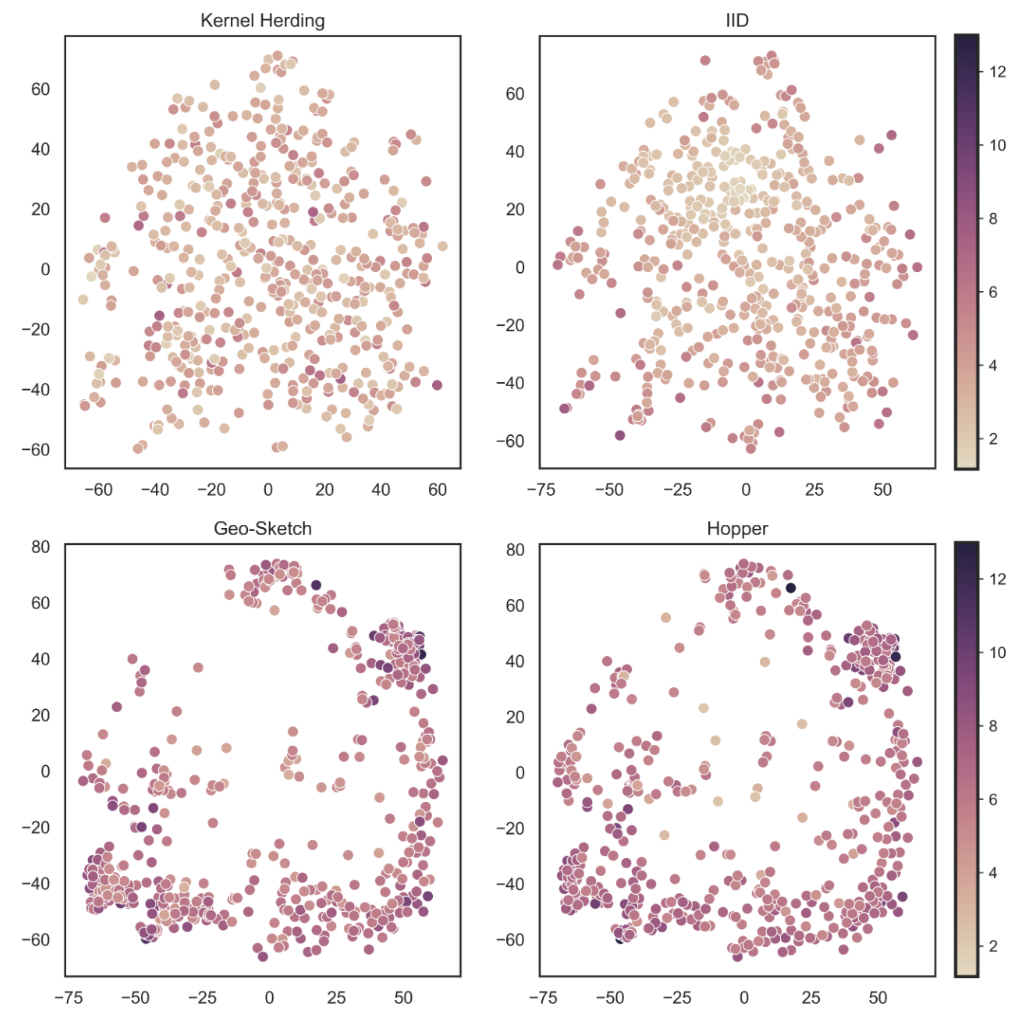
We provide additional context to the aforementioned t-SNE projections (Fig. 2) with a volumetric analysis. In particular, as t-SNE projections may not be volumetrically preserving (areas in the space need not scale to areas in the original space), it may be the case that sketched points seem overly warped and are not representative of their coverage in the original high-dimensional protein marker feature space. To obtain a clearer view of the representation of sketched cells in the original space, we visualize the third nearest neighbor distance in the original space when scattering the cells in the t-SNE space (Fig. 3 plots this for a sample-set in the NK-Cell dataset). That is, dark-colored points stem from sparsely populated regions in the original space, since the nearest neighbor of such points in the original space was far. Similarly, light-colored points stem from densely populated regions in the original space. As suspected above, Geo-Sketch and Hopper sketches are concentrated in sparse regions of the space. While this acceptable for certain applications, the resulting sketches largely ignore denser regions of the cell-space, which prevents sketches from acting as a stand-in for downstream analysis. In contrast, we observe that Kernel Herding obtains good coverage of the original space, while still including cells from sparser regions.
3.3. Random Function Fidelity
As previously discussed, our aim is to produce sketches that may act as a stand-in for general analysis of samples. To test how well sketches estimate the output of a wide-range of analyses, we begin by evaluating randomly generated functions on sketches and comparing their outputs to that of the original sample (Fig. 4).
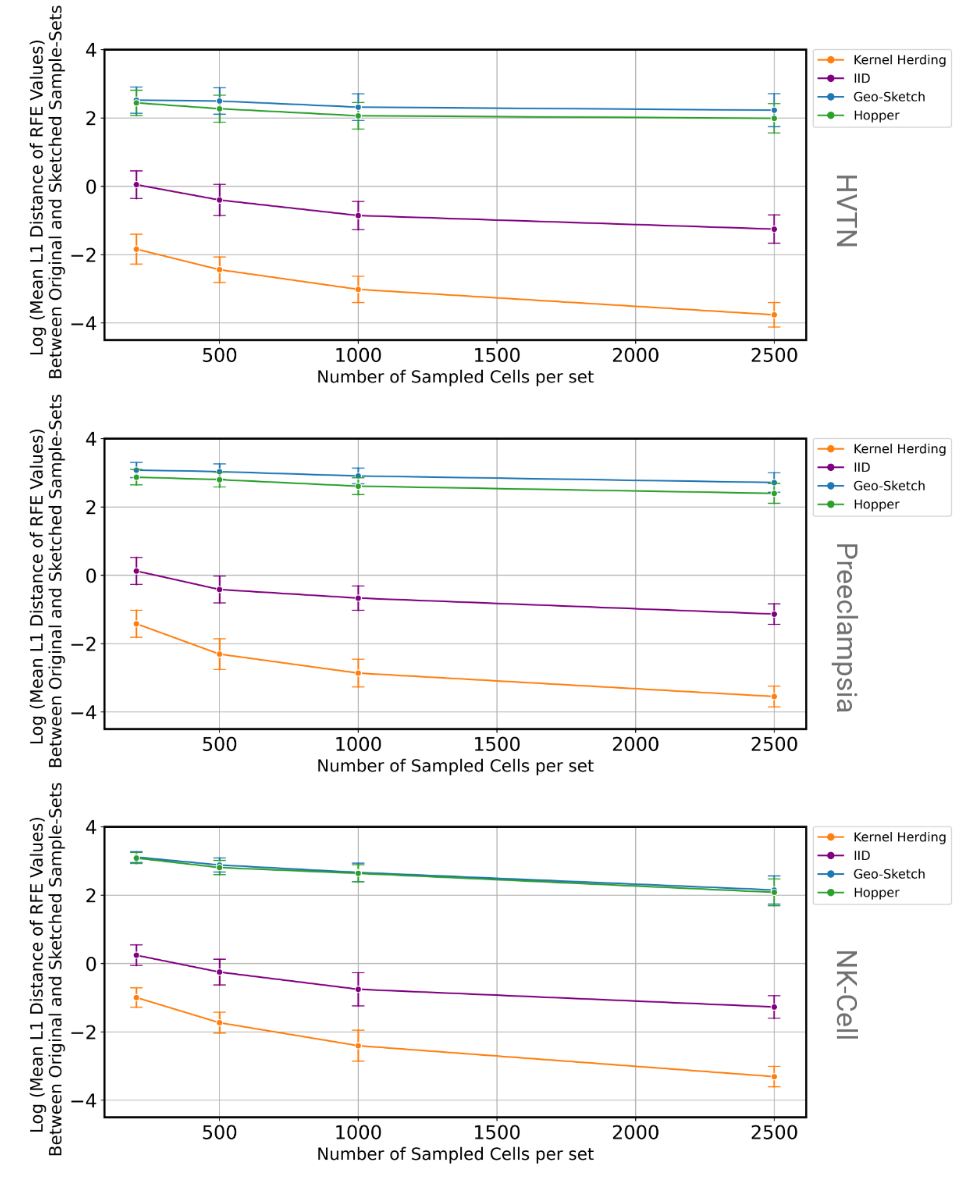
We generate random cell-wise functions, , that are evaluated on sets, , as : . We compare the function evaluation on the original sample, , to a sketched sub-sample, , using the distance: . We parameterize functions through random features (3): , where are the random features w.r.t. a drawn set of frequencies, and are coefficients. Note that is a highly non-linear function in . Thus, testing the discrepancies between multiple shall give a robust measure of the representative power of sketches. For each dataset, we draw 5 random functions (by drawing at random) and report the average discrepancy for sketches produced with each respective method for various sketch cardinalities (see Fig. 4, note the log-scale). Perhaps not surprisingly in light of our qualitative analysis, we see that Geo-Sketch and Hopper yield sketches that are poor stand-ins for this task. Interestingly, we also see a large advantage in Kernel Herding sketches to IID sketches. This highlights that although IID sketches retain distributional properties, Kernel Herding sketches provide a more efficient and accurate synthesis.
3.4. Singular Value Fidelity
Above we studied sketches’ ability to act a stand-in for general non-linear evaluations on original sample-sets. Here, we now consider a specific analysis based on singular values. In particular, we study how well the singular values of the original (cell protein marker matrices) sample compares to the singular values of corresponding sketches with the metric: , where is the vector of corresponding singular values to sample or sketch. Note that this metric directly relates to differences of eigenvalues of corresponding covariance matrices, and hence is indicative of how well sketches may act as a stand-in for linear subspace analyses such as PCA.
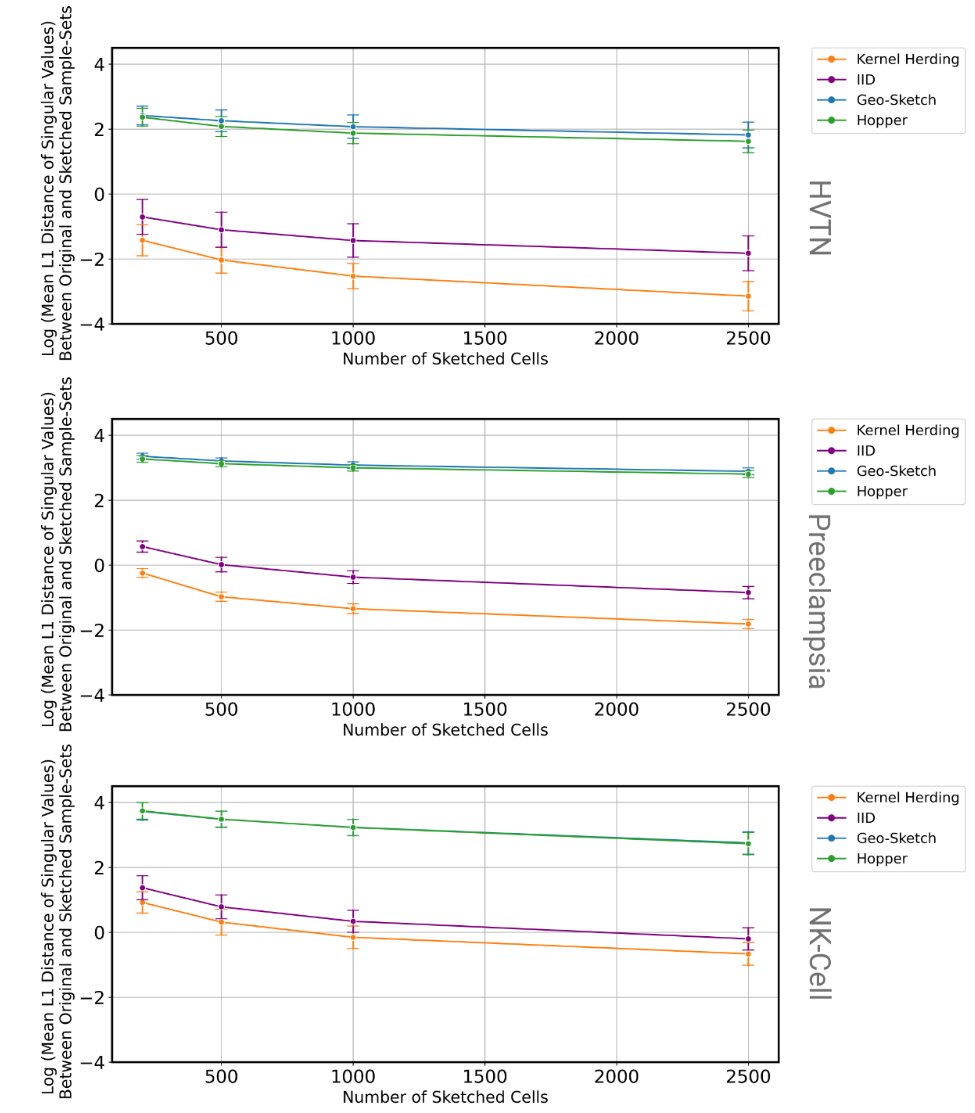
As before, we see that Geo-sketch and Hopper sketches are also unable to act as stand-ins for a singular-value analysis; a problem that does not improve as sketch sizes increase. Given that many single cell analyses rely on capturing the lower dimensional structure in samples (e.g. (Velten et al., 2022; Moon et al., 2019)), this underlying bias in previous sketching approaches is limiting to their ability to act as reliable stand-ins. Moreover, we similarly observe that our proposed Kernel Herding sketches act as more faithful stand-ins to the naive IID sketches.
3.5. Cluster Frequency Fidelity
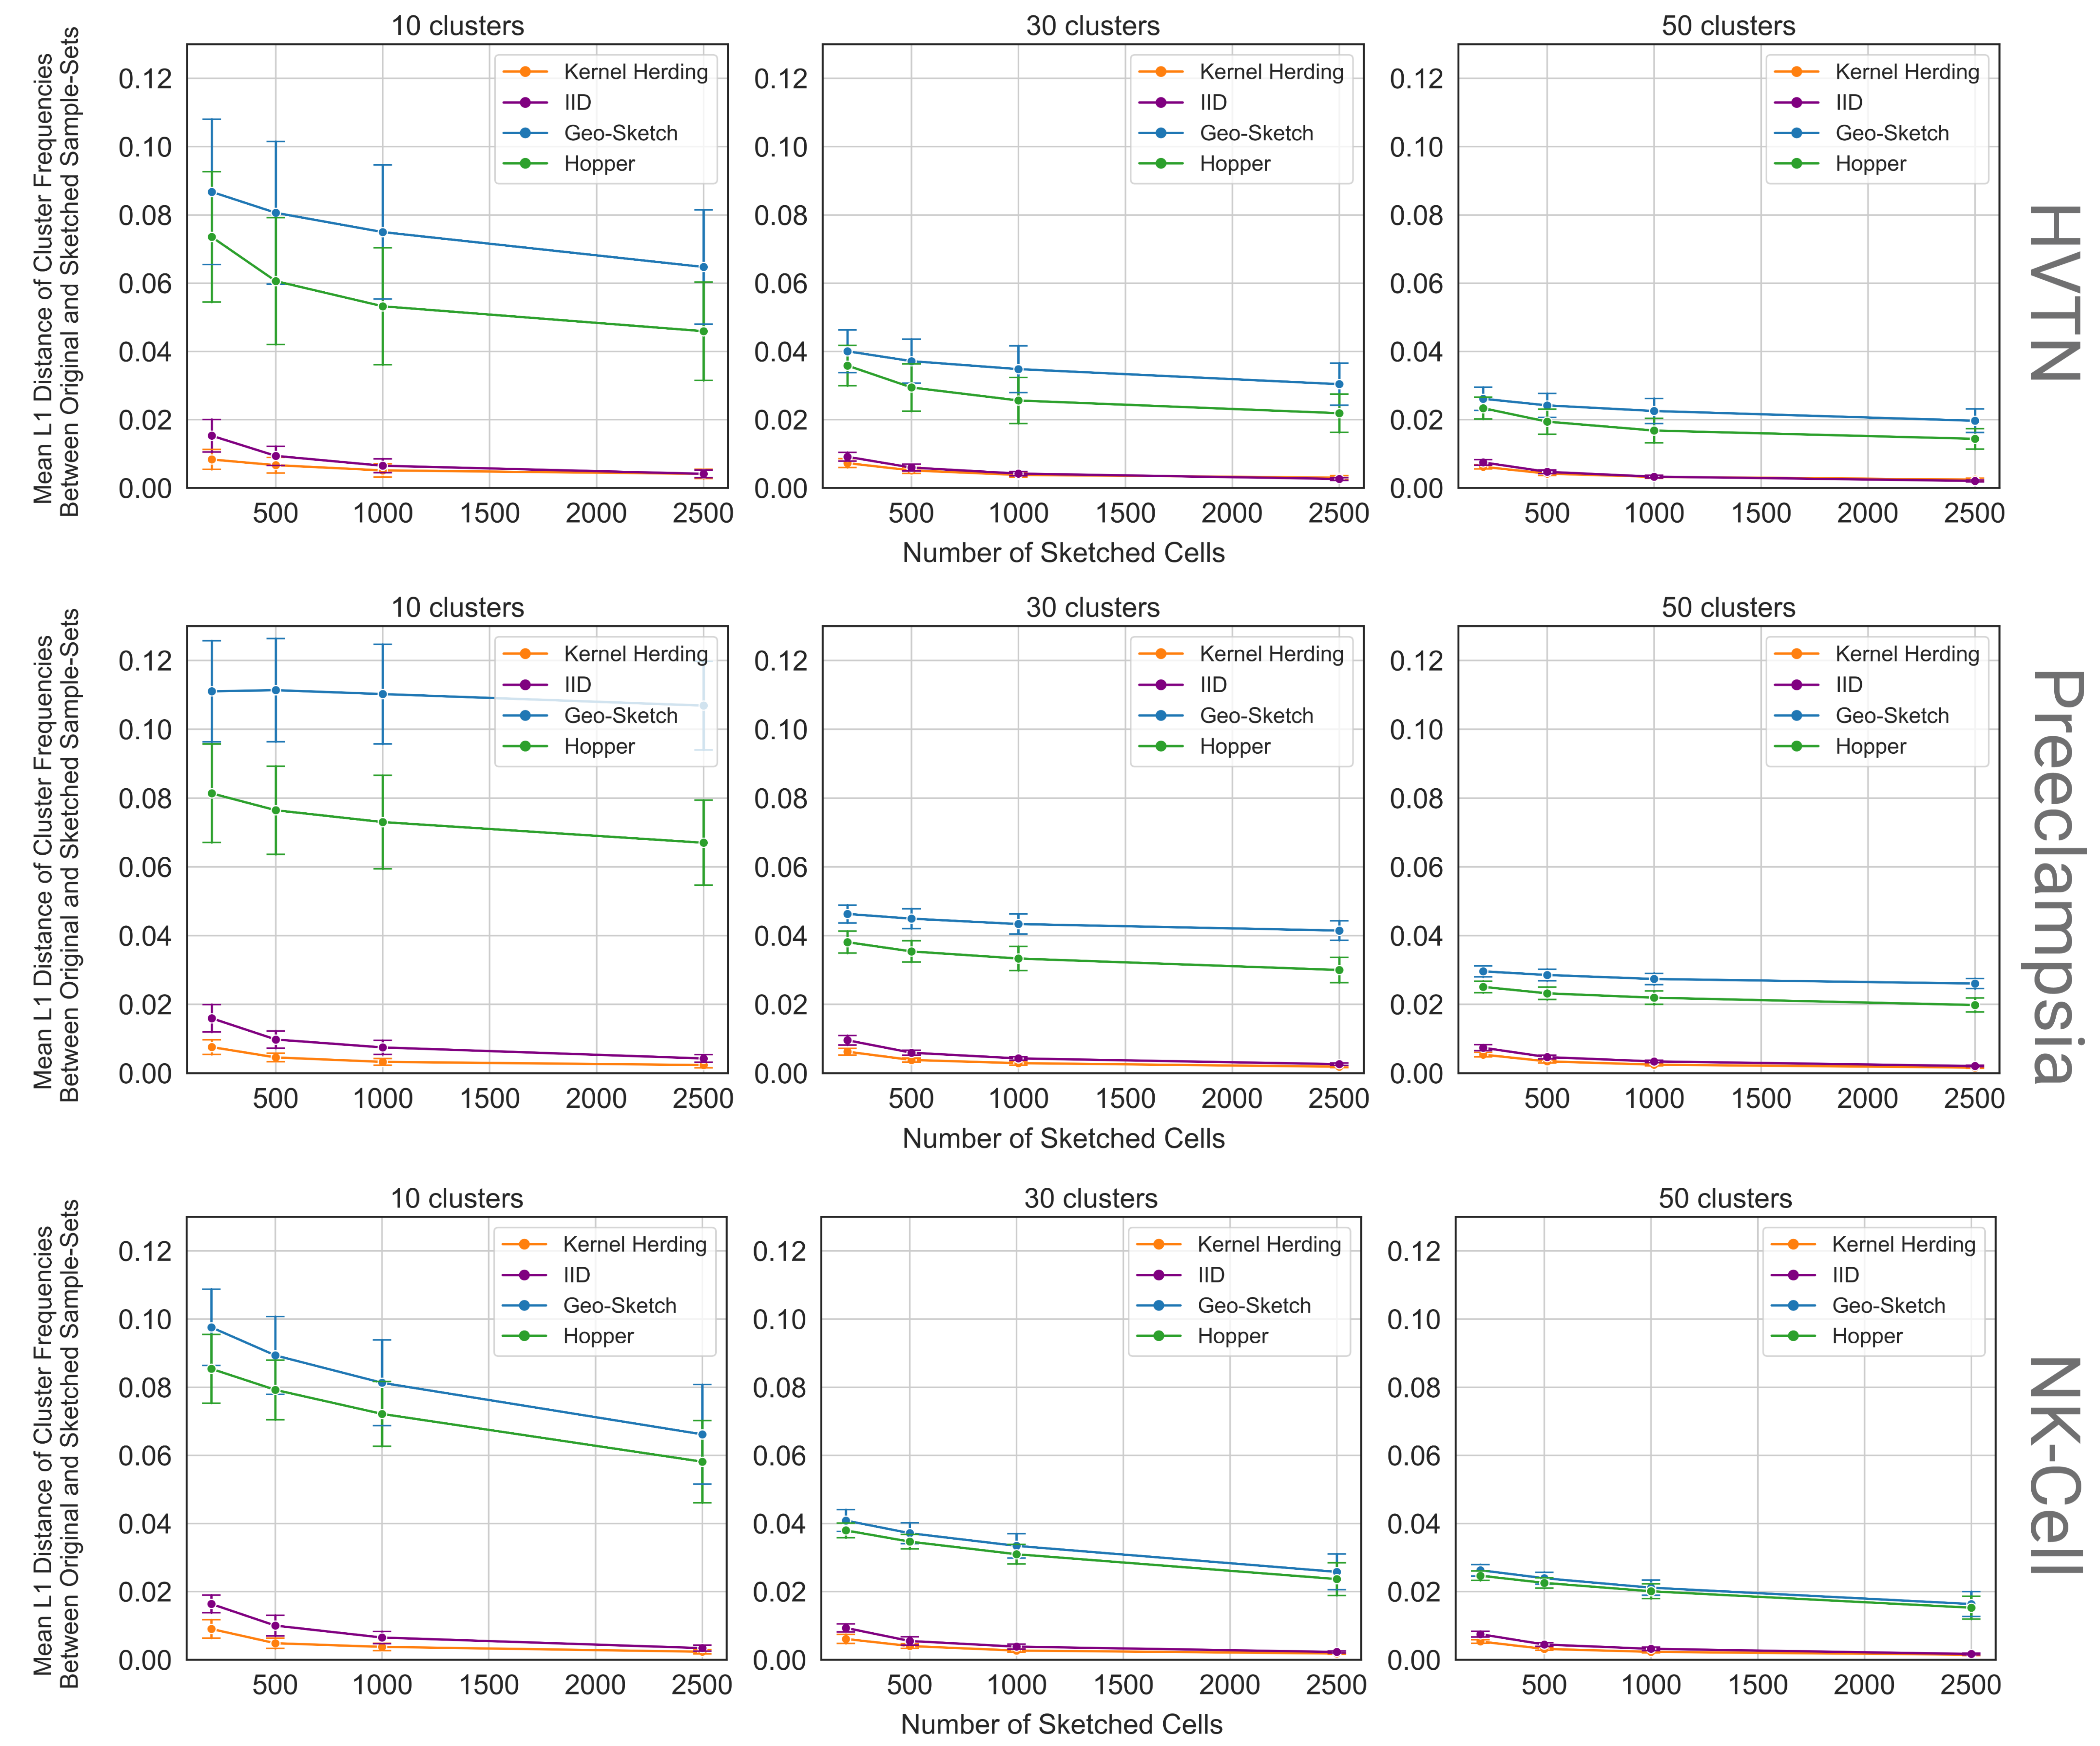
Next, we study sketches’ abilities to retain the overall cellular frequencies that were found in the original sample. Cell-type frequencies can be crucial for clinical outcome prediction and biological interpretation (Bruggner et al., 2014; Stanley et al., 2020); thus, a sketch’s ability to retain cell-type frequencies is pivotal for its ability to act as a stand-in to the original set in many impactful tasks. Here we automatically detect cell-populations through an unsupervised, kmeans cluster analysis. All cells in the original sample-set are used to compute the cluster centroids, which then provide the cluster association for cells from sketches of that set. Once the centroids are computed for the original sample, each sketch is summarized according to the frequencies of the clusters in that sketch. That is, for each sketch, we compute the portion of its cells that were assigned to each cluster, , , where are the cluster centroids. Similarly to above, we may compare the outcomes of analyzing the original sample-set, , to that of a corresponding sketch, , with an metric: and average this distance over all sets in the dataset.
We plot the discrepancies in frequencies for various sketching cardinalities and number of clusters in Fig. 6. Following the same major pattern to previous experiments, we see that alternative sketching approaches (Geo-Sketch and Hopper) were unable to properly act as a stand-in to computing the cell-population frequencies in the original set. This trend is also not assuaged by increasing those sketch’s sub-sampling size. Kernel Herding avoids these issues, whilst also providing a better representative sketch than IID sub-sampling. We see similar results across various number of clusters, which studies the sketches’ fidelity with different granularities of cell-populations.
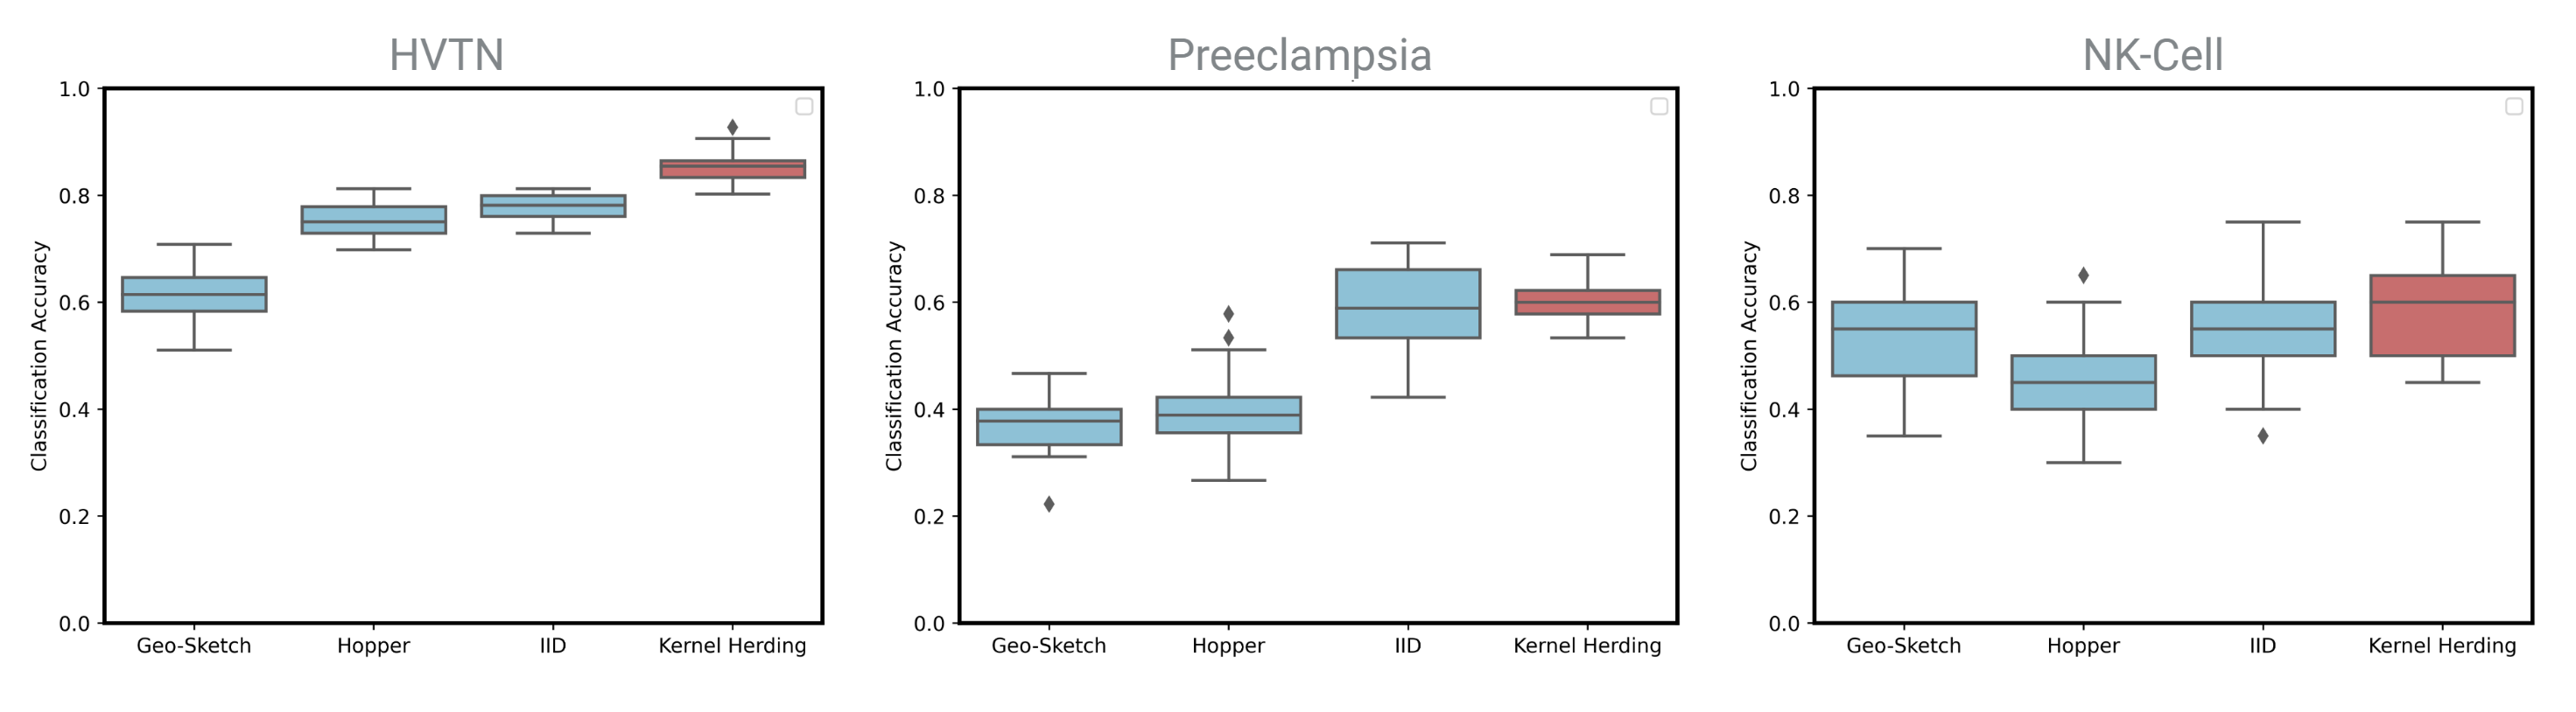
3.6. Classification Effectiveness
Finally, we explicitly test to see if the cell-population discrepancies found in Fig. 6 are relevant to producing immunological features that are useful for classifying samples according to the clinical outcomes of their associated individuals. That is, here we explicitly test that clinically relevant cell populations (such as rare-cells) are maintained in sketches. We hypothesized that the sketches with more accurately represented frequencies (e.g. as in Sec. 3.5) may be more predictive of a clinical outcome of interest.
As in Sec. 3.5, for each of the three cytometry datasets, cells were clustered into one of thirty clusters. Here the clusters are found from an aggregate collection of the multiple sketched sample-sets in each dataset. That is, the clusters are determined via a concatenation of all the sketched cells from all the sample sets that are in respective training sets. The frequency, or proportion of cells assigned to each population, , was used as input for a downstream classification task to predict the clinical outcome for each sketched set. Note that here we trained a classifier based on multi-sample dataset , where is the sketch for the -th sample-set, and is the corresponding label. Classification experiments were performed in the HVTN, Preeclampsia and NK-Cell datasets (left, middle, and right of Figure 7, respectively) by splitting individuals according to leave-one-out cross validation and training an RBF support vector machine (SVM). Surprisingly, we found that notwithstanding the explicit focus on maintaining rare-cell types, Geo-sketch and Hopper were unable to produce sketches that lead to better accuracies than IID sub-sampling in this setting. In contrast, we found that our proposed Kernel Herding sketches lead to higher mean accuracies than IID sketching. This held true for other cluster sizes as well (K=15,K=50). Our results show that in general, sketching with Kernel Herding produces sketches that are more clinically predictive than the baseline methods. This is especially apparent in the preeclampsia dataset, where IID sketching produces highly variable classification accuracy.
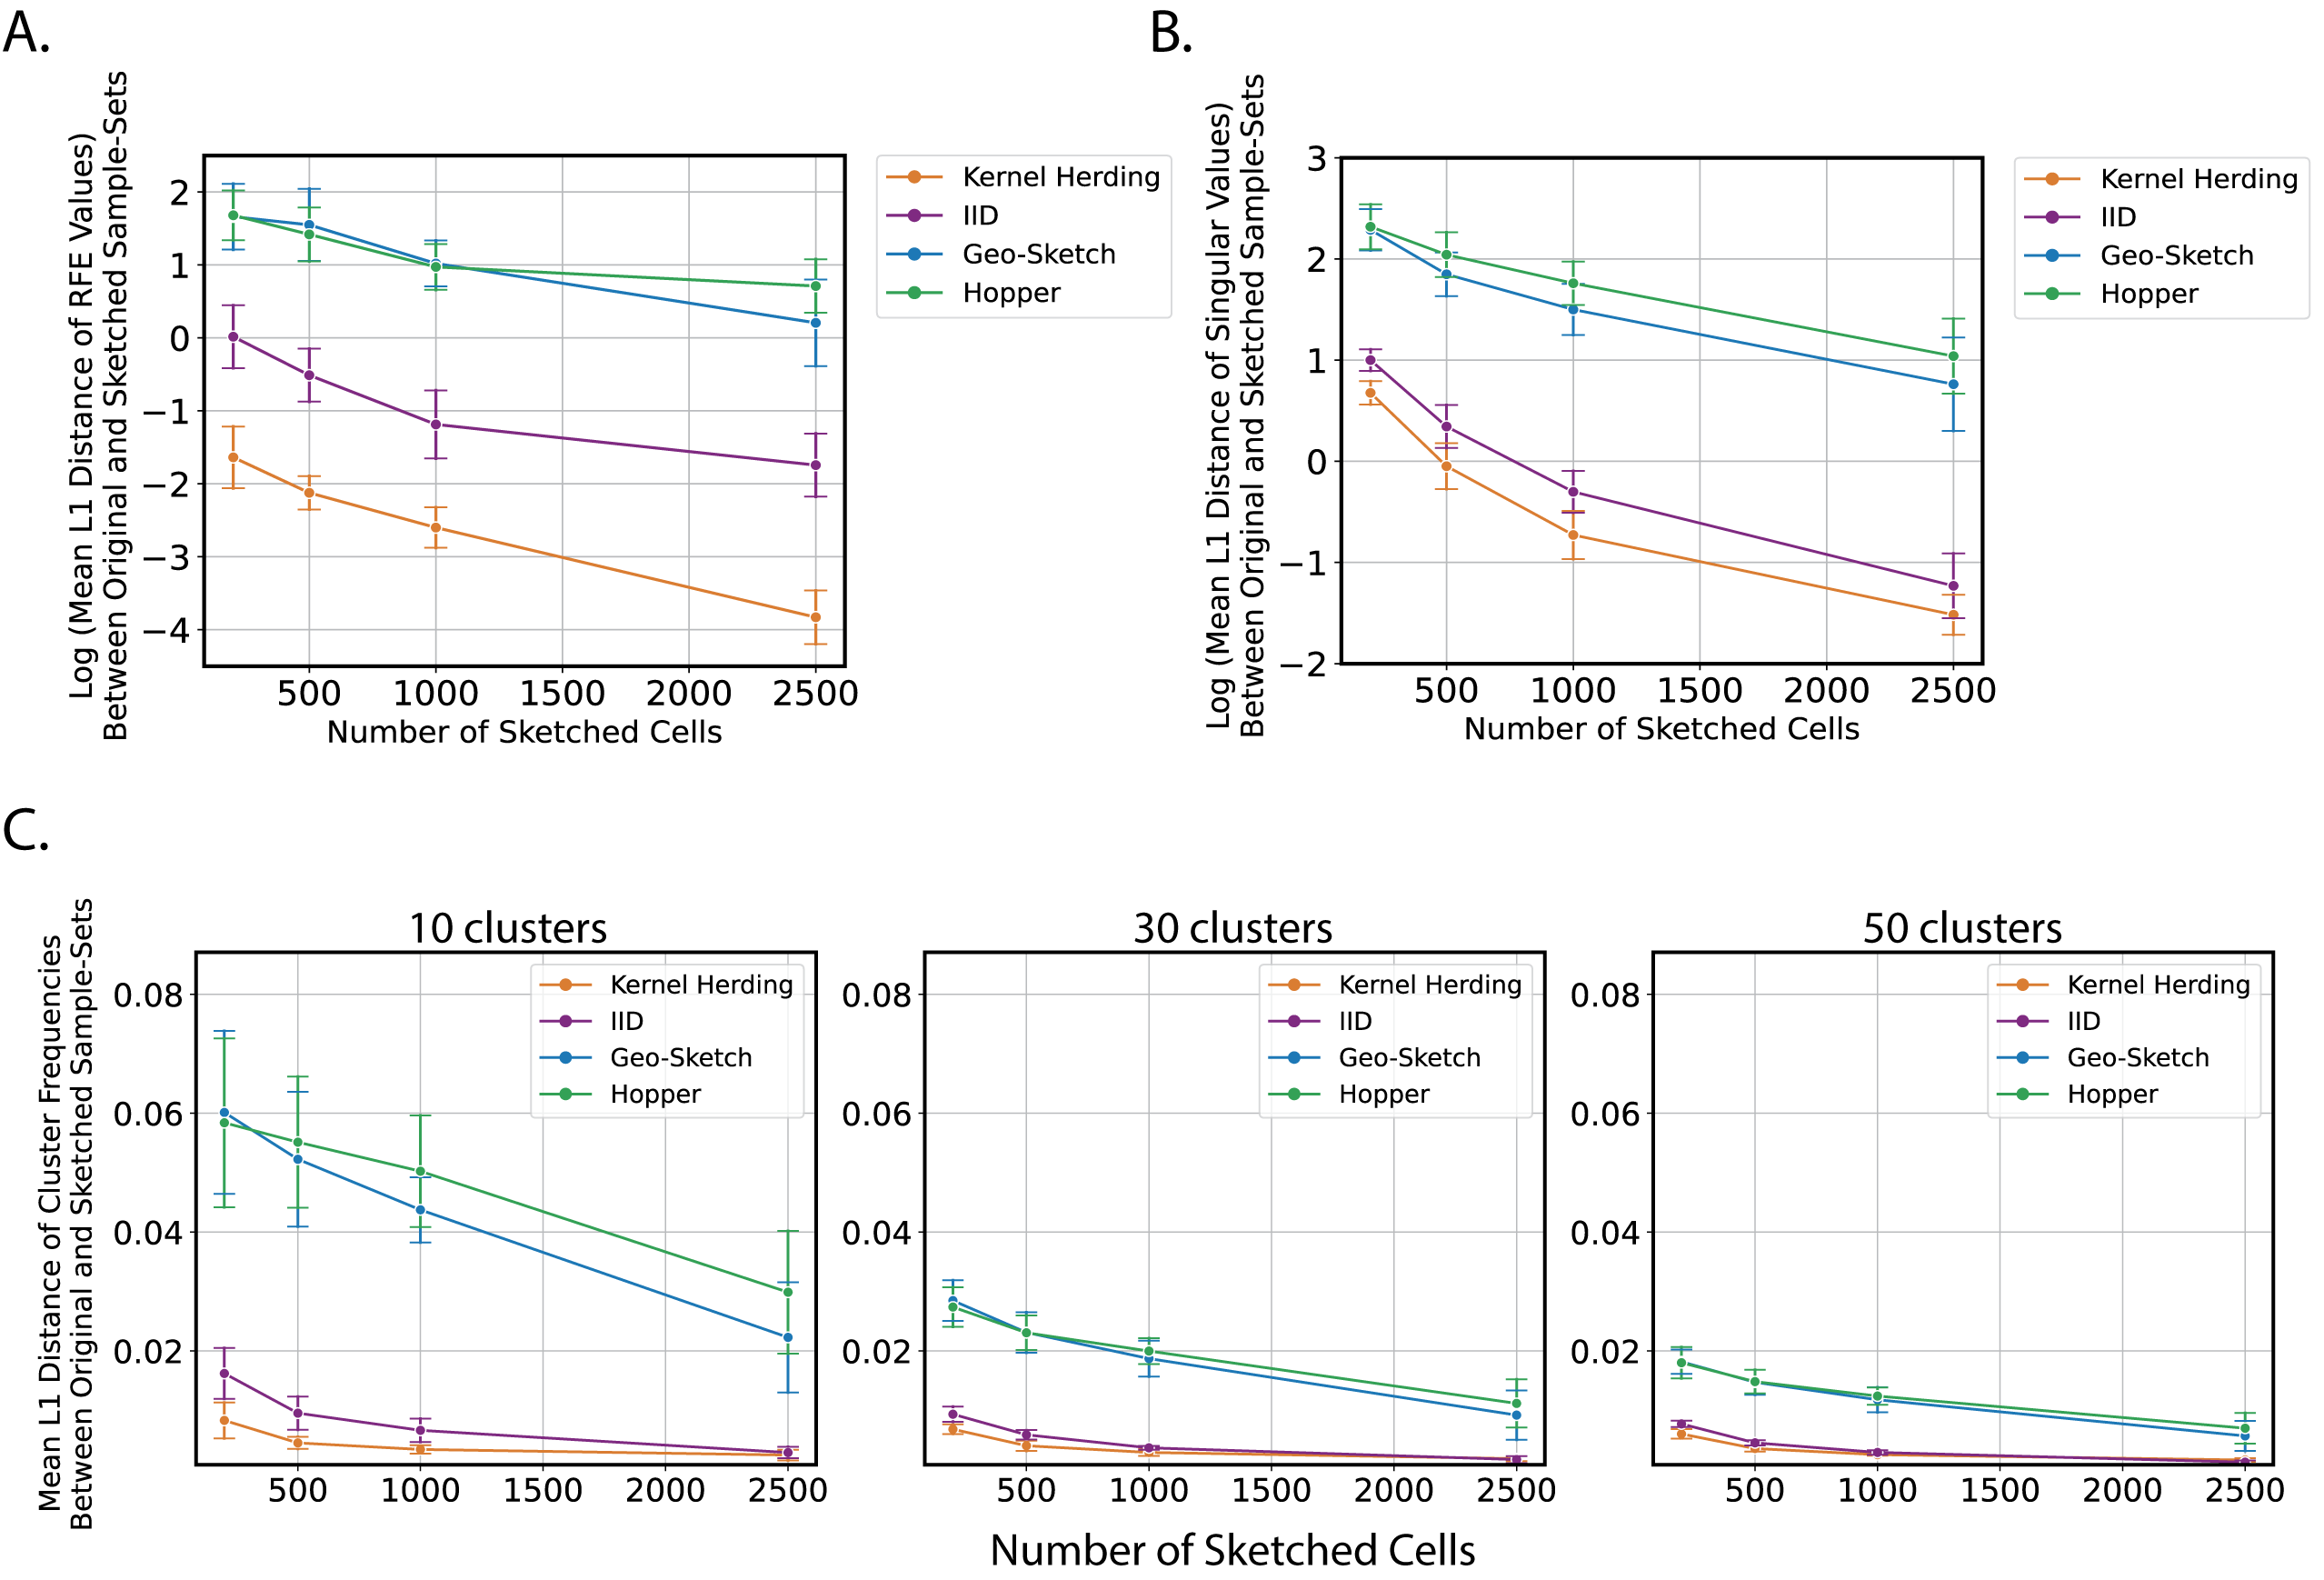
3.7. Single-cell RNA Sequencing Fidelity
For a cross-modality comparison, we tested the performance of Kernel Herding to the sketches obtained using Geometric Sketching, Hopper, and IID subsampling on single-cell RNA sequencing (scRNA-seq) data. This modality poses an additional challenge, as scRNA-seq data typically contains 20-30 thousand gene measurements across all cells and has a high degree of sparsity and technical noise due to capture inefficiency, amplification noise, and stochasticity (Kharchenko et al., 2014). Leveraging a single cell RNA sequencing dataset of patients with multiple sclerosis (MS) and healthy controls, we tested whether sketched cells resulted in similar random function evaluations, similar singular value distributions, and gave similar cell population frequencies. As shown in Figure 8, we found that Kernel Herding produces sketches that are most closely aligned with the results obtained using the full original sample. More specifically, across a range of sketch sizes for each sample-set, Kernel Herding achieves the least distance to the random function estimates in the original dataset (Fig 8A), has the most similar singular value distributions to the original data (Figure 8B), and best preserves cell population frequencies with the least norm between true and sketched cell populations (Figure 8C).
| Methods | HVTN | Preeclampsia | NK Cell |
|---|---|---|---|
| (n=200k, d=11) | (n=215k, d=33) | (n=13k, d=43) | |
| IID | 0.012 0.001 | 0.016 0.003 | 0.004 0.001 |
| Hopper | 3.13 0.12 | 4.43 0.15 | 1.12 0.09 |
| Geo Sketch | 23.76 0.06 | 77.92 0.15 | 12.29 0.06 |
| Kernel Herding | 26.56 4.38 | 22.59 1.38 | 3.64 0.35 |
4. Discussion and Conclusion
Here, we presented a distribution-based, Kernel Herding approach to select a limited number of representative cells from each sample-set. Of particular note, we recast the focus of sketching sample-sets to providing a smaller sketch that can act as a stand-in to the original set. That is, we explicitly and quantitatively assess sketch’s ability to faithfully maintain downstream outcomes when used in place of the original set. In contrast to existing sketching approaches, such as, Geometric Sketching (Hie et al., 2019) and Hopper (DeMeo and Berger, 2020), we found that Kernel Herding strikes a powerful middle-ground between preserving rare cell-populations, while also representing all major cell-types and retaining their relative frequencies. Moreover, maintaining the overall distribution of the original sample is necessary as adequate preservation of cell-population frequencies is important for linking cellular heterogeneity to clinical phenotype or external variables of interest (Stanley et al., 2020; Bruggner et al., 2014), and for developing novel diagnostics or prognostics (Fallahzadeh et al., 2021; Han et al., 2019; Ganio et al., 2020). Given the modern widespread use of cytometry and scRNA-sequencing technologies in clinical applications with large patient cohorts, the presented Kernel Herding based sketching approach makes such data more manageable for downstream analysis and interpretation. We showed that Kernel Herding was effective across multiple varied single cell modalities including flow and mass cytometry, as well as scRNA-seq data.
We demonstrated the usefulness of Kernel Herding at providing sketches that can serve as a stand-in for the original sample-set by measuring the fidelity of non-linear function evaluations, singular value distributions, and cell-population frequencies between the original and sketched sample-sets. Additionally, we showed the usefulness of sketching through Kernel Herding for downstream tasks, such as clinical outcome prediction; here, Kernel Herding had the most stable performance across datasets, number of clusters, and number of sketched cells. This consistency makes it a reliable method that can be employed to obtain a representative subset, small or large, of the original distribution of samples. The runtimes of different methods reported in Table 1 add to the practical usefulness of Kernel Herding.
Future work could consider the implications of sketching with Kernel Herding in a broader range of tasks required to understand single-cell datasets, such as, differential abundance analysis (Lun et al., 2017; Dann et al., 2021; Weber et al., 2019), or for rapid identification of phenotype-associated cells (Burkhardt et al., 2021). Finally, another area of future work may focus on generating variable sketch sizes across different subsections of the cellular landscape, depending on prior knowledge or scientific question.
Acknowledgements.
This research was partly funded by NSF grant IIS2133595 and by NIH 1R01AA02687901A1.References
- (1)
- Aghaeepour et al. (2013) Nima Aghaeepour, Greg Finak, Holger Hoos, Tim R Mosmann, Ryan Brinkman, Raphael Gottardo, and Richard H Scheuermann. 2013. Critical assessment of automated flow cytometry data analysis techniques. Nature methods 10, 3 (2013), 228–238.
- Aghaeepour et al. (2017) Nima Aghaeepour, Edward A Ganio, David Mcilwain, Amy S Tsai, Martha Tingle, Sofie Van Gassen, Dyani K Gaudilliere, Quentin Baca, Leslie McNeil, Robin Okada, Mohammad S Ghaemi, David Furman, Ronald J Wong, Virginia D Winn, Maurice L Druzin, Yaser Y El-Sayed, Cecele Quaintance, Ronald Gibbs, Gary L Darmstadt, Gary M Shaw, David K Stevenson, Robert Tibshirani, Garry P Nolan, David B Lewis, Martin S Angst, and Brice Gaudilliere. 2017. An immune clock of human pregnancy. Science immunology 2, 15 (2017).
- Arunachalam et al. (2020) Prabhu S Arunachalam, Florian Wimmers, Chris Ka Pun Mok, Ranawaka APM Perera, Madeleine Scott, Thomas Hagan, Natalia Sigal, Yupeng Feng, Laurel Bristow, Owen Tak-Yin Tsang, et al. 2020. Systems biological assessment of immunity to mild versus severe COVID-19 infection in humans. Science 369, 6508 (2020), 1210–1220.
- Arvaniti and Claassen (2017) Eirini Arvaniti and Manfred Claassen. 2017. Sensitive detection of rare disease-associated cell subsets via representation learning. Nature communications 8, 1 (2017), 1–10.
- Bendall et al. (2012) Sean C Bendall, Garry P Nolan, Mario Roederer, and Pratip K Chattopadhyay. 2012. A deep profiler’s guide to cytometry. Trends in immunology 33, 7 (2012), 323–332.
- Berlinet and Thomas-Agnan (2011) Alain Berlinet and Christine Thomas-Agnan. 2011. Reproducing kernel Hilbert spaces in probability and statistics. Springer Science & Business Media.
- Bruggner et al. (2014) Robert V Bruggner, Bernd Bodenmiller, David L Dill, Robert J Tibshirani, and Garry P Nolan. 2014. Automated identification of stratifying signatures in cellular subpopulations. Proceedings of the National Academy of Sciences 111, 26 (2014), E2770–E2777.
- Burkhardt et al. (2021) Daniel B Burkhardt, Jay S Stanley, Alexander Tong, Ana Luisa Perdigoto, Scott A Gigante, Kevan C Herold, Guy Wolf, Antonio J Giraldez, David van Dijk, and Smita Krishnaswamy. 2021. Quantifying the effect of experimental perturbations at single-cell resolution. Nature Biotechnology (2021), 1–11.
- Cao et al. (2019) Junyue Cao, Malte Spielmann, Xiaojie Qiu, Xingfan Huang, Daniel M Ibrahim, Andrew J Hill, Fan Zhang, Stefan Mundlos, Lena Christiansen, Frank J Steemers, Cole Trapnell, and Jay Shendure. 2019. The single-cell transcriptional landscape of mammalian organogenesis. Nature 566, 7745 (feb 2019), 496–502.
- Chen et al. (2010) Yutian Chen, Max Welling, and Alex Smola. 2010. Super-samples from kernel herding. In Proceedings of the Twenty-Sixth Conference on Uncertainty in Artificial Intelligence. 109–116.
- Cortes and Vapnik (1995) Corinna Cortes and Vladimir Vapnik. 1995. Support-vector networks. Machine learning 20, 3 (1995), 273–297.
- Dann et al. (2021) Emma Dann, Neil C Henderson, Sarah A Teichmann, Michael D Morgan, and John C Marioni. 2021. Differential abundance testing on single-cell data using k-nearest neighbor graphs. Nature Biotechnology (2021), 1–9.
- DeMeo and Berger (2020) Benjamin DeMeo and Bonnie Berger. 2020. Hopper: a mathematically optimal algorithm for sketching biological data. Bioinformatics 36, Supplement_1 (2020), i236–i241.
- Fallahzadeh et al. (2021) Ramin Fallahzadeh, Franck Verdonk, Ed Ganio, Anthony Culos, Natalie Stanley, Ivana Marić, Alan L Chang, Martin Becker, Thanaphong Phongpreecha, Maria Xenochristou, et al. 2021. Objective Activity Parameters Track Patient-Specific Physical Recovery Trajectories After Surgery and Link With Individual Preoperative Immune States. Annals of Surgery (2021).
- Ganio et al. (2020) Edward A Ganio, Natalie Stanley, Viktoria Lindberg-Larsen, Jakob Einhaus, Amy S Tsai, Franck Verdonk, Anthony Culos, Sajjad Ghaemi, Kristen K Rumer, Ina A Stelzer, Dyani Gaudilliere, Eileen Tsai, Ramin Fallahzadeh, Benjamin Choisy, Henrik Kehlet, Nima Aghaeepour, Martin S Angst, and Brice Gaudilliere. 2020. Preferential inhibition of adaptive immune system dynamics by glucocorticoids in patients after acute surgical trauma. Nature communications 11, 1 (2020), 1–12.
- Gretton et al. (2008) Arthur Gretton, Karsten M Borgwardt, Malte J Rasch, Bernhard Schölkopf, and Alexander Smola. 2008. A Kernel Method for the Two-Sample Problem. Journal of Machine Learning Research 1 (2008), 1–10.
- Gretton et al. (2012) Arthur Gretton, Karsten M Borgwardt, Malte J Rasch, Bernhard Schölkopf, and Alexander Smola. 2012. A kernel two-sample test. The Journal of Machine Learning Research 13, 1 (2012), 723–773.
- Han et al. (2019) Xiaoyuan Han, Mohammad S Ghaemi, Kazuo Ando, Laura S Peterson, Edward A Ganio, Amy S Tsai, Dyani K Gaudilliere, Ina A Stelzer, Jakob Einhaus, Basile Bertrand, Natalie Stanley, Anthony Culoar, Athena Tanada, Julien Hedou, Eileen S Tsai, Ramin Fallahzadeh, Ronald J Wong, Amy E Judy, Virginia D Winn, Maurice L Druzin, Yair J Blumendeld, Mark A Hlatky, Cecele C Quaintance, Ronald S Gibbs, Brendan Carvalho, Gary M Shaw, David K Stevenson, Martin S Angst, Aghaeepour, and Brice Gaudilliere. 2019. Differential dynamics of the maternal immune system in healthy pregnancy and preeclampsia. Frontiers in immunology 10 (2019), 1305.
- Hie et al. (2019) Brian Hie, Hyunghoon Cho, Benjamin DeMeo, Bryan Bryson, and Bonnie Berger. 2019. Geometric sketching compactly summarizes the single-cell transcriptomic landscape. Cell systems 8, 6 (2019), 483–493.
- Johnson et al. (2007) W Evan Johnson, Cheng Li, and Ariel Rabinovic. 2007. Adjusting batch effects in microarray expression data using empirical Bayes methods. Biostatistics 8, 1 (jan 2007), 118–127.
- Kharchenko et al. (2014) Peter V Kharchenko, Lev Silberstein, and David T Scadden. 2014. Bayesian approach to single-cell differential expression analysis. Nat. Methods 11, 7 (jul 2014), 740–742.
- Levine et al. (2015) Jacob H Levine, Erin F Simonds, Sean C Bendall, Kara L Davis, D Amir El-ad, Michelle D Tadmor, Oren Litvin, Harris G Fienberg, Astraea Jager, Eli R Zunder, Rachel Finck, Amanda L Gedman, Ina Radtkae, James R Downing, Dana Pe’er, and Garry P Nolan. 2015. Data-driven phenotypic dissection of AML reveals progenitor-like cells that correlate with prognosis. Cell 162, 1 (2015), 184–197.
- Liechti et al. (2021) Thomas Liechti, Lukas M Weber, Thomas M Ashhurst, Natalie Stanley, Martin Prlic, Sofie Van Gassen, and Florian Mair. 2021. An updated guide for the perplexed: cytometry in the high-dimensional era. Nature Immunology 22, 10 (2021), 1190–1197.
- Lotfollahi et al. (2021) Mohammad Lotfollahi, Mohsen Naghipourfar, Malte D Luecken, Matin Khajavi, Maren Büttner, Marco Wagenstetter, Žiga Avsec, Adam Gayoso, Nir Yosef, Marta Interlandi, Sergei Rybakov, Alexander V Misharin, and Fabian J Theis. 2021. Mapping single-cell data to reference atlases by transfer learning. Nat. Biotechnol. (aug 2021).
- Luecken and Theis (2019) Malte D Luecken and Fabian J Theis. 2019. Current best practices in single-cell RNA-seq analysis: a tutorial. Molecular systems biology 15, 6 (2019), e8746.
- Lun et al. (2017) Aaron TL Lun, Arianne C Richard, and John C Marioni. 2017. Testing for differential abundance in mass cytometry data. Nature methods 14, 7 (2017), 707–709.
- Lun et al. (2016) Aaron T L Lun, Karsten Bach, and John C Marioni. 2016. Pooling across cells to normalize single-cell RNA sequencing data with many zero counts. Genome Biol. 17 (apr 2016), 75.
- Mathew et al. (2020) Divij Mathew, Josephine R Giles, Amy E Baxter, Derek A Oldridge, Allison R Greenplate, Jennifer E Wu, Cécile Alanio, Leticia Kuri-Cervantes, M Betina Pampena, Kurt D’Andrea, Sasikanth Manne, Zeyu Chen, Yinghui Jane Huang, John P Reilly, Ariel R Weisman, Caroline A G Ittner, Oliva Kuthuru, Jeanette Dougherty, Kito Nzingha, Nicholas Han, Justin Kim, Ajinkya Pattekar, Eileen C Goodwin, Elizabeth M Anderson, Madison E Weirick, Sigrid Gouma, Claudia P Arevalo, Marcus J Bolton, Fang Chen, Simon F Lacey, Holly Ramage, Sara Cherry, Scott E Hensley, Sokratis A Apostolidis, Alexander C Huang, Laura A Vella, UPenn COVID Processing Unit, Michael R Betts, Nuala J Meyer, and E John Wherry. 2020. Deep immune profiling of COVID-19 patients reveals distinct immunotypes with therapeutic implications”. Science 369, 6508 (sep 2020).
- Mika et al. (1998) Sebastian Mika, Bernhard Schölkopf, Alexander J Smola, Klaus-Robert Müller, Matthias Scholz, and Gunnar Rätsch. 1998. Kernel PCA and De-noising in feature spaces.. In NIPS, Vol. 11. 536–542.
- Moon et al. (2019) Kevin R Moon, David van Dijk, Zheng Wang, Scott Gigante, Daniel B Burkhardt, William S Chen, Kristina Yim, Antonia van den Elzen, Matthew J Hirn, Ronald R Coifman, Natalia B Ivanova, Guy Wolf, and Smita Krishnaswamy. 2019. Visualizing structure and transitions in high-dimensional biological data. Nat. Biotechnol. 37, 12 (dec 2019), 1482–1492.
- Muandet et al. (2017) Krikamol Muandet, Kenji Fukumizu, Bharath Sriperumbudur, and Bernhard Schölkopf. 2017. Kernel mean embedding of distributions: A review and beyond. Foundations and Trends in Machine Learning 10, 1-2 (2017), 1–141.
- Oliva et al. (2014) Junier Oliva, Willie Neiswanger, Barnabás Póczos, Jeff Schneider, and Eric Xing. 2014. Fast distribution to real regression. In Artificial Intelligence and Statistics. PMLR, 706–714.
- Rahimi et al. (2007) Ali Rahimi, Benjamin Recht, et al. 2007. Random Features for Large-Scale Kernel Machines.. In NIPS, Vol. 3. Citeseer, 5.
- Regev et al. (2017) Aviv Regev, Sarah A Teichmann, Eric S Lander, Ido Amit, Christophe Benoist, Ewan Birney, Bernd Bodenmiller, Peter Campbell, Piero Carninci, Menna Clatworthy, Hans Clevers, Bart Deplancke, Ian Dunham, James Eberwine, Roland Eils, Wolfgang Enard, Andrew Farmer, Lars Fugger, Berthold Göttgens, Nir Hacohen, Muzlifah Haniffa, Martin Hemberg, Seung Kim, Paul Klenerman, Arnold Kriegstein, Ed Lein, Sten Linnarsson, Emma Lundberg, Joakim Lundeberg, Partha Majumder, John C Marioni, Miriam Merad, Musa Mhlanga, Martijn Nawijn, Mihai Netea, Garry Nolan, Dana Pe’er, Anthony Phillipakis, Chris P Ponting, Stephen Quake, Wolf Reik, Orit Rozenblatt-Rosen, Joshua Sanes, Rahul Satija, Ton N Schumacher, Alex Shalek, Ehud Shapiro, Padmanee Sharma, Jay W Shin, Oliver Stegle, Michael Stratton, Michael J T Stubbington, Fabian J Theis, Matthias Uhlen, Alexander van Oudenaarden, Allon Wagner, Fiona Watt, Jonathan Weissman, Barbara Wold, Ramnik Xavier, Nir Yosef, and Human Cell Atlas Meeting Participants. 2017. The Human Cell Atlas. Elife 6 (dec 2017).
- Schafflick et al. (2020) David Schafflick, Chenling A Xu, Maike Hartlehnert, Michael Cole, Andreas Schulte-Mecklenbeck, Tobias Lautwein, Jolien Wolbert, Michael Heming, Sven G Meuth, Tanja Kuhlmann, Catharina C Gross, Heinz Wiendl, Nir Yosef, and Gerd Meyer Zu Horste. 2020. Integrated single cell analysis of blood and cerebrospinal fluid leukocytes in multiple sclerosis. Nat. Commun. 11, 1 (jan 2020), 247.
- Spitzer and Nolan (2016) Matthew H Spitzer and Garry P Nolan. 2016. Mass cytometry: single cells, many features. Cell 165, 4 (2016), 780–791.
- Stanley et al. (2020) Natalie Stanley, Ina A Stelzer, Amy S Tsai, Ramin Fallahzadeh, Edward Ganio, Martin Becker, Thanaphong Phongpreecha, Huda Nassar, Sajjad Ghaemi, Ivana Maric, Anthony Culos, Alan L Chang, Maria Xenochristou, Xiaoyuan Han, Camilo Espinosa, Kristen Rumer, Laura Peterson, Franck Verdonk, Dyani Gaudilliere, Eileen Tsai, Dorien F Feyaerts, Jakob Einhaus, Kazuo Ando, Ronald J Wong, Gerlinde Obermoser, Gary M Shaw, David K Stevenson, Martin S Angst, Brice Gaudilliere, and Nima Aghaeepour. 2020. VoPo leverages cellular heterogeneity for predictive modeling of single-cell data. Nature communications 11, 1 (2020), 1–9.
- Velten et al. (2022) Britta Velten, Jana M Braunger, Ricard Argelaguet, Damien Arnol, Jakob Wirbel, Danila Bredikhin, Georg Zeller, and Oliver Stegle. 2022. Identifying temporal and spatial patterns of variation from multimodal data using MEFISTO. Nat. Methods (jan 2022).
- Vovk (2013) Vladimir Vovk. 2013. Kernel ridge regression. In Empirical inference. Springer, 105–116.
- Weber et al. (2019) Lukas M Weber, Malgorzata Nowicka, Charlotte Soneson, and Mark D Robinson. 2019. diffcyt: Differential discovery in high-dimensional cytometry via high-resolution clustering. Communications biology 2, 1 (2019), 1–11.
- Yi and Stanley (2021) Haidong Yi and Natalie Stanley. 2021. CytoSet: predicting clinical outcomes via set-modeling of cytometry data. In Proceedings of the 12th ACM Conference on Bioinformatics, Computational Biology, and Health Informatics (Gainesville, Florida) (BCB ’21”, Article 47). Association for Computing Machinery, New York, NY, USA, 1–8.