Hard X-ray emission from the eastern jet of SS 433 powering the W50 ‘Manatee’ nebula: Evidence for particle re-acceleration
Abstract
We present a broadband X-ray study of W50 (‘the Manatee nebula’), the complex region powered by the microquasar SS 433, that provides a test-bed for several important astrophysical processes. The W50 nebula, a Galactic PeVatron candidate, is classified as a supernova remnant but has an unusual double-lobed morphology likely associated with the jets from SS 433. Using NuSTAR, XMM-Newton, and Chandra observations of the inner eastern lobe of W50, we have detected hard non-thermal X-ray emission up to 30 keV, originating from a few-arcminute size knotty region (‘Head’) located 18′ (29 pc for a distance of 5.5 kpc) east of SS 433, and constrain its photon index to 1.580.05 (0.5–30 keV band). The index gradually steepens eastward out to the radio ‘ear’ where thermal soft X-ray emission with a temperature 0.2 keV dominates. The hard X-ray knots mark the location of acceleration sites within the jet and require an equipartition magnetic field of the order of 12G. The unusually hard spectral index from the ‘Head’ region challenges classical particle acceleration processes and points to particle injection and re-acceleration in the sub-relativistic SS 433 jet, as seen in blazars and pulsar wind nebulae.
1 Introduction
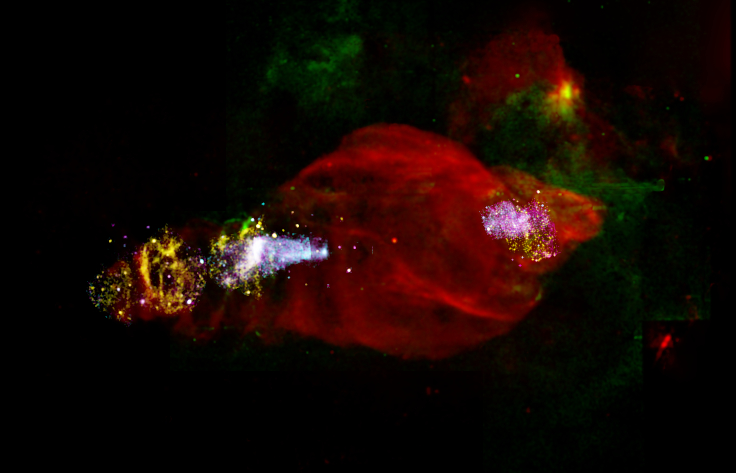
The W50 nebula, catalogued as a Galactic supernova remnant (SNR G39.7–2.0) (Velusamy & Kundu, 1974; van den Bergh, 1980), is best known for its association with the microquasar SS 433, a binary system that displays precessing semi-relativistic (=0.26c) jets, believed to be a stellar-mass-sized black hole analogue to Active Galactic Nuclei, AGN (Margon, 1984; Fabrika, 2004). With a linear extent of 2o (East-West) 1o (North-South), W50 is one of the largest known SNRs in our Galaxy, over 200 pc 100 pc across for the assumed distance kpc (Blundell & Bowler, 2004). Dubbed the ‘Manatee nebula’ for its radio appearances111https://www.nrao.edu/pr/2013/w50/ (Elston & Baum, 1987; Dubner et al., 1998; Farnes et al., 2017), the SNR’s unique morphology is likely the result of its interaction with the jets from SS 433, as suggested by the location of optical filaments and the elongation of W50 aligned with the axes of the jets’ precession cone. This conclusion was also reached using numerical simulations (Goodall et al., 2011). The ‘ears’ (eastern and western radio-bright edges) of the nebula are reminiscent of the lobes seen in active galaxies and in the bubbles associated with some Ultra-Luminous X-ray sources. Figure 1 shows our multi-wavelength image of this fascinating source.
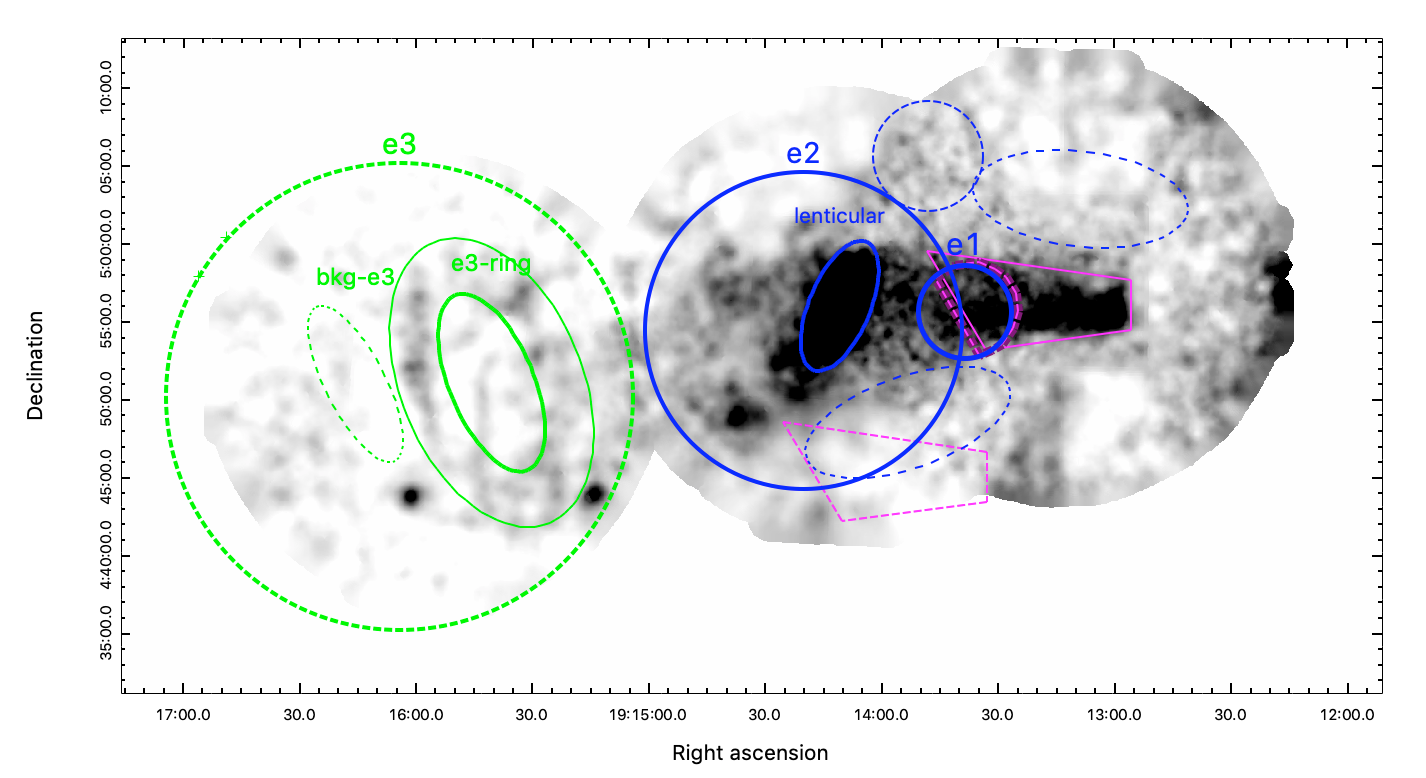
Regions of the W50 nebula have been sampled within the field-of-view (FoV) of several X-ray missions: ROSAT, ASCA and RXTE in the 1990’s (Safi-Harb & Ögelman, 1997; Yamauchi et al., 1994; Safi-Harb & Petre, 1999) and earlier this century with XMM-Newton and Chandra (Brinkmann et al., 2007; Moldowan et al., 2005). In 2019, the SRG/eROSITA mission provided an unprecedented view of the whole nebula of W50/SS433 in X-rays.222Khabibullin and the SRG/eROSITA consortium 2020, https://events.mpe.mpg.de/event/9/contributions/339/ Overall, the X-ray emission is far from what would be expected from an evolved SNR due to: (a) the morphology of the X-ray lobes filling the gap between SS433 and the radio ‘ears’, and within the projection of the jets’ precessing cone, and, (b) the X-ray spectrum softening away from SS433, along the axes of the precessing jets. Furthermore, while the outermost region of W50, coincident with the eastern radio ear (referred to as region ‘e3’ in Safi-Harb & Ögelman (1997)), is dominated by soft thermal X-rays, for the interior (see regions ‘e1’ to ‘e2’ in Figure 2), hard thermal (kT5–12 keV) or non-thermal (photon index 1.4–1.6) emission is inferred (Safi-Harb & Petre, 1999).
This hard spectrum implies, in the non-thermal interpretation, maximum energies of electrons of 300–450 TeV responsible for the synchrotron emission, thus unveiling a new site of cosmic ray acceleration in a jet source: a Galactic PeVatron candidate (Safi-Harb & Petre, 1999; Aharonian et al., 2005). This motivated the search for high-energy, gamma-ray emission from the source using the Major Atmospheric Gamma Imaging Cherenkov telescopes (MAGIC) and the High Energy Spectroscopic System (H.E.S.S.) (MAGIC Collaboration et al., 2018), as well as the Very Energetic Radiation Imaging Telescope Array System (VERITAS) (Kar & VERITAS Collaboration, 2017), leading to upper limits on TeV emission from the system. The PeVatron scenario has been more recently revived with the discovery of TeV emission with the High Altitude Water Cherenkov (HAWC) Observatory (Abeysekara et al., 2018) whose peak lies close to the ‘e1’ region. Furthermore, a recent joint Fermi-LAT and HAWC analysis (Fang et al. (2020) and references therein) finds common emission sites of GeV-to-TeV -rays inside the eastern and western lobes of SS 433. Despite the surge of gamma-ray studies and multi-wavelength SED modelling of this system, the origin of the hard(est) X-ray emission, its extent/compactness, and steepness of its spectrum remain unknown.
In this paper, we present the first joint NuSTAR and XMM-Newton study of the inner eastern lobe of W50 to probe the properties of the hard X-ray emission and thus address the particle acceleration process(es) powering this Galactic PeVatron candidate. Combining new and archival XMM-Newton data and Chandra, we also present the first XMM-Newton coverage of the full eastern jet extending from SS 433 out to the radio ‘ear’, as well as the first Chandra coverage of the innermost X-ray emitting region.
2 Observations
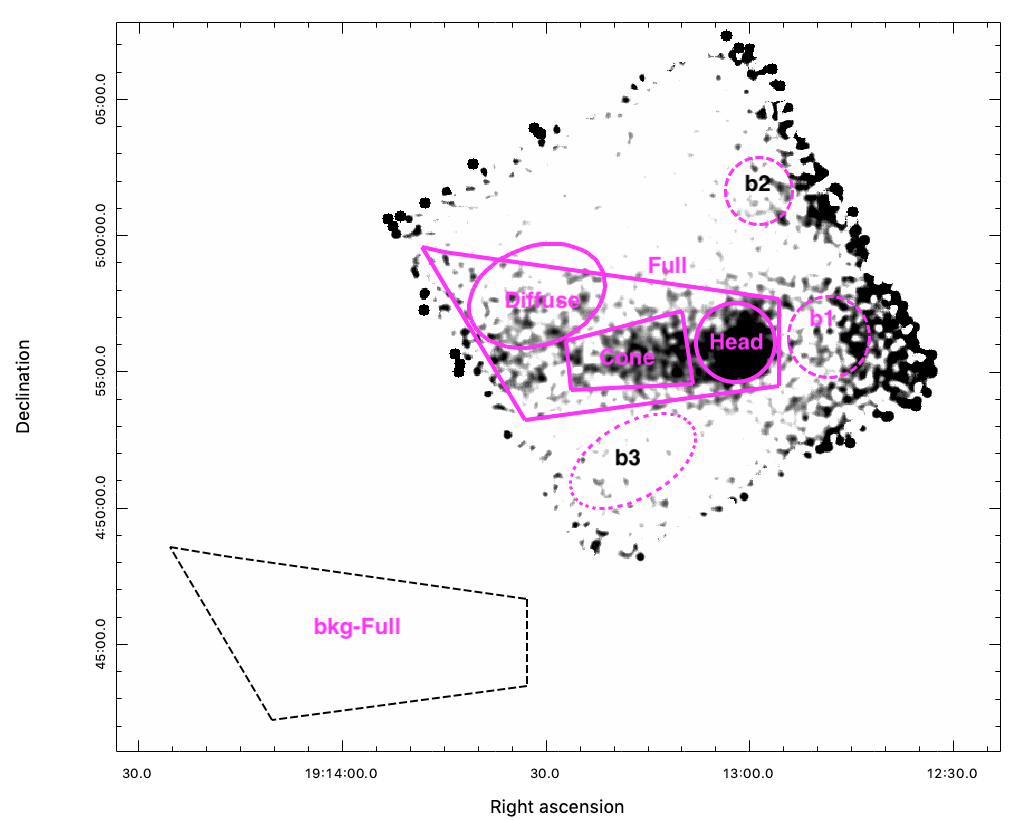
Three main X-ray emitting regions in the eastern lobe of W50 are defined in Safi-Harb & Ögelman (1997) and labelled ‘e1’, ‘e2’ and ‘e3’, centered at 24′, 35′, and 60′ east of SS 433, respectively. For kpc, these correspond to a projected distance from SS 433 of 38 pc, 56 pc and 96 pc, respectively. In the following, we describe new NuSTAR and XMM-Newton observations targeting region ‘e1’ along with an archival XMM-Newton observation of ‘e2’ and ‘e3’ (Brinkmann et al., 2007). A Chandra observation of SS 433 (Migliari et al., 2002) serendipitously covered a portion of ‘e1’. Summary images that outline these regions is shown in Figure 2. A list of the X-ray observations used in this study is presented in Table 1.
2.1 NuSTAR
NuSTAR observed the inner eastern lobe region, targeting region ‘e1’, on 2019 December 1. NuSTAR consists of two co-aligned X-ray telescopes coupled with focal plane detector modules FPMA and FPMB (Harrison et al., 2013). These are sensitive to X-rays in the 379 keV band, with a characteristic spectral resolution of 400 eV FWHM at 10 keV. The multi-nested foil mirrors provide FWHM ( HPD) imaging resolution over a field-of-view. NuSTAR data were processed and analyzed using FTOOLS (HEAsoft 6.28) with NuSTAR Calibration Database (CALDB) files of 2021 January 05. The resulting dataset provides a total of 109 ks, with 32 ks on a nearby off-source background field. For all subsequent analysis we merged data from the two FPM detectors. Images and exposure maps were generated following the standard procedure as outlined in Nynka et al. (2014), using FTOOLS extractor and nuexpomap. The X-ray background for the source region, which is largely dominated by stray-light photons, is estimated from the scaled off-source observation. The mirror vignetting is applied to the exposure correction.
2.2 XMM-Newton
XMM-Newton observed regions in the eastern lobe covering ‘e1’ and part of ‘e2’ on 2020 March 24 for 69 ks. The European Photon Imaging Camera (EPIC) on-board XMM-Newton consists of three detectors, the EPIC pn detector (Strüder et al., 2001) and EPIC MOS1 and MOS2 (Turner et al., 2001). The on-axis point spread function has a FWHM of and at 1.5 keV, for the pn and MOS, respectively. The EPIC detectors are sensitive to X-rays in the 0.1512 keV range with moderate energy resolution of 2050. Data were reduced and analyzed using the Standard Analysis Software (SAS) v.19.1.0 with the most up-to-date calibration files. The source and background regions were chosen as described in detail in Section 3.2 and extracted using evselect. The response matrix file (rmf) and ancillary response file (arf) were generated for extended emission using the SAS commands rmfgen and arfgen. After filtering out background flares we obtained an effective exposure of 31/29/23 ks, for the MOS1/MOS2/pn data, respectively. We supplement our study with the archival XMM-Newton observation, carried out in 2004, covering regions ‘e2’ to ‘e3’. After cleaning the data, the effective exposure time is 26.7 ks for each MOS1 and MOS2 and 21.4 ks for pn.
2.3 Chandra
The innermost portion of the eastern lobe was serendipitously covered during a Chandra ACIS-S333https://cxc.harvard.edu/proposer/POG/html/chap6.html observation obtained on 2000 June 27 and aimed at SS 433. We used this observation to explore the morphology and verify the spectral index of the region overlapping ‘e1’. We reduce the data using CIAO version 4.12 (Fruscione et al., 2006) and the calibration files in the CALDB database (version 4.9.1). The event files were reprocessed from level 1 using standard procedures to remove pixel randomization and to correct for CCD charge transfer efficiencies. Response files were created using specextract, and the background was selected from a nearby source-free region south of the source and located on the same chip. The resulting effective exposure time for this observation is 9.7 ks.
3 Analysis Results
3.1 Imaging Analysis
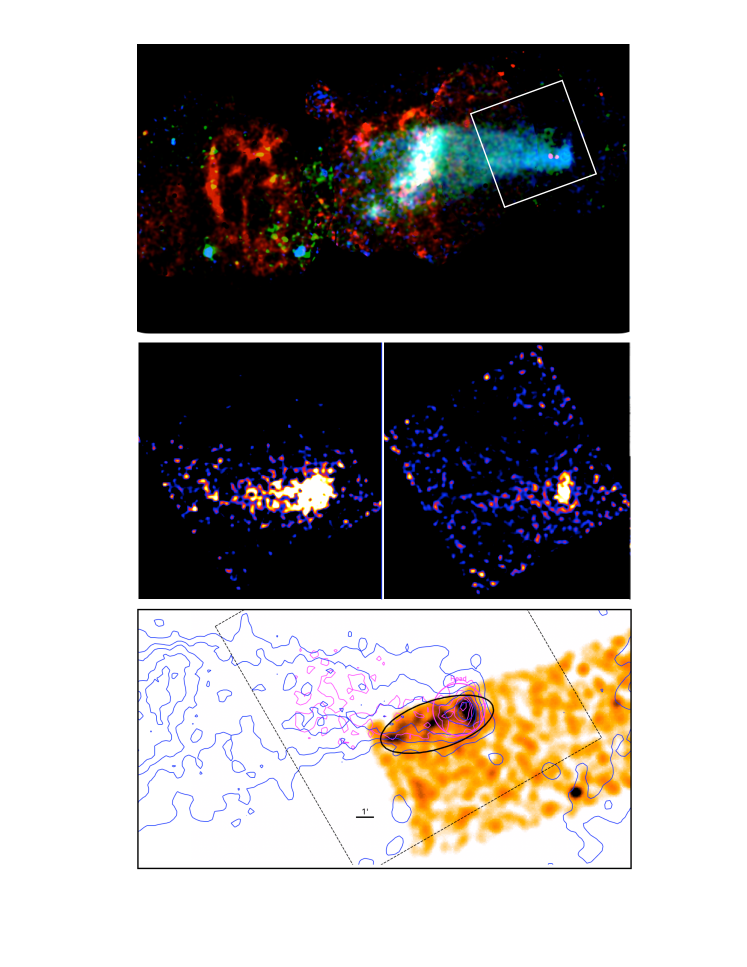
Figure 3 (top) shows an energy resolved RGB color image of the eastern lobe that combines the new and archival XMM-Newton observations. Red, green and blue correspond to the soft (0.5–1.0 keV), medium (1.0–2.0 keV) and hard (2–10 keV) X-ray bands, respectively. The colors clearly show that (a) the innermost region of W50 is the hardest and starts at a distance closer to SS 433 than ‘e1’, (2) there is a mix of hard and soft X-ray emission in ‘e2’, the brightest X-ray emitting region in the eastern lobe (lenticular, white region) where the extension of the radio shell to the North roughly intersects with the axis of the SS433 jet (see Section 4 below and Figure 8), and (3) the apparent jet-ISM termination region (coincident with the radio ‘ear’) is dominated by soft X-ray emission with a ring-like structure (in red) that mimics the helical structure seen from the precessing SS 433 jets on much smaller scales (Migliari et al., 2002).
Figure 3 (middle) presents the merged NuSTAR FPMA and FPMB exposure-corrected, background-subtracted image of the ‘e1’ region in the 3–10 keV and 10–20 keV energy bands. The X-ray emission is seen to peak in the ‘Head’ region in both the soft and hard X-ray bands, and extending into the ‘e1’ region where the emission becomes fainter and more diffuse. In Figure 3 (bottom), we show the Chandra image with the XMM-Newton and NuSTAR contours overlaid. The ‘Head’ emission fell on the outer S1 chip of ACIS-S and is close to its edge.
In what follows, we examine the spatial profile of the region around the ‘Head’ to address its extent.
3.1.1 Spatial Profile with NuSTAR and XMM-Newton
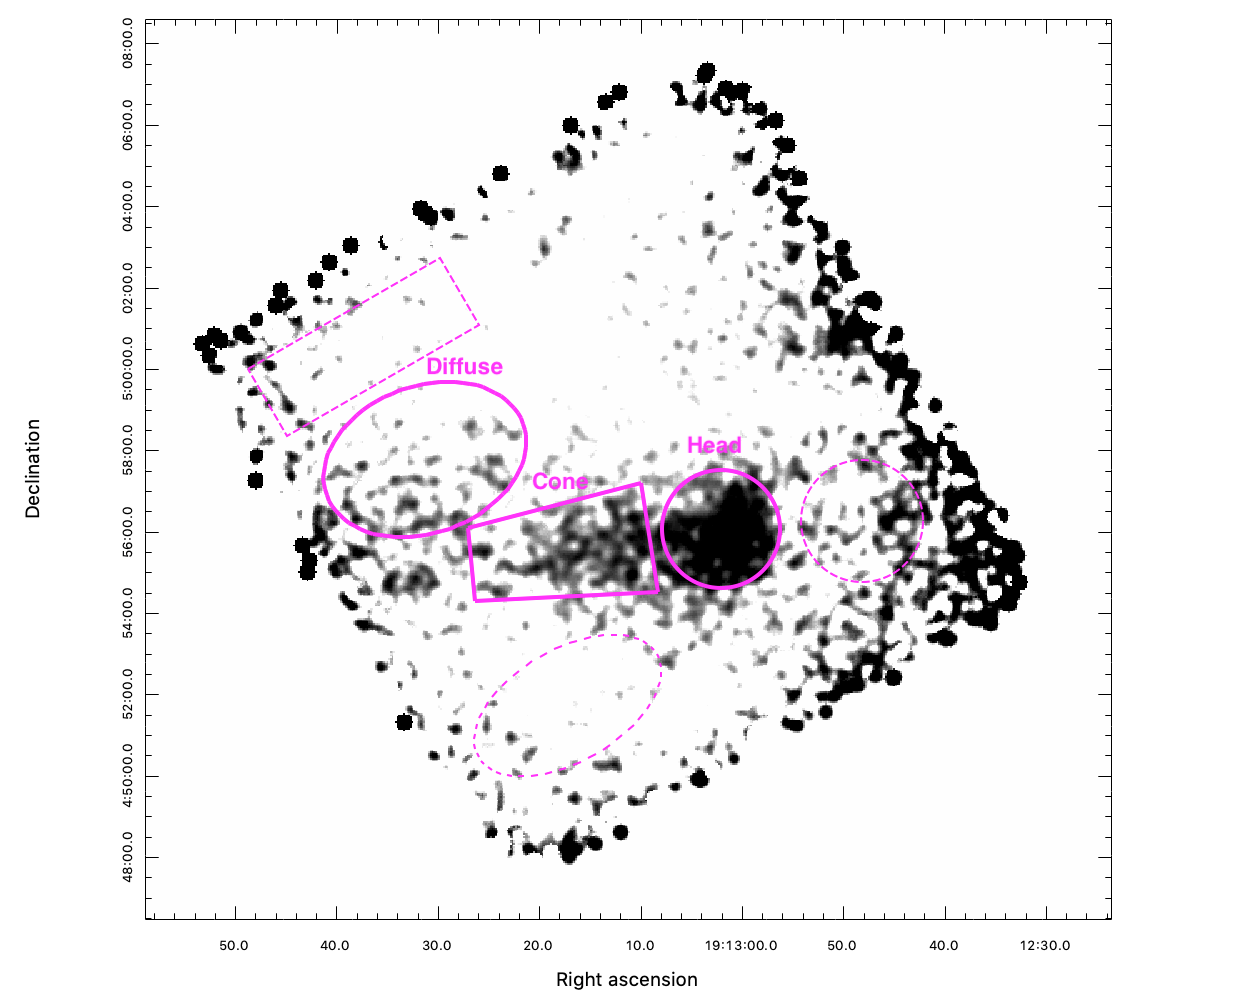
In order to examine the morphology and hardness ratio throughout the eastern jet, we created linear profiles along the jet for both the soft and hard bands. The orientation and dimensions of the region used to form the linear profiles are shown in Figure 4. The profiles were primarily selected in order to study the emission around the ‘Head’ location and were created by plotting the summed y-axis image values for each point along the x-axis.
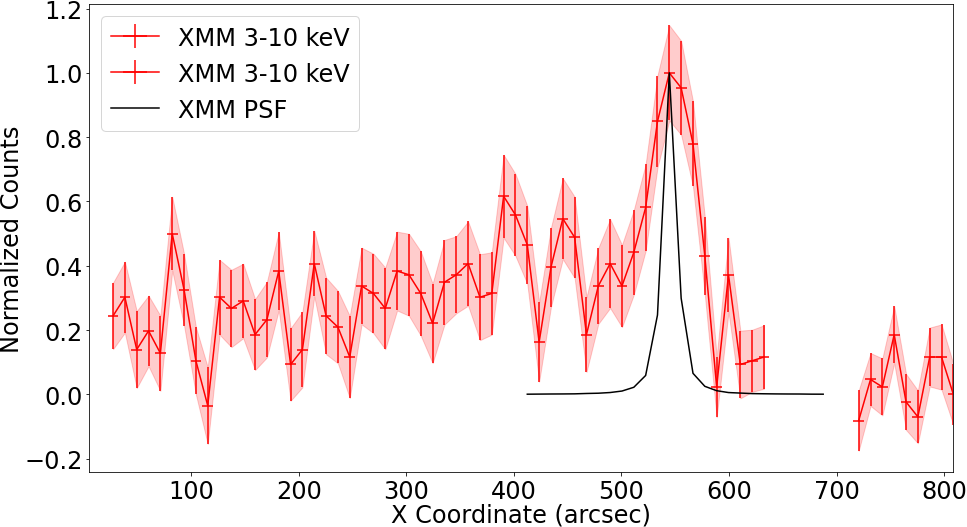
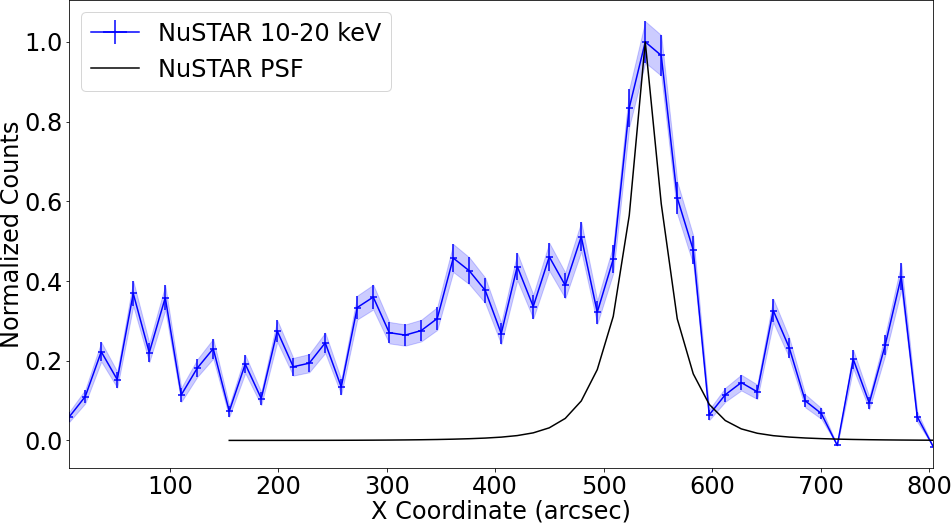
We first sought to compare linear profiles of the jet around the ‘Head’ region to the PSF of the telescope used for the observation. For the soft band, we used the XMM-Newton observation because of its superior angular resolution compared to NuSTAR. For this analysis, we only used the MOS1 image and initially binned it to 1.1′ per pixel. The profile was then binned to 10 pixels in order to smooth it without losing considerable structural information. For the background subtraction, we chose a region close to the source region and subsequently subtracted the background region profile from the source profile. The NuSTAR observation was used to create the hard band linear profile. With a pixel size of 2.46′′, we chose to bin the NuSTAR profile to 6 pixels per bin. The x-axis values of the profiles were then scaled by their respective observation’s pixel size in arcseconds in order to make it easier to compare the XMM-Newton and NuSTAR profiles. The NuSTAR background subtraction was done by subtracting the processed off source image from the processed on source image.
For comparison to the XMM MOS1 3–10 keV profile, we use the MOS1 6 keV, 3′ off-axis PSF. We compare the NuSTAR 10–20 keV profile to a NuSTAR 12–20 keV effective PSF. We normalized both the linear profiles and PSFs to unity. The XMM-Newton MOS1 and NuSTAR PSFs were then centered upon the highest value of their respective profiles. The XMM 3–10 keV profile and corresponding PSF are shown in Figure 4 (top), whereas the NuSTAR 10–20 keV and corresponding PSF are shown in Figure 4 (bottom). We note that the gaps seen in the XMM-Newton linear profile demarcate the MOS1 chip gap. These plots show that the ‘Head’ region is extended compared to the nominal instrument’s PSF.
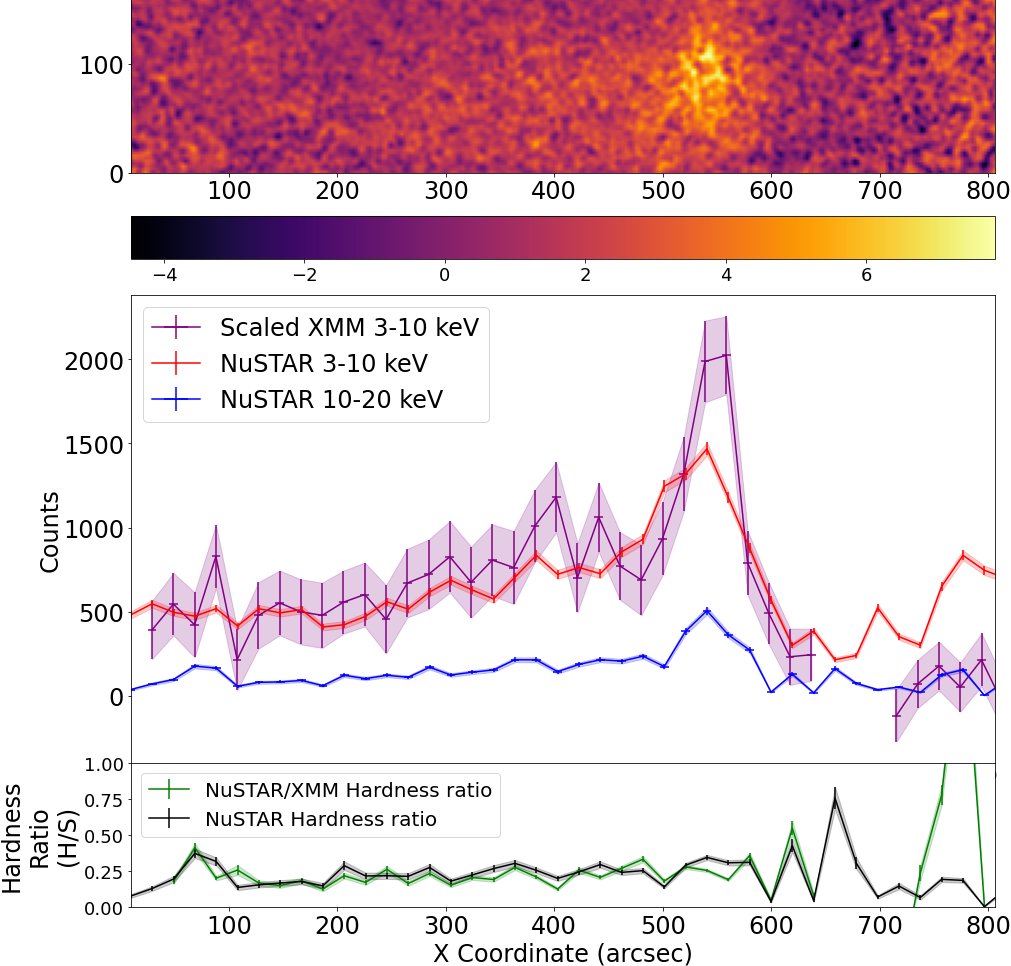
In order to measure the hardness ratio along the jet, we must compare the soft and hard band linear profiles. The NuSTAR observation is however affected by ghost rays near the ‘Head’ region. The ghost ray contribution is more significant in the soft band, so we attempt to avoid these ghost rays by also comparing the XMM-Newton soft band profile and the NuSTAR hard band profile. We bin both the NuSTAR 3–10 keV and 10–20 keV linear profiles to 8 pixels per bin. For the XMM 3–10 keV profile, we initially bin the MOS1 image to 2.45′′ per pixel, close to NuSTAR’s 2.46′′ pixel size. We then bin the XMM 3–10 keV profile to 8 pixels per bin. In order to make the XMM-Newton soft band profile comparable to the NuSTAR profiles, we scale the XMM soft band profile so that the average value of the leftmost 15 bins is normalized to the corresponding extrapolated values of the NuSTAR soft band profile. By choosing the leftmost 15 bins, we avoid the ghost rays near the ‘Head’ region of the jet. We note that for this profile comparison, the background subtraction was done before scaling the XMM-Newton profile to the NuSTAR soft band profile. In each case, we calculate the hardness ration as , where is the number of counts from the hard band profile and is the number of counts from the soft band profile. The various profiles and hardness ratio plots are shown in Figure 5. The NuSTAR-only and NuSTAR-XMM hardness ratio plots are similar, diverging from each other the most in the region to the right of the ‘Head’, where we expect the greatest contribution from ghost rays. Ghost rays are further discussed in §A.1.
3.1.2 Chandra
In order to further verify the extent of the hard X-ray emitting region and spatially resolve it, we examine the archival Chandra observation of SS 433. As illustrated in Fig. 6 (inset) and Fig. 3 (bottom), this emission can be resolved into 1′-scale knotty structures, which translate to a scale of 1.6 pc at a distance kpc. This Chandra dataset is however limited by poor statistics (see §3.2.2). A more detailed analysis requires a deeper and targeted Chandra observation of this region.
3.2 Spectral Analysis
Guided by previous X-ray observations of the W50 system (see §1) we considered both non-thermal (power-law and broken power-law) models and thermal models for our spectral fits. Spectral analysis was accomplished using the X-ray spectral fitting package XSPEC v12.11.1 (Arnaud, 1996)444http://xspec.gsfc.nasa.gov with the tbabs model to describe photoelectric absorption by the interstellar medium, using the Wilms et al. (2000) abundances. In general, this yields column densities, , that are higher than previously published with earlier abundance models.
The XMM-Newton, NuSTAR, and Chandra data were fitted in the 0.5–10 keV, 3–30 keV, and 0.5–8.0 keV band respectively. The XMM-Newton spectra were grouped with a minimum of 30/50 counts per bin for MOS/pn data and 10 counts per bin for Chandra. For NuSTAR, the background subtracted spectra are grouped for at least detection level per data bin. Since NuSTAR is not sensitive to the soft X-ray band, we fixed the column density to the value derived from XMM-Newton. The Chandra spectrum was fitted independently given its coverage of an overlapping, but not identical, region in the innermost eastern lobe (Fig. 2). For all joint fits, a constant factor is used to account for calibration differences between instruments. Quoted errors are at the 90% confidence level (CL), and our fitting procedure used the chi-square () statistic, unless otherwise noted.
3.2.1 NuSTAR and XMM-Newton Spatially Resolved Spectroscopy
Careful background subtraction is needed for the spectral analysis of the W50 lobe regions, given the nearness of W50 to the Galactic plane and its bright engine SS 433. This results in a complicated NuSTAR background due to stray light, ghost rays, instrumental, and cosmic background components. Our NuSTAR background analysis is detailed in Appendix §A.1. For the XMM-Newton data, background selections consistent between archival and new observations were made for verification. Additionally, background selections identical to those used for the NUSTAR spectral analysis were used as an additional layer of consistency check. Over 13 background region selections, including from a nearby off-source observation, were tested before settling on the background selection shown in Figure 2. Overall, we opted for background regions that are closest to the source, source-free, and overlapping in the XMM-Newton and NuSTAR coverage given we are performing a joint spectroscopic study of the same regions selected from both telescopes.
In the following we concentrate on the hard X-ray emission from W50-East, the main focus of this work, guided primarily by the NuSTAR imaging analysis. We divided the NuSTAR spatial coverage into the three sub-regions shown in Figure 2, the ‘Head’, ‘Cone’ and ‘Diffuse’. We also extracted a spectrum from a polygon (‘Full’) region to include all the above three sub-regions. Lastly, we also examine region ‘Nue1’, since it corresponds to the (significant) portion of the well studied ‘e1’ region bounded by the edge of NuSTAR’s FoV and significantly overlaps with the ‘Diffuse’ region. For each of these regions, we fitted the XMM-Newton spectra (0.5–10 keV) and the NUSTAR spectra (3–30 keV) both independently and jointly to an absorbed power-law model (const*tbabs*powerlaw in XSPEC). For the independent NuSTAR fits, we fixed the column density to the XMM-Newton value. All spectral results are presented in Table 2.
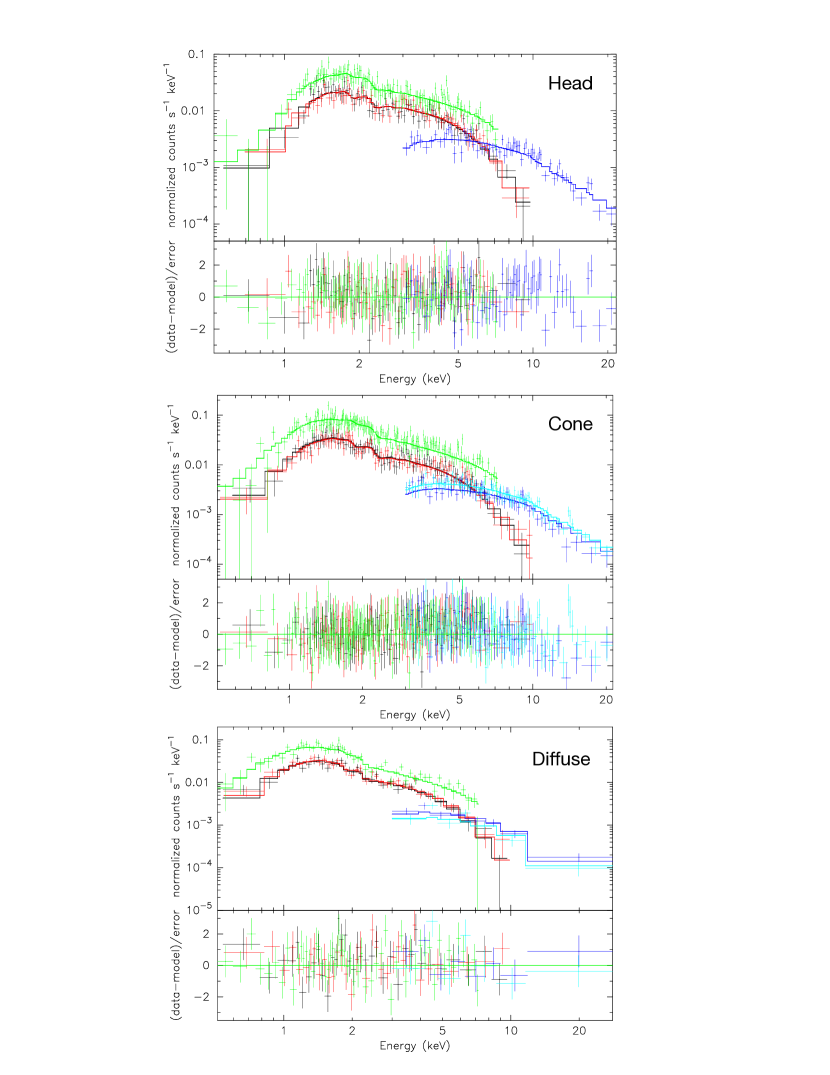
First, we find that varies significantly across the inner eastern lobe, from 1022 cm-2 in the ‘Head’ region, to 1022 cm-2 in the ‘Cone’ region, to 1022 cm-2 in the ‘Diffuse’ region. Going further east, the column density in the ‘lenticular’ and ‘e3-ring’ regions are comparable to that of the Diffuse region (at 0.7 1022 cm-2). The spectral parameters shown in Table 2 correspond to the column density, , frozen to its best fit value determined from the XMM-Newton fits. We find that all regions are adequately described by a power-law model with a photon index of 1.580.05, 1.760.04, and 1.770.06 (0.5–30 keV) for the ‘Head’, ‘Cone’ and ‘Diffuse’ regions, respectively. The corresponding spectra and fitted model are shown in Figure 7. When we allow to vary, the errorbars increase somewhat (as expected) but our results do not change (within error). These fits yield a photon index of 1.60.1, 1.860.08, and 1.810.13 (0.5–30 keV) for the ‘Head’, ‘Cone’ and ‘Diffuse’ regions, respectively. Taking into account the spectral results for the ‘lenticular’ region (Table 2), we conclude that there is a gradual spectral softening eastward from SS 433 with the hardest emission at the ‘Head’ region, the onset of X-ray emission in the eastern lobe.
The index for the ‘Head’ region is consistent between the two instruments (at 1.6), whereas for the other regions, NuSTAR gave a slightly steeper index than XMM-Newton. For the larger scale region ‘Full’ which encompasses the source emission across the NuSTAR field, the discrepancy is primarily caused by the mixture of multiple components with different spectral indices, as demonstrated by our spatially resolved spectroscopy. For the fainter ‘Cone’ and ‘Diffuse’ regions, we fitted a broken power-law model to test for any steepening in the NuSTAR hard band above 10 keV. We find that this model improves on the power-law model fit for the ‘Cone’ region, but not for the ‘Diffuse’ nor the ‘Head’ regions. For the ‘Cone’, we obtain = 1.64, = 2.10.1, and a break energy =5.3 keV (F-test probability of 1.110-10). This is likely attributed to mimicking the spectral evolution (steepening) across the wide ‘Cone’ region extending from the ‘Head’ towards the ‘lenticular’ region whose index steepens to 2.0.
Finally, we fitted the NuSTAR selected regions with a thermal bremsstrahlung model and measured temperatures of = 18.6 (15.6–22.7) keV, 10.4 (9.4–11.4) keV and 6.9 (6.0–8.0) keV for the ‘Head’, ‘Cone’ and ‘Diffuse’ regions, respectively. The unrealistically high temperatures, lack of emission lines, and no statistical improvement of these fits when compared to the power-law fits make us favour the power-law model over thermal models. This conclusion is in agreement with previous studies of the eastern lobe (e.g., Safi-Harb & Petre (1999) and references therein).
Further away from SS 433 towards the radio ear, the power-law photon index of the shocked bright regions (covered by XMM-Newton only) steepens to 2 (‘lenticular’ and ‘e3-ring’ regions), with soft thermal emission becoming evident towards these regions (see Table 2 and Fig. 3). The emission becomes dominated by a thermal component with 0.2 keV in the termination shock region (‘e3-ring’) (see also Brinkmann et al. (2007); Safi-Harb & Ögelman (1997)). For this region, the total 0.5–10 keV flux is 1.210-12 erg cm-2 s-1 (observed) and 1.410-11 erg cm-2 s-1 (unabsorbed). The thermal component constitutes approximately 46% (absorbed flux of 5.610-13 erg cm-2 s-1) and 93% (unabsorbed flux of 1.310-11 erg cm-2 s-1) of the total flux. The properties of the thermal X-ray emission are however poorly constrained given its low-surface brightness and require a deep and targeted XMM-Newton observation.
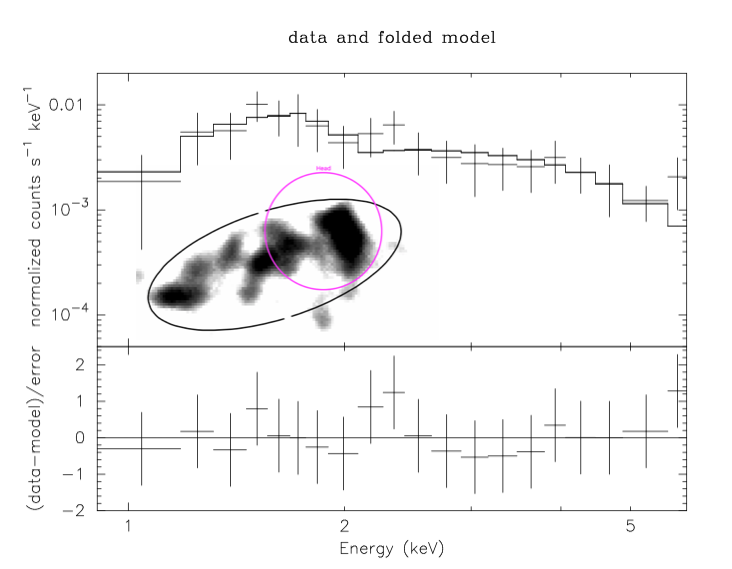
3.2.2 Chandra Spatially Resolved Spectroscopy
We extract an elliptical region (see Fig. 3 and Fig. 6) encompassing the ‘Head’ region on ACIS S1 for the source and a nearby region for the background subtraction. This source significantly overlaps with the ‘Head’ and ‘Cone’ regions and its emission is dominated by that of the ‘Head’ which was not well resolved with NuSTAR. We obtain 243 background-subtracted source counts and a spectrum best fitted with a power law model with = 1.61 1022 cm-2, = 1.48 (1 error range), and a flux of 5.710-13 ergs cm-2 s-1 (0.5–10 keV). Freezing the column density to 1.771022 cm-2, the value obtained from XMM-Newton (which is more sensitive to the soft X-ray band) for the ‘Head’ region, we find = 1.570.39 (90% CL), an index which is consistent with our joint spectroscopy (§3.2.1). We have also attempted different binning for the Chandra spectrum as well as fitting with the Cash statistic. We find a photon index that is consistent with the above-mentioned value, within error. For example, binning the spectrum with a minimum of 20 counts per bin, we obtain a photon index = 1.60.4 (90% CL) for =1.771022 cm-2. This confirms the unusually hard photon index obtained for the ‘Head’ region.
4 Discussion
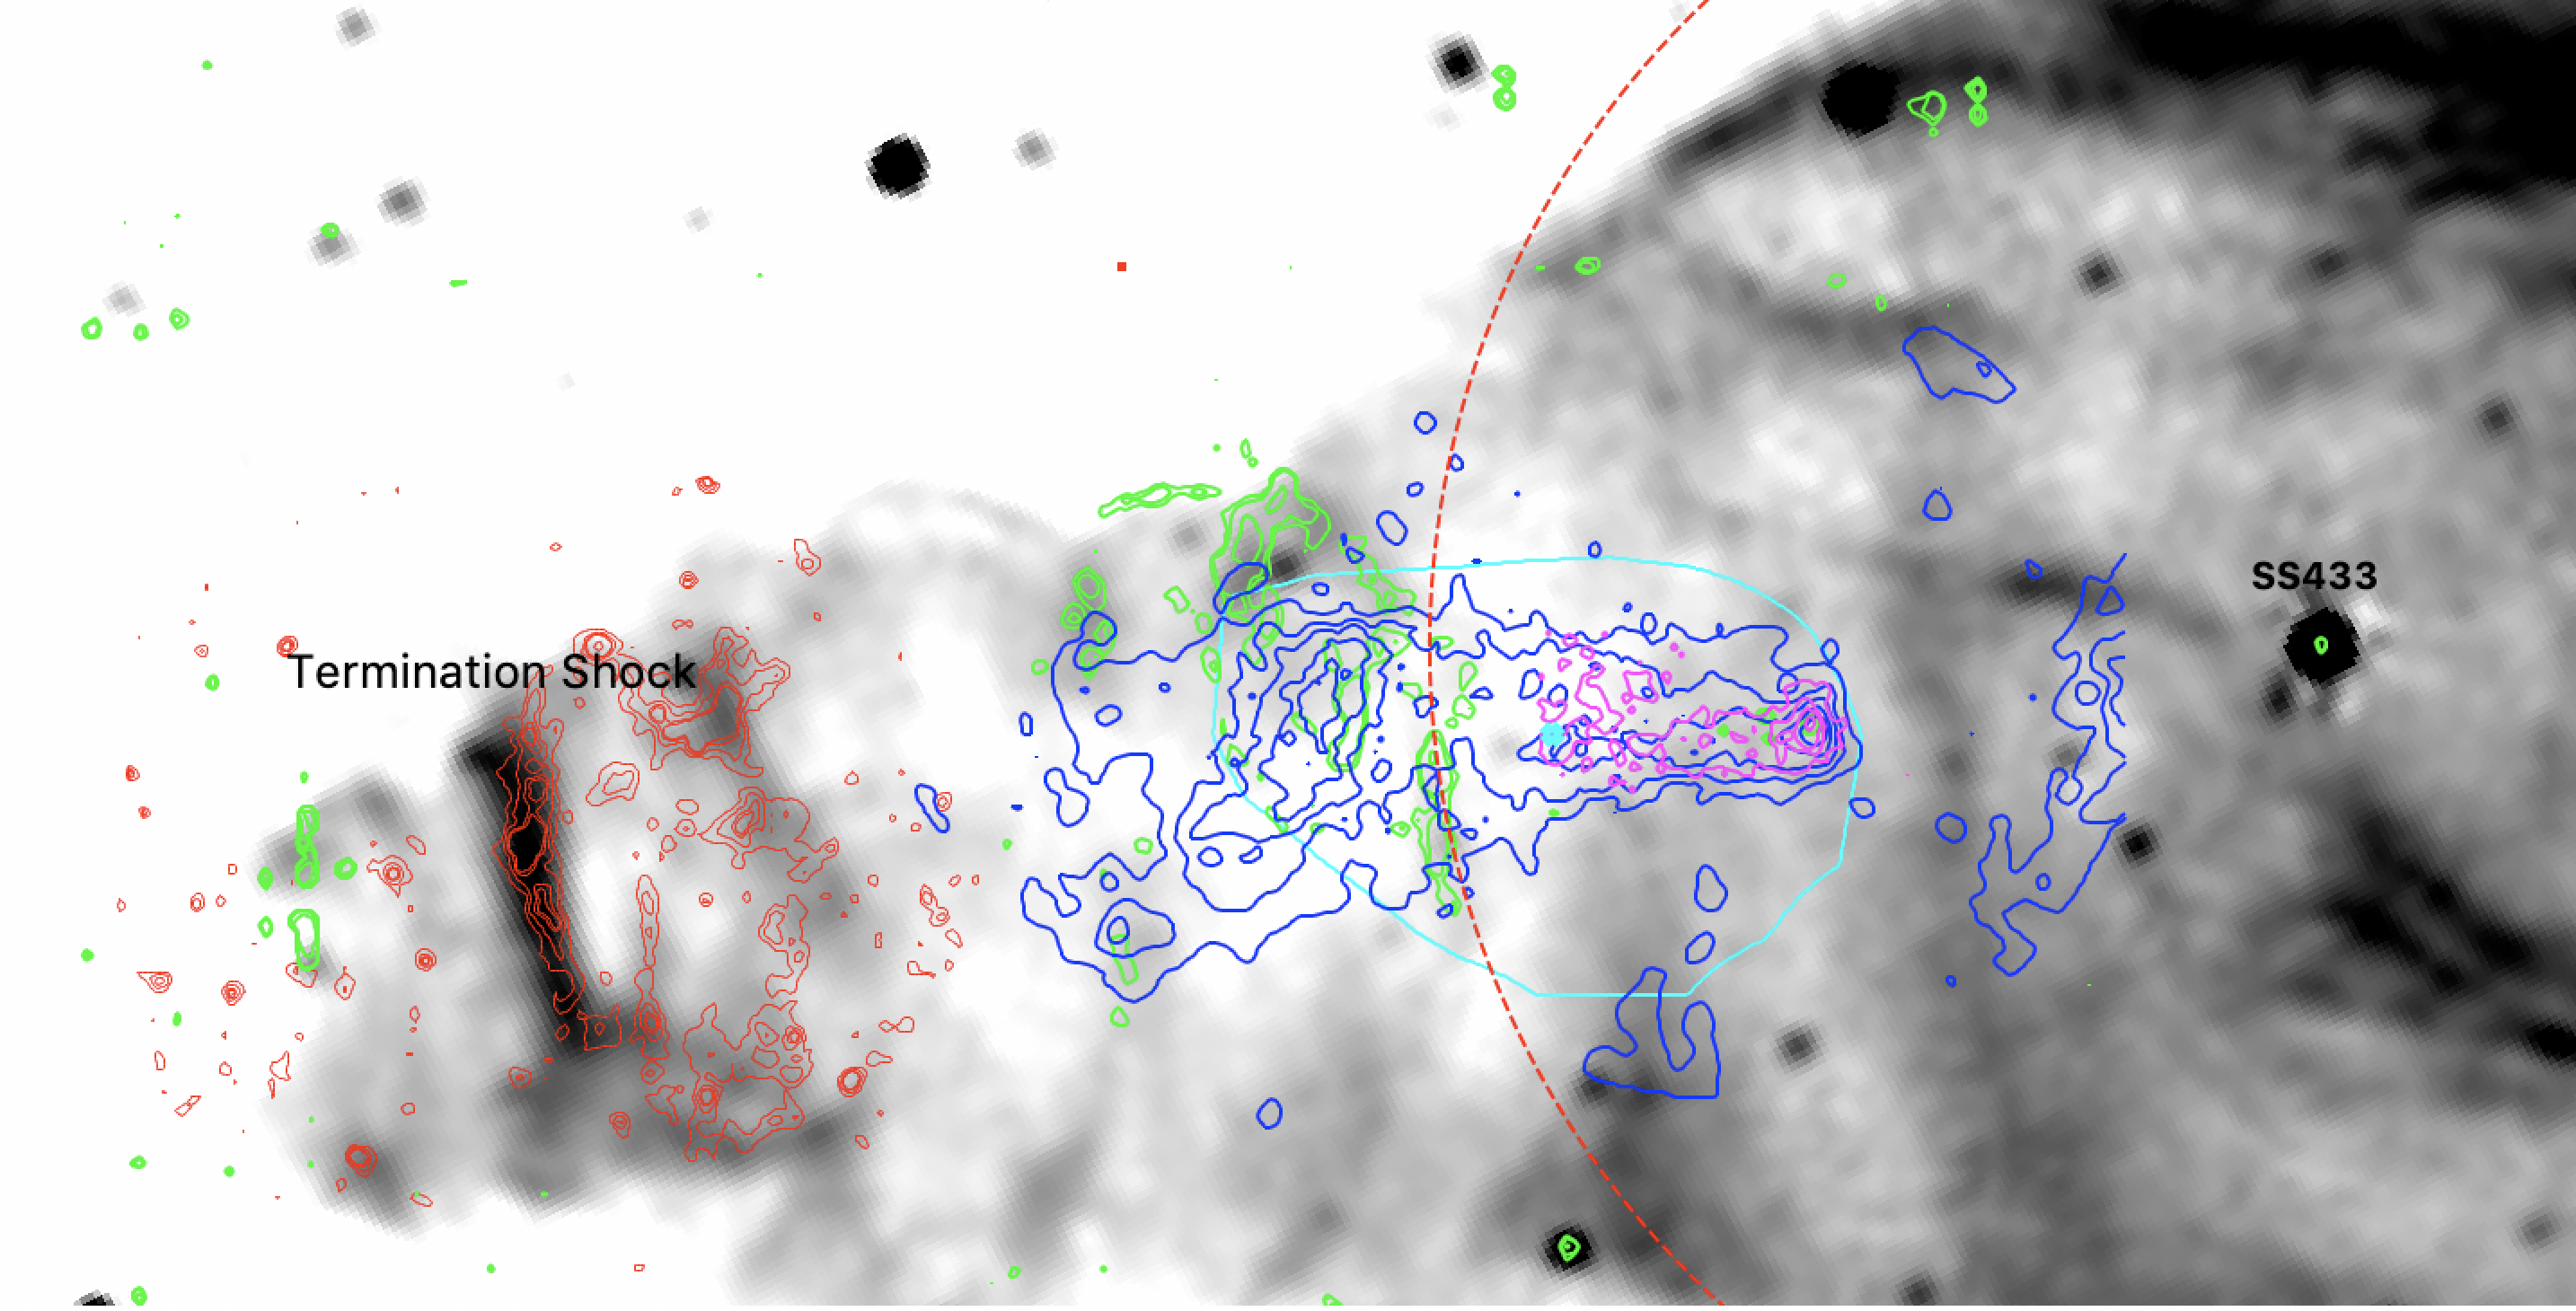
In Fig. 8, we show the multi-wavelength view of W50-east. The inner, hard, X-ray lobe is sitting within a radio ‘hole’ (or depression in radio emission), while the optical filaments partially overlap with the projection of the radio shell along the SS 433 jet axis. This multi-wavelength view and spatially resolved spectroscopic study supports the picture that the ‘head’ represents an acceleration zone and the onset of the eastern lobe X-ray emission; the jet thermalises first at its interaction with the SNR (‘lenticular’ region in ‘e2’ which is just beyond the intersection of the extrapolated radio shell and jet axis), then at its termination shock with the ISM (radio ‘ear’).
Our study allowed us to zoom in on a micro-version of a quasar (Fig. 8 and Fig. 1). In radio, W50 mimics FRII galaxies (with prominent lobes resulting from the interaction with the surroundings) but in X-rays, it mimics FRI galaxies dominated by emission from the jets close to the black hole. However, unlike FRIs, SS 433 is a super-Eddington source, accreting at a super-Eddington rate of 10-4 year-1 (via Roche-lobe overflow from a massive donor star that is likely an evolved supergiant). FRIs have much lower Eddington ratios, making SS433 the nearest example of jetted super-Eddington black hole (for a comprehensive review, see Fabrika (2004)). For W50, the jets’ large-scale extended emission peaks in X-rays (as opposed to radio) given the high Lorentz factor ( 107) of the synchrotron emitting electrons at tens of parsecs away from SS 433. Furthermore, while the nature of X-ray emission in AGN jets is being debated (synchrotron vs inverse Compton) and is more likely due to the synchrotron process in FRIs (Hardcastle et al., 2016), the non-thermal X-ray emission in W50 is most likely synchrotron emission. This is the case because generally, synchrotron X-ray emission has been detected in microquasar jets interacting with the ISM (see e.g., Corbel et al. (2002)). Furthermore, for the estimated magnetic field in the eastern lobe (see more below) and hard X-ray photon index, synchrotron emission should dominate the inverse Compton flux. We add that the non-thermal bremsstrahlung process can be also ruled out since the inverse Compton flux should dominate the non-thermal bremsstrahlung flux for the electron densities inferred in the lobe (see Safi-Harb & Petre (1999); Safi-Harb & Ögelman (1997)).
The SS 433/W50 system also bears resemblance to Ultra Luminous X-ray sources (ULX’s), a growing class of X-ray discovered compact objects believed to be associated with black holes (of debated mass) and accreting neutron stars. ULX’s are bright extragalactic point-like sources whose X-ray luminosity ( 1039 erg s-1) exceeds the Eddington limit for accretion into a stellar-mass black hole radiating isotropically (see Kaaret et al. (2017) for a recent review). Interestingly, SS 433 has been suggested to be the nearest Galactic ULX analog (Fabrika & Mescheryakov, 2001), where its radiation can be collimated by the geometry of a funnel and beamed by the motion of the source along the line-of-sight direction (see Fabrika (2004) and references therein). However, SS 433 is aligned edge-on (or viewed from the side) with respect to Earth (Begelman et al., 2006), and its core is mostly hidden from view since it is blocked by Compton-thick material present in the plane of the accretion disk. As a result, SS 433 does not manifest itself a a typical ULX (where the disk wind would be sufficiently optically thin to allow a copious amount of X-ray photons to reach us), nor even as a luminous X-ray binary.
Bubble-like large (100–500 pc scale) shock-ionized nebulae have been detected, primarily in the radio and optical wavelengths, around some ULX’s. Jets have been proposed to be responsible for inflating the observed bubbles (see e.g. Pakull et al. (2010)). A direct comparison with W50 would then allow us to revisit the question raised in the 1980’s (Begelman et al., 1980) on whether W50 can be similarly a bubble (or ‘beam-bag’) inflated solely by the SS 433 jets (see §5 in Safi-Harb & Ögelman (1997) for a discussion on the beam-bag scenario versus the favoured SNR+jets scenario later verified by numerical simulations (Goodall et al., 2011)). Two notable examples similar to SS 433 (in terms of the presence of powerful jets with a kinetic power exceeding 1039 erg s-1) are NGC7793–S26 located at a distance of 3.9 Mpc (Pakull et al., 2010; Soria et al., 2010) and Holmberg II X–1 located at a distance of 3.39 Mpc (Cseh et al., 2014, 2015). For S26, a 300 pc diameter jet-inflated-bubble in the galaxy NGC 7793, Chandra resolved two ‘hot spots’, in addition to the core, separated by a projected distance of 15′′ which translates to 290 pc. A non-thermal (power-law or broken power-law) spectrum has been ruled out for these X-ray emitting hot spots whose spectra are best fitted by a two-component thermal plasma model (0.26 keV and 0.96 keV). Based on their physical scale and X-ray spectrum, we infer that these regions could be the equivalent to the termination shock regions seen in the ‘ears’ of W50 (region ‘e3’ in Fig. 2, see also Fig. 8). The morphology (large radio cocoon and hot thermal X-ray spots) resembles W50, however the total energy content of the W50 bubble is two orders of magnitude lower than that of S26 (Pakull et al., 2010). For Holmberg II X-1, the X-ray observations (with Swift and Chandra) show steady, apparently hard spectra, however the X-ray emission is dominated by the emission from the core component and no extended X-ray emission or hot spots have been reported. Recent attempts to detect X-rays (using Chandra) from Holmberg IX X-1, another large (300 pc scale, distance of 3.8 Mpc) ULX bubble, failed to detect any extended X-ray emission down to a luminosity of 21036 erg s-1 (Sathyaprakash et al., 2019). Lastly, Chandra observations of the S10 optical nebula in NGC 300 revealed four discrete X-ray knots aligned in the plane of the sky over a length of 150 pc (Urquhart et al., 2019). Radio observations show an elongated radio nebula (170 pc 55 pc in size) with its major axis aligned with the axis connecting the Chandra sources. The X-ray emission from the X-ray knots is thermal (0.6 keV), and believed to arise from the interaction between the engine (microquasar candidate) and the ISM. These properties are overall strikingly similar to W50, although (unlike W50) there is no detection of non-thermal X-ray emission in NGC 300–S10.
Based on the previously summarized observations, we conclude that while W50 shares many properties with ULX-inflated bubbles, a sensitive and detailed X-ray study of extragalactic ULX bubbles is currently hampered by their large distances, making their X-ray detection and characterization dominated by the core component (black hole) and/or the relatively bright termination shock regions on the larger scale. The latter appear to be dominated by thermal X-ray emission and is poorly resolved given the large distances (Mpc) in comparison to Galactic distances (kpc). This again makes W50/SS 433 the most accessible ULX-bubble analog for zooming in into the outflows of these energetic sources (from close to the microquasar all the way to the termination shock) and studying their large-scale impact on their surroundings. Furthermore, while no non-thermal X-ray emission has been reported to date from the large-scale extragalactic ULX bubbles, deep and high-resolution observations in the hard (2 keV) X-ray band, with current and proposed future missions such as AXIS (Mushotzky et al., 2019), may reveal the equivalent of the non-thermal emission seen in W50’s inner lobes on tens of parsecs scales. This emission provides clues on the jet’s interaction with the ISM and the debated particle acceleration processes in play.
In this work, we have mapped the broadband X-ray emission of W50-East from SS 433 out to the radio ‘ear’, discovered that the hardest non-thermal X-ray emission is from the inner eastern lobe, and that its peak is resolved to the ‘Head’ region, 18′ east of SS 433 (29 pc @ kpc). This emission is characterized by a hard, and rather unusual, spectral index. A photon index of 1.5 implies a particle index of 2 (; =2+1 where =-1) and therefore an distribution of electrons. The classical Diffusive Shock Acceleration (DSA) theory predicts a spectrum steeper than our observed X-ray spectrum. This index is in fact more similar to what is observed in pulsar wind nebulae (PWNe) powered by the relativistic winds of neutron stars (Gotthelf, 2003; Kargaltsev & Pavlov, 2008) and in some extragalactic jets (Harris, 2003). X-ray knots in many AGN jets can also have a photon index 1.1–1.6 (Sambruna et al., 2004). Furthermore, such energetic electrons should be cooled, thus to have an type spectrum, one should have an extremely hard differential injection spectrum, harder than . A possible explanation within the DSA model could be that adiabatic losses dominate over synchrotron losses as suggested for blazars to explain their hard spectra (Lefa et al., 2011). Notably, the index here steepens to an (for 2) further out as the jet thermalises. Therefore it is possible that particles are accelerated in the ‘Head’ region with an spectrum. Inside the accelerator, the spectrum is not deformed (due to the adiabatic losses or energy-independent escape), but electrons, after they leave the source, suffer synchrotron losses which naturally can explain the steepening of the X-ray spectrum in the ‘Cone’ and ‘Diffuse’ regions. An alternative acceleration mechanism could be magnetic reconnection or stochastic acceleration which can produce a very hard (e.g. Maxwellian type) acceleration spectrum (Sironi & Spitkovsky, 2014; Lazarian et al., 2015) which after synchrotron cooling becomes (independent of the acceleration spectrum). We note that the column density is highest in the ‘Head’ region (see Section 3.2). This could be evidence of jet entrainment which would contribute to mixing and turbulence impacting the shock acceleration process, e.g. through internal shocks (Wykes et al., 2013).
To further explore the above scenario, let us consider the synchrotron emission properties of the ‘Head’ region which represents the innermost region in the eastern lobe characterized by the unusually hard photon index (of 1.58). Assuming equipartition between energy in the relativistic electrons and magnetic fields, a volume of 1.581057 cm-3, the observed X-ray luminosity of 1.11034 ergs s-1 (in the 0.3–30 keV range) yields, in the synchrotron emission interpretation, an equipartition magnetic field value B of 12G. This estimate should be considered a lower limit since the volume could be smaller, as suggested by the clumpy structures seen in the Chandra image. The energy required to accelerate the electrons to X-ray energies in the ‘Head’ is approximately 2.41044 ergs. This yields a radiative loss timescale of the order of 1 kyr. We note that this is comparable to the synchrotron loss timescale (of 250–1,400 yr) of 1–30 keV photons in a 12G magnetic field. Therefore we find that the loss timescale is much smaller than the age of the system of 30 kyr (Safi-Harb & Ögelman, 1997; Dubner et al., 1998; Goodall et al., 2011). This suggests the presence of freshly (kyr timescale) injected particles in the acceleration zone.
It is commonly believed that the SS 433 jets impact the W50 nebula out to the radio ears, with a significant fraction of the jets’ power going into kinetic motion or an unseen outflow. In particular, the X-ray luminosity in the eastern lobe (1035 erg s-1) is a very small fraction of the SS 433 jets’ power. The latter ranges from 3.21038 erg s-1 based on Chandra HETG data (Marshall et al., 2002) to 51039 erg s-1 based on XMM-Newton data (Brinkmann et al., 2005) to 1040 erg s-1 based on ASCA data (Kotani et al., 2006). Our study shows that the hard X-ray emission starts at 29 pc from SS 433 with a gap in X-ray emission between SS 433 and the ‘Head’. Interestingly, compact X-ray knots were observed in the arcsecond-scale X-ray jets emitted by SS 433; their rapid variability (by a factor of 1.5–2.0 and on time-scales of days to as short as hours) points to ‘pumping’ (from SS 433) or a sequence of shocks, revealing a fast, unseen outflow in the jet (Migliari et al., 2005). This outflow from SS 433 could provide the seed particles eventually accelerated at the onset ‘Head’ region of the eastern lobe. The jet travel time between SS 433 and the ‘Head’ is 370 yr assuming a distance of 29 pc and a constant velocity of 0.26c. However, it is expected that the jet outflow has significantly decelerated by the time it has travelled that far away from SS 433. The synchrotron loss timescale of 1.5 kyr (for a 1 keV photon in a magnetic field of the order of 12 G) is smaller than the travel time between the SS 433 jet and the ‘Head’ if the jet’s velocity is smaller than 0.065c (19,500 km s-1), a reasonable assumption. Therefore, it is likely that the hard X-ray emitting knots observed in the ‘Head’ region are associated with the arcsecond-scale jet outflow and that the seed particles are accelerated through some non-traditional acceleration mechanism (as described above) or recently re-accelerated along the jet propagation. This phenomenon is seen in extragalactic jets (Harris, 2003); at the acceleration site (where the X-rays are observed), the hard spectrum component of the synchrotron emission is expected to be visible only at the highest frequencies. This trend is also seen in PWNe where the onset of their X-ray emission corresponds to the pulsar wind termination shock (e.g., Kargaltsev & Pavlov (2008)) and where a hard spectral index is observed to steepen away from the engine.
The detection of hard X-ray emission up to energies of 30 keV implies electron energies, Ee, given by (Ee/10 TeV)0.5(B/1 mG)-1/2(Eγ/1 keV)1/2 (e.g., Koyama et al. (1995)). For an estimated field of 12G, the corresponding electron energies are 250 TeV. This supports the scenario where this unique microquasar represents an efficient site for particle acceleration up to 100’s of TeV energies. Detailed SED modelling (for leptonic versus hadronic emission models, see e.g. Sudoh et al. (2020)) and interpretation in the light of interaction between the SS 433 jet and the SNR shell will be the subject of future work which will make use of our spatially resolved X-ray spectroscopy across the eastern lobe, combined with upcoming additional TeV studies from HAWC, HESS and hopefully LHAASO.
5 Conclusions
We presented the first joint NuSTAR and XMM-Newton observation of the eastern lobe, as well as the first Chandra snapshot of its innermost region. Our results can be summarized as follows:
-
•
We have detected, resolved and characterized the hard X-ray emission from the eastern lobe of W50. The eastern jet starts at 18′ ( 29 pc at kpc) from SS 433 (the ‘Head’) and is knotty with an 1′ (1.6 pc) scale.
-
•
The emission from the ‘Head’ is characterized by a hard non-thermal X-ray spectrum with a photon index 1.6 (confirmed with NuSTAR, XMM-Newton and Chandra).
-
•
The photon index gradually steepens away from SS 433 to 1.8 in the ‘Cone’ and ‘Diffuse’ regions, 2 in the ‘lenticular’ and termination shock regions; with soft thermal X-ray emission (0.2 keV) dominating the termination shock region at the radio ‘ear’.
The hard X-ray knots mark the location of acceleration sites within the jet; the hard index challenges classical particle acceleration processes and suggests the need for an additional energizing of particles near the ‘Head’ region. Deep and high-resolution observations of all regions in W50 (underway or planned), combined with multi-wavelength SED modelling, will be the subject of future works aimed at completing our understanding of this unique system whose study is relevant to probing the outflows of many galactic and extragalactic sources, including PWNe, AGNs and ULX’s.
Facilities: NuSTAR, XMM-Newton, CXO
Software: HEAsoft (v6.28, HEASARC 2014), XMM-SAS (v.19.1.0, ESA XMM-Newton Science Analysis System 2020), CIAO (v4.12, Fruscione et al. (2006)), NuSTARDAS (v2.0.0, HEASARC-NuSTAR and Caltech-NuSTAR Data Analysis pages), SAOImage DS9 (Joye & Mandel (2003), Smithsonian Astrophysical Observatory 2000), XSPEC v12.11.1 (Arnaud (1996)).
Acknowledgments This research made use of NASA’s Astrophysics Data System (ADS) and of data and software provided by the High Energy Astrophysics Science Archive Research Center (HEASARC), which is a service of the Astrophysics Science Division at NASA/GSFC. This work made use of data from the NuSTAR mission, a project led by the California Institute of Technology, managed by the Jet Propulsion Laboratory, and funded by NASA. This work also made use of data obtained with XMM–Newton, a European Space Agency science mission with instruments and contributions directly funded by ESA Member States and NASA. We thank Panos Boumis for providing the optical image, Gloria Dubner for the radio image, and Brenda Dingus for her contribution to the original observing proposal. We acknowledge discussions with Dmitry Khangulyan, Takahiro Sudoh and Naomi Tsuji related to the upcoming modelling and planning future observations of the source. We are grateful to the anonymous referee for a constructive report and very helpful comments that helped improve the manuscript. S.S.H. acknowledges support from the Natural Sciences and Engineering Research Council of Canada (NSERC) through the Discovery Grants and Canada Research Chairs programs, and from the Canadian Space Agency. B.M.I. is supported by a University of Manitoba Graduate Fellowship. K.F. acknowledges support from the Wisconsin Alumni Research Foundation, from NASA through the Fermi Guest Investigator Program (NNH19ZDA001N-FERMI, NNH20ZDA001N-FERMI) and from National Science Foundation (PHY-2110821).
Appendix A Appendices: Additional Material
A.1 Background analysis – NuSTAR background simulations
In what follows, we detail the specifics for the NuSTAR background analysis given its complex nature and potential impact on the spectral results. A diffuse X-ray source such as the eastern lobe requires analyzing the NuSTAR background contamination carefully and optimizing the background extraction regions. In general, the NuSTAR background is composed of (1) focused (2-bounce) diffuse photons, (2) ghost-ray (1-bounce) photons from bright X-ray sources located within off-axis angles, and (3) stray-light (0-bounce) photons from X-ray sources within off-axis angles (Madsen et al., 2015). The nuskybgd software tool is not applicable since it does not take into account additional background contamination from the Galactic Ridge X-ray emission and ghost-rays from SS433. A more detailed investigation of the ghost-ray background analysis will be presented in our forthcoming paper on the western lobe where the background contamination is more severe due to its proximity to SS 433.
The off-source NuSTAR observation provides the most accurate stray-light background count rate maps since it was performed at a similar PA as the on-source observation (Mori et al., 2015). We compared the count rates from three source-free regions (b1, b2 and b3, as indicated in the NuSTAR image (Figure 9) in the FPMA and FPMB images to the corresponding regions in the off-source observation images. In the region to the west of the ‘Head’ (b1), the count rates for both modules are higher than those extracted from the off-source observation. Our NuSTAR imaging analysis in §3.1 revealed the ghost-ray contamination clearly in the spatial profiles produced in different energy bands. We also found that background spectra extracted from b1 and b2 showed a hint of Fe emission lines at 6–7 keV which are not expected from the non-thermal X-ray emission in the eastern lobe. We attributed the count rate discrepancy and Fe lines to ghost-ray background photons from SS 433. In the b3 region, we found a good agreement in the count rates between the on-source and off-source observations, suggesting that it’s not impacted by the ghost rays (as for b1 and b2) and that the stray-light background component is predominant.
We further investigated the level of background contamination using the off-source NuSTAR observations and NuSIM simulator. NuSIM is a Monte Carlo ray-tracing simulation tool designed for the NuSTAR mission (Zoglauer et al., 2011). While the off-source observations are used for estimating stray-light background count rates, NuSIM allows us to simulate ghost-ray events from SS 433. We simulated ghost-ray background events from SS 433 by inputting an X-ray flux of photons s-1 cm-2 (3–79 keV) which corresponds to the Swift-BAT X-ray flux averaged over days around the NuSTAR observation of the eastern lobe. We assumed a power-law model of as a typical X-ray spectrum of SS 433 (Marshall et al., 2002). We generated ghost-ray background events to reduce statistical errors and visualize their spatial distributions clearly. Then, we estimated the NuSTAR background count rates in the three source-free regions by adding the actual stray-light and simulated ghost-ray background count rates. We found that the observed and estimated background count rates in the three regions are consistent with each other within statistical errors and the Swift-BAT flux variation during the NuSTAR observation. In the b1 and b2 regions which are closer to SS 433, the ghost-ray component is more dominant accounting for % of the total background count rates. Therefore, we extracted background spectra from b1 for the ‘Head’ region and found consistent spectral fitting results with the XMM-Newton spectra in the 3–10 keV band (Table 2). The NuSIM simulation maps showed that the ghost-ray count rates decrease radially with the angular distance from SS 433. Beyond the b1 and b2 regions, the ghost-ray contribution is negligible as is also evident from the fact that the count rates in b3 match with those from the (stray-light dominating) off-source observations.
For the ‘Cone’ and ‘Diffuse’ regions where the ghost rays background should be minimal but the stray-light background component should be most significant, we attempted background spectra from the same detector regions (as the source extraction regions) in the off-source observation, and compared the spectral fitting using local, nearby source backgrounds. We do not find any significant difference and so we opted for the local background regions (shown in Figure 2) as for the XMM-Newton region selection, especially as this background removes also any contamination from the Galactic ridge X-ray emission. Finally for the larger ‘Full’ region, which encompasses all NuSTAR source regions, we selected an off-source background (shown as the dashed black polygon south-east of the source FoV) primarily because of the region’s large size and our limited choice for a local background. We believe that the apparent discrepancy between the XMM-Newton and NuSTAR spectral result for this region in particular (Table 2) is partly attributed to the impact of the NuSTAR background subtraction, but mostly because this region consists of regions characterized by different spectral components, as shown in §3.2.1.
| Satellite | Date | ObsID | PI | Pointing | Total Exposure |
|---|---|---|---|---|---|
| RA, Dec (J2000) | (ks) | ||||
| NuSTAR | 2019-12-01 | 40510002001 | Safi-Harb, S. | 19 13 11.0, +04 57 03 | 109,419 |
| 40510003001 | 19 13 47.1, +04 46 21 (background) | 32,358 | |||
| XMM-Newton | 2020-03-24 | 0840490101 | Safi-Harb, S. | 19 13 13.37, +04 57 29.8 | 69,100 |
| XMM-Newton | 2004-09-30 | 0075140401 | Brinkmann, W. | 19 14 12.01, +04 55 47.0 | 32,513 |
| XMM-Newton | 2004-10-04 | 0075140501 | Brinkmann, W. | 19 15 55.01, +04 51 20.0 | 31,314 |
| Chandra | 2000-06-27 | 659 | Fender, R. | 19 11 49.50, +04 58 58.0 | 9,790 |
| Parameter | XMM 0.5 – 10 keV | NuSTAR 3 – 30 keV | Joint 0.5 – 30 keVc | |
|---|---|---|---|---|
| Head = 1.771022 cm-2 | Photon Index | 1.6 0.1 | ||
| (abs.) | ||||
| (unabs.) | 3.0 0.1 | |||
| (DoF) | ||||
| Cone = 1.181022 cm-2 | Photon Index | |||
| (abs.) | ||||
| (unabs.) | ||||
| (DoF) | ||||
| Diffuse = 0.761022 cm-2 | Photon Index | |||
| (abs.) | ||||
| (unabs.) | ||||
| (DoF) | ||||
| Full = 1.031022 cm-2 | Photon Index | |||
| (abs.) | 5.60 0.14 | |||
| (unabs.) | 13.4 0.2 | |||
| (DoF) | ||||
| Nue1 = 0.781022 cm-2 | Photon Index | |||
| (abs.) | ||||
| (unabs.) | ||||
| (DoF) | ||||
| Lenticulard = 0.711022 cm-2 | Photon Index | – | – | |
| (abs.) | – | – | ||
| (unabs.) | – | – | ||
| (DoF) | – | – | ||
| e3-ring = 0.791022 cm-2 | Photon Index | – | – | |
| (keV) | 0.2 0.1 | – | – | |
| (DoF) | 1.14 (797) | – | – |
aAbsorbed flux in erg cm-2 s-1.
bUnabsorbed flux in erg cm-2 s-1.
c For the joint 0.5–30 keV flux, we list the combined 0.5–10 keV (XMM) and 10-30 keV (NuSTAR) fluxes with the model parameters frozen to their best values from the joint fit.
d The larger ‘e2’ region encompassing the ‘lenticular’ region (see Figure 2) shows evidence of soft thermal X-ray emission with 0.2 keV, however with the thermal parameters poorly constrained.
References
- Abeysekara et al. (2018) Abeysekara, A. U., Albert, A., Alfaro, R., et al. 2018, Nature, 562, 82, doi: 10.1038/s41586-018-0565-5
- Aharonian et al. (2005) Aharonian, F., Akhperjanian, A., Beilicke, M., et al. 2005, A&A, 439, 635, doi: 10.1051/0004-6361:20042248
- Arnaud (1996) Arnaud, K. A. 1996, in Astronomical Society of the Pacific Conference Series, Vol. 101, Astronomical Data Analysis Software and Systems V, ed. G. H. Jacoby & J. Barnes, 17
- Begelman et al. (2006) Begelman, M. C., King, A. R., & Pringle, J. E. 2006, MNRAS, 370, 399, doi: 10.1111/j.1365-2966.2006.10469.x
- Begelman et al. (1980) Begelman, M. C., Sarazin, C. L., Hatchett, S. P., McKee, C. F., & Arons, J. 1980, ApJ, 238, 722, doi: 10.1086/158029
- Blundell & Bowler (2004) Blundell, K. M., & Bowler, M. G. 2004, ApJ, 616, L159, doi: 10.1086/426542
- Boumis et al. (2007) Boumis, P., Meaburn, J., Alikakos, J., et al. 2007, MNRAS, 381, 308, doi: 10.1111/j.1365-2966.2007.12276.x
- Brinkmann et al. (2005) Brinkmann, W., Kotani, T., & Kawai, N. 2005, A&A, 431, 575, doi: 10.1051/0004-6361:20041768
- Brinkmann et al. (2007) Brinkmann, W., Pratt, G. W., Rohr, S., Kawai, N., & Burwitz, V. 2007, A&A, 463, 611, doi: 10.1051/0004-6361:20065570
- Corbel et al. (2002) Corbel, S., Fender, R. P., Tzioumis, A. K., et al. 2002, Science, 298, 196, doi: 10.1126/science.1075857
- Cseh et al. (2014) Cseh, D., Kaaret, P., Corbel, S., et al. 2014, MNRAS, 439, L1, doi: 10.1093/mnrasl/slt166
- Cseh et al. (2015) Cseh, D., Miller-Jones, J. C. A., Jonker, P. G., et al. 2015, MNRAS, 452, 24, doi: 10.1093/mnras/stv1308
- Dubner et al. (1998) Dubner, G. M., Holdaway, M., Goss, W. M., & Mirabel, I. F. 1998, AJ, 116, 1842, doi: 10.1086/300537
- Elston & Baum (1987) Elston, R., & Baum, S. 1987, AJ, 94, 1633, doi: 10.1086/114594
- Fabrika (2004) Fabrika, S. 2004, Astrophys. Space Phys. Res., 12, 1. https://arxiv.org/abs/astro-ph/0603390
- Fabrika & Mescheryakov (2001) Fabrika, S., & Mescheryakov, A. 2001, in Galaxies and their Constituents at the Highest Angular Resolutions, ed. R. T. Schilizzi, Vol. 205, 268. https://arxiv.org/abs/astro-ph/0103070
- Fang et al. (2020) Fang, K., Charles, E., & Blandford, R. D. 2020, ApJ, 889, L5, doi: 10.3847/2041-8213/ab62b8
- Farnes et al. (2017) Farnes, J. S., Gaensler, B. M., Purcell, C., et al. 2017, MNRAS, 467, 4777, doi: 10.1093/mnras/stx338
- Fruscione et al. (2006) Fruscione, A., McDowell, J. C., Allen, G. E., et al. 2006, in Society of Photo-Optical Instrumentation Engineers (SPIE) Conference Series, Vol. 6270, Society of Photo-Optical Instrumentation Engineers (SPIE) Conference Series, ed. D. R. Silva & R. E. Doxsey, 62701V, doi: 10.1117/12.671760
- Goodall et al. (2011) Goodall, P. T., Alouani-Bibi, F., & Blundell, K. M. 2011, MNRAS, 414, 2838, doi: 10.1111/j.1365-2966.2011.18388.x
- Gotthelf (2003) Gotthelf, E. V. 2003, ApJ, 591, 361, doi: 10.1086/375124
- Hardcastle et al. (2016) Hardcastle, M. J., Lenc, E., Birkinshaw, M., et al. 2016, MNRAS, 455, 3526, doi: 10.1093/mnras/stv2553
- Harris (2003) Harris, D. E. 2003, in Astronomical Society of the Pacific Conference Series, Vol. 300, Radio Astronomy at the Fringe, ed. J. A. Zensus, M. H. Cohen, & E. Ros, 151. https://arxiv.org/abs/astro-ph/0302097
- Harrison et al. (2013) Harrison, F. A., Craig, W. W., Christensen, F. E., et al. 2013, ApJ, 770, 103, doi: 10.1088/0004-637X/770/2/103
- Joye & Mandel (2003) Joye, W. A., & Mandel, E. 2003, in Astronomical Society of the Pacific Conference Series, Vol. 295, Astronomical Data Analysis Software and Systems XII, ed. H. E. Payne, R. I. Jedrzejewski, & R. N. Hook, 489
- Kaaret et al. (2017) Kaaret, P., Feng, H., & Roberts, T. P. 2017, ARA&A, 55, 303, doi: 10.1146/annurev-astro-091916-055259
- Kar & VERITAS Collaboration (2017) Kar, P., & VERITAS Collaboration. 2017, in International Cosmic Ray Conference, Vol. 301, 35th International Cosmic Ray Conference (ICRC2017), 713. https://arxiv.org/abs/1708.04967
- Kargaltsev & Pavlov (2008) Kargaltsev, O., & Pavlov, G. G. 2008, in American Institute of Physics Conference Series, Vol. 983, 40 Years of Pulsars: Millisecond Pulsars, Magnetars and More, ed. C. Bassa, Z. Wang, A. Cumming, & V. M. Kaspi, 171–185, doi: 10.1063/1.2900138
- Kotani et al. (2006) Kotani, T., Trushkin, S. A., Valiullin, R., et al. 2006, ApJ, 637, 486, doi: 10.1086/498387
- Koyama et al. (1995) Koyama, K., Petre, R., Gotthelf, E. V., et al. 1995, Nature, 378, 255, doi: 10.1038/378255a0
- Lazarian et al. (2015) Lazarian, A., Eyink, G. L., Vishniac, E. T., & Kowal, G. 2015, in Astrophysics and Space Science Library, Vol. 407, Magnetic Fields in Diffuse Media, ed. A. Lazarian, E. M. de Gouveia Dal Pino, & C. Melioli, 311, doi: 10.1007/978-3-662-44625-6_12
- Lefa et al. (2011) Lefa, E., Rieger, F. M., & Aharonian, F. 2011, ApJ, 740, 64, doi: 10.1088/0004-637X/740/2/64
- Madsen et al. (2015) Madsen, K. K., Harrison, F. A., Markwardt, C. B., et al. 2015, ApJS, 220, 8, doi: 10.1088/0067-0049/220/1/8
- MAGIC Collaboration et al. (2018) MAGIC Collaboration, Ahnen, M. L., Ansoldi, S., et al. 2018, A&A, 612, A14, doi: 10.1051/0004-6361/201731169
- Margon (1984) Margon, B. 1984, ARA&A, 22, 507, doi: 10.1146/annurev.aa.22.090184.002451
- Marshall et al. (2002) Marshall, H. L., Canizares, C. R., & Schulz, N. S. 2002, ApJ, 564, 941, doi: 10.1086/324398
- Migliari et al. (2002) Migliari, S., Fender, R., & Méndez, M. 2002, Science, 297, 1673, doi: 10.1126/science.1073660
- Migliari et al. (2005) Migliari, S., Fender, R. P., Blundell, K. M., Méndez, M., & van der Klis, M. 2005, MNRAS, 358, 860, doi: 10.1111/j.1365-2966.2005.08791.x
- Moldowan et al. (2005) Moldowan, A., Safi-Harb, S., Fuchs, Y., & Dubner, G. 2005, Advances in Space Research, 35, 1062, doi: 10.1016/j.asr.2005.01.086
- Mori et al. (2015) Mori, K., Hailey, C. J., Krivonos, R., et al. 2015, ApJ, 814, 94, doi: 10.1088/0004-637X/814/2/94
- Mushotzky et al. (2019) Mushotzky, R., Aird, J., Barger, A. J., et al. 2019, in Bulletin of the American Astronomical Society, Vol. 51, 107. https://arxiv.org/abs/1903.04083
- Nynka et al. (2014) Nynka, M., Hailey, C. J., Reynolds, S. P., et al. 2014, ApJ, 789, 72, doi: 10.1088/0004-637X/789/1/72
- Pakull et al. (2010) Pakull, M. W., Soria, R., & Motch, C. 2010, Nature, 466, 209, doi: 10.1038/nature09168
- Safi-Harb & Ögelman (1997) Safi-Harb, S., & Ögelman, H. 1997, ApJ, 483, 868, doi: 10.1086/304274
- Safi-Harb & Petre (1999) Safi-Harb, S., & Petre, R. 1999, ApJ, 512, 784, doi: 10.1086/306803
- Sambruna et al. (2004) Sambruna, R. M., Gambill, J. K., Maraschi, L., et al. 2004, ApJ, 608, 698, doi: 10.1086/383124
- Sathyaprakash et al. (2019) Sathyaprakash, R., Roberts, T. P., & Siwek, M. M. 2019, MNRAS, 488, 4614, doi: 10.1093/mnras/stz2022
- Sironi & Spitkovsky (2014) Sironi, L., & Spitkovsky, A. 2014, ApJ, 783, L21, doi: 10.1088/2041-8205/783/1/L21
- Soria et al. (2010) Soria, R., Pakull, M. W., Broderick, J. W., Corbel, S., & Motch, C. 2010, MNRAS, 409, 541, doi: 10.1111/j.1365-2966.2010.17360.x
- Strüder et al. (2001) Strüder, L., Briel, U., Dennerl, K., et al. 2001, A&A, 365, L18, doi: 10.1051/0004-6361:20000066
- Sudoh et al. (2020) Sudoh, T., Inoue, Y., & Khangulyan, D. 2020, ApJ, 889, 146, doi: 10.3847/1538-4357/ab6442
- Turner et al. (2001) Turner, M. J. L., Abbey, A., Arnaud, M., et al. 2001, A&A, 365, L27, doi: 10.1051/0004-6361:20000087
- Urquhart et al. (2019) Urquhart, R., Soria, R., Pakull, M. W., et al. 2019, MNRAS, 482, 2389, doi: 10.1093/mnras/sty2771
- van den Bergh (1980) van den Bergh, S. 1980, ApJ, 236, L23, doi: 10.1086/183190
- Velusamy & Kundu (1974) Velusamy, T., & Kundu, M. R. 1974, A&A, 32, 375
- Wilms et al. (2000) Wilms, J., Allen, A., & McCray, R. 2000, ApJ, 542, 914, doi: 10.1086/317016
- Wykes et al. (2013) Wykes, S., Croston, J. H., Hardcastle, M. J., et al. 2013, A&A, 558, A19, doi: 10.1051/0004-6361/201321622
- Yamauchi et al. (1994) Yamauchi, S., Kawai, N., & Aoki, T. 1994, PASJ, 46, L109
- Zoglauer et al. (2011) Zoglauer, A., Kruse-Madsen, K., Kitaguchi, T., et al. 2011, in AAS/High Energy Astrophysics Division, Vol. 12, AAS/High Energy Astrophysics Division #12, 43.07