VL-CheckList: Evaluating Pre-trained Vision-Language Models with Objects, Attributes and Relations
Abstract
Vision-Language Pretraining (VLP) models have recently successfully facilitated many cross-modal downstream tasks. Most existing works evaluated their systems by comparing the fine-tuned downstream task performance. However, only average downstream task accuracy provides little information about the pros and cons of each VLP method, let alone provides insights on how the community can improve the systems in the future. Inspired by the CheckList Ribeiro et al. (2020) for testing natural language processing, we exploit VL-CheckList, a novel framework to understand the capabilities of VLP models. The proposed method divides the image-texting ability of a VLP model into three categories: objects, attributes, and relations, and uses a novel taxonomy to further break down these three aspects. We conduct comprehensive studies to analyze seven recently popular VLP models via the proposed framework. Results confirm the effectiveness of the proposed method by revealing fine-grained differences among the compared models that were not visible from downstream task-only evaluation. Further results show promising research direction in building better VLP models. Our data and code are available at https://github.com/om-ai-lab/VL-CheckList .
1 Introduction

Vision-Language Pretraining (VLP) is a fundamental task for multimodal machine learning research. Recently, VLP has rapidly progressed Li et al. (2020); Radford et al. (2021); Li et al. (2021); Kim, Son, and Kim (2021), thanks to the emergence of multimodal transformers Vaswani et al. (2017) and the availability of large paired image-text corpora Sharma et al. (2018); Changpinyo et al. (2021). Many proposed VLP models have helped to achieve the state-of-the-art performance of a variety of downstream multimodal tasks, ranging from visual QA Lu et al. (2019), multimodal retrieval Lu, Zhao, and Lee (2021) to visual grounding Kamath et al. (2021) and many others. On the other hand, the current defacto method to evaluate a VLP model is by comparing its fine-tuned downstream tasks performance. However, benchmark VLP models solely based on a group of downstream tasks have a number of limitations:
(1) Poor Interpretability: a downstream task is complex and depends on many intertwined capabilities; thus, it only provides a black box score and is difficult to decipher. For example, it is unclear how to improve a VLP model that excels at Visual QA, but performs poorly in image retrieval. (2) Incomparable Results: different works may choose different tasks for evaluation, making it hard to compare. This is due to some VLP models are not compatible with certain tasks, such as CLIP Radford et al. (2021) cannot be fine-tuned for visual QA directly. (3) Bias in Data: downstream data distribution is not comprehensive, such that real-world performance may be overestimated. Also, it is unknown if a model is robust against input noise, e.g., replacing a verb by its synonymy.
To address the above limitations, this paper introduces VL-CheckList, an explainable framework that comprehensively evaluates VLP models, facilitates deeper understanding and inspires new ideas for improvement. The core principles of VL-CheckList are: (1) evaluate a VLP model’s fundamental capabilities instead of performance on applications (2) disentangle capabilities into relatively independent variables that are easier to analyze. Specifically, we choose Image-Text-Matching (ITM) as the primary evaluation target since it is perhaps the most effective pretraining objective that appears in all VLP methods Li et al. (2019a, 2020); Radford et al. (2021); Li et al. (2021). We then propose a taxonomy that divides the capabilities of VLP systems into three categories: object, attribute and relation. Each aspect is further divided into more fine-grained variables, e.g. attribute is composed of color, material, size, etc. Then, a linguistic-aware negative sampling strategy is proposed to create ”hard negative” that challenges a VLP model’s discriminative power against minor changes in the input space. Lastly, VL-CheckList is implemented as a toolbox that is easy for everyone to plug into their evaluation pipeline.
The proposed method is validated by analyzing 7 popular VLP models, including dual-encoder models CLIP Radford et al. (2021), region-based VLP models, e.g. OSCAR Li et al. (2020) and end-to-end VLP systems, e.g. ViLT Kim, Son, and Kim (2021). Four datasets: VG Krishna et al. (2016), SWIG Pratt et al. (2020), VAW Pham et al. (2021), and HAKE Li et al. (2019b) are adopted to generate capability-specific evaluation test set. Experiment results reveal several interesting insights about these models that are difficult to obtain from down-stream task scores. In short, the contributions of this work are four folds:
-
•
We present VL-CheckList, a novel explainable framework that generates fine-grained and disentangled evaluation reports about VLP models.
-
•
The proposed method profiles VLP models by testing the ability to understand an object, attribute, and relations between a text prompt and a given image.
-
•
Experiment results that show the superiority of the proposed framework by providing several promising insights on seven popular VLP systems.
-
•
Open-source package of VL-CheckList that is easy to be used by the community.
2 Related Work
Two lines of research have closely related to this work:
Machine Learning Evaluation Tools: Machine learning (ML) models are often tested on benchmark datasets Rajpurkar et al. (2016); Bowman et al. (2015); Wang et al. (2018). However, without a comprehensive analysis, it is difficult to understand the strengths and weaknesses of a model. Recent studies show even the state-of-the-art systems may still be insufficient in real-world applications Ribeiro et al. (2020). Thus, researchers have attempted to evaluate ML models with more fine-grained details.
One of the popular tools for the qualitative analysis of natural language processing (NLP) is CheckList Ribeiro et al. (2020). It evaluates general linguistic capabilities and shows weaknesses in several state-of-the-art NLP models. Dynabench Kiela et al. (2021) was proposed to generate dynamic benchmark datasets. It overcomes the problem that the existing benchmark fails to cover simple fundamental linguistic challenges. In computer vision, the Vision CheckList was proposed to help system designers to understand model capabilities Du et al. (2022). They offered a set of transformation operations to generate diverse test samples of different test types, such as rotation, replacing image patches, blur, and shuffle. TIDE Bolya et al. (2020) is a tool to analyze the errors of object detection. It defines critical error types and shows a comprehensive analysis.
Analysis of VLP Models: Prior work has also attempted to gain a deeper understanding of VLP models. Hendricks et al. (2021) showed the influence of multimodal representations based on three variables: datasets, the attention mechanism, and objective function. They found that 1) the qualify of the image captions is crucial for multi-modal training 2) having multi-modal attention with a smaller model is better than deep models without multi-modal attention 3) the image loss (masked region modeling) is not very critical for the performance. Hendricks and Nematzadeh (2021) investigated the capability of the multi-modal transformers to understand verbs. They observed that understanding verb is harder than objects and subjects. Dou et al. (2022) conducted the empirical analysis on each component of a VLP model: vision encoder, text encoder, fusion, objective, and model architecture. They reported the experiment results in different parts to provide a helpful recipe for obtaining better VLP training.
This paper differs from the prior art by being the first work (to the best of our knowledge) that analyzes VLP models from three angles: object, attribute, and relations, and provides a large-scale study that tests seven latest models on four corpora.
3 VL-CheckList
An intuitive approach to evaluate multi-modal systems is to check if a model correctly predicts alignment between different modalities. We choose image-text matching (ITM) to check the alignment between vision and language for the following reasons. Specifically, ITM is defined as the function that outputs the probability of an image is matched to a sentence . First, the ITM loss is often universal in all VLP models Li et al. (2020), so we can compare directly without any modification of the models. Second, the ITM is also model agnostic and applies to all fusion architectures. Thus, we exploit the ITM to fairly compare the VLP models without finetuning them on downstream tasks.
In short, the overall pipeline of VL-CheckList is described as the following (Figure 1)
-
1.
We transform image-text paired datasets by categorizing samples into three aspects: Object, Attribute, and Relation.
-
2.
The paired text for each image is rewritten to generate negative samples for each aspect.
-
3.
We use the ITM head of a VLP model to distinguish between the positive and the negative text is given an image.
-
4.
Generate a comprehensive analysis report about the models for each aspect.
3.1 Taxonomy of VL-CheckList
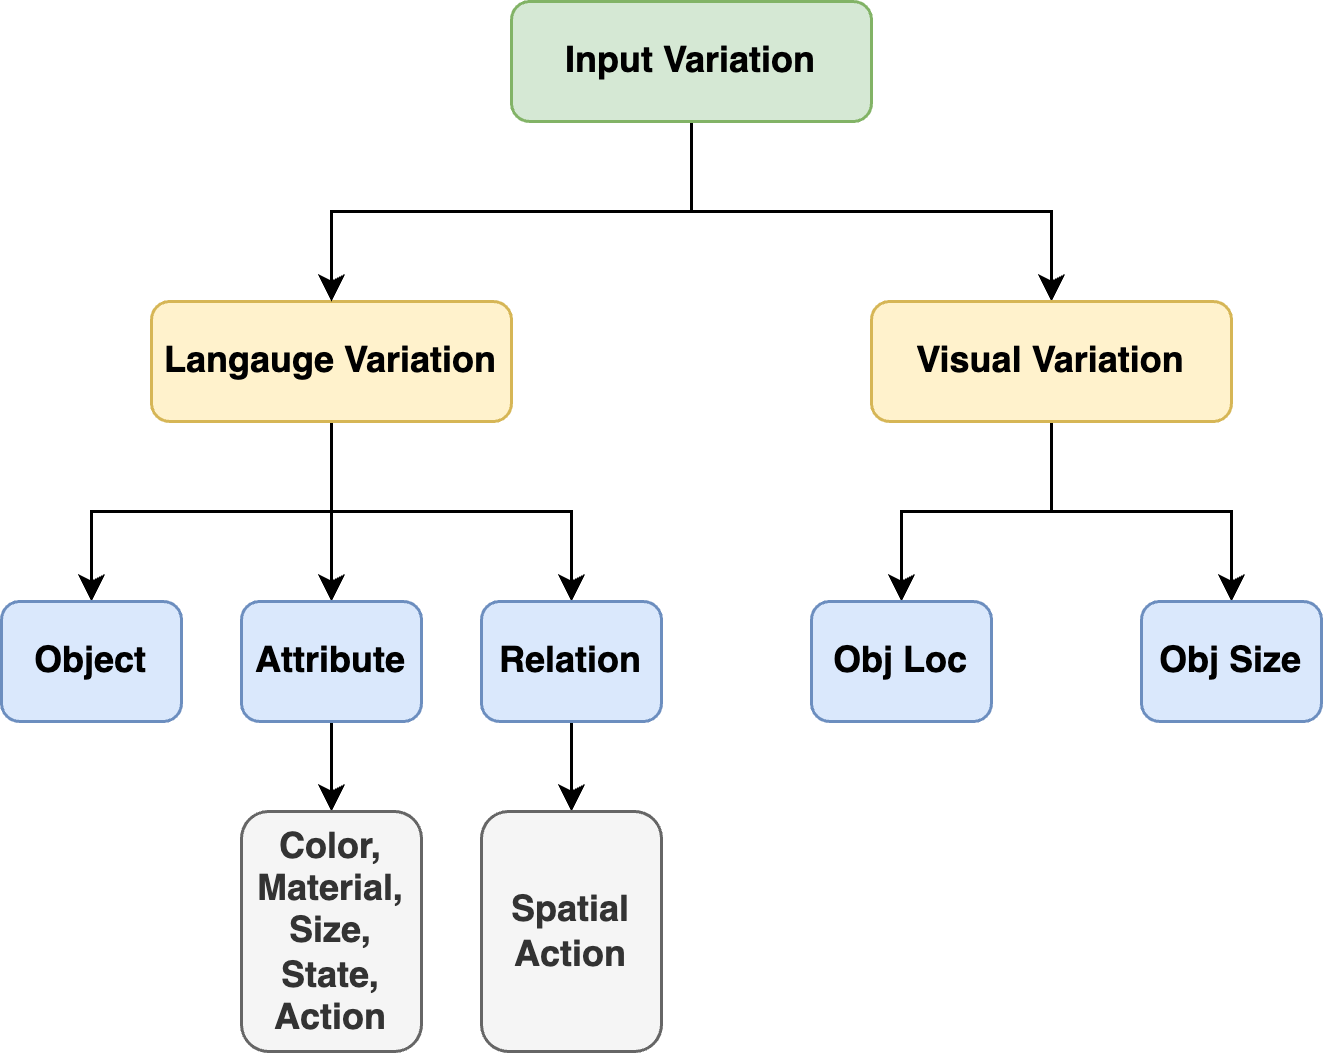
The evaluation types are often selected based on common mistakes or frequent usage. Based on the common issues in VLP models, the proposed framework places the three input properties (object, attribute, and relation) as the top layer of the evaluation taxonomy.
Object: A robust VLP model is supposed to recognize whether or not the objects mentioned in a text exist in the image. Therefore, if we replace objects in the correct text with some other random noun phrases, a VLP model should give it a lower ITM score than the original sentence. Furthermore, a robust VLP model should recognize objects’ existence, regardless of their location and sizes. Thus, we further evaluate the robustness Object ITM by testing location invariance (e.g, center, middle, and margin) and size invariance (e.g., small, large, medium), specifically:
loc(x, y)=
where, is the half-length of the diagonal of the full image . and is the distance between its central point and the central point of the full image.
To get the size of an object, we use the object area information (i.e., the bounding box of height multiplies the width).
size(x)=
where, , denotes small size and is the medium size. We set in this paper.
Attribute: Determining specific attributes for any object is very challenging. A strong VLP ITM head should assign a lower score if the correct attribute in the text is replaced. The attribute generally contains color, material, size, state, and action.
-
•
Size: replace the size expression like small, big, and medium with another (e.g., There is a big apple vs. there is a small apple)
-
•
Material: replace a material word in the sentence (e.g., a metal box vs. a wood box)
-
•
State: replace the state expression, such as cleanliness and newness (e.g., a man with dry hair vs. a man with wet hair).
-
•
Action: replace the action-related word in the text (e.g., a standing person vs. a sitting person).
-
•
Color: replace the color word in the text (e.g., A red apple is on the table vs. A green apple is on the table)
Relation: Relation cares about the interaction between two objects. It covers replacing the predicate in a triple (e.g., subject, predicate, object), where the subject and object are both objects in the image. A strong VLP ITM head should assign a higher score to text matching the pair-wise object interaction. Further, we divide prediction into spatial and action. If a predicate is one of the spatial prepositions (e.g., in, on, at, etc.), it is sub-categorized as ’spatial’; otherwise, it is labeled ’action’.
-
•
Spatial: If a model can predict spatial relation between two objects (e.g, <cat, on, table>vs. <cat, under, table>).
-
•
Action: If a model can predict other relation than a spatial preposition, usually action verbs like run, jump, kick, eat, break, cry, or smile (e.g., <cat, catch, fish>vs. <cat, eat, fish>).
| Name | Size | Adopt to |
|---|---|---|
| VG | 108K | Objects, Attribute, Relation |
| VAW | 72K | Attribute |
| HAKE | 104K | Objects, Relation |
| SWiG | 126K | Objects, Relation |
3.2 Negative sampling generation
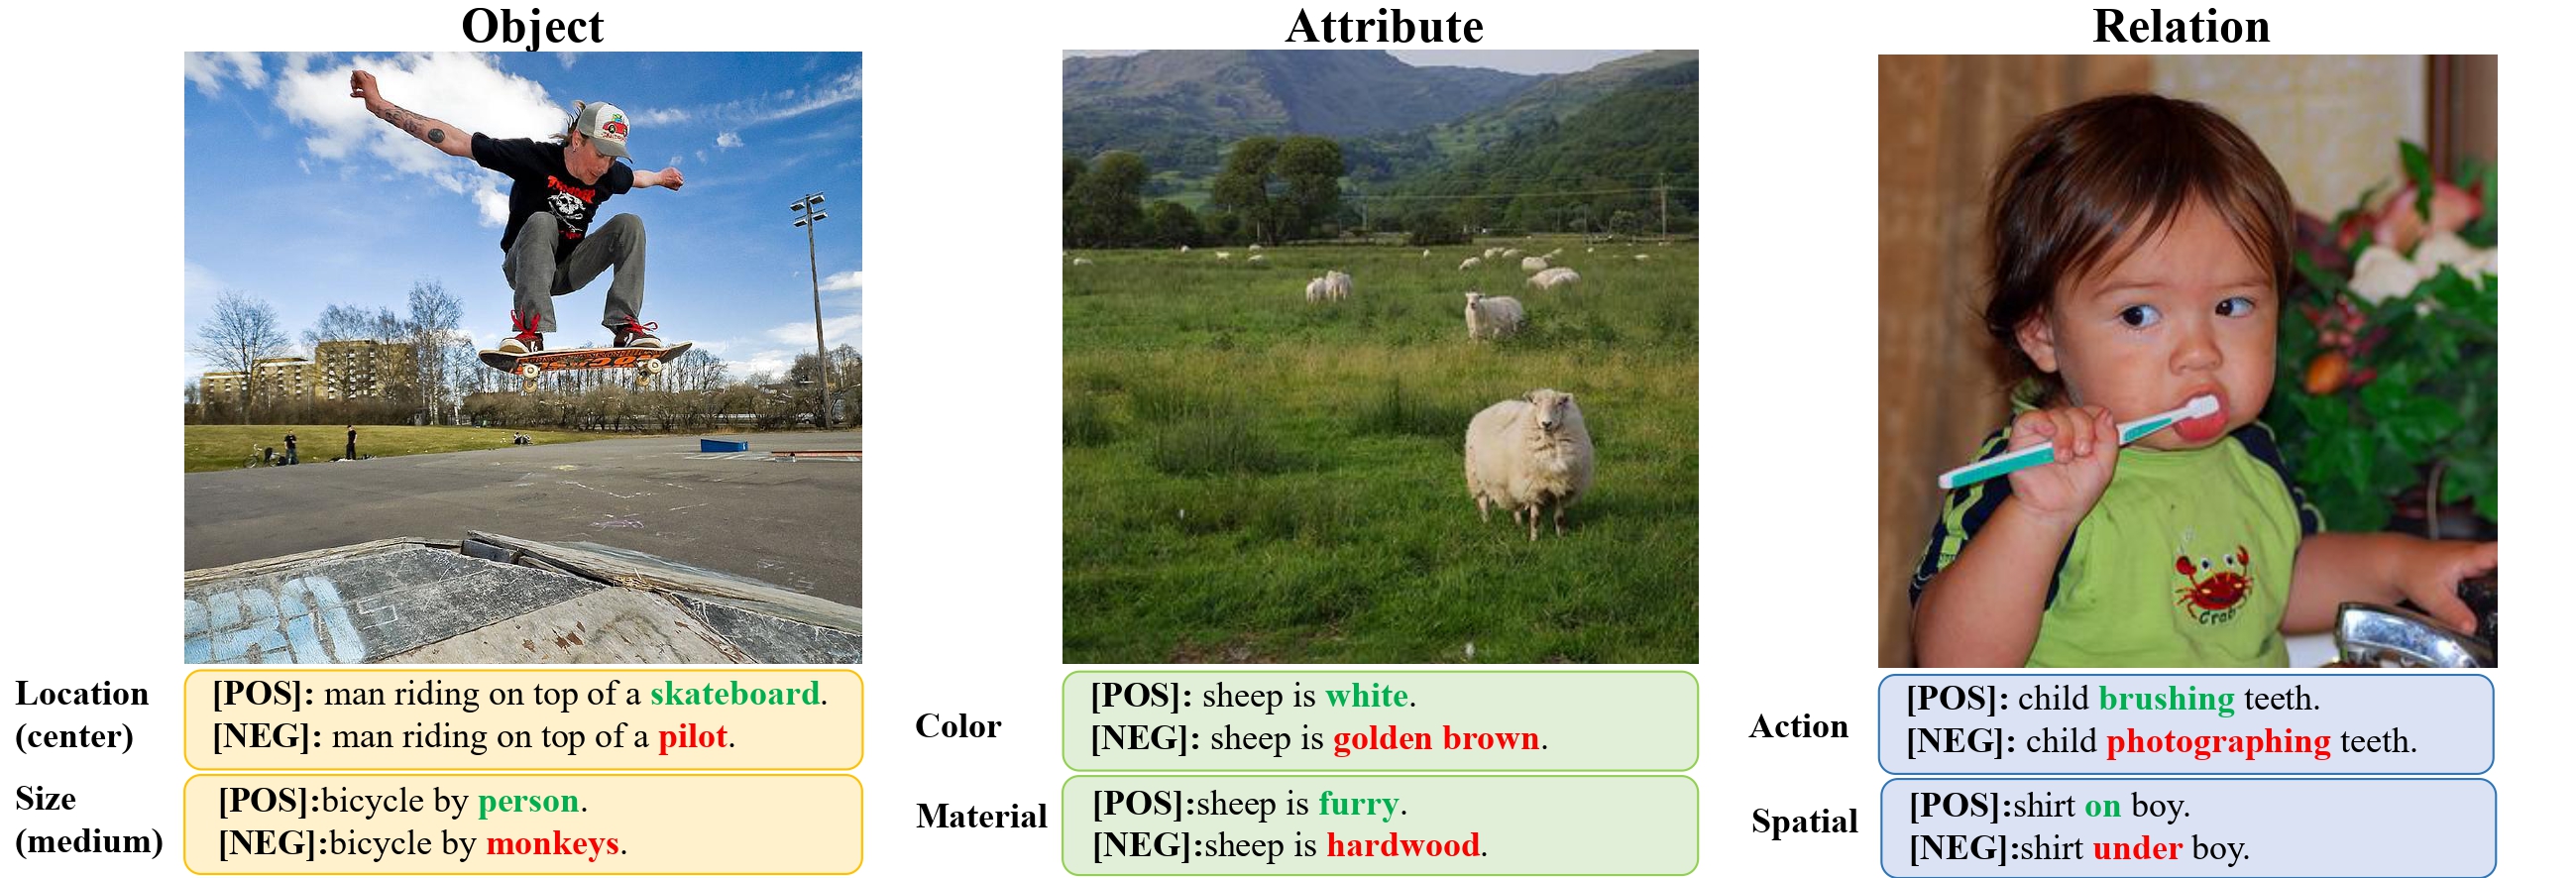
The negative sampling generation is a set of transformations on the original text descriptions. The proposed VL-CheckList focuses on a directional expectation test, in which the label is expected to change in a certain way. For example, when there is a black bear in the photo and the text description is "A black bear is holding a stick". We can transform several variations (e.g., (a black bear a red bear), (a stick an apple), (holding throwing), etc). The negative sampling strategy is the essential step for unbiased evaluations. To generate hard negative examples, we use the structured text description datasets such as Visual Genome (VG) Krishna et al. (2017), SWiG Pratt et al. (2020), and Human Activity Knowledge Engine (HAKE) Li et al. (2019b). The VG provides attributes, relationships, and region graphs which can make a hard negative sample by replacing one attribute in the relation in the image. The SWiG dataset provides structured semantic summaries of images with their roles such as agent and tool. We generate hard negative samples by replacing one of the roles in the text description to mismatch with the image. HAKE dataset provides the relationship between instance activity and body part states (e.g., "head" inspect rear view, "right hand" hold wheel, "hip" sit on chair seat).
For VG dataset, we first assign each attribute, object, and relation to the closet type by cosine similarity from sentence transformers111https://www.sbert.net/. For objects and relationships, we randomly sample a corresponding instance with a cosine similarity threshold of 0.5. For attribute, we randomly sample a corresponding instance from the same attribute class with a cosine similarity threshold of 0.5. Some of the samplings are not very suitable. For some inappropriate captions pairs, we manually modified them.
3.3 Visualization & Metric
Visualization: The final report is to show the models’ capabilities. The previous NLP CheckList shows the visual summary table which includes a failure rate with examples of each evaluation type. The vision checklist also shows the interpretable components that contributed to the prediction and the degree to which each feature contributed to the prediction and attention map using Grad-CAM Selvaraju et al. (2017). Our VL-CheckList is designed to comprehensively analyze a VLP model and output useful intermediate metrics for analysis and visualization. We provide the performance quantitative table and the radar chart based on the evaluation type taxonomy: object, attribute and relation and visualized insightful chart (Figure 4) and the attention map (Figure 5 and 6).
Metric: We return the model output scores between the text description and the generated negative samples. If the model score on the original text description is higher than the score on the generated negative samples, we regard it as positive output. We object to accuracy (acc) as the following equation.
| (1) |
where, if , otherwise 0. denotes a positive sample of data. means a positive sample of data. The N is the total number of pairs of positive and negative samples. is image data.
4 Experiment Setup
We compare 7 state-of-the-art VLP methods via the proposed method. They are:

4.1 Dual-Encoders
CLIP Radford et al. (2021) is trained on a dataset of 400 million (image, text) pairs with contrastive objectives. CLIP has a simple model where two transformers encode the image and text independently. The ITM score is simple cosine distance between the two embeddings. Despite of CLIP’s simple structure, it has achieved superior performance in many downstream tasks.
4.2 Region-based Cross-Attention Models
This type of models share the common trait that the input image is passed through a off-the-shelf object detectors to obtain salient objects and region features. They are:
LXMERT Tan and Bansal (2019) is a two-stream model with three transformers. An object relation encoder encodes the input objects and their location; a BERT encoder encodes the text; and a cross-modal encoder fuses the two modalities. The model is pretrained with ITM and three other objectives.
UNITER Chen et al. (2020) is a single-stream model that is pre-trained with four objectives. UNITER is different from LXMERT with its single-stream design where a shared transformer fuses the visual and language information in early stage.
OSCAR Li et al. (2020) is a single-stream model trained with masked token loss and constrastive loss on 6.5 million text-image-tag triplet. Its unique features are: (1) have a better object detector Zhang et al. (2021) that recognizes more types (2) include object tags with image and text as input features.
4.3 End-to-end Cross-Attention Models
End-to-end models do not depend on object detectors by encoding images directly.
ViLT Kim, Son, and Kim (2021) is an efficient single-stream model. The input image is divided into patches and concatenated with the words. Then a transformer encodes the combined sequence. ViLT is the first VLP model that achieves competent performance without using region futures.
ALBEF Li et al. (2021) is a two-stream model. The text and image are encoded via RoBERTa Liu et al. (2019) and ViT Dosovitskiy et al. (2020) respectively. Then a cross-modal transformer is used to fuse the two modalities. In addition, to learn better representations from noisy image-text pairs, ALBEF learn from pseudo-targets produced by the momentum model.
TCL Yang et al. (2022) is an improved version of ALBEF. TCL introduces three contrastive modules: cross-modal alignment (CMA), intra-modal contrastive (IMC), and local MI maximization (LMI), which respectively aims to maximize the mutual information between the matching image and text, maximizes the global mutual information.
We used four corpora, VG Krishna et al. (2017), SWiG Pratt et al. (2020), VAW Pham et al. (2021) and HAKE Li et al. (2019b) to build benchmark dataset for each capability test in the proposed framework (Table 1).
| Model Type | Models | Average (Model) | Object | Attribute | Relation | Average (Type) |
|---|---|---|---|---|---|---|
| REGION | LXMERT | 72.35 | 82.36 | 77.12 | 57.57 | 71.43 |
| UNITER | 72.63 | 81.94 | 71.31 | 64.65 | ||
| OSCAR | 69.31 | 78.10 | 61.28 | 68.54 | ||
| E2E | ViLT | 76.82 | 86.32 | 80.36 | 63.79 | 75.67 |
| ALBEF | 75.62 | 81.08 | 79.33 | 66.45 | ||
| TCL | 74.57 | 81.58 | 78.27 | 63.85 | ||
| DUAL | CLIP | 71.65 | 82.83 | 67.93 | 64.19 | 71.65 |
| Type | Model | Avg | Size | Location | Avg | ||||
| Large | Medium | Small | Center | Mid | Margin | ||||
| REGION | LXMERT | 82.36 | 84.94 | 82.05 | 79.01 | 84.56 | 83.84 | 79.77 | 80.80 |
| UNITER | 81.94 | 85.27 | 81.12 | 78.06 | 85.69 | 83.64 | 77.84 | ||
| OSCAR | 78.10 | 81.43 | 78.53 | 74.93 | 80.91 | 78.59 | 74.24 | ||
| E2E | ViLT | 86.32 | 88.58 | 85.29 | 82.18 | 88.61 | 86.65 | 86.59 | 82.99 |
| ALBEF | 81.08 | 84.33 | 80.25 | 76.92 | 82.87 | 80.91 | 81.19 | ||
| TCL | 81.58 | 86.15 | 79.96 | 74.91 | 85.01 | 83.21 | 80.26 | ||
| DUAL | CLIP | 82.83 | 88.77 | 81.82 | 75.65 | 88.48 | 85.80 | 76.47 | 82.83 |
| Type | Model | Avg | Text level | Image level | Avg | ||||||
| Act | Spa | Large | Medium | Small | Center | Mid | Margin | ||||
| REGION | LXMERT | 57.57 | 61.47 | 57.4 | 57.70 | 57.36 | 53.37 | 57.37 | 56.43 | 52.04 | 63.59 |
| UNITER | 64.65 | 69.17 | 61.5 | 64.73 | 66.17 | 60.31 | 63.33 | 63.70 | 65.60 | ||
| OSCAR | 68.54 | 69.6 | 72.6 | 67.65 | 65.65 | 61.50 | 70.70 | 67.00 | 63.43 | ||
| E2E | ViLT | 63.79 | 64.57 | 66.6 | 62.37 | 62.97 | 62.36 | 60.80 | 62.33 | 61.20 | 64.70 |
| ALBEF | 66.45 | 70.47 | 64.6 | 65.17 | 67.06 | 61.59 | 65.57 | 65.73 | 67.13 | ||
| TCL | 63.85 | 69.17 | 59.4 | 66.90 | 62.34 | 58.17 | 66.57 | 63.97 | 62.60 | ||
| DUAL | CLIP | 64.19 | 74.07 | 49.1 | 71.07 | 65.17 | 60.74 | 71.33 | 68.40 | 64.03 | 64.19 |
| Type | Model | Avg | Text level | Image level | Avg | |||||||||
| Color | Mat | Size | State | Act | Large | Medium | Small | Center | Mid | Margin | ||||
| REGION | LXMERT | 77.12 | 81.85 | 82.15 | 70.00 | 68.63 | 76.35 | 82.25 | 77.10 | 75.36 | 77.50 | 79.25 | 79.25 | 69.90 |
| UNITER | 71.31 | 76.20 | 75.75 | 63.45 | 68.10 | 72.55 | 74.90 | 69.45 | 68.49 | 72.05 | 73.30 | 70.25 | ||
| OSCAR | 61.28 | 68.80 | 58.25 | 52.65 | 62.31 | 67.60 | 64.80 | 59.15 | 58.18 | 65.75 | 59.15 | 56.80 | ||
| E2E | ViLT | 80.36 | 86.45 | 86.35 | 71.40 | 70.26 | 80.00 | 83.45 | 81.90 | 78.67 | 81.60 | 83.20 | 82.20 | 79.32 |
| ALBEF | 79.33 | 84.20 | 87.30 | 69.45 | 72.08 | 81.65 | 86.65 | 77.05 | 71.13 | 85.50 | 80.00 | 78.05 | ||
| TCL | 78.27 | 83.00 | 85.20 | 63.45 | 73.10 | 82.85 | 85.40 | 76.65 | 71.47 | 83.50 | 79.75 | 77.40 | ||
| DUAL | CLIP | 67.93 | 72.90 | 73.60 | 65.20 | 63.74 | 74.25 | 69.30 | 65.90 | 61.33 | 69.85 | 67.20 | 62.00 | 67.93 |
5 Results and Analysis
Table 2 shows the overall performance of the compared models on Object, Relation, and Attribute. The results indicate that understanding Relation and Attribute is more challenging than Object. The ViLT achieved the best score overall. We describe the experimental results and the detailed analysis of the seven representative VLP models based on the proposed framework.
5.1 Evaluation of Object
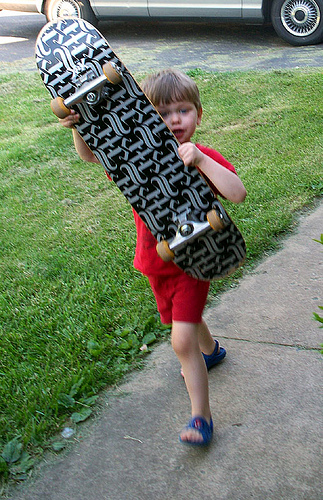
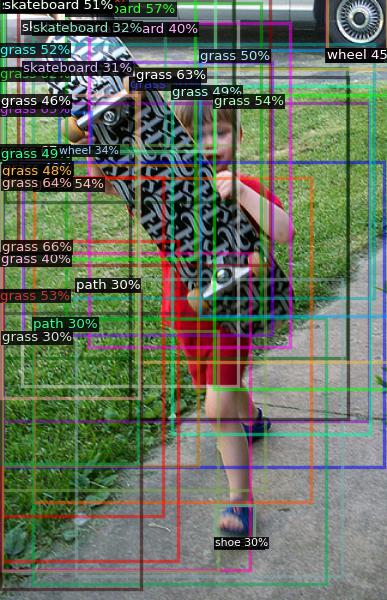
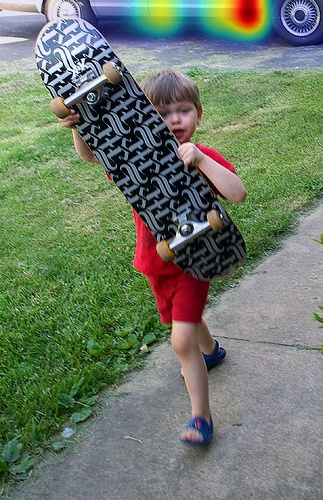
Object size and location greatly influence performance (Table 3). Specifically, we observe that all models gain the highest scores in Large and Center, which shows that VLP models tend to focus on large objects and those in the central point. Particularly, CLIP has the most performance degradation when it’s moved from Large to Small and Center to Margin (13.12% and 12.01% degradation, respectively). Moreover, end-to-end (E2E) models (ViLT, ALBEF, and TCL) are more robust to Location variance than others. On average, their scores only drop 2.82% from Center to Margin, compared with an average of 6.44% for region-based models (OSCAR, UNITER, and LXMERT) and 12.01% for CLIP. The performance gap between the Center and Margin indicates that E2E models are more stable than region-based models. We speculate the reason to be the region-based models are limited to the performance of object detector(e.g. Faster R-CNN), whose detection performance may drop for some areas of the images. Moreover, object detectors tend to ignore incomplete objects located at the margin of an image so that these marginal objects will not be fed into the cross-modal transformer. Therefore, the region-based models are prone to miss some useful information located in the margin. Conversely, the E2E model has the flexibility to focus on the whole image area (Figure 5). The object detector cannot identify the car on the top of the image since the bounding box does not contain information about the car, as in Figure 5(c). In contrast to the region-based model, the E2E model correctly focuses on the area of the car, as in Figure 5(d).



5.2 Evaluation of Relation
Aligning with the previous research Hendricks and Nematzadeh (2021), the performance on Relation is generally low for all models (Table 4), indicating that detecting relation is a more challenging problem than object and attribute recognition. We found that the CLIP performs the best (74.07%) in understanding Action but achieves the worst on the Spatial (49.1%). Subramanian et al. (2022) presented a similar observation that the CLIP was challenging to recognize Spatial expressions. The size and location of the objects are less critical to Relation changes. Region-based models drop 6.44% from Center to Margin when evaluating on Object, while their performance degradation about Location is reduced to 3.44% when evaluating on Relation. It indicates that the difficulty of relation recognition is not closely related to image level changes (i.e. Location and Size) but is closely related to text level information.
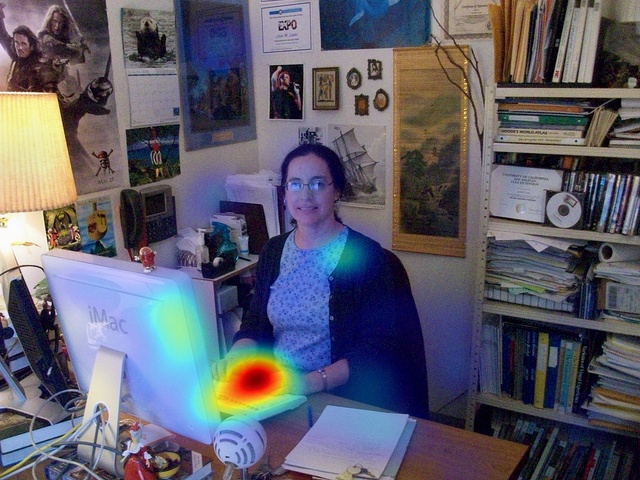
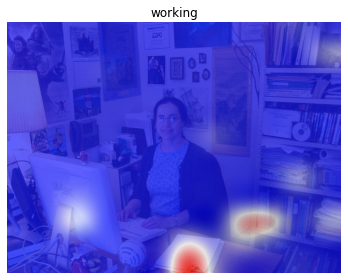
Additionally, we generate heat-maps to show where VLP models focus on Relation (Figure 6). The caption on the image is ’the woman is working on her computer at the desk’, and we generate the heat-maps of four different models for the word working. The clear evidence of the word working is where the woman is typing on the keyboard with her hand. OSCAR and ALBEF have reasonable attention maps, while LXMERT has less attention on the hands and keyboard. ViLT has the attention map on the paper and books, but not on the person.
5.3 Evaluation of Attribute
We explore the performance of attribute recognition on the location and size of objects. The average score of the E2E model is 9.42% higher than the region-based model on both image and text levels (Table 5). The dual-architecture model is 1.97% worse than the region-based model on average and has an 11.39% degradation compared to the end-to-end model. All models get relatively high scores on Color and Material, low on Size, State, and Action, and perform the worst on Size (Table 5). Understanding attribute requires complex semantic cognition between a text and an image, often beyond simple visual recognition Zellers et al. (2019). For example, Material is not only a matter of shape, size, and color but also something beyond optical recognition. When humans look at the image (e.g., artificial turf), it is hard to tell whether natural glass or artificial turf.
The challenge in understanding Size is mainly due to the subjectivity in natural language. For example, the size in natural language does not translate to an absolute pixel size in images Zhang et al. (2022). During pretraining, the VLP models are trained on various datasets where size words (e.g., small, large, giant) may not be consistent with each other in terms of visual Size. Also, the expressions of object sizes are different depending on the angles of a camera, the background, or an annotation’s personal view. The performance of Action is also low because some actions are impossible to judge without any sequence of the frames (e.g., open door vs. close door). Therefore, research on the video-language multi-modal has been actively explored Wang et al. (2022).
6 Conclusion
In conclusion, this paper introduces VL-CheckList to analyze VLP models from three perspectives: object, attribute, and relation. We adopt four corpora with carefully constructed taxonomy to produce fine-grained benchmark results for seven popular VLP models. Experiments not only validate the proposed method’s soundness but also provide several valuable insights about these methods, e.g., the size and location of the objects are critical, and relation recognition is one of the most challenging in the VLP models. In the future, we plan to include more fine-grained evaluation aspects into VL-CheckList and improve existing VLP methods to achieve state-of-the-art performance under the guidance of the VL-CheckList report.
7 Limitations
The goal of the VL-CheckList is to quickly evaluate the robustness on the linguistic variations. Thus, we choose the ITM, which is universal and can easily test a model without finetuning each task. However, we have not yet comprehensively investigated why the high ITM-scored models sometimes achieve lower scores on the downstream tasks in this work. For a certain task, how it is finetuned is more critical to model performance. We leave a detailed study of them to future work.
References
- Bolya et al. (2020) Bolya, D.; Foley, S.; Hays, J.; and Hoffman, J. 2020. Tide: A general toolbox for identifying object detection errors. In European Conference on Computer Vision, 558–573. Springer.
- Bowman et al. (2015) Bowman, S. R.; Angeli, G.; Potts, C.; and Manning, C. D. 2015. A large annotated corpus for learning natural language inference. arXiv preprint arXiv:1508.05326.
- Changpinyo et al. (2021) Changpinyo, S.; Sharma, P.; Ding, N.; and Soricut, R. 2021. Conceptual 12m: Pushing web-scale image-text pre-training to recognize long-tail visual concepts. In Proceedings of the IEEE/CVF Conference on Computer Vision and Pattern Recognition, 3558–3568.
- Chen et al. (2020) Chen, Y.-C.; Li, L.; Yu, L.; El Kholy, A.; Ahmed, F.; Gan, Z.; Cheng, Y.; and Liu, J. 2020. Uniter: Universal image-text representation learning. In European conference on computer vision, 104–120. Springer.
- Dosovitskiy et al. (2020) Dosovitskiy, A.; Beyer, L.; Kolesnikov, A.; Weissenborn, D.; Zhai, X.; Unterthiner, T.; Dehghani, M.; Minderer, M.; Heigold, G.; Gelly, S.; et al. 2020. An Image is Worth 16x16 Words: Transformers for Image Recognition at Scale. In International Conference on Learning Representations.
- Dou et al. (2022) Dou, Z.-Y.; Xu, Y.; Gan, Z.; Wang, J.; Wang, S.; Wang, L.; Zhu, C.; Zhang, P.; Yuan, L.; Peng, N.; et al. 2022. An empirical study of training end-to-end vision-and-language transformers. In Proceedings of the IEEE/CVF Conference on Computer Vision and Pattern Recognition, 18166–18176.
- Du et al. (2022) Du, X.; Legastelois, B.; Ganesh, B.; Rajan, A.; Chockler, H.; Belle, V.; Anderson, S.; and Ramamoorthy, S. 2022. Vision Checklist: Towards Testable Error Analysis of Image Models to Help System Designers Interrogate Model Capabilities. arXiv preprint arXiv:2201.11674.
- Hendricks et al. (2021) Hendricks, L. A.; Mellor, J.; Schneider, R.; Alayrac, J.-B.; and Nematzadeh, A. 2021. Decoupling the role of data, attention, and losses in multimodal transformers. Transactions of the Association for Computational Linguistics, 9: 570–585.
- Hendricks and Nematzadeh (2021) Hendricks, L. A.; and Nematzadeh, A. 2021. Probing image-language transformers for verb understanding. arXiv preprint arXiv:2106.09141.
- Kamath et al. (2021) Kamath, A.; Singh, M.; LeCun, Y.; Synnaeve, G.; Misra, I.; and Carion, N. 2021. MDETR-modulated detection for end-to-end multi-modal understanding. In Proceedings of the IEEE/CVF International Conference on Computer Vision, 1780–1790.
- Kiela et al. (2021) Kiela, D.; Bartolo, M.; Nie, Y.; Kaushik, D.; Geiger, A.; Wu, Z.; Vidgen, B.; Prasad, G.; Singh, A.; Ringshia, P.; et al. 2021. Dynabench: Rethinking benchmarking in NLP. arXiv preprint arXiv:2104.14337.
- Kim, Son, and Kim (2021) Kim, W.; Son, B.; and Kim, I. 2021. Vilt: Vision-and-language transformer without convolution or region supervision. In International Conference on Machine Learning, 5583–5594. PMLR.
- Krishna et al. (2016) Krishna, R.; Zhu, Y.; Groth, O.; Johnson, J.; Hata, K.; Kravitz, J.; Chen, S.; Kalantidis, Y.; Li, L.-J.; Shamma, D. A.; Bernstein, M. S.; and Fei-Fei, L. 2016. Visual Genome: Connecting Language and Vision Using Crowdsourced Dense Image Annotations. International Journal of Computer Vision, 123: 32–73.
- Krishna et al. (2017) Krishna, R.; Zhu, Y.; Groth, O.; Johnson, J.; Hata, K.; Kravitz, J.; Chen, S.; Kalantidis, Y.; Li, L.-J.; Shamma, D. A.; et al. 2017. Visual genome: Connecting language and vision using crowdsourced dense image annotations. International journal of computer vision, 123(1): 32–73.
- Li et al. (2021) Li, J.; Selvaraju, R.; Gotmare, A.; Joty, S.; Xiong, C.; and Hoi, S. C. H. 2021. Align before fuse: Vision and language representation learning with momentum distillation. Advances in Neural Information Processing Systems, 34.
- Li et al. (2019a) Li, L. H.; Yatskar, M.; Yin, D.; Hsieh, C.-J.; and Chang, K.-W. 2019a. VisualBERT: A Simple and Performant Baseline for Vision and Language. ArXiv, abs/1908.03557.
- Li et al. (2020) Li, X.; Yin, X.; Li, C.; Zhang, P.; Hu, X.; Zhang, L.; Wang, L.; Hu, H.; Dong, L.; Wei, F.; et al. 2020. Oscar: Object-semantics aligned pre-training for vision-language tasks. In European Conference on Computer Vision, 121–137. Springer.
- Li et al. (2019b) Li, Y.-L.; Xu, L.; Huang, X.; Liu, X.; Ma, Z.; Chen, M.; Wang, S.; Fang, H.; and Lu, C. 2019b. HAKE: Human Activity Knowledge Engine. ArXiv, abs/1904.06539.
- Liu et al. (2019) Liu, Y.; Ott, M.; Goyal, N.; Du, J.; Joshi, M.; Chen, D.; Levy, O.; Lewis, M.; Zettlemoyer, L.; and Stoyanov, V. 2019. Roberta: A robustly optimized bert pretraining approach. arXiv preprint arXiv:1907.11692.
- Lu et al. (2019) Lu, J.; Batra, D.; Parikh, D.; and Lee, S. 2019. Vilbert: Pretraining task-agnostic visiolinguistic representations for vision-and-language tasks. Advances in neural information processing systems, 32.
- Lu, Zhao, and Lee (2021) Lu, X.; Zhao, T.; and Lee, K. 2021. VisualSparta: An Embarrassingly Simple Approach to Large-scale Text-to-Image Search with Weighted Bag-of-words. In Proceedings of the 59th Annual Meeting of the Association for Computational Linguistics and the 11th International Joint Conference on Natural Language Processing (Volume 1: Long Papers), 5020–5029.
- Pham et al. (2021) Pham, K.; Kafle, K.; Lin, Z.; Ding, Z.; Cohen, S. D.; Tran, Q.; and Shrivastava, A. 2021. Learning to Predict Visual Attributes in the Wild. 2021 IEEE/CVF Conference on Computer Vision and Pattern Recognition (CVPR), 13013–13023.
- Pratt et al. (2020) Pratt, S.; Yatskar, M.; Weihs, L.; Farhadi, A.; and Kembhavi, A. 2020. Grounded Situation Recognition. ArXiv, abs/2003.12058.
- Radford et al. (2021) Radford, A.; Kim, J. W.; Hallacy, C.; Ramesh, A.; Goh, G.; Agarwal, S.; Sastry, G.; Askell, A.; Mishkin, P.; Clark, J.; et al. 2021. Learning transferable visual models from natural language supervision. In International Conference on Machine Learning, 8748–8763. PMLR.
- Rajpurkar et al. (2016) Rajpurkar, P.; Zhang, J.; Lopyrev, K.; and Liang, P. 2016. Squad: 100,000+ questions for machine comprehension of text. arXiv preprint arXiv:1606.05250.
- Ribeiro et al. (2020) Ribeiro, M. T.; Wu, T.; Guestrin, C.; and Singh, S. 2020. Beyond accuracy: Behavioral testing of NLP models with CheckList. arXiv preprint arXiv:2005.04118.
- Selvaraju et al. (2017) Selvaraju, R. R.; Cogswell, M.; Das, A.; Vedantam, R.; Parikh, D.; and Batra, D. 2017. Grad-cam: Visual explanations from deep networks via gradient-based localization. In Proceedings of the IEEE international conference on computer vision, 618–626.
- Sharma et al. (2018) Sharma, P.; Ding, N.; Goodman, S.; and Soricut, R. 2018. Conceptual captions: A cleaned, hypernymed, image alt-text dataset for automatic image captioning. In Proceedings of the 56th Annual Meeting of the Association for Computational Linguistics (Volume 1: Long Papers), 2556–2565.
- Subramanian et al. (2022) Subramanian, S.; Merrill, W.; Darrell, T.; Gardner, M.; Singh, S.; and Rohrbach, A. 2022. ReCLIP: A Strong Zero-Shot Baseline for Referring Expression Comprehension. arXiv preprint arXiv:2204.05991.
- Tan and Bansal (2019) Tan, H.; and Bansal, M. 2019. Lxmert: Learning cross-modality encoder representations from transformers. arXiv preprint arXiv:1908.07490.
- Vaswani et al. (2017) Vaswani, A.; Shazeer, N.; Parmar, N.; Uszkoreit, J.; Jones, L.; Gomez, A. N.; Kaiser, Ł.; and Polosukhin, I. 2017. Attention is all you need. Advances in neural information processing systems, 30.
- Wang et al. (2018) Wang, A.; Singh, A.; Michael, J.; Hill, F.; Levy, O.; and Bowman, S. R. 2018. GLUE: A multi-task benchmark and analysis platform for natural language understanding. arXiv preprint arXiv:1804.07461.
- Wang et al. (2022) Wang, A. J.; Ge, Y.; Yan, R.; Ge, Y.; Lin, X.; Cai, G.; Wu, J.; Shan, Y.; Qie, X.; and Shou, M. Z. 2022. All in one: Exploring unified video-language pre-training. arXiv preprint arXiv:2203.07303.
- Yang et al. (2022) Yang, J.; Duan, J.; Tran, S.; Xu, Y.; Chanda, S.; Chen, L.; Zeng, B.; Chilimbi, T.; and Huang, J. 2022. Vision-Language Pre-Training with Triple Contrastive Learning. In Proceedings of the IEEE/CVF Conference on Computer Vision and Pattern Recognition, 15671–15680.
- Zellers et al. (2019) Zellers, R.; Bisk, Y.; Farhadi, A.; and Choi, Y. 2019. From recognition to cognition: Visual commonsense reasoning. In Proceedings of the IEEE/CVF conference on computer vision and pattern recognition, 6720–6731.
- Zhang et al. (2022) Zhang, C.; Van Durme, B.; Li, Z.; and Stengel-Eskin, E. 2022. Visual Commonsense in Pretrained Unimodal and Multimodal Models. arXiv preprint arXiv:2205.01850.
- Zhang et al. (2021) Zhang, P.; Li, X.; Hu, X.; Yang, J.; Zhang, L.; Wang, L.; Choi, Y.; and Gao, J. 2021. Vinvl: Revisiting visual representations in vision-language models. In Proceedings of the IEEE/CVF Conference on Computer Vision and Pattern Recognition, 5579–5588.