High precision proton angular distribution measurements of 12C(p,p’) for determination of the decay branching ratio of the Hoyle state
Abstract
Background In stellar environments, carbon is produced exclusively via the process, where three particles fuse to form 12C in the excited Hoyle state, which can then decay to the ground state. The rate of carbon production in stars depends on the radiative width of the Hoyle state. While not directly measurable, the radiative width can be deduced by combining three separately measured quantities, one of which is the decay branching ratio. The branching ratio can be measured by exciting the Hoyle state in the 12C reaction and measuring the pair decay of both the Hoyle state and the first state of 12C.
Purpose To reduce the uncertainties in the carbon production rate in the universe by measuring a set of proton angular distributions for the population of the Hoyle state () and state in 12C in 12C reactions between 10.20 and 10.70 MeV, used in the determination of the branching ratio of the Hoyle state.
Method Proton angular distributions populating the ground, first , and the Hoyle states in 12C were measured in 12C(p,p’) reactions with a silicon detector array covering in 14 small energy steps between 10.20 and 10.70 MeV with a thin (g/cm2) natC target.
Results Total cross-sections for each state were extracted and the population ratio between the and Hoyle state determined at each energy step. By appropriately averaging these cross-sections and taking their ratio, the equivalent population ratio can be extracted applicable for any thick 12C target that may be used in pair-conversion measurements. This equivalent ratio agreed with a direct measurement performed with a thick target.
Conclusions We present a general data set of high-precision 12C cross-sections that make uncertainties resulting from the population of the and states by proton inelastic scattering negligible for any future measurements of the branching ratio in 12C. Implications for future measurements are discussed, as well as possible applications of this data set for investigating cluster structures in 13N.
I Introduction
In stars undergoing hydrogen burning, the synthesis of elements heavier than hydrogen begins with -chain reactions and the CNO cycle, where four protons are ultimately converted to one particle. Formation of any heavier elements during hydrogen burning is inhibited by the temperature of the star being too low to induce fusion as well as the lack of stable and nuclei. As a result, no heavier elements are formed in stars in this time. At the end of the hydrogen burning stage, the temperature of the star increases allowing fusion. At this point, the “ process” becomes significant, which allows carbon to be produced in stars that have an equilibrium concentration of 8Be ( s)Salpeter (1952). The small probability of a third particle to fuse with the 8Be before it decays enables the production of 12C, . The existence of the state at 7.65 MeV above the ground state of 12C is crucial for the process. Lying just above the threshold, it acts as a resonance for -wave capture at stellar temperatures. Without this resonance, the cross-section for the process would be far too small to produce the observed carbon abundance in the universe. Hoyle predicted the existence of this state via the abundance ratios of 16O:12C:4He in the universe, prior to its experimental observation Dunbar et al. (1953); Hoyle (1954); Cook et al. (1957), and it is thus commonly known as the Hoyle state.
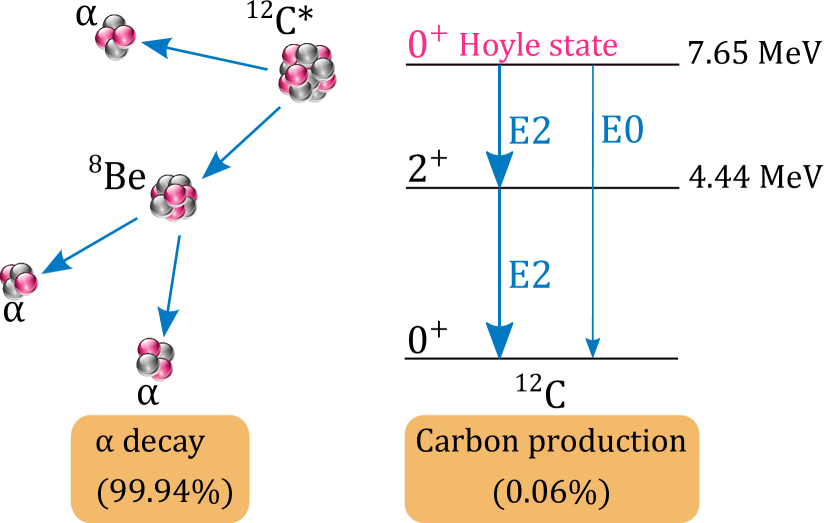
The Hoyle state disintegrates back to 8Be or with probability Freer and Fynbo (2014); Kibédi et al. (2020). Stable carbon is only produced when the Hoyle state instead electromagnetically decays directly to the ground state via an electric monopole () transition, or via the state by two electric quadrupole () transitions. The 12C production rate in the universe is therefore closely related to the decay properties of the Hoyle state. The different pathways for reaction outcomes following the process are shown in Fig. 1.
The carbon production rate in a star, can be described by the resonance reaction equation Rolfs and Rodney (1988)
| (1) |
The reaction rate depends on stellar properties: the number density of the particles , and the temperature , as well as nuclear properties: the mass of the particle , the total , alpha , and electromagnetic (radiative) decay widths of the Hoyle state, and the Q-value for the three breakup of the Hoyle state, . Since the Hoyle state dominantly decays via emission, , and can be simplified to:
| (2) |
We thus find that the carbon production rate depends linearly on the radiative width of the Hoyle state, . is made up of contributions from the MeV and MeV transitions. Since the contributions from electron conversion are negligible, we can write as the sum of contributions from photon () and pair conversion (), . Since the process is sequential, and 8Be has a short half-life, cannot be directly measured. It is usually deduced from three independently measured quantities (shown in brackets)
| (3) |
Precisely determining , and so the rate of carbon production in the process, requires determination of all three quantities. To this end, there have been years of continuous effort to reduce experimental uncertainties. Two recent experiments have determined new values for ( higher than the previous adopted value) Eriksen et al. (2020) and ( higher than the previous adopted value) Kibédi et al. (2020). When combined with the currently adopted value, these new experiments resulted in eV. This is approximately higher than the previously adopted value, significantly impacting models of stellar evolution Woosley and Heger (2021). In contrast, a very recent measurement using coincident detection of 12C nuclei implies a rate of 12C consistent with the previous values Tsumura et al. (2021), though it is sensitive to the exact form of the background. Ref. Kibédi et al. (2020) highlighted the urgent need for new, independent, high resolution measurements to resolve the discrepancies between different measurements.
In Ref. Eriksen et al. (2020), was determined using the 12C reaction through:
| (4) |
where are the number of experimentally measured , electron-positron pairs, , , are the number of events populating the Hoyle and the states, is the pair detection efficiency for each transition, and is the theoretical pair conversion coefficient, . As a result, the determination of requires the measurement of inelastic proton scattering in the two excited states, as well as the angular distribution of the -decay to account for the alignment of the state.
Here we present results of the ratio of the number of protons populating the and states, , that were used in Ref. Eriksen et al. (2020) to determine . This paper is intended to describe fully the measurement of Ref. Eriksen et al. (2020), as well as to enable future experimental efforts at measuring (as urged by Ref. Kibédi et al. (2020)) without having to do separate proton angular distribution measurements. By measuring absolute cross-sections with a thin target with comprehensive angular coverage, and covering the range of energies relevant for these experiments, we aim to provide a high-precision general data set for any future use. This data set extends beyond that in the literature, which is either for a specific target thickness at a specific energy Alburger (1977), or has limited angular coverage Swint et al. (1966) meaning that total cross-sections cannot be reliably extracted.
II Experimental Methods
The experiment was performed at the Australian National University Heavy Ion Accelerator Facility (HIAF). Proton beams were delivered by the 14UD electrostatic accelerator at 14 energies between and MeV impinging on thin natC ( 12C, 13C) targets of thicknesses 50 g/cm2 and 60 g/cm2. The targets were located on the same ladder, and oriented at 45 degrees to the beam axis. Here, we report the results from the 60 g/cm2 target, which had a thin Au “flash” (1.3 g/cm2) evaporated on the side oriented upstream of the target material, thus enabling absolute cross-sections to be obtained via normalization to Au elastic scattering at forward angles. Partial results from measurements with the 50 g/cm2 target were presented in Ref. Eriksen et al. (2020), which used relative yields to extract appropriate for that pair conversion experiment.
Thin targets were chosen to minimize energy loss, with the total energy loss through the target being between 3.45 keV at MeV and 3.33 keV at MeV. Due to this small energy loss, in this paper we will quote incident proton energies () rather than mid-target energies. The energy analysing magnet after the 14UD was recycled to reduce differential hysteresis effects, providing precise energy definition, estimated to be within (1 keV) of the required beam energy Spear et al. (1977). Measurements were performed in 20 keV steps between 10.40 and 10.50 MeV (inclusive) to span the energy loss of MeV protons incident on the mg/cm2 target used in Ref. Eriksen et al. (2020) with high granularity. For 10.20 – 10.40 and 10.50 – 10.70 MeV, 50 keV steps in beam energy were taken to increase the range in beam energy that could be covered.
Reaction products were measured using the Breakup Array for Light Nuclei (BALiN), an array comprised of wedge-shaped Double Sided Silicon Detectors (DSSDs) segmented into 16 arcs and 8 sectors Rafiei et al. (2010); Cook et al. (2018). In this experiment, the array was configured as two telescopes consisting of 400 m () and 500 m () stages placed on either side of the target. The DSSD thicknesses ensured that the elastically scattered protons stopped in the active volume of the silicon detectors, while the inelastic scattering populating the and states stopped in the stage. The array provided continuous coverage of scattering angles (with a small overlap around ), with azimuthal acceptance and . The coverage was almost independent. A segment of detector centered at was used for beam normalization.
The extended angular coverage and granularity of the detectors enabled “single shot” measurements (taking about 50 minutes) of proton scattering angular distributions from the , (Hoyle) states, as well as from the ground-state of 12C and 197Au (the latter being used for normalization).
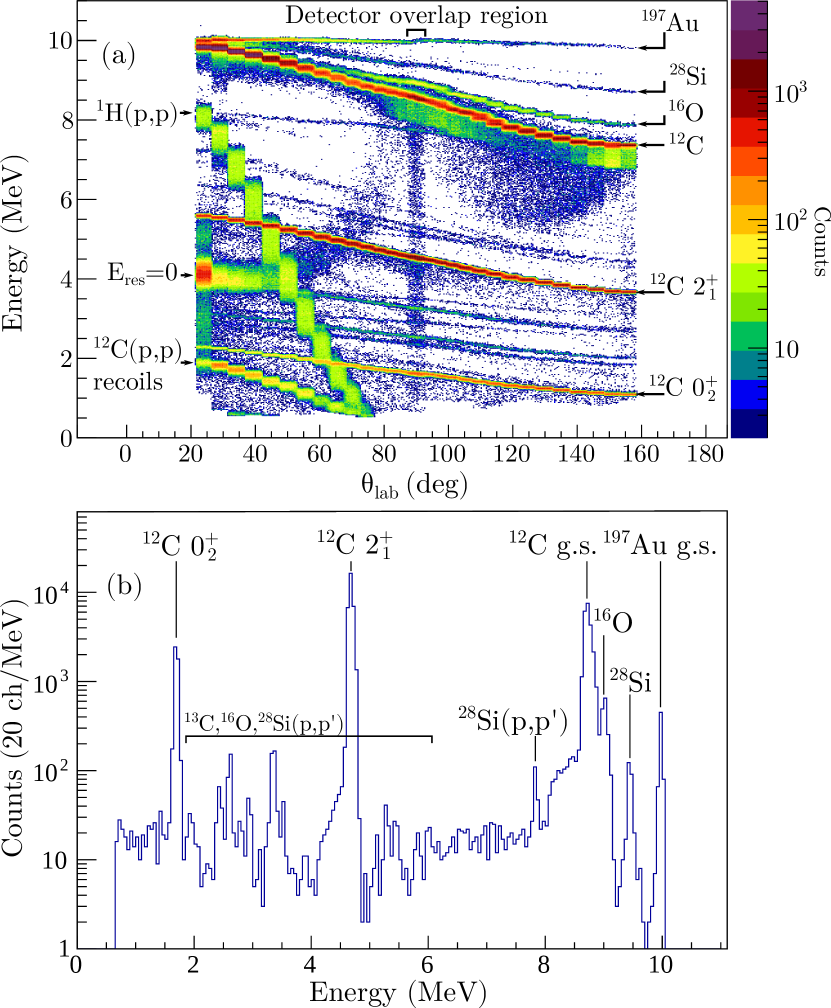
The resulting total energy () vs distribution at MeV is shown in Fig. 2(a), with a projection of the total energy between shown in Fig. 2(b). Important features include elastic scattering from the 197Au flash and the 12C target material, as well as much less intense peaks from 1H,16O,28Si target impurities. The energy calibration was optimised for the and curves. The small increase in the energy of the elastic lines around and is due to imperfect energy matching between the and stages. Since this does not influence the yield determination, this does not impact the results of this study in any way. Elastic scattering from the small contribution of 13C cannot be distinguished from the 12C elastic scattering events, and contributes a systematic error on the elastic scattering cross-sections. This systematic error does not apply to the and Hoyle state cross-sections.
As well as inelastic scattering populating the and states in 12C, inelastic scattering populating various states in 13C,16O,28Si is seen in Fig. 2. The intensities of these peaks are very low, and they are easily distinguished from the the and states in 12C via their different energy-angle relationships. Thus, the presence of these inelastic scattering peaks does not impact our analysis. At and the 1H kinematic curve intersects with that of the 12C and states respectively; the subtraction of these events is discussed in Appendix A. Also observed are events with low energy and angle, corresponding to recoiling 12C particles from elastic scattering. Finally, there is a diffuse band (marked ) of points corresponding to events where an event was recorded in the stage of the detector but not the stage, due to the imperfect detector overlap and the energy threshold in the telescope. The ‘tail’ present below the 12C elastic scattering peak (most intense at and ) arises similarly from the energy threshold in the telescope. The correction for these events (only impacting the elastic scattering yields) will be discussed in Appendix A.
Differential cross-sections for 12C() populating state at a laboratory angle of were determined via the following relation:
| (5) |
Here, is the yield of protons scattered from carbon in state in angle bin , is the yield of protons elastically scattered from Au in the monitor angular region , where is the associated average elastic cross-section, is the relative number density between the 12C target material and Au flash, and is the ratio of the solid angles between the monitor region and the bin. The determination of each quantity is described in Appendix A.
The main purpose of these measurements is to provide a set of cross-sections that can be energy-averaged to find the equivalent ratio for any thick target used for pair conversion measurements. Such targets are required to obtain sufficient statistics. Therefore, to assess the fidelity of energy integrated thin-target ratios when applied to thick targets, a measurement was also performed with the same mg/cm2 target used in Ref. Eriksen et al. (2020) for pair conversion measurements. The energy loss of the 10.5 MeV beam through this target, placed at to the beam axis, totals 57 keV. Lacking a Au flash for beam normalization, we do not present absolute cross-sections for this target, instead we present the ratio. The ratio for the thick target was extracted including the same detector geometry term as in Eq. 5.
III Results and Discussion
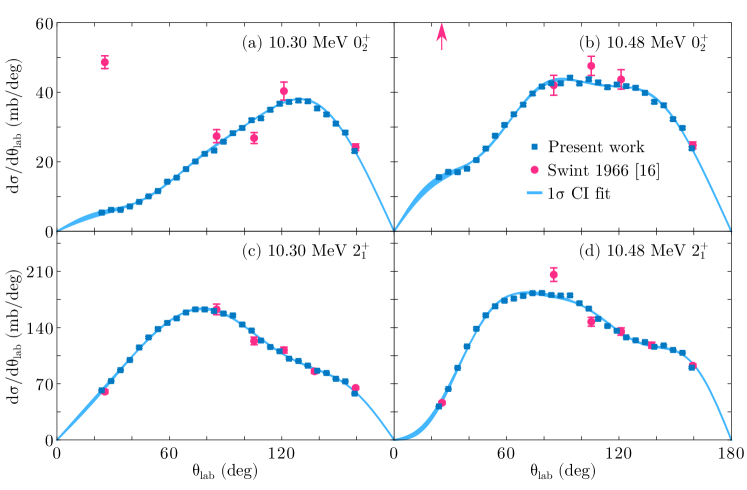
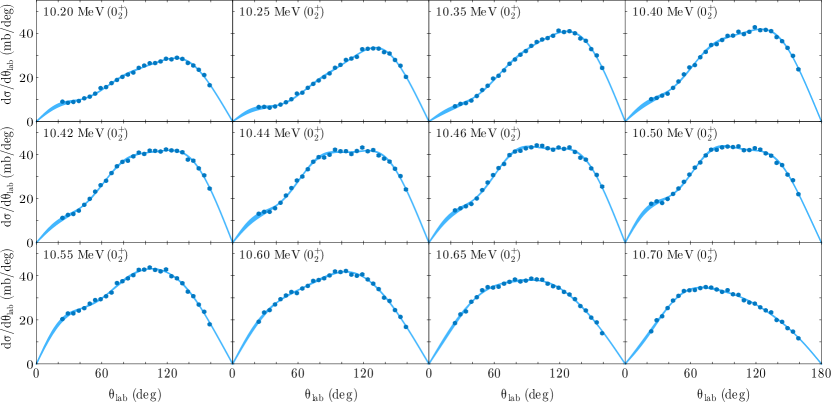
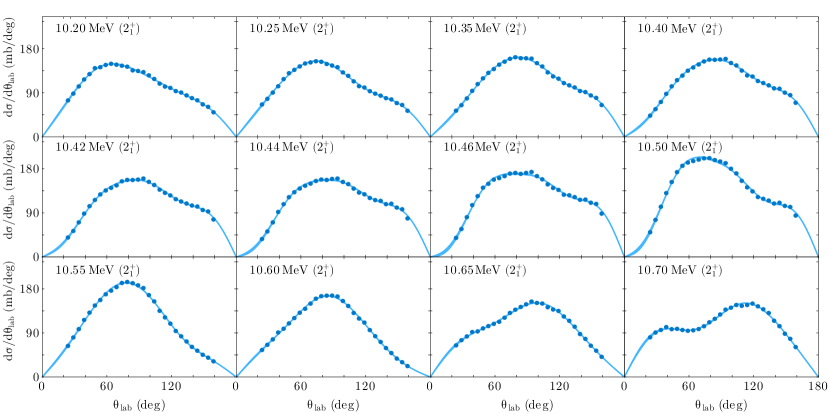
Differential cross-sections () are shown by the blue points in Fig. 3 for 12C reactions populating the and states at two representative energies MeV and MeV. Differential cross-sections for other energies, are shown in Appendix B for the state in Fig. 5, and the state in Fig. 6. The elastic scattering data are shown in Fig. 7 in Appendix B.
Digitized cross-sections from plots in Ref. Swint et al. (1966), transformed to the laboratory frame, are shown by the magenta circles in Fig. 3. The error bars include only the statistical errors given by Ref. Swint et al. (1966) and do not include a systematic error induced by the digitization process, which may add another few uncertainty. For the most part, the correspondence between the data from Ref. Swint et al. (1966) and the present work is excellent, the exception being the state cross-sections measured at (panels (a) and (b)), which far exceed those of the present work. In panel (b) it is off-scale, at 113(4) mb/deg, indicated by the arrow. This anomaly is very likely due to the fact that the kinematic curve for protons produced from the state coincides with that of recoiling elastically scattered 12C at this angle, leading to a spuriously large yield that was incorrectly assigned to protons from the state at this angle in Ref. Swint et al. (1966). In the present experiment, the much larger energy loss of the 12C nuclei compared to protons in the detector dead-layers separated the peaks from the state and the recoiling 12C, allowing clean separation of the state, as seen in Fig. 2(a).
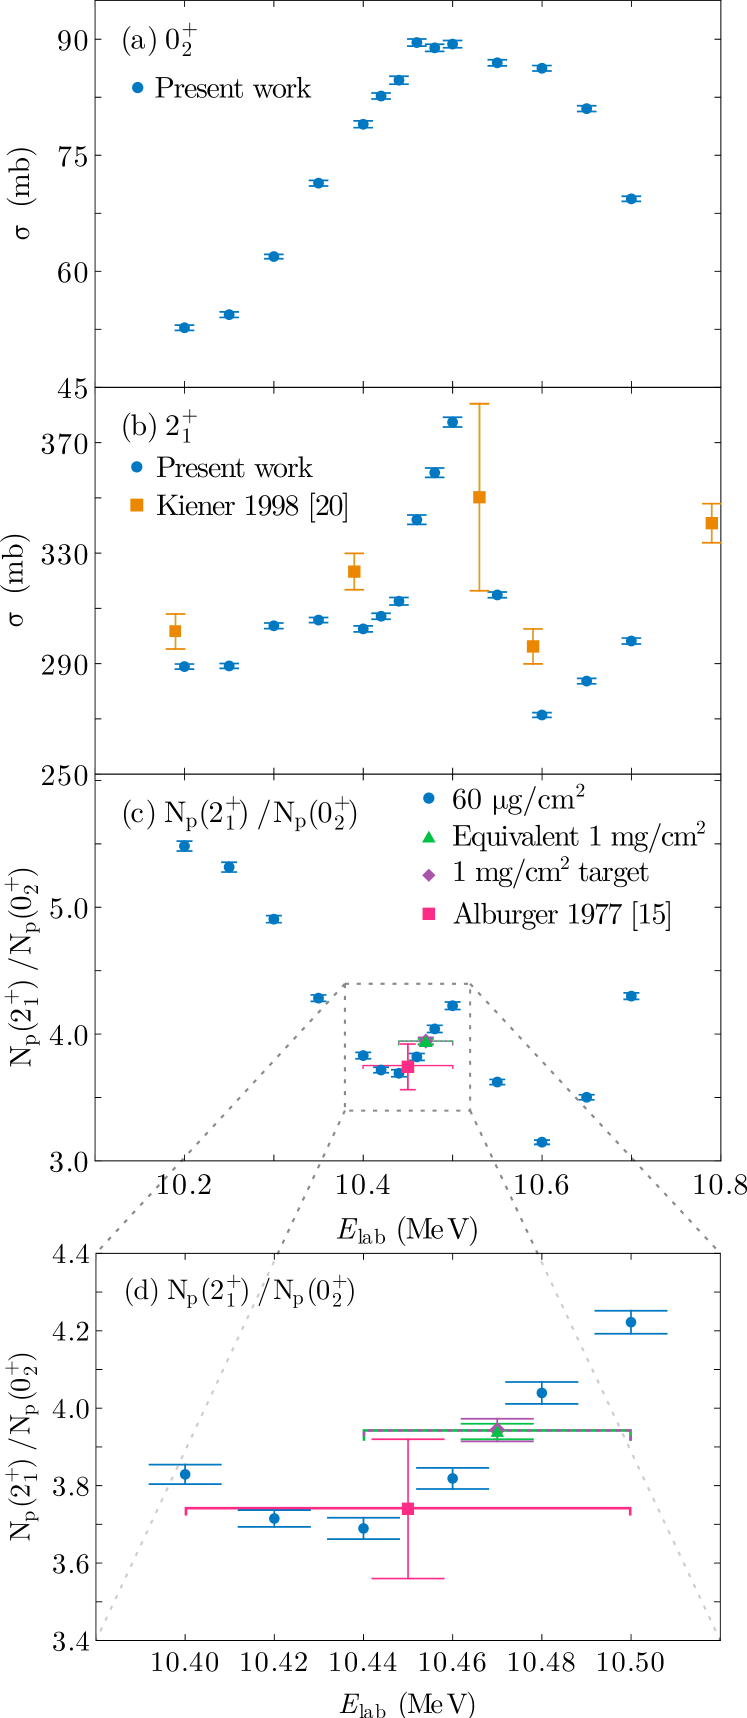
To obtain total cross-sections, we extrapolated our distributions beyond the angular range of the detectors via fifth order Legendre polynomial fits, prior to conversion to . Fifth order fits were the lowest order required to adequately fit the experimental data at all beam energies. The resulting fits are shown by the light blue curves in Fig. 3 for two representative energies and in Figs. 5 and 6 in Appendix B for all other energies. One- confidence intervals are indicated by the shaded regions, which are small due to both high statistics and the extensive angular coverage and granularity of the array, thus strongly constraining the fit parameters. After integrating the fitted functions, the resulting total cross-sections are shown in Fig. 4, for the (a), and states (b). The data are also tabulated in Table 1 (Appendix C). Error bars were extracted from the confidence intervals of the fits. The extrapolated regions (, ) contribute an average of ( of the total cross-sections. Cross-sections for population measured in 12C(p,p) reactions in Ref. Kiener et al. (1998) are shown by the orange squares in Fig. 3(b). While the cross-sections from Ref. Kiener et al. (1998) follow a very similar trend in energy, they lie above those in the present work. Those cross-sections were normalized to a previous measurement Dyer et al. (1981) which were themselves additionally normalized to a separate 12C measurement at a single energy, due to target non-uniformity in their measurement. We consider it likely that this multi-step normalization process could lead to this discrepancy. On the other hand, the normalization of the present data was achieved via simultaneous elastic scattering measurements at every energy. Additionally, our data agree very well with those of Ref. Swint et al. (1966), as seen in Fig. 3, lending additional confidence to our analysis. We wish to emphasize that for the purposes of extraction of the ratio , any overall normalization errors in the cross-sections would cancel out.
The population ratio at each energy, required for measurement of the branching ratio using Eq. 4 are shown in Fig. 4(c). The error bars in the population ratios presented here are lower than that quoted in Ref. Eriksen et al. (2020) from the same experiment. A more complete statistical analysis of the fits yielded a much smaller error bar, though the central values are the same within error. The uncertainty in the branching ratio extracted in Ref. Eriksen et al. (2020) was dominated by the pair conversion measurement, and does not change with these new smaller uncertainties. Also shown is the reported ratio of from Ref. Alburger (1977), (magenta square) which was extracted from averaging across five measurements using a 120 g/cm2 12C target in energy increments of 25 keV from 10.4 to 10.5 MeV. The energy range over which the ratio was averaged is indicated by the horizontal bar. The agreement with the present data is excellent. However, the measurement of Alburger (1977) cannot be applied to a target of a different thickness or a different bombarding energy. An appropriate weighted average of the present thin-target data can provide for various target thicknesses and bombarding energies between 10.20 and 10.70 MeV.
IV Integration for thick target measurements
In a pair conversion measurement for measuring the decay branching ratio, targets of thickness of order mg/cm2 must be used to obtain sufficient statistics. The energy loss in the target is sufficiently high, and varies sufficiently quickly with energy, that the energy loss cannot be neglected. In Ref. Eriksen et al. (2020), a mg/cm2 target oriented at to the beam axis (equivalent thickness 1.41 mg/cm2) was used for the pair conversion measurement. The energy loss in this target is calculated to be 57 keV. Using this same target, 12C measurements were performed under the same conditions as for the g/cm2 target. The resulting value for this target is 3.94(3), and is shown by the purple diamond in Fig. 4(c), and in more detail in panel (d), where the beam energy range in the target is indicated by the width of the horizontal bar. The equivalent ratio was constructed from the 60 g/cm2 target measurements by linearly interpolating between each energy, averaging the and cross-sections between 10.44 and 10.50 MeV, and taking the ratio of the average cross-sections:
| (6) |
Using this method, the ratio found for the mg/cm2 target oriented at to the beam axis is 3.94(2), precisely agreeing with the experimental value from the thick target measurement. This point is shown in green in Fig. 4(c,d). We are clearly able to extract the same either with a thick target measurement (requiring a separate measurement on each target used), or by averaging over thin target measurements. This approach requires that absolute cross-sections are extracted, since we take their weighted average before taking the ratio, and is more reliable than taking the average of the ratios (which gives 3.96(2) in this instance) when the cross-sections vary significantly over the energy range through the target.
In extracting this value, we assumed linear energy loss in the target, a uniform target thickness, and no energy width in the beam. These assumptions were justified for this case. The mg/cm2 target used in this experiment of Ref. Eriksen et al. (2020) was uniform, and the tandem beams used in this experiment are extremely narrow in energy. If the target is non-uniform, very thick, or the beam has substantial energy width, we recommend careful consideration of the distribution of energies within the target when averaging across the target thickness. For extreme cases, the method of Ref. Fisichella et al. (2015) could be applied.
V Conclusions
In this work, we have performed measurements of inelastic proton scattering from 12C at energies between 10.20 and 10.70 MeV, for the purpose of use in experiments determining the branching ratio of the Hoyle state in 12C. This quantity is important for extracting the production rate of carbon (and thus all heavier elements) in the universe, which occurs via the process. By measuring cross-sections in small energy steps with a thin target and comprehensive angular coverage, we have, for the first time, extracted a generally applicable data set for future measurements of branching ratios via pair measurements. The equivalent ratio for a thick target can be found by taking the weighted average of and across the energy range of the beam in the target. Using this method, we find precise agreement between the ratio extracted from a mg/cm2 target previously used in pair conversion measurements Eriksen et al. (2020).
It has been proposed that the radiative width of the Hoyle state may be extracted from a direct measurement of the ratio of the pair transitions de-exciting the Hoyle state, Kibédi et al. (2012). This method would allow the radiative width to be determined in an independent way. In the recent experiments of Ref. Eriksen et al. (2020) undertaken at a beam energy of 10.5 MeV, there is significant random background in the region around the 3.22 MeV transition from the Hoyle state that prevents this method from being applied. This background likely arises from the 4.44 MeV transition from the state Eriksen et al. (2020). It was estimated that a successful measurement using this method requires a factor of twenty reduction in the background in the vicinity of the 3.22 MeV pair peak Eriksen et al. (2020). These data show that we cannot achieve such a reduction in the background by changing the beam energy alone to reduce , but instead re-design of the Super-e pair spectrometer at ANU would be required. However, running the experiment at a beam energy of 10.60 MeV will reduce the background by for essentially the same cross-section and should be strongly considered.
The cross-sections for populating the ground, , and states may be used for applications beyond measuring the branching ratio of the Hoyle state. 13N, as well as the mirror nucleus 13C, have been discussed as a candidate for showing cluster states of the form () near their thresholds von Oertzen et al. (2006); Rudchik et al. (2019); Fujimura et al. (2004); Milin and von Oertzen (2002). The present experiments were conducted between 1.86-2.13 MeV above the 9B threshold (9.495 MeV) in 13N. Studies of other nuclei around 12C have shown that R-matrix fits of cross-sections around these energies can provide useful information on cluster configurations, e.g. Dell’Aquila (2020); Freer et al. (2012). Due to the low-lying proton removal threshold in 13N, R-matrix fitting of this excitation energy region is a significant task, beyond the scope of this paper. However we encourage the future application of these cross-sections to this interesting question.
Acknowledgements.
This work was supported by Australian Research Council Grants DP140102896, DP170101673, DP170102423, DP190100256, DP200100601. Operation of the ANU Heavy Ion Accelerator Facility is supported by the NCRIS HIA capability. The support from the technical staff of the ANU HIAF is greatly appreciated. Useful discussions with Phil Adsley are gratefully acknowledged. KJC thanks the Department of Nuclear Physics at the Australian National University for their hospitality during her visit.Appendix A Cross-section determination
Yields , , , and were background subtracted using third order polynomial fitting of the backgrounds. The backgrounds were typically below the peak values for the state, and below the peak values for the state. The exception to this was for p+p scattering from hydrogen impurities in the target material, which produces a larger background where the kinematic curve intersects that of the state at and the state at .
Determination of the relative number densities of the 12C target material and Au flash, , as well as verification of the the solid angle of the detector array was achieved using a 16O beam at a below-barrier energy of 14.63 MeV, where scattering is expected to be purely Rutherford.
For natC(p,p) and 197Au(p,p) elastic scattering, the proton energies were above the punch-through energies in the stage, and a small (about ) portion of events have a but not (residual energy) signal due to (a) the imperfect geometric overlap of the and stages and (b) events with total energy slightly above the punch-through thresholds not giving a signal in the stage. These events are marked in Fig. 2. Corrections were made on the basis of the number of signals with the correct energy loss compared to that in total energy. At , where the correction was , the elastic scattering data is not presented. These corrections were necessary only for the elastic scattering events. No such corrections were necessary for the and states, since the protons all stop in the stage.
To normalize the 12C cross-sections to elastic scattering reactions via Eq. 5, elastic scattering cross-sections , were calculated using FRESCO Thompson (1988) with optical potentials from refs. Becchetti and Greenlees (1969); Rathmell and Haeberli (1972). For both potentials, the proton elastic scattering cross-section at (the angle selected for normalization of the 12C data) deviated by from the Rutherford scattering formula at these energies, making the choice of potential insignificant to the overall normalization of the p+12C cross-sections.
To ensure accuracy of cross-sections at very forward angles where the cross-sections change rapidly across a single pixel of the detector array, a set of events were simulated from the elastic cross-sections using Monte-Carlo techniques. The detector response was simulated by randomizing the position of the elastic scattering events in each pixel of the detector array, and the simulated events were passed through the same analysis pipeline as the experimental data. This assured correct cross-section normalization using the 197Au data.
Appendix B Angular distributions for all energies
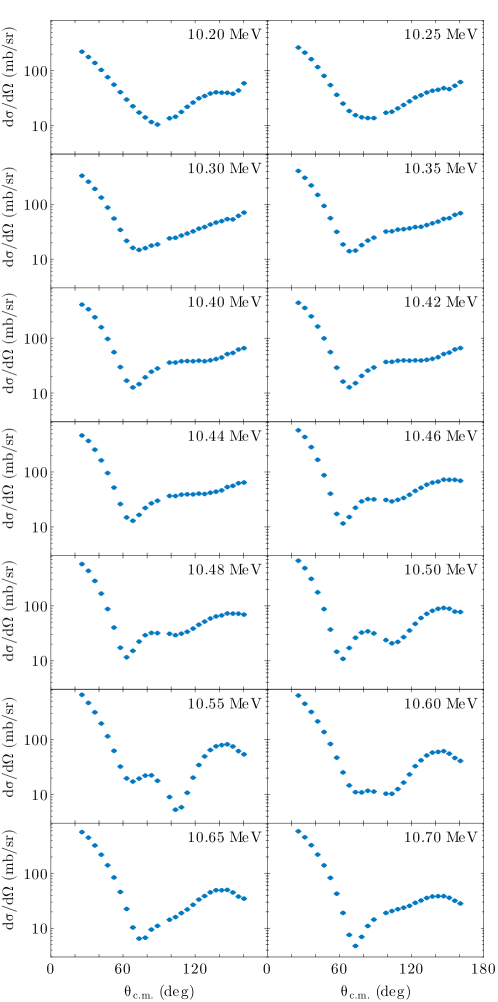
Fig. 5 shows angular distributions and Legendre polynomial fits for 12C populating the state at all other energies (besides 10.30 and 10.48 MeV, presented in Fig. 3). Similarly, Fig. 6 shows all other angular distributions for 12C populating the state. Fig. 7 shows the natC elastic scattering cross-sections at each energy. Contributions from 13C ( abundance) could not be separated from 12C ( abundance). Therefore, these cross-sections can be regarded as 12C cross-sections with a systematic error. If the 13C cross-sections were identical to 12C, the systematic error would reduce to zero.
Appendix C Tabulated data
Tabulated cross-sections for 12C reactions populating the and states, and their ratio at each energy are shown in Table 1.
| Energy | |||
|---|---|---|---|
| (MeV) | (mb) | (mb) | |
| 10.20 | |||
| 10.25 | |||
| 10.30 | |||
| 10.35 | |||
| 10.40 | |||
| 10.42 | |||
| 10.44 | |||
| 10.46 | |||
| 10.48 | |||
| 10.50 | |||
| 10.55 | |||
| 10.60 | |||
| 10.65 | |||
| 10.70 |
References
- Salpeter (1952) E. E. Salpeter, Astrophys. J. 115, 326 (1952).
- Dunbar et al. (1953) D. N. F. Dunbar, R. E. Pixley, W. A. Wenzel, and W. Whaling, Phys. Rev. 92, 649 (1953).
- Hoyle (1954) F. Hoyle, APJ S. 1, 121 (1954).
- Cook et al. (1957) C. W. Cook, W. A. Fowler, C. C. Lauritsen, and T. Lauritsen, Phys. Rev. 107, 508 (1957).
- Smith et al. (2017) R. Smith, T. Kokalova, C. Wheldon, J. E. Bishop, M. Freer, N. Curtis, and D. J. Parker, Phys. Rev. Lett. 119, 132502 (2017).
- Dell’Aquila et al. (2017) D. Dell’Aquila, I. Lombardo, G. Verde, M. Vigilante, L. Acosta, C. Agodi, F. Cappuzzello, D. Carbone, M. Cavallaro, S. Cherubini, A. Cvetinovic, G. D’Agata, L. Francalanza, G. L. Guardo, M. Gulino, I. Indelicato, M. La Cognata, L. Lamia, A. Ordine, R. G. Pizzone, S. M. R. Puglia, G. G. Rapisarda, S. Romano, G. Santagati, R. Spartà, G. Spadaccini, C. Spitaleri, and A. Tumino, Phys. Rev. Lett. 119, 132501 (2017).
- Rana et al. (2019) T. Rana, S. Bhattacharya, C. Bhattacharya, S. Manna, S. Kundu, K. Banerjee, R. Pandey, P. Roy, A. Dhal, G. Mukherjee, V. Srivastava, A. Dey, A. Chaudhuri, T. Ghosh, A. Sen, M. Asgar, T. Roy, J. Sahoo, J. Meena, A. Saha, R. Saha, M. Sinha, and A. Roy, Physics Letters B 793, 130 (2019).
- Bishop et al. (2020) J. Bishop, G. V. Rogachev, S. Ahn, E. Aboud, M. Barbui, A. Bosh, C. Hunt, H. Jayatissa, E. Koshchiy, R. Malecek, S. T. Marley, E. C. Pollacco, C. D. Pruitt, B. T. Roeder, A. Saastamoinen, L. G. Sobotka, and S. Upadhyayula, Phys. Rev. C 102, 041303(R) (2020).
- Freer and Fynbo (2014) M. Freer and H. Fynbo, Progress in Particle and Nuclear Physics 78, 1 (2014).
- Kibédi et al. (2020) T. Kibédi, B. Alshahrani, A. E. Stuchbery, A. C. Larsen, A. Görgen, S. Siem, M. Guttormsen, F. Giacoppo, A. I. Morales, E. Sahin, G. M. Tveten, F. L. B. Garrote, L. C. Campo, T. K. Eriksen, M. Klintefjord, S. Maharramova, H.-T. Nyhus, T. G. Tornyi, T. Renstrøm, and W. Paulsen, Phys. Rev. Lett. 125, 182701 (2020).
- Rolfs and Rodney (1988) C. E. Rolfs and W. S. Rodney, Cauldrons in the cosmos: nuclear astrophysics (University of Chicago Press, 1988).
- Eriksen et al. (2020) T. K. Eriksen, T. Kibédi, M. W. Reed, A. E. Stuchbery, K. J. Cook, A. Akber, B. Alshahrani, A. A. Avaa, K. Banerjee, A. C. Berriman, L. T. Bezzina, L. Bignell, J. Buete, I. P. Carter, B. J. Coombes, J. T. H. Dowie, M. Dasgupta, L. J. Evitts, A. B. Garnsworthy, M. S. M. Gerathy, T. J. Gray, D. J. Hinde, T. H. Hoang, S. S. Hota, E. Ideguchi, P. Jones, G. J. Lane, B. P. McCormick, A. J. Mitchell, N. Palalani, T. Palazzo, M. Ripper, E. C. Simpson, J. Smallcombe, B. M. A. Swinton-Bland, T. Tanaka, T. G. Tornyi, and M. O. de Vries, Phys. Rev. C 102, 024320 (2020).
- Woosley and Heger (2021) S. E. Woosley and A. Heger, The Astrophysical Journal Letters 912, L31 (2021).
- Tsumura et al. (2021) M. Tsumura, T. Kawabata, Y. Takahashi, S. Adachi, H. Akimune, S. Ashikaga, T. Baba, Y. Fujikawa, H. Fujimura, H. Fujioka, T. Furuno, T. Hashimoto, T. Harada, M. Ichikawa, K. Inaba, Y. Ishii, N. Itagaki, M. Itoh, C. Iwamoto, N. Kobayashi, A. Koshikawa, S. Kubono, Y. Maeda, Y. Matsuda, S. Matsumoto, K. Miki, T. Morimoto, M. Murata, T. Nanamura, I. Ou, S. Sakaguchi, A. Sakaue, M. Sferrazza, K. Suzuki, T. Takeda, A. Tamii, K. Watanabe, Y. Watanabe, H. Yoshida, and J. Zenihiro, Physics Letters B 817, 136283 (2021).
- Alburger (1977) D. E. Alburger, Phys. Rev. C 16, 2394 (1977).
- Swint et al. (1966) J. Swint, A. Barnard, T. Clegg, and J. Weil, Nuclear Physics 86, 119 (1966).
- Spear et al. (1977) R. Spear, D. Kean, M. Esat, A. Joye, and M. Fewell, Nuclear Instruments and Methods 147, 455 (1977).
- Rafiei et al. (2010) R. Rafiei, R. du Rietz, D. H. Luong, D. J. Hinde, M. Dasgupta, M. Evers, and A. Diaz-Torres, Phys. Rev. C 81, 024601 (2010).
- Cook et al. (2018) K. J. Cook, I. P. Carter, E. C. Simpson, M. Dasgupta, D. J. Hinde, L. T. Bezzina, S. Kalkal, C. Sengupta, C. Simenel, B. M. A. Swinton-Bland, K. Vo-Phuoc, and E. Williams, Phys. Rev. C 97, 021601(R) (2018).
- Kiener et al. (1998) J. Kiener, M. Berheide, N. L. Achouri, A. Boughrara, A. Coc, A. Lefebvre, F. de Oliveira Santos, and C. Vieu, Phys. Rev. C 58, 2174 (1998).
- Dyer et al. (1981) P. Dyer, D. Bodansky, A. G. Seamster, E. B. Norman, and D. R. Maxson, Phys. Rev. C 23, 1865 (1981).
- Fisichella et al. (2015) M. Fisichella, A. C. Shotter, A. Di Pietro, P. Figuera, M. Lattuada, C. Marchetta, V. Privitera, L. Romano, C. Ruiz, and M. Zadro, Phys. Rev. C 92, 064611 (2015).
- Kibédi et al. (2012) T. Kibédi, A. E. Stuchbery, G. D. Dracoulis, and K. A. Robertson, EPJ Web Conf. 65, 06001 (2012).
- von Oertzen et al. (2006) W. von Oertzen, M. Freer, and Y. Kanada-En’yo, Physics Reports 432, 43 (2006).
- Rudchik et al. (2019) A. Rudchik, A. Rudchik, O. Kutsyk, K. Kemper, K. Rusek, E. Piasecki, A. Trzcińska, S. Kliczewski, E. Koshchy, V. Pirnak, O. Ponkratenko, I. Strojek, V. Plujko, S. Sakuta, R. Siudak, A. Ilyin, Y. Stepanenko, Y. Shyrma, and V. Uleshchenko, Nuclear Physics A 992, 121638 (2019).
- Fujimura et al. (2004) H. Fujimura, H. Akimune, I. Daito, M. Fujiwara, K. Hara, K. Y. Hara, M. N. Harakeh, F. Ihara, T. Inomata, K. Ishibashi, T. Ishikawa, T. Kawabata, A. Tamii, M. Tanaka, H. Toyokawa, T. Yamanaka, and M. Yosoi, Phys. Rev. C 69, 064327 (2004).
- Milin and von Oertzen (2002) M. Milin and W. von Oertzen, Eur. Phys. J. A 14, 295 (2002).
- Dell’Aquila (2020) D. Dell’Aquila, Eur. Phys. J. Plus 135, 165 (2020).
- Freer et al. (2012) M. Freer, N. L. Achouri, C. Angulo, N. I. Ashwood, D. W. Bardayan, S. Brown, W. N. Catford, K. A. Chipps, N. Curtis, P. Demaret, C. Harlin, B. Laurent, J. D. Malcolm, M. Milin, T. Munoz-Britton, N. A. Orr, S. D. Pain, D. Price, R. Raabe, N. Soić, J. S. Thomas, C. Wheldon, G. Wilson, and V. A. Ziman, Phys. Rev. C 85, 014304 (2012).
- Thompson (1988) I. J. Thompson, Computer Physics Reports 7, 167 (1988).
- Becchetti and Greenlees (1969) F. D. Becchetti and G. W. Greenlees, Phys. Rev. 182, 1190 (1969).
- Rathmell and Haeberli (1972) R. Rathmell and W. Haeberli, Nuclear Physics A 178, 458 (1972).