Interpretability, Then What? Editing Machine Learning Models to Reflect Human Knowledge and Values
Abstract.
Machine learning (ML) interpretability techniques can reveal undesirable patterns in data that models exploit to make predictions—potentially causing harms once deployed. However, how to take action to address these patterns is not always clear. In a collaboration between ML and human-computer interaction researchers, physicians, and data scientists, we develop GAM Changer, the first interactive system to help domain experts and data scientists easily and responsibly edit Generalized Additive Models (GAMs) and fix problematic patterns. With novel interaction techniques, our tool puts interpretability into action—empowering users to analyze, validate, and align model behaviors with their knowledge and values. Physicians have started to use our tool to investigate and fix pneumonia and sepsis risk prediction models, and an evaluation with 7 data scientists working in diverse domains highlights that our tool is easy to use, meets their model editing needs, and fits into their current workflows. Built with modern web technologies, our tool runs locally in users’ web browsers or computational notebooks, lowering the barrier to use. GAM Changer is available at the following public demo link: https://interpret.ml/gam-changer.
1. Introduction
Motivation for the study
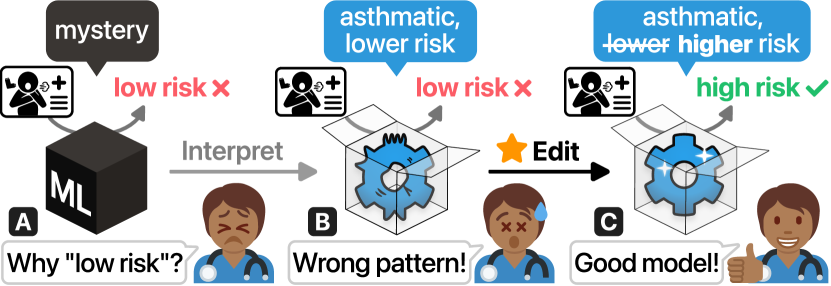
It is crucial to understand how machine learning (ML) models make predictions in high-stakes settings, such as finance, criminal justice, and healthcare (Fig. 1A). Recently, researchers have made substantial efforts to make ML models interpretable (e.g., Ribeiro et al., 2016; Lundberg and Lee, 2017; Caruana et al., 2015), but there is not much research focused on how to act on model interpretations. In practice, data scientists and domain experts often compare model interpretations with their knowledge (Hong et al., 2020). If a model uses expected patterns to make predictions, they feel more confident to deploy it. Interpretability can also uncover hidden relationships in the data—helping users gain insights into the problems they want to tackle.
Other times, however, ML interpretability reveals that models learn dangerous patterns from the data and rely on these patterns to make predictions. These patterns might accurately reflect real phenomena, but leaving them untouched can cause serious harm in deployment. For example, with interpretability, KDD researchers (Caruana et al., 2015; Chang et al., 2021) found healthcare models predict that having asthma lowers a patient’s risk of dying from pneumonia (Fig. 1B). Researchers suspect this is because asthmatic patients would receive care earlier, leading to better outcomes in the training data. If we use these flawed models to make hospital admission decisions, asthmatic patients are likely to miss out on care they need. Interpretability helps us identify these dangerous patterns, but how can we take a step further and use model explanations to improve (Fig. 1C) ML models?
To answer this question, our research team—consisting of ML and human-computer interaction (HCI) researchers, physicians, and data scientists—presents GAM Changer (Fig. 2): the first interactive system to empower domain experts and data scientists to easily and responsibly edit the weights of generalized additive models (GAMs) (Hastie and Tibshirani, 1999; Lou et al., 2013, 2012), a state-of-the-art interpretable model (Wang et al., 2020). Model editing is already common practice for regulatory compliance (§ 5.2.1). We aim to tackle two critical challenges to make model editing more accessible and responsible:
Challenge 1: Enable domain experts to vet and fix models. Editing model weights to align model behavior with domain knowledge has been discussed in the KDD community (Caruana et al., 2015). It requires the “editors” to have expertise in ML engineering and write code to adjust specific weights until the model behaves as expected. However, domain experts who have less experience in ML engineering, such as physicians and legal experts, play a critical role in creating trustworthy models (Hong et al., 2020). To democratize model editing, we develop easy-to-use and flexible user interfaces that support a wide range of editing methods—enabling stakeholders with diverse backgrounds to easily investigate and improve ML models.
Challenge 2: Promote accountable model modifications. Accessible model editing helps users exercise their human agency but demands caution, as modifications of high-stake models have serious consequences. For example, if a user only monitors edits’ effects on a metric like overall accuracy, their edits might have unfavorable effects on underrepresented groups (Wall et al., 2017). To guard against harmful edits, we provide users with continuous feedback about impacts on different subgroups and feature correlations. We also support transparent and reversible model modifications.
Contributions & Impacts. GAM Changer has already begun to help users improve their models. Our major contributions include:
-
•
GAM Changer, the first interactive system that empowers domain experts and data scientists to edit GAMs to align model behaviors with their knowledge and values. Through a participatory and iterative design process with physicians and data scientists, we adapt easy-to-use direct manipulation (Shneiderman, 1983) interfaces to edit complex ML models. Guarding against harmful edits is our priority: we employ continuous feedback and reversible actions to elucidate editing effects and promote accountable edits (§ 3).
-
•
Impacts to physicians: GAM Changer in action. Physicians have started to use our tool to vet and fix healthcare ML models. We present two examples where physicians on our team applied GAM Changer to align pneumonia and sepsis risk predictions with their clinical knowledge. The edited sepsis risk prediction model will be adapted for use in a large hospital (§ 4).
-
•
Impacts to data scientists: beyond healthcare. To investigate how our tool will help ML practitioners, we further evaluate it via a user study with 7 data scientists in finance, healthcare, and media. Our study suggests GAM Changer is easy to understand, fits into practitioners’ workflow, and is especially enjoyable to use. We also find model editing via feature engineering and parameter tuning is a common practice for regulatory compliance. Reflecting on our study, we derive lessons and future directions for model editing and interpretability tools (§ 5, § 6).
-
•
An open-source,111GAM Changer code: https://github.com/interpretml/gam-changer web-based implementation that broadens people’s access to creating more accountable ML models and exercising their human agency in a world penetrated by ML systems. We develop GAM Changer with modern web technologies such as WebAssembly.222WebAssembly: https://webassembly.org Therefore, anyone can access our tool directly in their web browser or computational notebooks and edit ML models with their own datasets at scale (§ 3.3). For a demo video of GAM Changer, visit https://youtu.be/D6whtfInqTc.
We hope our work helps emphasize the importance of human agency in responsible ML research, and inspires and informs future work in human-AI interaction and actionable ML interpretability.
2. Background & Related Work
Generalized additive models (GAMs) have emerged as a popular model class among the data science community. GAMs’ predictive performance is on par with complex black-box models (Wang et al., 2020), yet GAMs remain simple enough for humans to understand their decision process (Chang et al., 2021). Given an input with features and a target , a GAM can be written as:
| (1) |
Different link functions are appropriate for different tasks: we use the logit for binary classification and identity for regression. is the intercept. There are many options for shape functions , such as splines (Hastie and Tibshirani, 1999), gradient-boosted trees (Caruana et al., 2015), and neural networks (Agarwal et al., 2021). Some GAMs support pair-wise interaction terms .
GAMs are interpretable and editable because people can visualize and modify each feature ’s contribution to the model’s prediction by inspecting and adjusting the shape function ; is sometimes called the feature’s contribution score. Since GAMs are additive, we can edit different shape functions independently.
Model interpretability. Besides glass-box models like GAMs that are inherently interpretable (e.g., Zeng et al., 2017; Lakkaraju et al., 2016), ML researchers have developed post hoc explanation methods to interpret black-box models (e.g., Ribeiro et al., 2016; Lundberg and Lee, 2017) and have studied how interpretability methods are understood and used (e.g., Kaur et al., 2020; Hong et al., 2020; Wexler et al., 2019). Closely related to our work, researchers have developed visualization tools specific to GAMs like mgcViz (Fasiolo et al., 2020), Gamut (Hohman et al., 2019a), and TeleGam (Hohman et al., 2019b). Our work advances the interpretable ML landscape in making interpretability actionable by enabling users to interactively fix their models.
Model modification. Although being able to modify models leads to greater trust and better human-AI team performance (Dietvorst et al., 2018), research in model modification is relatively nascent. By manipulating certain important neurons, researchers can modify a few semantic concepts in generated images (Bau et al., 2020), control some text translation styles (Bau et al., 2019), and induce basic concepts in text generation (Suau et al., 2020). However, these works rely on post hoc explanations—users can only affect a small subset of model behaviors, and modifications are likely to have unknown effects. Grounded in accurate and complete interpretations from glass-box models, GAM Changer is the first system that empowers users to have total control of their model’s behavior and observe full editing effects—enabling them to easily and safely improve ML models in potentially high-stakes settings.
User interface for GAM Changer
3. Novel User Experience
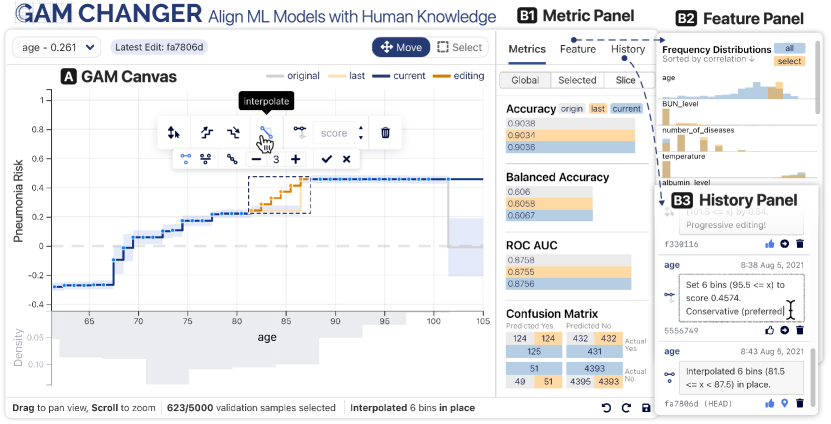
To lower barriers to controlling ML model behavior (Introduction), GAM Changer (Fig. 2) adapts easy-to-use direct manipulation interface patterns to edit the parameters of GAMs with a variety of editing tools (§ 3.1). To promote responsible edits (Introduction), our tool provides real-time feedback; all edits are reversible, and users can document and compare their edits (§ 3.2). Built with modern web technologies, our tool is accessible and scalable (§ 3.3).
3.1. Intuitive and Flexible Editing
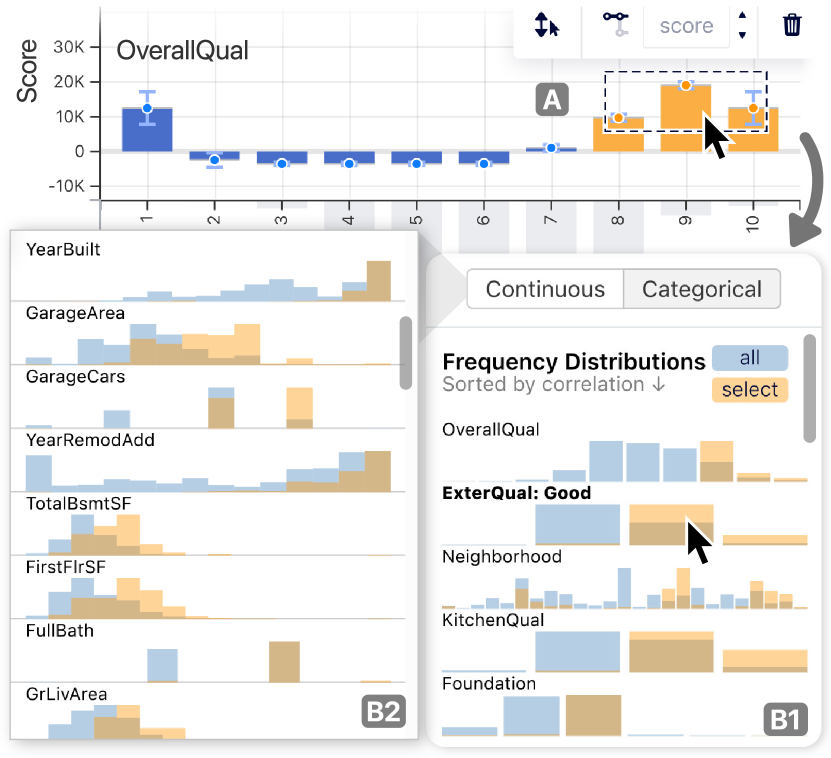
The GAM Canvas (Fig. 2A) is the main view of GAM Changer, where we visualize one input feature ’s contribution to the model’s prediction by plotting its shape function . Users can select a drop-down to transition across features. GAMs usually discretize continuous variables into finite bins, so that shape functions can easily capture complex non-linear relationships. Thus, the output of shape functions is a continuous piecewise constant function, where we use a dot to show the start of each bin and a line to encode the bin’s constant score (Fig. 2A). For categorical features, we represent each bin as a bar whose height encodes the bin’s score (Fig. S3B). Lines and bins are colored by editing status (e.g., original or edited).
Model direct manipulation.
In the GAM Canvas, users can zoom-and-pan to control their viewpoint in the move mode, or use marquee selection to select a region of the shape function to edit in the select mode (Fig. 2A).
Once a region is selected, the Context Toolbar appears: it affords a variety of editing tools represented as icon buttons.
Clicking a button changes the shape function in the selected region.
For example, the monotonicity tool ![]() can transform the selected interval of the shape function into a monotonically increasing function.
Internally, GAM Changer fits an isotonic regression (Barlow, 1972) weighted by the bin counts to determine a monotone function with minimal changes.
Other editing tools include interpolating
can transform the selected interval of the shape function into a monotonically increasing function.
Internally, GAM Changer fits an isotonic regression (Barlow, 1972) weighted by the bin counts to determine a monotone function with minimal changes.
Other editing tools include interpolating ![]() scores of selected bins, dragging
scores of selected bins, dragging ![]() to adjust scores, and aligning
to adjust scores, and aligning ![]() scores to the most left or right bin (see GAM Canvas for details).
scores to the most left or right bin (see GAM Canvas for details).
3.2. Safe and Responsible Editing
Guarding against harmful edits is our top priority. To begin using GAM Changer, users provide a trained GAM (i.e., model weights) and set of validation samples (a subset of the training data or separate validation set). The Metric Panel (Fig. 2-B1) provides real-time and continuous feedback on the model’s performance on the validation samples to help users identify the effects of their edits. During a user’s editing process, our tool efficiently recomputes performance metrics on the edited model. To probe if an edit is equitable across different subgroups, users can choose which subset of samples to measure performance on: the Global Scope for all samples, the Selected Scope for samples in the selected region, and the Slice Scope for samples having a specific categorical value (e.g., females).
Recognize impact disparities. The Feature Panel (Fig. 2-B2) helps users gain an overview of correlated features and elucidates potential disparities in the impact of edits. For example, it can alert users of the disproportionate impact of edits addressing elder patients on females as females live longer. We develop linking+reordering—a novel method to identify correlated features. Once a user selects a region in the GAM Canvas, we look up affected samples’ associated bins across all features. For each feature, we compute the distance between the bin count frequency in all training data and the frequency in affected samples. By observing overlaid histograms sorted in descending order of the distance scores, users can inspect correlated features of affected samples and identify potential editing effect disparity (see GAM Canvas for details).
Reversible and documented modifications.
To promote safe model editing, GAM Changer allows users to undo and redo any edits (see Metric Panel for details).
In addition, the History Panel (Fig. 2-B3) tracks all edits and displays each edit in a list.
Inspired by the version control system Git, we save each edit as a commit—a snapshot of the underlying GAM weights.
Each commit has a timestamp, a unique identifier, and a commit message.
Therefore, users can easily explore model evolution by checking out ![]() a previous GAM version, discard
a previous GAM version, discard ![]() modifications, and document edit contexts and motivations in commit messages.
Once satisfied with their edits, a user can save the modified model with edit history for deployment or future continuing editing.
To help users identify editing mistakes and promote accountable edits, GAM Changer requires users to examine and confirm
modifications, and document edit contexts and motivations in commit messages.
Once satisfied with their edits, a user can save the modified model with edit history for deployment or future continuing editing.
To help users identify editing mistakes and promote accountable edits, GAM Changer requires users to examine and confirm ![]() all edits before saving the model.
all edits before saving the model.
3.3. Scalable, Open-source Implementation
GAM Changer is a web-based GAM editor that users can access with any web-browsers on laptops or tablets, or directly in computational notebooks. Our tool has been integrated into the popular ML interpretability ecosystem InterpretML (Nori et al., 2019): users can easily export models to edit and load modified models. Using cutting-edge WebAssembly to accelerate in-browser model inference and isotonic regression fitting, our tool is scalable: all computations are real-time with up to 5k validation samples in Firefox on a MacBook, and the sample size is only bounded by the browser’s memory limit. We open source GAM Changer so that future researchers can easily generalize our design to other forms of model editing.
4. Impacts to physicians
GAM Changer in action. The early prototype (Wang et al., 2021) of our tool has received overwhelmingly positive feedback in two physician-focused workshops.333We presented our work-in-progress in the American Association of Physicists in Medicine Practical Big Data Workshop, and the NeurIPS Workshop on Bridging the Gap: From Machine Learning Research to Clinical Practice, both without proceedings. In addition, physicians have begun to use our tool to interpret and edit medical models. We share examples in which two physicians in our research team apply GAM Changer to investigate and improve GAMs for sepsis (§ 4.1) and pneumonia (§ 4.2) risk predictions, editing the models to reflect their clinical knowledge and values such as safety. The edited sepsis risk prediction model will be adapted for use in a large hospital.
4.1. Fixing Sepsis Risk Prediction
A physician in our team trained a GAM with boosted-trees to predict if pediatric patients should receive sepsis treatments. This model exhibited many problematic patterns. In this section, we share our experience in applying GAM Changer to align this model’s behavior with the physician’s clinical knowledge and values.
The data comes from a large hospital; it includes 26,564 pediatric patients. There are 7 continuous features: , , , systolic and diastolic , , and . The , , and are normalized by taking the difference between the original value and the age-adjusted normal. The other 83 features are categorical with binary values, each indicating if a keyword—such as “pain,” “fever,” or “fall”—is present in the chief complaint of patient, a concise statement describing the symptom, diagnosis, and other reasons for a medical encounter. The target variable is binary: 1 if the patient received a treatment for sepsis and 0 if not. The model yields an AUC score of 0.865 on the test set (20% of all data). The physician loads GAM Changer in their browser with 5,000 random training samples; they share their computer screen with 3 other researchers in the team via video-conferencing software. All edits are made by the physician after discussing with other researchers on the call.
User interface for GAM Changer
 around 96∘F, flatten the risk
  to reflect a treatment effect, and smooth out risk fluctuations
  at high temperature.
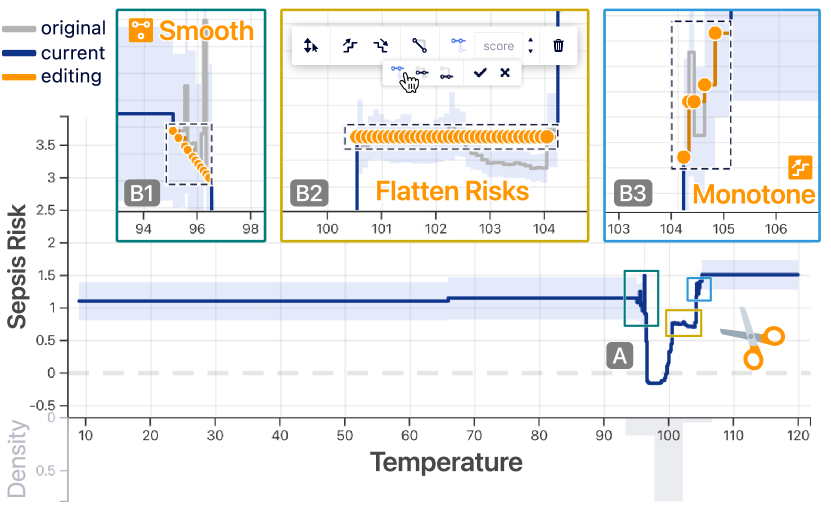
4.1.1. Editing the temperature feature.
The GAM Canvas first shows (Fig. 3A) since this feature has the highest importance score, computed as the weighted average of a feature’s absolute contribution scores.
The x-axis ranges from 10 to 120∘F, where the low range is due to data errors.
The y-axis encodes the predicted risk score (log odds) of dying from sepsis, ranging from -0.2 to 1.5.
The shape function has a “U-shape”: the model predicts that patients with lower and higher than the normal range (97–99∘F) have a higher risk of sepsis.
It matches clinical knowledge as fever (high ) and hypothermia (low caused by cardiovascular collapse) are severe symptoms of sepsis.
There is a peak of predicted risk when the is around 96∘F.
However, there is no physiological reason that hypothermia with a of 96∘F has a higher risk than a of 95∘F.
Therefore, we remove the risk peak at 96∘F by linearly interpolating ![]() the risk scores from 95 to 96.5∘F (Fig. 3-B1).
the risk scores from 95 to 96.5∘F (Fig. 3-B1).
There is a plateau of risk scores from 100–104∘F, with a small, but notable dip from 103–104∘F.
The presence of the plateau itself is physiologically plausible (due to antipyretic treatments), but the dip is hard to explain and suspicious, perhaps reflecting a treatment effect in which treatment is delayed outside of the model’s prediction window as physicians evaluate the child’s response to antipyretics.
Because of a concern that this might artificially depress risk scores and encourage physicians to believe that children in this range are healthier than they really are, the risk curve in this region is flattened using the align tool ![]() (Fig. 3-B2).
(Fig. 3-B2).
Similarly, the observation of many small dips of predicted risk scores around 104–105.5∘F does not align with physiological knowledge.
Therefore, we remove these dips by making the scores monotonically increasing ![]() in this region by fitting an isotonic regression model.
The physician in our team thinks this edit is conservative and safe because it smooths out many dips in the region that might cause patients to lose necessary care.
The physician comments “Taking out unpredictable behaviors from a model to my mind is deeply safer. If this ends up being a life and death decision, and we go back, and we look that a kid died because he didn’t trigger the model by falling into one of those dips, then that is a catastrophe.”
in this region by fitting an isotonic regression model.
The physician in our team thinks this edit is conservative and safe because it smooths out many dips in the region that might cause patients to lose necessary care.
The physician comments “Taking out unpredictable behaviors from a model to my mind is deeply safer. If this ends up being a life and death decision, and we go back, and we look that a kid died because he didn’t trigger the model by falling into one of those dips, then that is a catastrophe.”
User interface for GAM Changer
 and removing risk fluctuations with monotonicity
  .
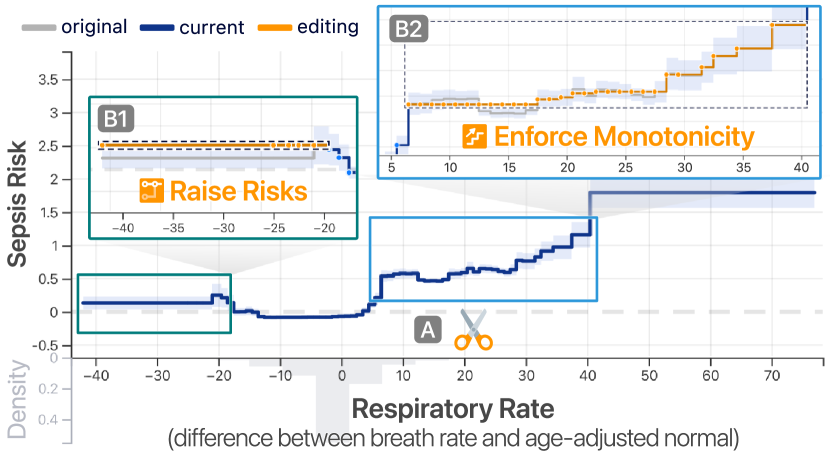
.4.1.2. Editing the respiratory rate feature.
The feature measures the difference between the number of breaths taken in one minute and its age-adjusted normal. The “U-shape” in the GAM Canvas (Fig. 4A) suggests the model predicts that patients with high deviation from the normal respiratory rate range have a higher risk of sepsis, and higher yields a higher risk score than lower . This pattern matches the clinical knowledge. Interestingly, the center of the “U-shape” is around -5 instead of 0. This also makes sense because the “normal range” of respiratory rate for adults is considered 12–20 times a minute, but healthy adults actually only take 12–15 breaths per minute. In other words, this left-shifted center indicates the model has learned a realistic distribution of respiratory rate.
The predicted risk decreases when is below -21, for which there is no physiological explanation.
We decide to remove this counterintuitive risk decrease by flattening ![]() all scores below -21 (Fig. 4-B1).
After this edit, we notice some fluctuations on the right side of the “U-shape.”
Clinical knowledge suggests sepsis risk should only increase when increases for rates which are already above normal.
To fix the counterintuitive pattern in the model, we make the risk scores monotonically increasing
all scores below -21 (Fig. 4-B1).
After this edit, we notice some fluctuations on the right side of the “U-shape.”
Clinical knowledge suggests sepsis risk should only increase when increases for rates which are already above normal.
To fix the counterintuitive pattern in the model, we make the risk scores monotonically increasing ![]() for bins between 7 and 40 (Fig. 4-B2).
for bins between 7 and 40 (Fig. 4-B2).
![[Uncaptioned image]](/html/2206.15465/assets/x27.png)
An alternative edit is to linearly interpolate ![]() the scores of bins from 7 to 40 (shown on the right).
However, we prefer the former edit, because linear interpolation
the scores of bins from 7 to 40 (shown on the right).
However, we prefer the former edit, because linear interpolation ![]() would break the plateau of predicted risk when is between 8 and 28, which are values that are commonly associated with children suffering from mild to moderate obstructive lung pathologies such as bronchiolitis and asthma, neither of which are likely to require treatment for suspected sepsis.
Removing this pattern might obscure a meaningful signal—there are many non-sepsis related reasons for moderately elevated respiratory rate.
Compared to the linear interpolation tool
would break the plateau of predicted risk when is between 8 and 28, which are values that are commonly associated with children suffering from mild to moderate obstructive lung pathologies such as bronchiolitis and asthma, neither of which are likely to require treatment for suspected sepsis.
Removing this pattern might obscure a meaningful signal—there are many non-sepsis related reasons for moderately elevated respiratory rate.
Compared to the linear interpolation tool ![]() , the monotone increasing tool
, the monotone increasing tool ![]() is much less intrusive: it makes minimal changes to make the selected region monotone via isotonic regression.
is much less intrusive: it makes minimal changes to make the selected region monotone via isotonic regression.
User interface for GAM Changer
 , and smooth out the sudden risk increase
  .
.
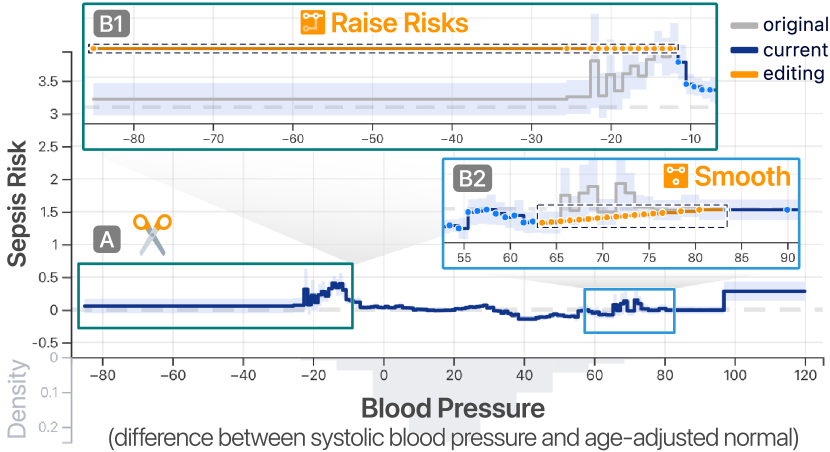
4.1.3. Editing the systolic blood pressure feature.
The feature measures the difference between the systolic blood pressure in millimeters of mercury and its age-adjusted normal.
The GAM Canvas (Fig. 5A) shows that the model predicts patients with from -25 to -10 to have a significantly higher risk of sepsis.
Interestingly, the predicted risk score decreases when decreases after peaking at -15.
The GAM Canvas shows only 19 patients out of 5000 patients with below -20, and 118 patients with from -20 to -10.
Clinical knowledge suggests that when blood pressure readings move away from the typical range, both the odds of having a measurement artifact and the risk of sepsis increase.
To create a safer model, we select all the bins below -15 and align ![]() their risk score to the right (Fig. 5-B1).
Although by doing so, we raise the predicted risk score of all bins below -15 to 0.38, this is a conservative edit as we do not further increase the risk when decreases after -15.
Here below -20 is most likely an error, and this edit might increase false-positive predictions on incorrect inputs.
However, the physician prefers this model to predict data errors and outliers as high risk, because it is safer to have a high false-positive rate than to have a high false-negative rate when predicting sepsis risk.
When editing healthcare models, physicians often consider the tradeoff between false-positive and false-negative rates, and the sweet spot for the tradeoff varies for different healthcare models (see § 6 for more discussion).
their risk score to the right (Fig. 5-B1).
Although by doing so, we raise the predicted risk score of all bins below -15 to 0.38, this is a conservative edit as we do not further increase the risk when decreases after -15.
Here below -20 is most likely an error, and this edit might increase false-positive predictions on incorrect inputs.
However, the physician prefers this model to predict data errors and outliers as high risk, because it is safer to have a high false-positive rate than to have a high false-negative rate when predicting sepsis risk.
When editing healthcare models, physicians often consider the tradeoff between false-positive and false-negative rates, and the sweet spot for the tradeoff varies for different healthcare models (see § 6 for more discussion).
The risk score of sepsis fluctuates when systolic is around 60–80.
There is no physiological explanation for this fluctuation, so we smooth it out by linearly interpolating ![]() these scores.
Interestingly, there is a sudden increase in the predicted risk score when is higher than 95, where these inputs are most likely errors.
Therefore, we decide not to edit this increase because it is safer to have a high false-positive rate than to have a high false-negative rate on a sepsis risk prediction model.
these scores.
Interestingly, there is a sudden increase in the predicted risk score when is higher than 95, where these inputs are most likely errors.
Therefore, we decide not to edit this increase because it is safer to have a high false-positive rate than to have a high false-negative rate on a sepsis risk prediction model.
4.2. Repairing Pneumonia Risk Prediction
KDD researchers (Caruana et al., 2015) have identified problematic patterns in pneumonia risk prediction models and raised the possibility to fix these patterns via model editing. With GAM Changer, we operationalize this possibility by editing the same model (Caruana et al., 2015) with a physician in our research team. This GAM is trained to predict a patient’s risk of dying from pneumonia. The dataset includes 14,199 pneumonia patients; it has 46 features: 19 are continuous and 27 are categorical. The outcome variable is binary: 1 if the patient died of pneumonia and 0 if they survived. The AUC score on the test set (30% of data) is 0.853. One ML researcher in our team loads GAM Changer in their browser with 5,000 random training samples; they share their computer screen with a physician and 2 other researchers in the team via video-conferencing software. All edits are made by the ML researcher after discussing with all people in the call.
User interface for GAM Changer, featuring four tightly integrated views: GAM Canvas, Metric Panel, Feature Panel, and History Panel
 , we smooth out the abrupt increase of risk.
We use the align tool
, we smooth out the abrupt increase of risk.
We use the align tool  to raise the risk score for older patients.
4.2.1. Editing the age feature.
After loading GAM Changer, the GAM Canvas (Fig. 6A) first displays , which has the highest importance score.
The x-axis ranges from 18 to 106 years old.
The y-axis encodes the predicted risk score (log odds) of dying from pneumonia.
It ranges from a score of -0.4 for patients in their 20s to 0.5 for patients in their 90s.
The model predicts that younger patients have a lower risk than older patients.
However, the risk suddenly plunges when patients pass 100—leading to a similar risk score as if the patient is 30 years younger!
It might be due to outliers in this range, especially as this range has a small sample size, or patients who live this long might have “good genes” to recover from pneumonia.
To identify the true impact of on pneumonia risk, additional causal experiments and analysis are needed.
Without robust evidence that people over 100 are truly at lower risk, physicians fear that they would be injuring patients by depriving needy older people of care, and violating their primary obligation to do no harm.
Therefore, physicians would like to fix this pattern.
We apply a conservative remedy by setting ![]() the risk of older patients to be equal to that of those slightly younger (Fig. 6-B2).
the risk of older patients to be equal to that of those slightly younger (Fig. 6-B2).
![[Uncaptioned image]](/html/2206.15465/assets/x45.png)
From the Metric Panel, we notice a drop of accuracy of 0.0004 in the Global Scope, and the confusion matrix in the Selected Scope shows that this edit causes the model to misclassify two negative cases as positives out of 28 patients who would be affected by the edit. To learn more about these patients, we observe the Feature Panel, which shows that is the second most correlated categorical feature with the selected range (shown on the right). It means patients who are affected by this edit are disproportionally female—it makes sense because on average women live longer than men. Seeing the correlated features helps us be aware of potential fairness issues during model editing.
Besides the problematic drop of risk for older patients, the risk suddenly rises around 86 years old (Fig. 6A).
After converting the risk score from log-odds to probability, the predicted likelihood of dying from pneumonia increases by when the goes from 86 to 87.
This model behavior can cause 81–86 year-old patients to miss the care they need.
To create a safer model, we apply the linear interpolation tool ![]() in the region from 81 to 87 to smooth out the sudden increase of pneumonia risk (Fig. 6-B1).
in the region from 81 to 87 to smooth out the sudden increase of pneumonia risk (Fig. 6-B1).
User interface for GAM Changer, featuring four tightly integrated views: GAM Canvas, Metric Panel, Feature Panel, and History Panel
 .
.
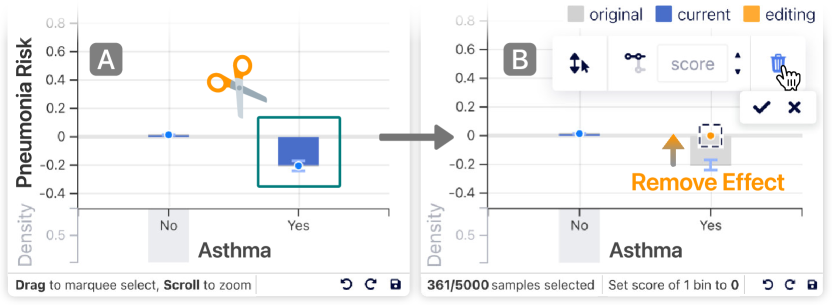
4.2.2. Editing the asthma feature.
The GAM Canvas (Fig. 7A) of the binary feature suggests the model predicts asthmatic patients to have a lower risk of pneumonia than non-asthmatic patients.
It could be because pneumonia patients with a history of asthma are likely to receive care earlier and receive more intensive care.
However, if we use this model to make hospital admission decisions, this pattern might cause asthmatic patients to miss necessary care.
Therefore, we remove ![]() the predictive effect of having (Fig. 7B)—the new model would predict asthmatic patients to have an average risk.
This is a conservative edit as one might argue that asthmatic patients should have higher risk of pneumonia.
Our edit is a step in the right direction, but further experiments are needed to see if we need further adjustments.
the predictive effect of having (Fig. 7B)—the new model would predict asthmatic patients to have an average risk.
This is a conservative edit as one might argue that asthmatic patients should have higher risk of pneumonia.
Our edit is a step in the right direction, but further experiments are needed to see if we need further adjustments.
5. Impacts beyond healthcare
Evaluation with data scientists. We conducted a user study to further evaluate the usability and usefulness of GAM Changer, and also to investigate how data scientists would use our tool in practice. In the study, we chose a loan default prediction model in a lending scenario, because there is no specialized knowledge needed to interpret and potentially edit this model. The authors’ Institutional Review Board (IRB) has approved this study.
5.1. Study Design
Participants. The target users of GAM Changer are ML practitioners and domain experts who are familiar with GAM models. Therefore, we recruited 7 data scientists (P1–P7) for this study by posting advertisements444Participant recruitment: https://github.com/interpretml/interpret/issues/283 on the online issue board of a popular GAM Library (Nori et al., 2019). The participation was voluntary, and we did not collect any personal information. All participants have developed GAMs for work: three participants use GAMs multiple times a week (P1, P5, P6), three use them a few times a month (P2, P3, P4), and one uses them about once a month (P7). Four participants work in finance (P1, P2, P3, P7), two work in healthcare (P4, P5), and one works in media (P6). Each study lasted about 1 hour, and we compensated each participant with a $25 Amazon Gift card.
Procedure. We conducted the study with participants one-on-one through video-conferencing software. With permission from all participants, we recorded the video conference for subsequent analysis. After signing a consent form and a background questionnaire (e.g., familiarity with GAMs), each participant was given an 8-minute tutorial about GAM Changer. Participants then were pointed to a website consisting of GAM Changer with a model trained on the LendingClub dataset (Len, 2018) to predict if a loan applicant can pay off the loan: the outcome variable is 1 if they can and 0 otherwise (see ‡ C for details). Participants were given a list of recommended tasks to look for surprising patterns, edit 3 continuous features and 2 categorical features with different editing tools, experiment with different views, and freely explore the tool. Participants were told that the list was a guide to help them try out all features in the tool, and they were encouraged to freely edit the model as seen fit. Participants were asked to think aloud and share their computer screens with us. Each session ended with a usability survey and a semi-structured interview that asked participants about their experience of using GAM Changer and if this tool could fit their workflow and help them improve models in practice.
5.2. Benefits to Data Scientists
Below we summarize key findings from our observations and participants’ qualitative feedback.
5.2.1. Meet the pressing needs for model editing
Through analyzing interviews and participants’ verbalization of thoughts during the exploration task, we find there are critical needs for model editing in practice, and ML practitioners have already been editing their models with different methods. All participants have observed counterintuitive patterns when developing models in their work. For example, P6 recalled their GAM model, “Some weights are negative, and I know by definition this cannot happen because [… of the nature of that feature].” P7 commented “[Strange patterns] happen a lot, mostly the direction of a certain variable. We expect the score to be increasing; however, the model shows something opposite.”
Many participants were required to fix these strange patterns. P3 and P7 needed to remove counterintuitive patterns because of the Adverse Action Notice Requirement, a policy requiring lenders to provide explanations to loan applicants. If there are strange patterns, the model explanations sometimes will not make sense to loan applicants. P7 explained, “Basically you want to make the model easier to explain in adverse action calls.” Adverse action calls refer to situations when applicants dial in and demand real-time model explanations. On the other hand, P5 and P6 needed to edit their models on some well-understood features to align model behaviors with the expectations of knowledgeable stakeholders—physicians and business partners, respectively. In addition, P1 edited their models because they found enforcing monotonicity and removing small bumps had improved model accuracy in deployment.
Improve and unify current editing approaches. Most participants reported using feature engineering to fix counterintuitive patterns in their own day-to-day work. For example, after discussing with domain experts, P5 removed features where they thought the shape functions were wrong or did not make sense. In P7’s case, a legal compliance team would decide which features to include and exclude after inspecting the model behaviors. P2 trained multiple models with different hyper-parameters and then chose models that not only had high accuracy but also learned expected trends. P1 had set up a sophisticated post-processing pipeline that would automatically smooth out shape functions, enforce monotonicity, and remove predictive effects on missing values. With interactivity and flexible tools, GAM Changer provided participants with direct control of their model behaviors and unify current editing approaches.
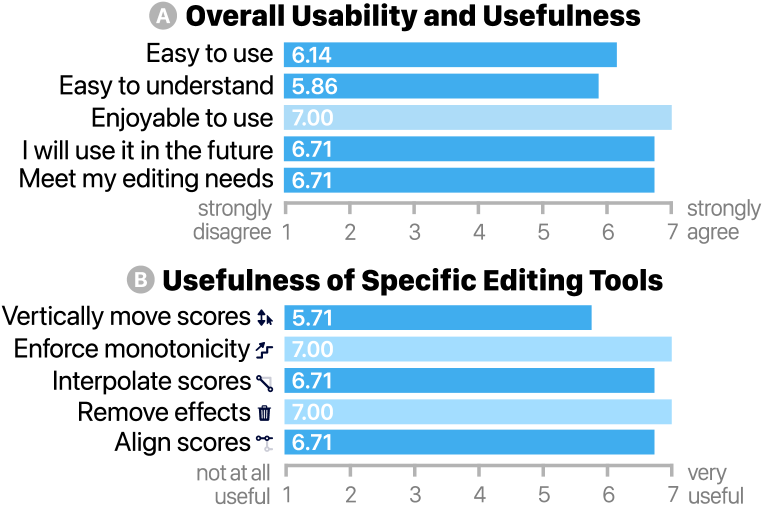
5.2.2. Usable and useful
The study survey included a series of 7-point Likert-scale questions regarding the usability and usefulness of GAM Changer (Fig. 8A). The results suggest that the tool is easy to use (average 6.14), easy to understand (average 5.86), and especially enjoyable to use (average 7.00—all participants gave the highest rating). Most participants would like to use GAM Changer in their work to edit models. For example, P6 commented “I have the dire hope that it will be a groundbreaking experience. […] I strongly believe that this interactive model editing will please a lot of stakeholders, and increases trust and acceptance.”
 \Description
User interface for GAM Changer
Versatile editing tools.
We asked participants to rate specific editing tools in GAM Changer (Fig. 8B).
All tools were rated favorably, and participants particularly liked the monotonicity tool ![]() and deletion tool
and deletion tool ![]() (both received the highest rating from all participants).
Monotonicity constraints are common across different domains, which might explain the high interest in the monotonicity tool.
In particular, P4 appreciated that the monotonicity tool supported regional monotonicity: P4 gave an example from his work where the relationship between the and people’s was expected to form a “U-shape” (kids and seniors tend to have more insurance claims), and he would like to use our tool to enforce monotonicity with different directions
(both received the highest rating from all participants).
Monotonicity constraints are common across different domains, which might explain the high interest in the monotonicity tool.
In particular, P4 appreciated that the monotonicity tool supported regional monotonicity: P4 gave an example from his work where the relationship between the and people’s was expected to form a “U-shape” (kids and seniors tend to have more insurance claims), and he would like to use our tool to enforce monotonicity with different directions ![]()
![]() on the two ends of the shape function.
Unlike the monotonicity tool, the deletion tool
on the two ends of the shape function.
Unlike the monotonicity tool, the deletion tool ![]() had a much simpler functionality, and yet it was participants’ favorite.
P7 liked the deletion tool because it was useful to edit categorical features, “For missing values and neutral values [in categorical features], we don’t want to reward them, and we don’t want to punish them, so we usually just neutralize them [with the deletion tool].”
Participants’ overwhelmingly positive feedback provides evidence that GAM Changer is easy to use, and it can help practitioners improve their ML models through model editing.
had a much simpler functionality, and yet it was participants’ favorite.
P7 liked the deletion tool because it was useful to edit categorical features, “For missing values and neutral values [in categorical features], we don’t want to reward them, and we don’t want to punish them, so we usually just neutralize them [with the deletion tool].”
Participants’ overwhelmingly positive feedback provides evidence that GAM Changer is easy to use, and it can help practitioners improve their ML models through model editing.
5.2.3. Fit into model development workflows
Interviews with participants highlight that GAM Changer fits into data scientists’ workflows. Five participants used Jupyter notebooks to develop ML models, and they all appreciated that they could use GAM Changer directly in their notebooks. Many participants found the “git commit” style of editing history in the History Panel (§ 3.2) familiar and useful. When P6 wrote edit commit messages, they followed their company’s git commit style to include their name and commit type at the end of the message. In addition, P3 found the editing history and auto-generated messages helpful for their company’s model auditing process, “I especially like the history panel where all the edits are tracked. You can technically use it as a reference when writing your model documentation [for auditors to review].”
A platform for collaboration. Interestingly, many participants commented that besides model editing, GAM Changer would be a helpful tool to communicate and collaborate with different stakeholders. For example, P5’s work involved collaborating with physicians to interpret models, and they thought our tool would be a tangible tool to promote discussion about models: “This work is very important because it lets people discuss about it [model behaviors].” P1 had been building dashboards to explain models to their marketing teams, and they would like to use GAM Changer to facilitate the communication. Similarly, P6 told us they would use our tool to communicate model insights to their stakeholders, including business partners, UX designers, and the sales team.
5.2.4. Diverse ways to use GAM Changer
Even with a relatively small sample size of 7 participants, we observed a wide spectrum of views regarding when and how to edit models. For example, P2 was more conservative about interactive model editing; they felt it was more “objective” to retrain the model until it learned expected patterns rather than manually modifying the model. P3 thought GAM Changer would be useful to enforce monotonicity and fix obvious errors, but they were more cautious and worried about irresponsible edits: “Anyone behind the model can just add whatever relationship they want, rather than keep the model learn empirically whatever is in the data. I mean, it [the tool] is good, but you need to be diligent and make sure whatever changes you made make sense and are justifiable.” On the other side of the spectrum, P5 and P6 found model editing with GAM Changer very natural as they had already been iterating on models with domain experts.
![[Uncaptioned image]](/html/2206.15465/assets/x57.png)
Multiple approaches.
In addition to whether and when people should edit models, participants had different views on how to edit the model.
For example, in the model used in this user study, debt to income ratio () is a continuous feature (shown on the right): the log odds score (y-axis) of an applicant paying off their loan first increases when (x-axis) increases from 0% to 3% (area A); after a plateau (area B), the score then decreases when increases from 8% to 40% (area C).
One suggested task is to increase the score for low in area A.
Five participants (P1, P2, P3, P4, and P7) commented the trend in area A made sense—applicants in this range are likely people who have no or little loan experience and thus less likely to pay off the loan in time.
Although the pattern made sense to P3 and P7, they agreed that one should fix it;
P3 and P7 raised the score by aligning ![]() all scores in area A to be the same as area B.
P3 explained: “[Although the pattern in area A makes sense,] we’ll still try to make this relationship monotonic. For the relationship that I described, like somebody is less experienced with the credit and other stuff, there are other variables that will factor in, like the number of accounts open.”
P7 made the same edit but with a different reason: “We do not want a model to punish people with no debt.”
In contrast to P3 and P7, P4 said they were uncomfortable with raising the scores in area A, and they would need to talk to finance experts if they were editing this model in practice.
P1 also decided to keep the trend in area A.
Additionally, P1 applied the interpolation tool
all scores in area A to be the same as area B.
P3 explained: “[Although the pattern in area A makes sense,] we’ll still try to make this relationship monotonic. For the relationship that I described, like somebody is less experienced with the credit and other stuff, there are other variables that will factor in, like the number of accounts open.”
P7 made the same edit but with a different reason: “We do not want a model to punish people with no debt.”
In contrast to P3 and P7, P4 said they were uncomfortable with raising the scores in area A, and they would need to talk to finance experts if they were editing this model in practice.
P1 also decided to keep the trend in area A.
Additionally, P1 applied the interpolation tool ![]() to smooth the score increase in area A and decrease in area C, because P1 believed small bumps in area A and area C are due to overfitting.
Participants’ diverse views on whether, when, and how to edit models highlight that users with different backgrounds may use GAM Changer differently in practice.
to smooth the score increase in area A and decrease in area C, because P1 believed small bumps in area A and area C are due to overfitting.
Participants’ diverse views on whether, when, and how to edit models highlight that users with different backgrounds may use GAM Changer differently in practice.
6. Discussion and Future Work
Reflecting on our iterative design of GAM Changer with diverse stakeholders, model editing experiences with physicians, and an evaluation with data scientists in various domains, we distill lessons and future directions for model editing and interpretability research.
Promote accountable edits & develop guidelines. Our user study shows model editing via feature engineering and parameter tuning is already common practice in data scientists’ workflow (§ 5.2.1). As the first interactive model editing tool, GAM Changer lowers the barrier to modifying model behaviors to reflect users’ domain knowledge and values. We find different users could have distinct views on whether, when, and how to edit models (§ 5.2.4). Some users might raise concerns that GAM Changer makes model editing too easy, and that irresponsible edits could potentially cause harm (e.g., P3 in § 5.2.4). Guarding against harmful edits is our top priority—we provide users with continuous feedback (§ 3.1), as well as transparent and reversible edits (§ 3.2). However, they do not guarantee to prevent users from overfitting the model, injecting harmful bias, or maliciously manipulating model predictions. This potential vulnerability warrants further study on how to audit and regulate model editing.
To help “model editors” modify ML models responsibly, we see a pressing need of guidelines that unify best practices in model editing. However, model editing is complex—whether, when, and how to edit a model depends on many factors, including the data, model’s behaviors, and end-tasks in a sociotechnical context. Take our sepsis risk prediction model as an example (§ 4.1); we inform our edit decisions by considering treatment effects, the potential impact of edits, and physicians’ values. We make specific edits because physicians prefer false positives over false negatives when predicting sepsis risks—we will make different edits if false negatives are favored. For example, in prostate cancer screenings, false positives are much riskier than false negatives (Croswell et al., 2010). Therefore, we may prioritize lowering the predicted risk when fixing problematic patterns in a risk prediction model for prostate cancer. Using GAM Changer as a research instrument, we plan to develop editing guidelines by further research that engages with experts in diverse domains as well as people who would be impacted by edited models.
Measure real-life impacts. GAM Changer provides continuous feedback on model performance (§ 3.2). Due to the additive nature of GAMs, global metrics—computed on all validation samples—are not very sensitive to edits that slightly change a few bins of a single feature. An edit’s effect is more significant when we measure the accuracy locally, such as in the Selected Scope or the Slice Scope. The Metric Panel’s goal is to alert users of accidental edits that might demolish the model’s predictive power or disproportionally affect a subgroup in the data. However, GAM Changer’s ultimate goal is to help users create safer and more correct models—accuracy on the train and test sets is a secondary metric. To evaluate model editing, we need to measure edited models’ performance for their intended use. In high-stakes settings such as healthcare, editing would make a substantial impact if it changed a deployed model’s prediction on one patient. We plan to adapt the edited sepsis risk prediction model (§ 4.1) in a large hospital and conduct a longitudinal study to monitor and investigate the model’s performance.
Enhance collaborative editing. When using GAM Changer to edit healthcare models with physicians, we find the tool provides a unique collaborative experience for ML researchers and domain experts to discuss, interpret, and improve models together. Our user study echos this observation: (1) participants had been editing models through teaming with diverse stakeholders including domain experts, auditors, and marketing teams (§ 5.2.1); (2) participants appreciated GAM Changer as a platform to facilitate ML communication with various stakeholders (§ 5.2.3). Therefore, we would like to further enhance the tool’s affordance for collaborations. We plan to explore interaction techniques that support multiple users to edit the same model simultaneously (e.g., Google Slides). Also, we plan to enhance our Git-inspired editing history to support users to merge multiple independent edit series onto one model—enabling collaborators to easily edit a model asynchronously.
7. Conclusion
In this work, we present GAM Changer, an interactive visualization tool that empowers domain experts and data scientists to not only interpret ML models, but also align model behaviors with their knowledge and values. This open-source tool runs in web browsers or computational notebooks, broadening people’s access to responsible ML technologies. We discuss lessons learned from two editing examples and an evaluation user study. We hope our work helps emphasize the critical role of human agency in responsible ML research, and inspire future work in actionable ML interpretability.
Acknowledgements.
The first two authors were interns at Microsoft Research. We are grateful to Scott Lundberg, Steven Drucker, Adam Fourney, Saleema Amershi, Dean Carignan, Rob DeLine, Haekyu Park, the InterpretML team, and our study participants for their helpful feedback.References
- (1)
- Len (2018) 2018. Lending Club: Online Personal Loans. https://www.lendingclub.com/
- Agarwal et al. (2021) Rishabh Agarwal, Levi Melnick, Nicholas Frosst, Xuezhou Zhang, Ben Lengerich, Rich Caruana, and Geoffrey E Hinton. 2021. Neural Additive Models: Interpretable Machine Learning with Neural Nets. NeurIPS (2021).
- Barlow (1972) Richard E. Barlow. 1972. Statistical Inference under Order Restrictions: The Theory and Application of Isotonic Regression. Wiley, London, New York.
- Bau et al. (2019) Anthony Bau, Yonatan Belinkov, Hassan Sajjad, Nadir Durrani, Fahim Dalvi, and James Glass. 2019. Identifying and Controlling Important Neurons in Neural Machine Translation. In International Conference on Learning Representations.
- Bau et al. (2020) David Bau, Jun-Yan Zhu, Hendrik Strobelt, Agata Lapedriza, Bolei Zhou, and Antonio Torralba. 2020. Understanding the Role of Individual Units in a Deep Neural Network. PNAS (2020).
- Caruana et al. (2015) Rich Caruana, Yin Lou, Johannes Gehrke, Paul Koch, Marc Sturm, and Noemie Elhadad. 2015. Intelligible Models for HealthCare: Predicting Pneumonia Risk and Hospital 30-Day Readmission. KDD (2015).
- Chang et al. (2021) Chun-Hao Chang, Sarah Tan, Ben Lengerich, Anna Goldenberg, and Rich Caruana. 2021. How Interpretable and Trustworthy Are GAMs? KDD (2021).
- Croswell et al. (2010) Jennifer M. Croswell, David F. Ransohoff, and Barnett S. Kramer. 2010. Principles of Cancer Screening: Lessons From History and Study Design Issues. Seminars in Oncology (2010).
- De Cock (2011) Dean De Cock. 2011. Ames, Iowa: Alternative to the Boston Housing Data as an End of Semester Regression Project. Journal of Statistics Education (2011).
- Dietvorst et al. (2018) Berkeley J. Dietvorst, Joseph P. Simmons, and Cade Massey. 2018. Overcoming Algorithm Aversion: People Will Use Imperfect Algorithms If They Can (Even Slightly) Modify Them. Management Science 64, 3 (2018), 1155–1170.
- Fasiolo et al. (2020) Matteo Fasiolo, Raphaël Nedellec, Yannig Goude, and Simon N. Wood. 2020. Scalable Visualization Methods for Modern Generalized Additive Models. Journal of Computational and Graphical Statistics 29, 1 (2020), 78–86.
- Hastie and Tibshirani (1999) Trevor Hastie and Robert Tibshirani. 1999. Generalized Additive Models.
- Hohman et al. (2019a) Fred Hohman, Andrew Head, Rich Caruana, Robert DeLine, and Steven M. Drucker. 2019a. Gamut: A Design Probe to Understand How Data Scientists Understand Machine Learning Models. CHI (2019).
- Hohman et al. (2019b) Fred Hohman, Arjun Srinivasan, and Steven Drucker. 2019b. TeleGam: Combining Visualization and Verbalization for Interpretable Machine Learning. In IEEE VIS.
- Hong et al. (2020) Sungsoo Ray Hong, Jessica Hullman, and Enrico Bertini. 2020. Human Factors in Model Interpretability: Industry Practices, Challenges, and Needs. CSCW (2020).
- Kaur et al. (2020) Harmanpreet Kaur, Harsha Nori, Samuel Jenkins, Rich Caruana, Hanna Wallach, and Jennifer Wortman Vaughan. 2020. Interpreting Interpretability: Understanding Data Scientists’ Use of Interpretability Tools for Machine Learning. In CHI.
- Lakkaraju et al. (2016) Himabindu Lakkaraju, Stephen H. Bach, and Jure Leskovec. 2016. Interpretable Decision Sets: A Joint Framework for Description and Prediction. KDD (2016).
- Lou et al. (2012) Yin Lou, Rich Caruana, and Johannes Gehrke. 2012. Intelligible Models for Classification and Regression. KDD (2012).
- Lou et al. (2013) Yin Lou, Rich Caruana, Johannes Gehrke, and Giles Hooker. 2013. Accurate Intelligible Models with Pairwise Interactions. KDD (2013).
- Lundberg and Lee (2017) Scott M. Lundberg and Su-In Lee. 2017. A Unified Approach to Interpreting Model Predictions. NeurIPS (2017).
- Nori et al. (2019) Harsha Nori, Samuel Jenkins, Paul Koch, and Rich Caruana. 2019. InterpretML: A Unified Framework for Machine Learning Interpretability. arXiv (2019).
- Ribeiro et al. (2016) Marco Tulio Ribeiro, Sameer Singh, and Carlos Guestrin. 2016. ”Why Should I Trust You?”: Explaining the Predictions of Any Classifier. KDD (2016).
- Shneiderman (1983) Ben Shneiderman. 1983. Direct Manipulation: A Step Beyond Programming Languages. Computer 16, 8 (Aug. 1983), 57–69.
- Suau et al. (2020) Xavier Suau, Luca Zappella, and Nicholas Apostoloff. 2020. Finding Experts in Transformer Models. arXiv (2020).
- Wall et al. (2017) Emily Wall, Leslie M. Blaha, Lyndsey Franklin, and Alex Endert. 2017. Warning, Bias May Occur: A Proposed Approach to Detecting Cognitive Bias in Interactive Visual Analytics. VAST (2017).
- Wang et al. (2020) Caroline Wang, Bin Han, Bhrij Patel, Feroze Mohideen, and Cynthia Rudin. 2020. In Pursuit of Interpretable, Fair and Accurate Machine Learning for Criminal Recidivism Prediction. arXiv (2020).
- Wang et al. (2021) Zijie J. Wang, Alex Kale, Harsha Nori, Peter Stella, Mark Nunnally, Duen Horng Chau, Mihaela Vorvoreanu, Jennifer Wortman Vaughan, and Rich Caruana. 2021. GAM Changer: Editing Generalized Additive Models with Interactive Visualization. arXiv (2021).
- Wexler et al. (2019) James Wexler, Mahima Pushkarna, Tolga Bolukbasi, Martin Wattenberg, Fernanda Viegas, and Jimbo Wilson. 2019. The What-If Tool: Interactive Probing of Machine Learning Models. TVCG (2019).
- Zeng et al. (2017) Jiaming Zeng, Berk Ustun, and Cynthia Rudin. 2017. Interpretable Classification Models for Recidivism Prediction. In Journal of the Royal Statistical Society.
Appendix A GAM Changer User Interface
For reproducibility, we discuss the design and implementation of GAM Changer in detail. The tool’s interface is based on our early prototype (Wang et al., 2021). We use a GAM regression model trained on the public Iowa house price dataset (De Cock, 2011) to illustrate the interface.
A.1. GAM Canvas
![[Uncaptioned image]](/html/2206.15465/assets/x60.png)
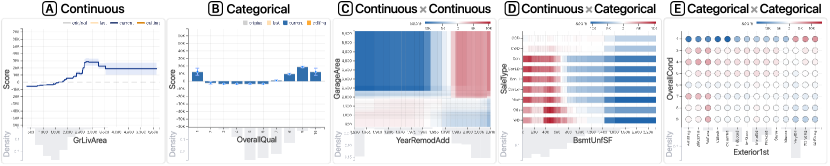
In the GAM Canvas (Fig. 2A), users can inspect and direct manipulate shape functions. As GAMs support continuous and categorical features, as well as their two-way interactions, we design unique visualization for each variable type, featuring line chart, bar chart, heatmaps, and scatter plots (Fig. S3). Users can use the feature selection drop-down to transition across features. To begin, the GAM Canvas shows the feature with the highest importance score, computed as the weighted average of a feature’s absolute contribution scores. We re-center the contribution scores by adjusting the intercept constant (Equation 1) such that the mean prediction for each feature has a zero score across the training data. Thus, a positive score suggests the feature positively affects the prediction and vice versa. Consider a GAM trained to predict house prices (Fig. S3A), if the living area is larger than 2000 square feet, it increases the predicted house price, while areas lower than 2000 decrease the predicted value compared with average. We highlight the -baseline as a thick dashed line.
 \Description
User interface for GAM Changer
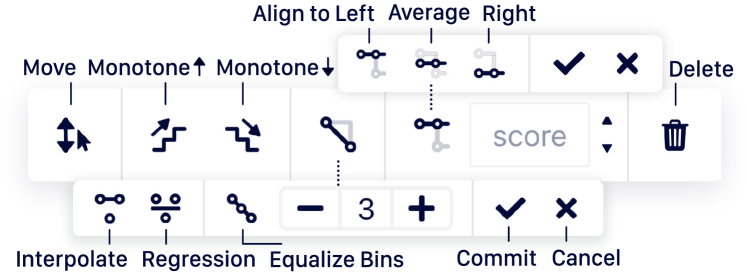
 to adjust the contribution scores of selected bins by dragging bins up and down.
Users can apply the interpolate tool
to adjust the contribution scores of selected bins by dragging bins up and down.
Users can apply the interpolate tool  to linearly interpolate the scores of an interval of bins from the start to the end.
Alternatively, users can interpolate scores with an arbitrary number of equal bins
to linearly interpolate the scores of an interval of bins from the start to the end.
Alternatively, users can interpolate scores with an arbitrary number of equal bins  , or by fitting a linear regression
  .
With minimal changes, the monotonicity tool transforms the selected scores into a monotonically increasing function
.
With minimal changes, the monotonicity tool transforms the selected scores into a monotonically increasing function  or a monotonically decreasing function
  .
With align tools, users can unify the selected scores as the score of the left bin
.
With align tools, users can unify the selected scores as the score of the left bin  , the right bin
  , or the average score weighted by the training sample counts
  .
Users can also use the delete tool
.
Users can also use the delete tool  to set all selected scores to 0.
![[Uncaptioned image]](/html/2206.15465/assets/x82.png)
Editing tools.
In the GAM Canvas, users can switch between move mode and select mode by clicking the mode toggle button.
In the move mode, users can use zoom-and-pan to control their view portion and focus on analyzing an interesting region in the GAM visualization.
In the select mode, users can use marquee selection to pick a subset of bins (or bars for categorical features) to edit.
Once a region of the shape function is selected, the Context Toolbar (Fig. S1) appears.
In the bottom Status Bar, users can view the number of samples in the selected region and a description of their last edit.
Users can click the check icon ![]() to “commit” (§ 3.2) the change if they are satisfied with this edit, or click the cross icon
to “commit” (§ 3.2) the change if they are satisfied with this edit, or click the cross icon ![]() to discard the change.
to discard the change.
A.2. Feature Panel
User interface for GAM Changer, featuring four tightly integrated views: GAM Canvas, Metric Panel, Feature Panel, and History Panel
User interface for GAM Changer
The Feature Panel (Fig. 2-B2, Fig. S2) helps users gain an overview of correlated features as well as their distributions and elucidate potential editing effect disparities. We develop linking+reordering—a novel technique to identify correlated features. Once a user selects an interval of the shape function in the GAM Canvas (Fig. S2-A), we look up affected samples and their associated bins across all features. For each feature, we compare the bin count frequency in all training data and the frequency in the selected samples by computing the distance between these two frequency vectors. Then, we plot two frequency distributions in an overlaid histogram for each feature, and sort all histograms in descending order of the distance scores (Fig. S2-B). The intuition is that if two features and are independent, then samples selected from an interval in should have a distribution similar to the training data distribution in , and vice versa. Therefore, correlated features will be on top of the sorted histogram list. Our linking+reordering technique allows users to interactively and quickly identify local correlations across features, even between continuous and categorical features. By observing correlated features, users can identify potential disparities in editing impacts. For example, editing high-quality houses would disproportionately affect newer houses (Fig. S2).
A.3. Metric Panel
![[Uncaptioned image]](/html/2206.15465/assets/x87.png)
The Metric Panel (Fig. 2-B1) provides real-time and continuous feedback on the model performance. For a binary classifier, we present a confusion matrix and use bar plots to encode the model’s accuracy, balanced accuracy, and the Area Under the Curve (AUC). For a regressor, we report root mean squared error, mean absolute error, and mean absolute percentage error. We use the same color codes of shape functions in the GAM Canvas to describe the performance of the original model, the model from the last edit, and the current model.
![[Uncaptioned image]](/html/2206.15465/assets/x88.png)
Besides monitoring global metrics that are computed on all validation samples, users can choose a subset of validation samples to compute the metrics by switching the metric scope. For example, with the Selected Scope, the Metric Panel only computes model metrics on samples that are in the currently selected region. With the Slice Scope, users can choose a data slice by selecting a level of a categorical variable, e.g., the level of the variable. Then, performance metrics in the Metric Panel are computed on the validation samples that belong to the selected subgroup.
A.4. History Panel
![[Uncaptioned image]](/html/2206.15465/assets/x89.png)
In GAM Changer, users can easily undo and redo their edits by clicking the buttons in the bottom Status Bar (shown on the right) or using keyboard shortcuts. Reversible actions promote accountable model editing, as users can easily fix their mistakes.
![[Uncaptioned image]](/html/2206.15465/assets/x90.png)
Inspired by the version control system Git555Git: https://git-scm.com, the History Panel (Fig. 2-B3) tracks each edit as a commit: a snapshot of the underlying GAM.
Each commit has a timestamp, a unique identifier, and a commit message.
Once an edit is committed, we automatically generate an initial commit message to describe the edit; users can update the message in the History Panel to further document their editing motivation and context.
Once users finish editing, they can click the Save button ![]() in the Status Bar to save the latest GAM along with all editing history, which can be used for deployment or future continuing editing.
Before saving the model, GAM Changer requires users to examine and confirm
in the Status Bar to save the latest GAM along with all editing history, which can be used for deployment or future continuing editing.
Before saving the model, GAM Changer requires users to examine and confirm ![]() all edits.
all edits.
Appendix B Case Studies
The pneumonia (§ 4.1) and sepsis (§ 4.2) risk prediction models are GAMs trained with boosted-trees (Lou et al., 2013). We train both models using the InterpretML library (Nori et al., 2019). We use the default hyper-parameters for both models: outer bagging as 8, inner bagging as 0, number of interaction terms as 10, max bins as 256, max interaction bins as 32, and learning rate as 0.01. All shape function plots of the pneumonia risk prediction model are listed in (Caruana et al., 2015).
Appendix C User Study
The LendingClub dataset (Len, 2018) includes 9 continuous and 9 categorical features describing the financial information of loan applicants. The outcome variable is binary: 1 if the applicant can pay off the loan in time and 0 otherwise. We follow the same workflow described in ‡ B to train this model. All shape function plots of this model are listed in https://interpret.ml/gam-changer. Each user study participant was given the following recommended task list and they were told that they could freely edit the model as seen fit:
-
Browse different features and look for “surprising” patterns
-
What are some characteristics for people with high ?
-
What are some characteristics for people with low ?
-
Does these characteristics make sense?
-
Make shape function monotonic
-
Increase the score for low
-
Smooth out the sudden score drop when is between $2k and $4k
-
Lower the score when is
-
Remove the predictive effect of when it is
-
Explore the history panel
-
Try undo and redo
-
Try to checkout a previous edit
-
Save the model, reload the model in a new GAM Changer
-
Free exploration