Coupling Perovskite Quantum Dot Pairs in Solution using Nanoplasmonic Assembly
Supporting Information: Coupling Perovskite Quantum Dot Pairs in Solution using Nanoplasmonic Assembly
Abstract
Perovskite quantum dots (PQDs) provide a robust solution-based approach to efficient solar cells, bright light emitting devices, quantum sources of light. Quantifying heterogeneity and understanding coupling between dots is critical for these applications. We use double-nanohole optical trapping to size individual dots and correlate to emission energy shifts from quantum confinement. We were able to assemble a second dot in the trap, which allows us to observe the coupling between dots. We observe a systematic red-shift of 1.10.6 meV in the emission wavelength. Theoretical analysis shows that the observed shift is consistent with resonant energy transfer and is unusually large due to moderate-to-large quantum confinement in PQDs. This demonstrates the promise of PQDs for entanglement in quantum information applications. This work enables future in situ control of PQD growth as well as studies of the coupling between small PQD assemblies with quantum information applications in mind.
keywords:
American Chemical Society, LaTeXkeywords:
American Chemical Society, LaTeXECE] Department of Electrical and Computer Engineering, University of Victoria, Victoria, Canada \alsoaffiliation[CAMTEC] Centre for Advanced Materials Related Technologies (CAMTEC), University of Victoria, Victoria, Canada ECE] Department of Electrical and Computer Engineering, University of Victoria, Victoria, Canada \alsoaffiliation[CAMTEC] Centre for Advanced Materials Related Technologies (CAMTEC), University of Victoria, Victoria, Canada chem] Department of Chemistry, University of Victoria, Victoria, Canada \alsoaffiliation[CAMTEC] Centre for Advanced Materials Related Technologies (CAMTEC), University of Victoria, Victoria, Canada \alsoaffiliation[company] Quantum Algorithms Institute, Surrey, Canada phys] Department of Physics and Astronomy, University of Victoria, Victoria, Canada \alsoaffiliation[CAMTEC] Centre for Advanced Materials Related Technologies (CAMTEC), University of Victoria, Victoria, Canada chem] Department of Chemistry, University of Victoria, Victoria, Canada \alsoaffiliation[CAMTEC] Centre for Advanced Materials Related Technologies (CAMTEC), University of Victoria, Victoria, Canada phys] Department of Physics and Astronomy, University of Victoria, Victoria, Canada \alsoaffiliation[CAMTEC] Centre for Advanced Materials Related Technologies (CAMTEC), University of Victoria, Victoria, Canada ECE] Department of Electrical and Computer Engineering, University of Victoria, Victoria, Canada \alsoaffiliation[CAMTEC] Centre for Advanced Materials Related Technologies (CAMTEC), University of Victoria, Victoria, Canada \alsoaffiliation[chem] Department of Chemistry, University of Victoria, Victoria, Canada chem] Department of Chemistry, University of Victoria, Victoria, Canada \alsoaffiliation[CAMTEC] Centre for Advanced Materials Related Technologies (CAMTEC), University of Victoria, Victoria, Canada ECE] Department of Electrical and Computer Engineering, University of Victoria, Victoria, Canada \alsoaffiliation[CAMTEC] Centre for Advanced Materials Related Technologies (CAMTEC), University of Victoria, Victoria, Canada \phone+1 (250) 472-5179 \fax+1 (250) 721-6052 \abbreviationsIR,NMR,UV
1 Introduction
Perovskite quantum dots (PQDs) show intriguing properties for quantum technologies, such as bright and highly coherent single photon emission 1, 2, and superfluorescence in ensembles of dots 3. Coupled quantum dots have long been investigated for quantum computing 4, 5. Many fabrication strategies have been proposed to couple different types of quantum dots, not only PQDs 6, 7, 8, 9, 10, 11. Assembling quantum dots and studying their quantum coupling in solution would greatly simplify such studies. Furthermore, by assembling in solution, it is possible to study the individual dots prior to assembly, and then study the impact of coupling in the near-field, which is not possible with pre-assembled pairs.
Studying individual dots also allows for probing non-uniformity of the PQDs in solution. Uniformity has been recognized as an important parameter for high-performance applications 12, 13, 14, 15, 16, 17, 18. For solar cells, monodisperse PQDs have shown higher conversion efficiencies and open circuit voltages 19. PQDs are recognized as highly coherent single photon emitters 1, 2; however, for indistinguishable photons, nearly-identical emitters are desired and this requires a way to select among individual emitters in the ensemble 20, 21. Past efforts have focused on ex-situ characterization (e.g., transmission electron microscopy – TEM) of already synthesized PQDs. Ideally, particle size would be monitored in solution in real time, allowing for in-situ tailoring of growth conditions while preventing degradation from exposure to the environment.
Here, we use double-nanohole (DNH) optical tweezers to characterize the dispersion of cesium lead bromide (CsPbBr3) PQDs and their coupling in solution. Aperture based optical tweezers have been used to trap quantum dots 22, study their emission (also with two photon excitation) 23, and enhance their single photon emission characteristics 24. We demonstrate that the DNH optical tweezer can be used to determine the sizes of individual PQDs and correlate size with the emission spectra shifts from quantum confinement. We also demonstrate that the DNH tweezer can capture two quantum dots (i.e., assemble them in real-time) and thereby measure the spectral shift that arises from their coupling. Therefore, this platform enables the spectral and size characterization of single and double dots, and most importantly, it achieves this feat in-situ without removing the dots from the solution or requiring electron microscopy that would damage them.
Multiple physical mechanisms can be responsible for quantum dot coupling in solution. For quantum dots that are nominally symmetric and do not allow for electron tunneling, Förster resonant energy transfer (RET) has been considered as a way to achieve coupling between dots, providing a possible avenue towards quantum information processing 25. In the past, RET has been studied for PQDs of different sizes, where the longer wavelength emission peak is enhanced due to one-directional energy transfer 26. The bi-directional coupling that arises from just two PQDs that are nominally the same size has not been investigated so far.
2 Results and discussion
2.1 Heterogeneous Particle Sizing
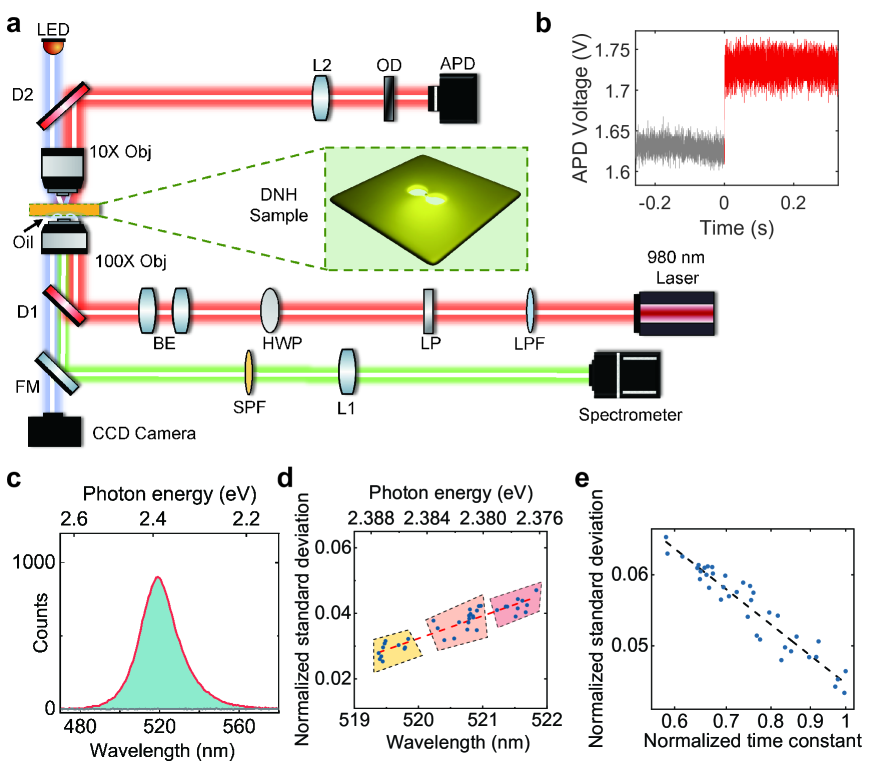
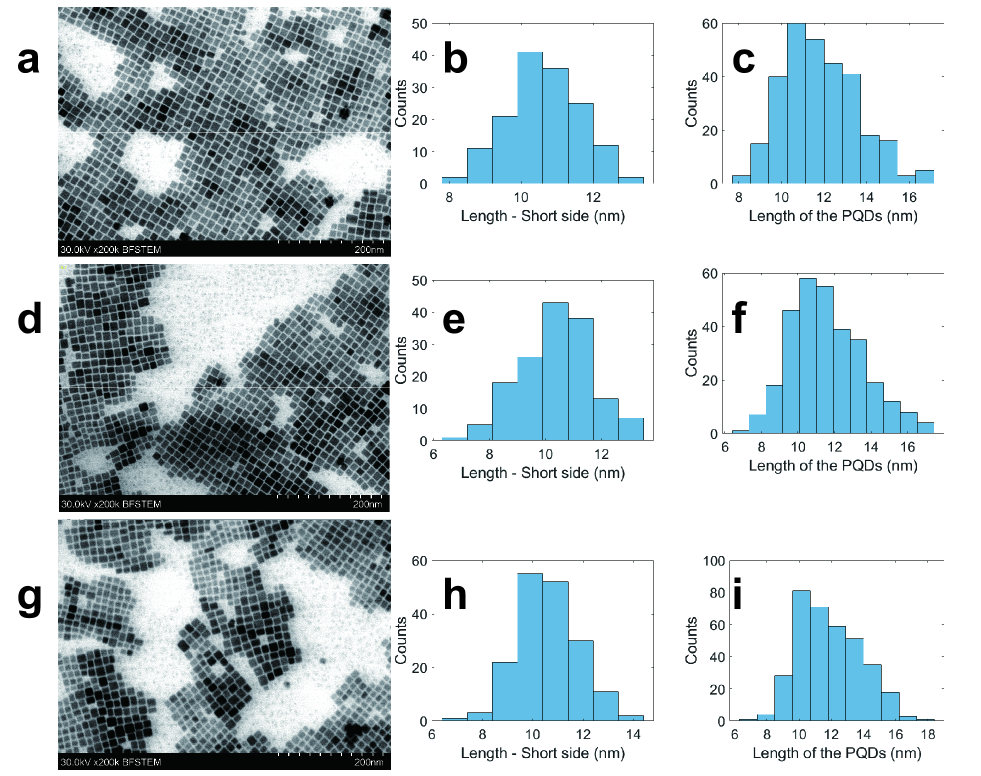
CsPbBr3 PQDs were synthesized by the ligand-assisted reprecipitation technique 27. The side-length distribution calculated by averaging over 150 PQDs is 11.8 1.5 nm . Also shown is the distribution of smallest edge sizes, since the PQDs are expected to align preferentially along their long sides when pushed together by optical forces, and so the separation is best represented by their small side size. We find the small side size to be 10.5 1.1 nm, as shown in the Supporting Information (SI), Fig. S1; however, this size showed variation of 0.5 nm between separate fabrication runs. We diluted the sample with toluene 20-fold, then placed the solution in a microwell formed by an imaging spacer (Grace Biolabs) on a slide 0 coverslip. A gold film containing DNHs on glass, fabricated using past approaches 28, was placed on top of the microwell to seal. We then placed the sample in an inverted microscope optical tweezer setup adapted from a modular kit (Thorlabs – OTKB), shown in Fig. 1a, which has been used previously to study lanthanide nanocrystals 29, 30. The modified setup included a spectrometer for measuring the spectrum of PQD(s) in the DNH optical tweezer. The excitation of the PQD was obtained by a two-photon process, since the laser wavelength was 980 nm (1.26 eV), and the emission wavelength was 520 nm (2.38 eV). Two photon excitation of colloidal quantum dots has been observed previously in trapping setups 31, 23. We confirmed the two-photon process by the quadratic power dependence, as outlined in the SI, Figure S4. The observed wavelength is similar to past works for similarly sized dots 1, but longer than smaller perovskite dots 12.
A step in the transmission of the laser through the DNH was seen with trapping as shown in Fig. 1b. This step resulted from the dielectric loading of the DNH by the PQD, which made the aperture optically “bigger”. Several works have confirmed that the single step is the result of an individual nanoparticle being trapped, e.g., by using fluorescent particles 32 or by noting the dynamics when multiple particles are trapped 33. The spectrum of the single dot is shown in Fig. 1c, which was recorded after the trapping occurred. There was no emission observed before trapping.
It was possible to estimate the size of each isolated trapped PQD by analyzing thermal motion induced fluctuations. As demonstrated previously for proteins (but not for PQDs), the autocorrelation time of the thermal motion scales as , where is the drag coefficient (which scales as the cross sectional width in the viscous limit) and is the optical tweezer stiffness (which scales as the volume of the particle in the dipole limit). Therefore, for radius , 34, 35, where is the volume. Also, the standard deviation of the light scattering scales linearly with the size 35. This has been applied to study heterogeneous solutions of proteins 36. Here we apply it to sizing individual PQDs and correlating the size with the emission spectrum shifts from quantum confinement.
Fig. 1d shows the standard deviation of the trapping laser fluctuations correlated with the emission wavelength for individual PQD trapping events. This data was taken from three separate batches, and shows a clear separation in the sizes of these batches. As described above, it is expected that the standard deviation scales linearly with particle size. For small (first-order) variations in size, it is also expected that the wavelength scales linearly with particle size. Therefore, we observe a linear relationship between the standard deviation and the emission wavelength. We considered the autocorrelation time as a separate measure of particle size, as shown in Fig. 1e. We observed that the relation between the standard deviation and the autocorrelation time had a -0.68 slope on a log-log plot, where a slope of -2/3 is the theoretical prediction 35. The detailed calculation is shown in the SI.
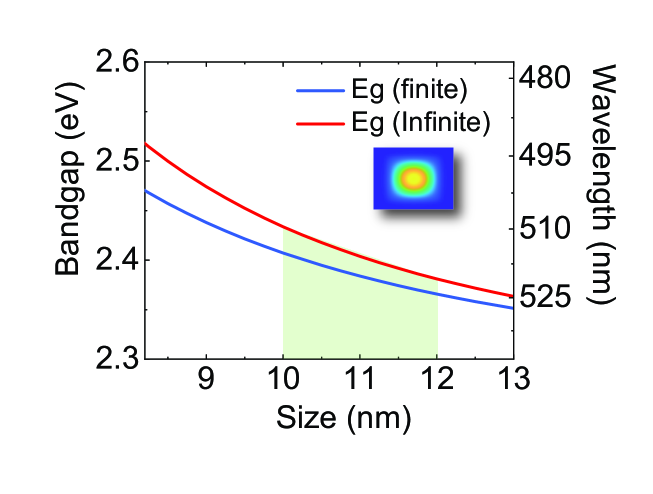
The size-dependence of the emission spectra of individual PQDs can be modeled by solving the Schrödinger equation under the effective mass approximation 37. While spherical particles with infinite barriers allow analytical calculations 37, here we also use numerical calculations which allows for cubic particles and finite barrier energies 38. Details of the calculation method are provided in the SI. The ability to size and spectroscopically characterize individual dots in solution is relevant for quantum applications where we seek to obtain multiple indistinguishable emitters 1. The method can also be used in-situ to optimize solution-based growth 39, 15, 16, 17, 18.
2.2 Two Quantum Dot Assembly via Trapping (Dimers)
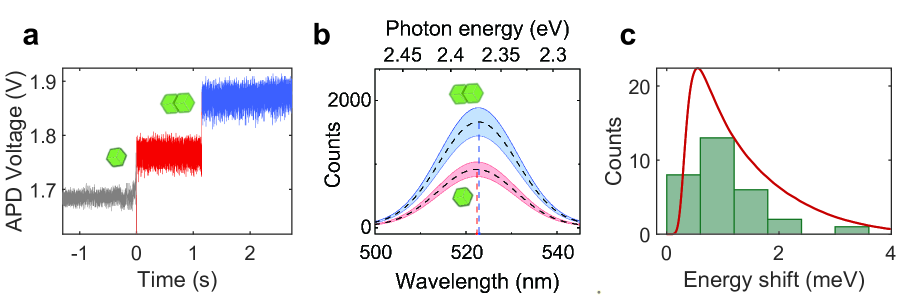
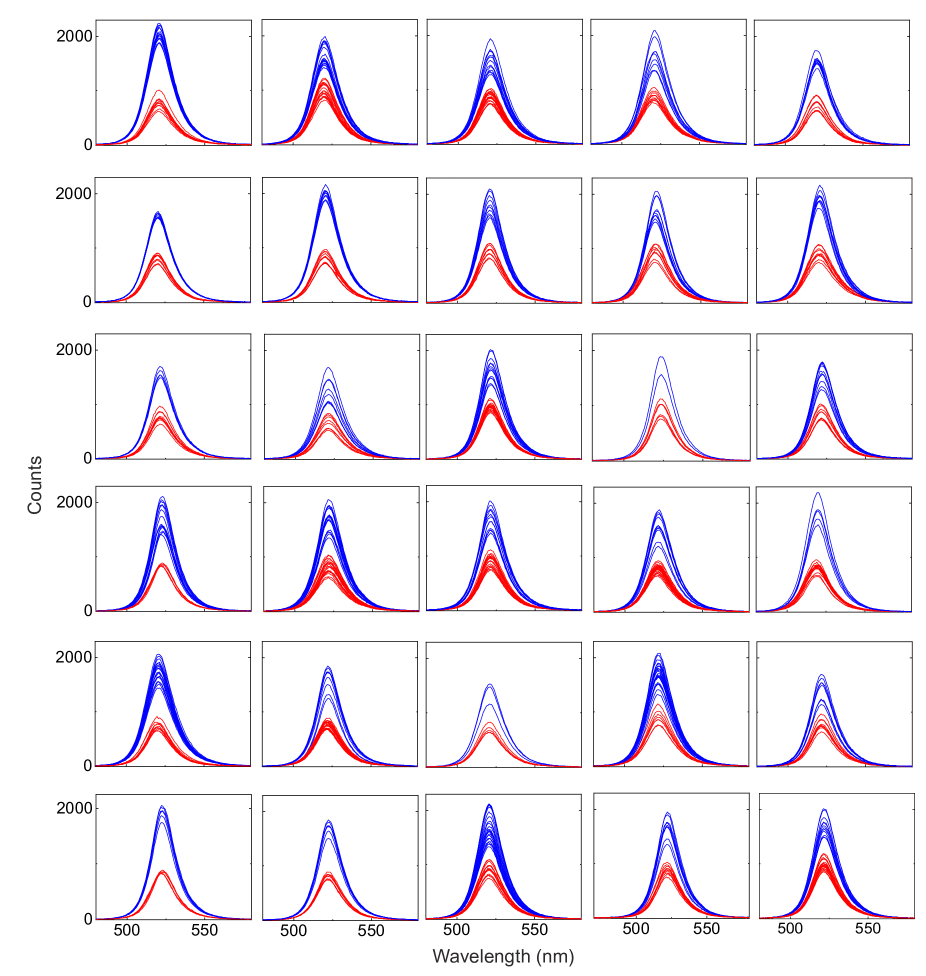
The trapping setup allowed us to measure and characterize the quantum coupling between two PQDs assembled in real time and isolated in the trap. We observed two steps corresponding to double PQDs trapped subsequently in the same aperture as shown in Fig. 2a. It has been shown in past works on aperture optical tweezers that the co-trapping of two nanoparticles results in a double step profile 33. Fig. 2b shows the observed distribution of emission for single and double PQD trapping averaged over 30 different DNHs, averaging over at least 6 measurements at each DNH (full data is included in the SI, Figure S6). Fig. 2b, shows that the emission intensity approximately doubled when there are two PQDs, and that there was a systematic spectral red-shift of the emission. Fig. 2c quantifies the systematic red-shift in the emission observed for the multiple double-dot trapping events. It is relevant to note that there was always a red-shift: if the energy was simply transferred from the smaller dot to the larger one (as is the case for past works on RET 26), we would expect on average a red-shift sometimes and no shift at other times, depending on whether a smaller or a larger dot was trapped first.
Before discussing the physical mechanism that may be responsible for this red-shift, let us describe a simple generic model for the energy shift arising from a generalized coupling potential . Considering two oscillators with energies and , the shift from upon coupling can be calculated as 40, 25:
| (1) |
Fitting to the observed shift, we find a best fit for meV, as shown in Fig. 2c.
2.3 Coupling Mechanisms Between Perovskite Quantum Dots
We now discuss a possible physical mechanism underlying the observed systematic spectral red-shift. First, we discuss the expected photon coupling between two PQDs, treated as point dipoles. As shown in the SI, the radiative decay rate from a single dipole emitter is
| (2) |
for an emitter with dipole moment (assumed real) at position , and is the photon Green function, for any generalized medium. For coupled dipoles (the second one is with real dipole moment at ), the photon exchange has real and imaginary parts, defined through the incoherent rates of photon transfer:
| (3) |
and a coherent exchange term
| (4) |
The latter gives rise to spectral frequency shifts through photon exchange.
When one considers a homogeneous medium (with using two dipoles spatially separated by nm (center to center), and in the near-field regime, then the coherent exchange term, with -polarized dipoles, is
| (5) |
while for -polarized dipoles,
| (6) |
where we have used and , yielding a nominal radiative decay rate of (corresponding lifetime of 250 ps); this estimate scales with so could easily be larger. Note that these analytical rates identically recover the well known Förster coupling terms, and can be described semi-classically or quantum mechanically. Below, we will introduce the shorthand notation . For identical dipole emitters, the resonance will split by , into subradiant and superradiant states, where the latter is optically bright. ( for RET in Eq. (1)). Based on particle size variation giving a variation in the centre-to-centre separations, as well as expected dipole moment variation (smaller dots have smaller dipole moments 41), we expect the variation in to be within 50% of the reported value.
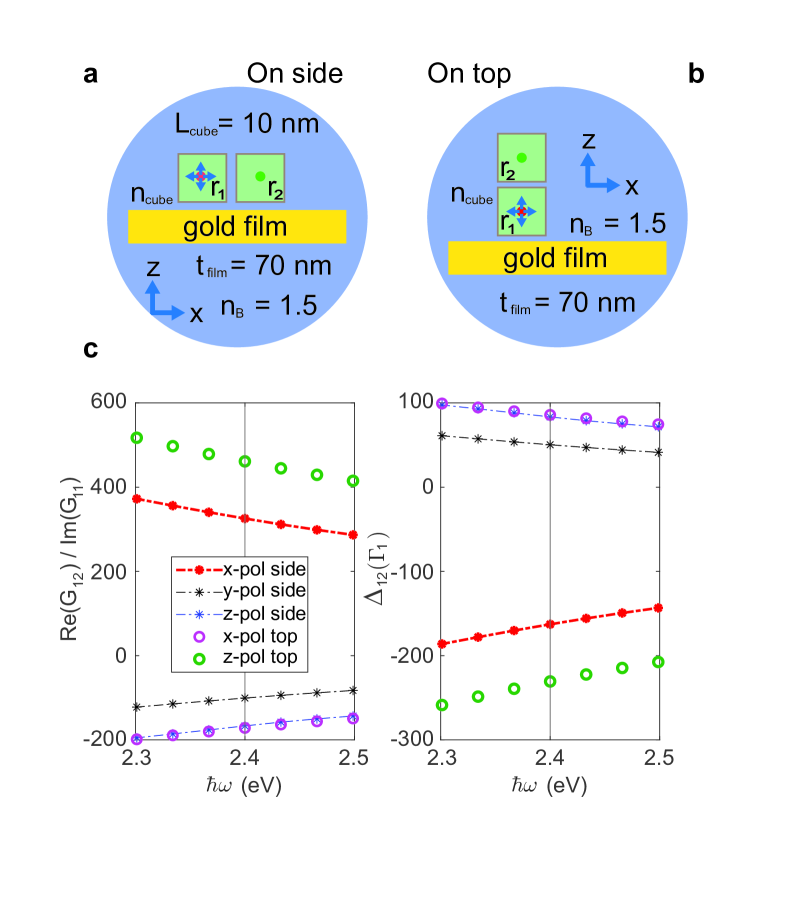
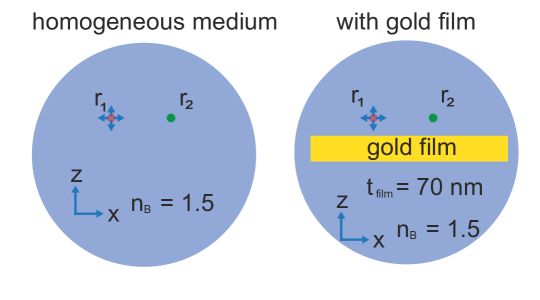
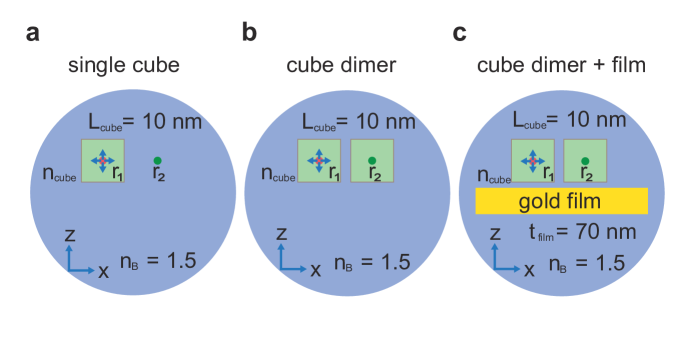
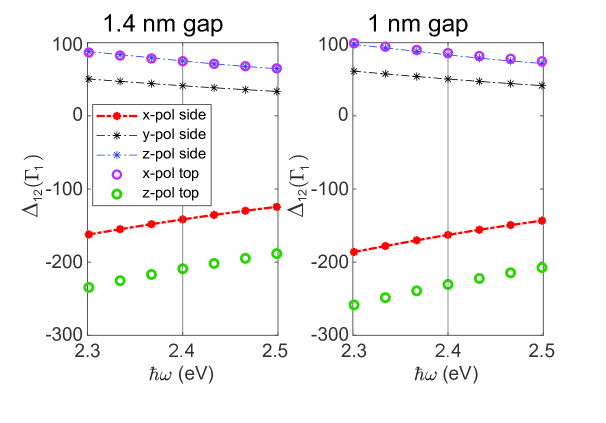
In the SI, we describe how these radiative decay and exchange rates are influenced by local field corrections and interactions with the metal film, from both an analytical perspective as well as using full numerical simulations in COMSOL. As an example of the latter calculations, here we consider two PQD cubes placed nm above a gold film, either horizontally coupled or vertically coupled, as shown in Figs. 3a and b. The PQD cubes are separated by 1-nm (gap size), and various dipole polarizations are considered. The corresponding Green function propagators and dipole-dipole coupling rates (in units of the radiative decay rate) are shown in Fig. 3c. Overall we predict that at eV, maximum photon exchange rates of around are possible, which we estimate to be around meV (for -polarized dipoles with top coupling).
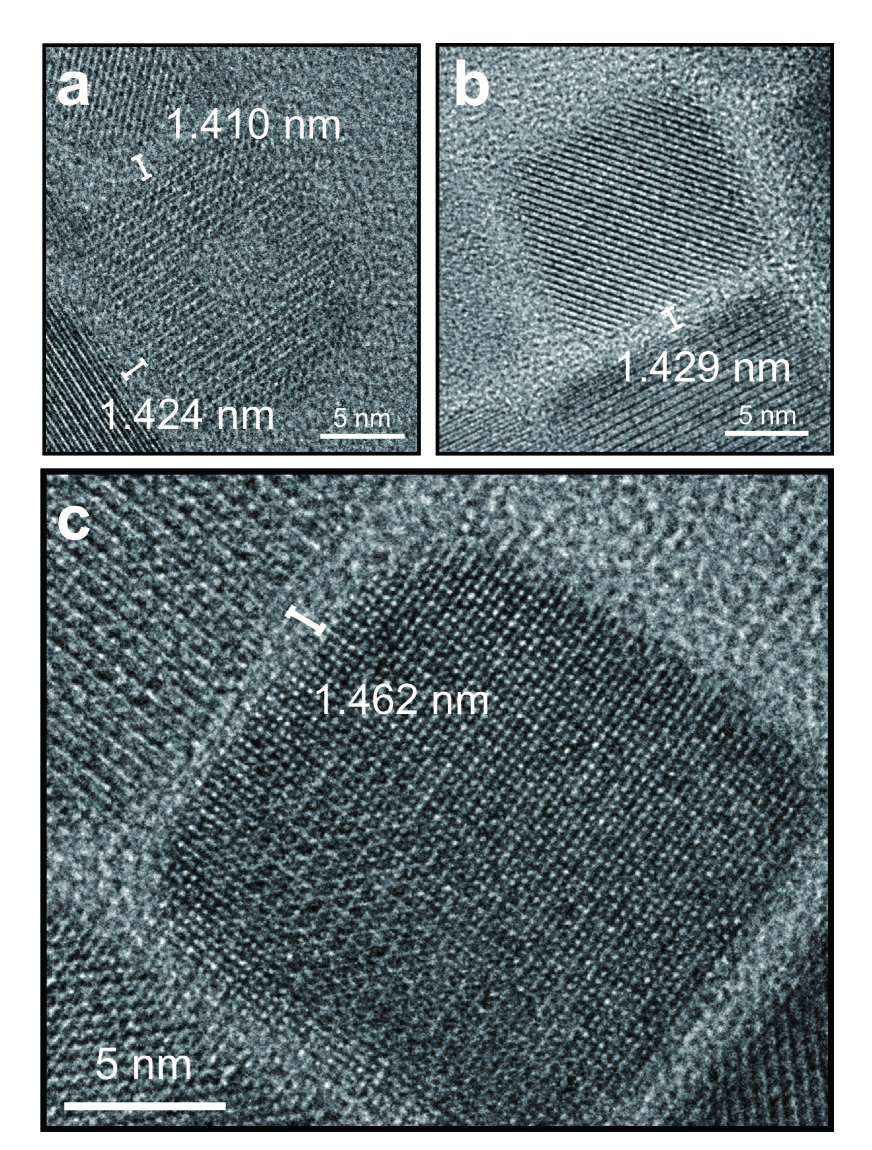
After initial calculations at a nm gap size, we obtained a more accurate measurement of the gap size from high-resolution TEM as being nm. This has a small () impact on the theoretical values (Fig. S14). The typical gap for oleic acid PQDs in TEM imaging is between 1 and 2 nm 3, 42, 1, 27, 43. The optical force tends to squeeze the particles together and minimize the gap size in solution, and so we expect this is similar to what was observed by HR-TEM.
It is also important to note that the expected exciton Bohr radius is much smaller than the size of the PQDs, which gives rise to a giant oscillator strength for an optical transition 41, 44. This is caused by a correlated exciton wave function that affects both the radiative decay and the dipole-dipole coupling rates. We discuss and estimate this enhancement in the SI, which we expect to be about a factor of 5 bigger than PQDs in the strong confinement regime. This is significant, even in the presence of local field reductions. Also in the SI, we discuss several other possible coupling mechanisms including Dexter coupling, electronic tunneling, exciton tunneling for fused dots, and possible monopole-monopole interactions.
3 Discussion
3.1 In-Situ Real-Time Size-Spectral Characterization
In the present work, we have demonstrated the use of an optical tweezer platform to characterize multiple individual PQDs in solution. In past works, the standard approach for monitoring PDQ synthesis has been to follow up PDQ growth with characterization via TEM or luminescence studies. Here we show that we can accurately determine the size and the spectral response without the need for TEM. This may allow for fine-tuning or improving growth conditions in-situ. For example, it is possible to envision integrating the present trapping setup with a flow-cell 22 for real-time monitoring and/or modifying of growth conditions 39.
3.2 Quantum Dot Coupling
We believe that RET is the dominant coupling mechanism between the two PQDs. We do not think the observation can be explained by other mechanisms, like Dexter coupling and quantum hybridization, because the barrier height is too large and the gap too wide to allow substantial tunneling 45. RET has been observed in ensembles of dissimilar PQDs 26; however, that exchange is uni-directional (from the higher energy to the lower energy PQD). Here, since the dots are nominally the same size, the exchange is bidirectional. For quantum applications, RET has been proposed theoretically as a mechanism to achieve quantum computing via colloidal quantum dots 25. Here we estimate the magnitude of the RET induced shift. The dipole moment is estimated from previously reported values of the emission lifetime. We further note that the PQDs studied here are large relative to the exciton Bohr radius, and are in the intermediate to weak confinement regime. This enhances the strength of the RET interaction by 5 times with respect to strongly confined dots, which is a particularly relevant finding of this work.
We estimate from a dipole model that the shift is at least two orders of magnitude larger than the radiative lifetime. We have also looked at distributed wavefunctions (beyond the local dipole model), and full COMSOL simulations including the metal surface nearby in aperture, and these only provide small corrections to the value reported above (as described in the SI). Since this value is comparable to what we observed in the experiments, RET is a plausible explanation for the observed shift. In the future, we aim to modify the ligands and the dot size to investigate their impact on the RET, since there is a strong size-dependence of this effect.
4 Conclusions
We have demonstrated the ability to characterize the size and coupling between individual and dimer PQDs in solution, and simultaneously observe their emission spectra using nanoplasmonic tweezers. This is a powerful tool to quantify sample heterogeneity in size and emission in solution, without requiring expensive and damaging techniques. The approach may be extended to isolate identical dots (both in terms of size and spectral emission), which is a pathway to achieving indistiguishable quantum emitters. The approach may also be extended to monitor and modify growth in real time.
We quantified the systematic red-shift for coupled PQDs in solution of 1.1 0.6 meV and we argue that this is likely the result of resonant energy transfer. The magnitude of the RET is unusually large when compared with the strongly confined quantum dots that have been explored in the past, which is intriguing because RET has been proposed as a mechanism to obtain entanglement for quantum information processing applications 25.
In the future, we aim to consider the impact of temperature on the observed spectral shifts, which will require adding cyrogenic capability to our setup so that the temperature can be lowered after trapping is achieved. To first order, RET does not depend on temperature 46, 47, however, more advanced electron-phonon theories predict a renormalization of as a function of temperature 48, 49. We present only a simple temperature independent model here, as a first order quantification of the RET effect. It may be possible to modify the setup to allow for cryogenic cooling after trapping is achieved, and for time-resolved ultra-fast probing of the trapped dots. Combined, these advances will allow for further exploration of the coupling between these quantum emitters. The DNH optical tweezer is an interesting platform for studying regimes of coupling for small assemblies of 2 or more PQDs (however larger apertures would be preferred for multiple dots). In this manner, it may be possible to explore the full range of interactions from the single dot, coupled dots, several dots, to large cluster superfluorescence ensemble measurements 3; thereby transitioning from the nanoscopic to mesocopic regimes.
The authors thank the NSERC CREATE in Quantum Computing program and the fabrication facilities of CAMTEC. We also acknowledge NSERC for funding through the Discovery Grants program, the Canadian Foundation for Innovation (CFI) for computational infrastructure funding through the Innovation Fund, and CMC Microsystems for the provision of COMSOL Multiphysics.
5 Declarations
The authors declare no competing interests.
6 Contributions
H.Z. fabricated the DNHs, performed the trapping experiments, analyzed the data and did the FDTD simulation. P.M. and V.Y. made the PQD samples. M.I.S. advised on PQD synthesis and characterization. C.C. and A.B. were responsible for TEM imaging. B.H. and I.P. contributed to simulation of bandgap and emission energy as a function of single PQD size. J.R. and S.H. contributed to the theory and simulations of coupled quantum dots. R.G. advised on the experiments and analysis. All authors contributed to writing the manuscript.
Fabrication details, detailed optical trapping description, bandgap and emission characteristics of PQDs, and theory and simulations of coupled quantum dots.
ECE] Department of Electrical and Computer Engineering, University of Victoria, Victoria, V8P 5C2, Canada \alsoaffiliation[CAMTEC] Centre for Advanced Materials Related Technologies (CAMTEC), University of Victoria, Victoria, V8P 5C2, Canada
ECE] Department of Electrical and Computer Engineering, University of Victoria, Victoria, V8P 5C2, Canada \alsoaffiliation[CAMTEC] Centre for Advanced Materials Related Technologies (CAMTEC), University of Victoria, Victoria, V8P 5C2, Canada
chem] Department of Chemistry, University of Victoria, Victoria, V8P 5C2, Canada \alsoaffiliation[CAMTEC] Centre for Advanced Materials Related Technologies (CAMTEC), University of Victoria, Victoria, V8P 5C2, Canada \alsoaffiliation[company] Quantum Algorithms Institute, Surrey, V3T 5X3, Canada
phys] Department of Physics and Astronomy, University of Victoria, Victoria, V8P 5C2, Canada \alsoaffiliation[CAMTEC] Centre for Advanced Materials Related Technologies (CAMTEC), University of Victoria, Victoria, V8P 5C2, Canada
chem] Department of Chemistry, University of Victoria, Victoria, V8P 5C2, Canada \alsoaffiliation[CAMTEC] Centre for Advanced Materials Related Technologies (CAMTEC), University of Victoria, Victoria, V8P 5C2, Canada
phys] Department of Physics and Astronomy, University of Victoria, Victoria, V8P 5C2, Canada \alsoaffiliation[CAMTEC] Centre for Advanced Materials Related Technologies (CAMTEC), University of Victoria, Victoria, V8P 5C2, Canada
ECE] Department of Electrical and Computer Engineering, University of Victoria, Victoria, V8P 5C2, Canada \alsoaffiliation[CAMTEC] Centre for Advanced Materials Related Technologies (CAMTEC), University of Victoria, Victoria, V8P 5C2, Canada \alsoaffiliation[chem] Department of Chemistry, University of Victoria, Victoria, V8P 5C2, Canada
chem] Department of Chemistry, University of Victoria, Victoria, V8P 5C2, Canada \alsoaffiliation[CAMTEC] Centre for Advanced Materials Related Technologies (CAMTEC), University of Victoria, Victoria, V8P 5C2, Canada
ECE] Department of Electrical and Computer Engineering, University of Victoria, Victoria, V8P 5C2, Canada \alsoaffiliation[CAMTEC] Centre for Advanced Materials Related Technologies (CAMTEC), University of Victoria, Victoria, V8P 5C2, Canada \phone+1 (250) 472-5179 \fax+1 (250) 721-6052
IR,NMR,UV
Supporting Information
In this Supporting Information document, we provide further details on the following:
S-I Fabrication.
S-II Optical trapping setup and trapping process.
S-III Bandgap and emission energy as a function of single PQD size.
S-IV Theory and simulations of coupled quantum dots.
7 Fabrication
Materials used for CsPbBr3 PQDs synthesis
Cesium bromide (99.9%), lead bromide (98%), oleylamine (technical grade, 70%), oleic acid (technical grade, 90%), N,N-dimethylformamide (anhydrous, 99.8%) and toluene (anhydrous, 99.8%). All chemicals were purchased from Millipore-Sigma.
CsPbBr3 PQDs synthesis method
4.25 mg of cesium bromide and 14.68 mg of lead bromide were dissolved in 1 ml of N,N-dimethylformamide. To this solution, 5 l of oleylamine and 125 l of oleic acid were added. This forms the PQD precursor solution. In another vial, 2.5 ml of toluene was stirred vigorously at 1500 rpm. 250 l of PQD precursor solution was dropped quicky into toluene under stirring. The solution color immediately changed to green indicating the formation of CsPbBr3 PQDs. This solution was filtered using 0.2 m polytetrafluoroethylene syringe filter. The solution was then used for optical trapping experiments. Fig. S1 shows the bright field scanning transmission electron microscope (STEM) images of the as fabricated PQDs and their size distribution. Fig. S2 gives high resolution bright field (BF-) TEM images, collected in an in-focus condition with near parallel illumination in an aberration corrected Hitachi HF-3300 TEM at 200 kV. Here the cube-like particles aligned with the beam direction. This allows direct measurements of the interparticle spacing to be taken from the BF-TEM images, measuring the width the region where no lattice fringes were observed. This shows the ligand length of the PQD to be around 1.4 nm. The images presented in Fig. S2 show larger particles due to working at the periphery of the deposited region. For measuring particle size, STEM images with a large field of view were used for representative statistics.
DNH sample fabrication
The DNH apertures were made by using colloidal lithography, as we did in our past works 28. Microscope slides were cut and cleaned using the ultrasonic box for 10 min in an ethanol bath. Then, the slides were cleaned by using oxygen plasma for 15 min. 300 nm 0.01 w/v polystyrene spheres diluted in ethanol were drop-coated on the microscope slides thinly and evenly. After the solution evaporated, the prepared slides were plasma etched again (135 s) to reduce the size of the polystyrene spheres. A 5 nm titanium adhesive layer and a 70 nm gold layer were sputter coated (MANTIS sputtering system). The sputtered samples were sonicated for 10 min in an ethanol bath to remove the polystyrene spheres.
8 Optical trapping setup and trapping process
The setup in Fig. 1 of the main manuscript consists of a 980 nm continuous-wave laser (JDS Uniphase SDLO-27-7552-160-LD). The optical path was collimated, polarized, filtered and expanded until focusing on the sample with a 100 oil immersion microscope objective (numerical aperture = 1.25). The 980 nm beam was used for both trapping and excite the PQDs. The setup collected the transmission light using a 10 microscope objective from the sample, where the sample placed on the three-axis sample stage with piezoelectric adjustment. The transmission signal was collected and measured by an avalanche photo-detector (Thorlabs APD120A). A half-wave plate (HWP) and a linear polarizer (LP) were adopted to set the polarization of the beam. A 750 nm lowpass filter (Thorlabs FES0750) to reduce the beam intensity from the 980 nm laser. A fiber connected with the spectrometer (Ocean Optics QE65000) collected the emission light from the sample. The flip mirror was set to change the optical path to collect the image from the sample by using the CCD camera. The gold DNH was attached to a coverslip with an adhesive spacer.
Bulk solution characterization
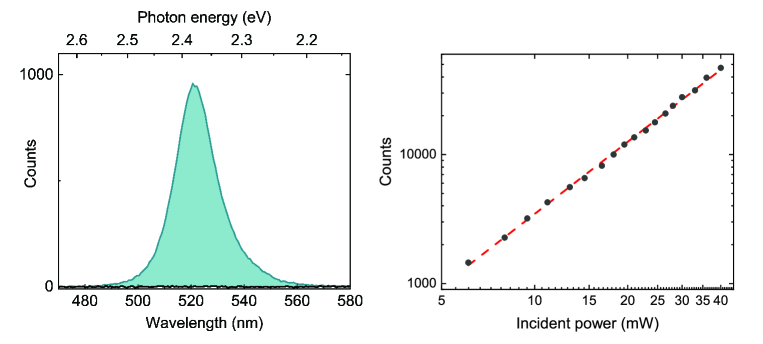
Figure S3 shows the emission spectrum and the power dependence of emission for an ensemble of PQDs in solution (not trapped in DNH).
Power dependence
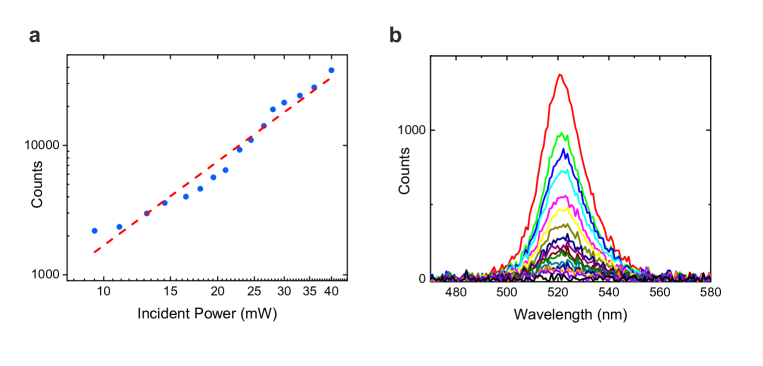
Figure S4a shows the power dependence of the single PQD trapping event. The quadratic power dependence is shown on the log-log plot. The emission counts were integrated from the collected emission peak from 500 nm to 545 nm. Figure S4b shows that there is little influence with the emission spectra the by increasing of the input power from 8-40 mW in front of the objective lens.
Quantitative analysis by using the thermal motion characteristics
Analyzing the autocorrelation of the time series signal, an exponential decay time () can be found, which is a measure of the trapping stiffness used in the optical trapping 50, 34. The force on the trapped particle,
| (7) |
where is the Stokes’ drag, is stiffness and is the Langevin term that accounts for Brownian motion. If we assume and ignore the noise term in Eq. (7), we can obtain :
| (8) |
Since and , where is the volume and is the radius of the nano-particle, then
| (9) |
Using Eqs (8)-(9), we can find the relationship between and the volume is . Also, we then find , where is the mass of the particle. The standard deviation would have a linear relationship with the mass, which can be estimated by the emission wavelength for PQDs with quantum confinement.
The photoluminescence energy distributions of trapping single and double dots
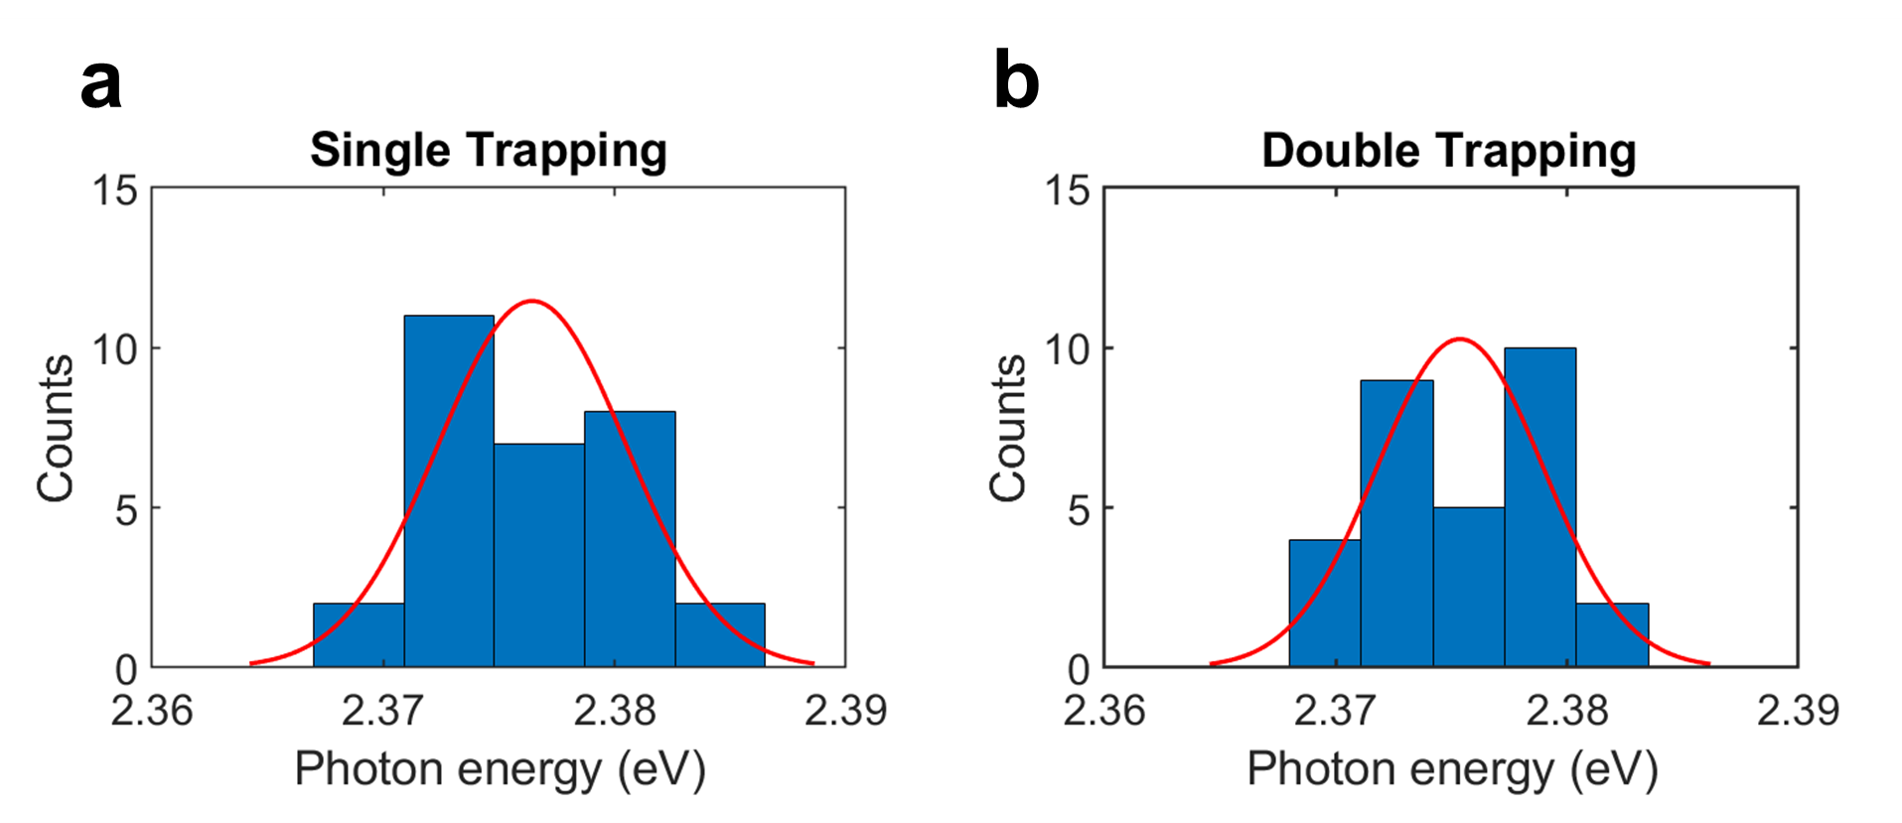
Figure S5 a and b shows the photoluminescence energy distributions of trapping single and double dots. The standard deviation of each case is around 4.1 and 3.6 meV.
Reproducible spectra from different DNHs
Figure S6 shows the repeatibility of the results for thirty different DNHs on the same gold sample, with at least 6 trapping events for each DNH. Polynomial fitting is used to find the peak for analysis (concatenation fitting with multiple curves). During the experiment, we observed blinking, which can be seen from the fluctuations in the intensity of the spectra.
9 Bandgap and emission energy as a function of single PQD size
We assessed the quantum confinement using an effective mass Schrödinger equation model using a Matlab-based finite-element approach, as shown in Fig. S7 and considering the exciton binding under a weak confinement assumption 41. The simulations used and 41, with a bulk bandgap of 2.30 eV for cubic CsPbBr3 51, 41. The barrier height was chosen to either be infinite or to match the band offset between CsPbBr3 QDs and oleic acid ligands (3.14 eV for electrons and 0.79 eV for holes) 52. The dispersion found for this model was less than that seen in experiment but it did match with previous works 41, 42.
Quantum simulation for double QDs
With the barrier widths seen in TEM imaging (similar to the oleic acid ligand length of 2 nm) and the barrier heights used above for single dots 52, we do not expect significant wavefunction overlap between two adjacent dots. To confirm this, we used effective mass the Schrödinger model as above (neglecting the Coulomb potential) and confirmed that there was minimal delocalization for separations greater than about 1 nm.
10 Theory and simulations of coupled quantum dots
Photon exchange from coupled dipoles in a general medium
The radiative decay rate from a single dipole emitter is defined from
| (10) |
for an emitter with dipole moment (assumed real) at position , and is the photon Green function. For coupled dipoles (the second one is with real dipole moment at ), the photon exchange mechanism is connected to real and imaginary parts of the Green function, defined from incoherent rates of photon transfer:
| (11) |
and a coherent exchange term
| (12) |
where the latter has the same origin as Förster coupling 53. Specifically, when one considers a homogeneous medium, the near-feld electrostatic part identically recovers the Förster coupling term. Below, for ease of notation, we will introduce the shorthand notation . For identical dipole emitters, the resonance will split by , into subradiant and superradiant states. In a Markov approximation, these radiative decay rates are usually evaluated on resonance, which also yield agreement with a Fermi’s golden rule approach.
The Green function , describes light propagation from a source point to and is formally defined via the Helmholtz equation
| (13) |
together with suitable radiation conditions.
In a background medium with permittivity (assumed lossless, see Fig. S8 left side), the Green function is known analytically. For two -polarized dipoles (-polarized),
| (14) |
and for two -polarized dipoles (-polarized),
| (15) |
where the dipoles are separated by distance , center to center, and . For dipoles that are sufficiently close together (near field regime), one can approximate the above forms with the static contribution only, so that:
| (16) |
and for two -polarized dipoles,
| (17) |
These near field coupling terms, in combination with Eq. (12), identically recover the well known Förster coupling rates 54.
Radiative decay rates and photon exchange rates for lead perovskite quantum dots
Experiments on single PQDs 55 report a single radiative lifetime of 250 ps, corresponding to a spectral linewidth of around 2.7 eV. These rates are also consistent with those reported in Ref. 41, for for QDs around 10-nm cubed. The reason for these significant decay rates, is that such QDs are in the intermediate to weak quantum confinement regime, as the QD size is larger than the exciton Bohr radius.
For our PQDs, the electron Bohr radius is obtained from nm (using and ), which is clearly much smaller than the size of our QDs (10 nm). This large ratio is the origin of the large oscillator strength for the radiative decay 44, a mesoscopic enhancement effect. This in turn enhances the radiative decay rate and also to the dipole-dipole exchange rates.
In Ref. 41, a variational approach was given with the following trial wave functions (electron-hole picture):
| (18) |
where is determined from
| (19) |
and
| (20) |
The envelope wavefunction of the exciton (from a product of the ground state electron and hole ground wave functions) is required to compute the oscillator strength and exciton dipole moments.
The parameter has been extracted as a function of QD cube length , and for is (see supplementary material of 41). Carrying out the 6D integration (Eq. (19)) with this new wave function, then the oscillator strength increases by , which we compute to be for ; for ; and for . Thus we estimate that the excitonic oscillator strength is about a factor of 4-5 larger than that for a QD in the strong confinement regime. Using wave functions for excitons in the weak confinement regime, increases the oscillator strength even further 41, and scale with , where is the exciton Bohr radius.
The main photoluminescence lines of PQDs consist of three linearly-polarized triplet excitons, which are nondegenerate, one of which is dominant. At elevated temperatures, this will be significantly broadened due to non-radiative processes, such as electron-phonon interactions, but these should not affect the coherent dipole-dipole interactions.
As an example, if we consider two coupled dipoles of magnitude (which give the same radiative decay rates mentioned before), as well as (which includes a 1 nm gap, Fig. S8 left side), , eV, then
| (21) |
corresponding to a lifetime of around 250 ps. However, these estimates do not account for local field corrections, which are discussed below. They also only consider one linearly polarized dipole, and we know there are three active dipole moments likely contributing to out main emission resonance.
The coherent exchange term, with -polarized dipoles (-polarized), is
| (22) |
while for -polarized dipoles (-polarized),
| (23) |
As expected, and as mentioned earlier, these are identical in form to the well known Förster coupling rate 56,
| (24) |
for two dipoles that are polarized along and .
Without considering any effects from the metal film (or DNH topology) or local field corrections, we thus expect a maximum shift, for -polarized dipoles (-polarized), of around . This is significant, and estimated to be around 0.5 meV red shift (within a dipole approximation).
Local field corrections
The radiative decay rates and photon-exchange rates are affected by local field effects, since the PQD cubes have a different dielectric constant than the surrounding medium. Specifically one has 57
| (25) |
Values for on PQDs vary in the literature from around 6-7 58 in bulk (and thin films) to 4.8 for QDs 41. So we will consider two values, and . With , then we expect a local field reduction factor of
| (26) |
This is only an estimate as it neglects finite size effects, but this is expected to be reasonable for very small PQDs, essentially only including a depolarization factor. If we use , then the local field reduction is slightly less, with .
Since we have estimated from the experimental radiate decay rates, clearly these are reduced from the actual ones, but it does not matter if we regard as an effective dipole moment including local field corrections, or we can simply increase this value in the presence or local field effects (which would reduce the local all rates). The reason this does not matter, is that for identical QD cubes, the same reduction factor applies also to the dipole-dipole coupling rates 59. Thus,
| (27) |
and so we can once again scale our frequency shift in terms on the experimental radiative decay rate. We will show the explicitly below, with full numerical simulations.
Exact photon Green function solutions in the presence of a gold film
To more accurately assess the effects of the gold film, and to include the possibility of plasmon polariton effects and image dipole effects, we now calculate the exact Green functions with a metal film, specifically a 70-nm gold film (Fig. S8 right side). Clearly this is only an estimate for our DNH structure, which may also have some background resonance effects from the nano-hole geometry. Nevertheless, it is useful to assess the expected role of the gold film.
We use a well established multi-layered Green function approach 60. For gold, we adopt a simple Drude model for the complex dielectric constant
| (28) |
with and . However, we also consider a more realistic model 61.
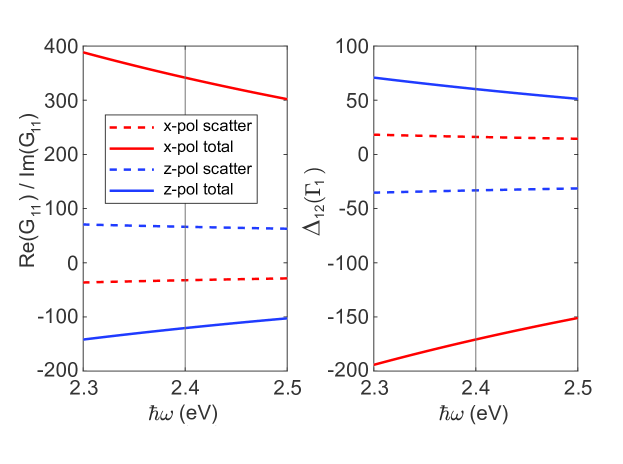
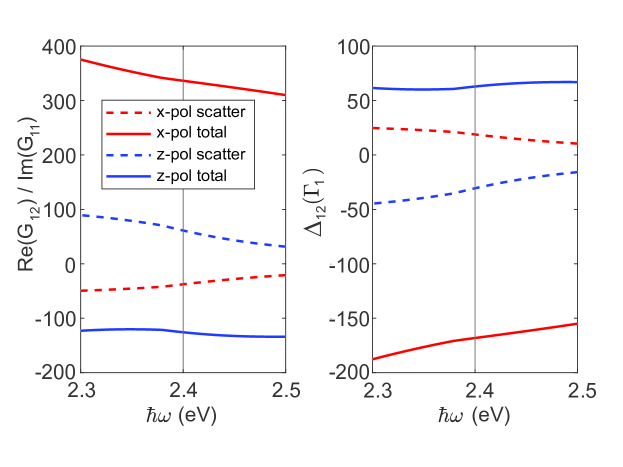
Fig. S10 shows the computation of the propagator for coupling two dipoles (Drude model), that are 6 nm from the metal (1-nm height/gap above the interface, Fig. S8 right side), which act to reduce the homogeneous contributions given above. For example, the real part of the -polarized (z-polarized) propagator () changes from -182 (using the analytical Green functions, with a homogeneous medium, in Purcell factor units) to -115 (with a gold film included in the calculations, solid blue curve at eV in left side of Fig. S10). We have also computed the same function in COMSOL and obtained -114 (not shown), a remarkably good agreement. Fig. S10 shows identical simulations, but with a more realistic material model for gold 61. Clearly, we obtain exactly the same trends, so the Drude model seems reasonable for these simulations.
Full electromagnetic simulations using COMSOL
To corroborate the above analytical studies and arguments, we also compute the photon Green functions numerically, for a general medium including the QD cubes and the metal film. This can also give insight into any extra scattering effects that may occur, such as scattering from the coupled QD cubes, though we expect such effects to play a minor role. We use and , but the results will scale with different , since we divide the final photon exchange terms by calculated radiative rates that also include local field corrections. We have also checked this explicitly, and the relative differences with compared to 6.25 are only a few percent.
To compute the numerical Green function for a general photonic medium, we use COMSOL, including the PQD cubes (modified background response) and the gold film. With a dipole source excitation, we could easily get and , which are the electric fields with and without the scatterers in the medium. The scattered field is then obtained from . To obtain the numerical scattered Green function, we exploit the following expression for the scattered field from a dipole source at ,
| (29) |
where the scattered field has units of , the Green function has units of , and the dipole moment has units of . We can also obtain the total Green function in the same way,
| (30) |
though one should avoid computing , as it is divergent; however, (real and imaginary parts) and all other Green function quantities () are well defined.
Within the simulation, the source dipole is placed at (Fig. S11) and assumed polarized along some direction (such as the ). Thus we can write the dipole moment as , where is the value of the dipole moment, and is a uniot vector. Note this dipole moment is not related to and , but is simply a linear dipole in Maxwell’s equations to obtain the numerical Green functions.
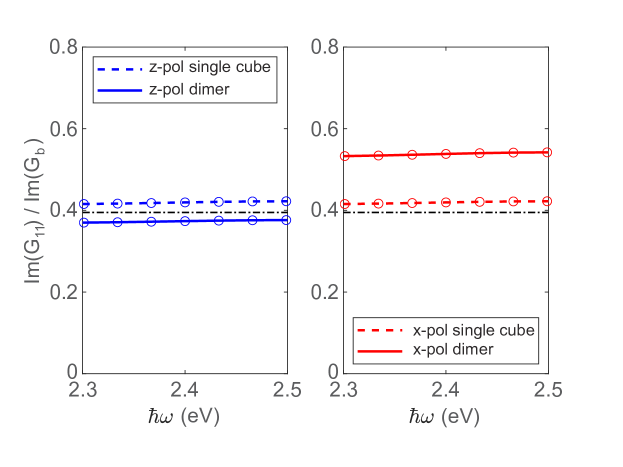
First we explore local field corrections, with one PQD and two PQDs (Fig. S11 (a,b)), since additional scattering can be captured that may show up on top of the usual formula shown earlier, namely Eq. (25). Fig. S12 shows the COMSOL simulations from the PQD cubes. The single PQD results are shown to match the analytical expressions very well, and the two PQD case shows a departure in the case of -polarized dipoles (-polarized). Thus, additional scattering is shown to enhance the projected LDOS (local density of states), or for an -polarized dipoles; however, its impact is relatively small.
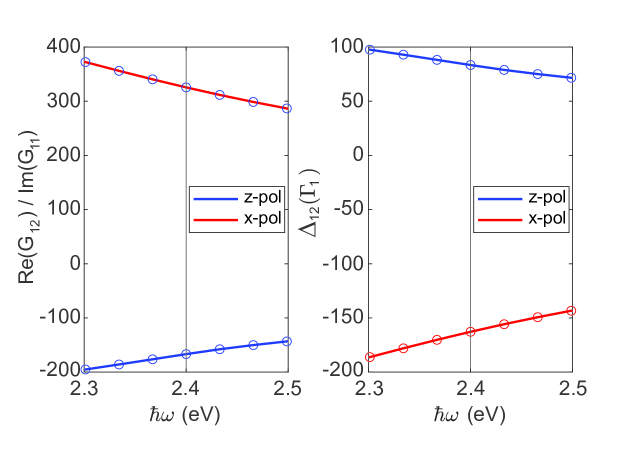
Next, to connect to the photon exchange coupling rates (which will include the usual Förster contribution), we compute the numerically exact propagator (within numerical uncertainties), and corresponding scattering rates (for cube dimer placed side by side above a gold film, Fig. S11 (c)), as shown in Fig. S14. Importantly, these are normalized by the single PQD decay rate, and all simulations include the PQDs; thus local field effects are also included in the normalization, and all scattering effects are included for the calculation of the propagators.
Overall, the trends are seen to be in good agreement with the analytical results shown earlier in Fig. S10. Note that if we remove the PQD cubes from the COMSOL calculations and include only the metal film (Fig. S8 right side), then the agreement with the analytical solution is less than 1%. As mentioned above, the real part of the total Green functions for an -polarized dipole is (in Purcell units, solid blue curve at eV in left side of Fig. S10) from the analytical Green function results and from COMSOL simulations (not shown). Even with small quantitative differences the overall conclusion is the same. When with full structure, i.e., PQDs separated by 11-nm (placed side by side), and 1-nm above a gold film (Fig. S11 (c)), the maximum frequency shift expected is around , where includes local field corrections. Assuming eV, then we predict a spectral shift of meV, for -polarized (-polarized) dipoles.
Additional calculations for vertically coupled QD cubes on gold film (one cube is placed on the top of the other one) are shown in the main text.
As mentioned in the main text, after initial calculations at a nm gap size, we obtained a more accurate measurement of the gap size from high-resolution TEM as being nm. This is expected theoretically to reduce the interaction by around , which we confirmed by simulation of an typical structure (see Fig. S14).
Other potential sources and mechanisms for coupled-PQD frequency shifts
Next, we briefly discuss some other potential effects that could cause large frequency shifts for coupled PQDs.
For quantum emitters that are very close together, namely, where electronic tunneling is possible, excitons can be transferred, which is typically termed Dexter energy transfer 62. This process is usually negligible for distances greater than 1 nm. Dexter is a non-radiative process with electron exchange. Although similar to Förster energy transfer, if differs greatly in length scale and the underlying mechanism. Dexter transfer can be singlet-singlet or triplet-triplet, and the three fundamental excitations in lead PQDs are triplets 41. Dexter energy transfer is a process where the donor and the acceptor exchange their electron. Thus, the exchanged electrons should occupy the orbital of the other pair. The Dexter transfer rate has the form , where is the normalized spectral overlap, and is the the sum of van der Waals radius. Dexter transitions couple bright excitons to bright excitons and are spin preserving. Their strength can also be computed from the Coulomb matrix element. However, since Dexter coupling requires overlap with the electronic wave functions, we believe it is highly unlikely for our coupled QDs.
There are also potential monopole-monopole interactions, which do not depend on any spatial overlap of the electronic wave functions. These are usually neglected in the derivation of Förster coupling between quantum emitters. Actually, monopole-monopole is also the origin of Dexter energy transfer, but in that case, the contribution also requires oribital overlap. In the linear excitation domain (e.g., neglecting biexciton effects), the excitonic monopole-monopole term 63, 64 merely renormalizes the eigenergies, unlike Förster and Dexter terms which represent exchange of photons or electronic excitations. Furthermore, for a symmetric wavefunctions, monopole-monopole shifts should be zero for linear excitation.
There could also be effects beyond a dipole approximation, which can be captures by doing a spatial integration with respect to the inter-PQD exciton wave functions and the photon Green function propagator 65. We have carried out such a calculation using 6D Monte Carlo integration and found the dipole approximation to be excellent, within 5% for QD cubes that have a gap separation of 1 nm. This calculation used the ground state exciton wave function, and we used a similar integration techniques to compute , which enhances the oscillator strength.
Finally, we mention tandem tunneling 66 that can occur through the intermediate state in which the electron and hole are in different PQDs. This process has been shown to have exciton hopping rates that are larger than the Dexter rate Förster for certain PQDs. However, such PQDs are clearly fused together (unlike our optically trapped coupled PQDs), so we also rule out the effect of fused tunneling.
Optical binding
By using the Rayleigh theory in Eq. 31 for the scattering cross section 67, the polarizability constant () of the scatterer can be calculated from the scattering cross section:
| (31) |
The trapping potential energy in the dipole limit can be given by68:
| (32) |
where is the dipole moment and is the electric field. The optical potential energy should be greater than the thermal energy to keep trapping the particle.
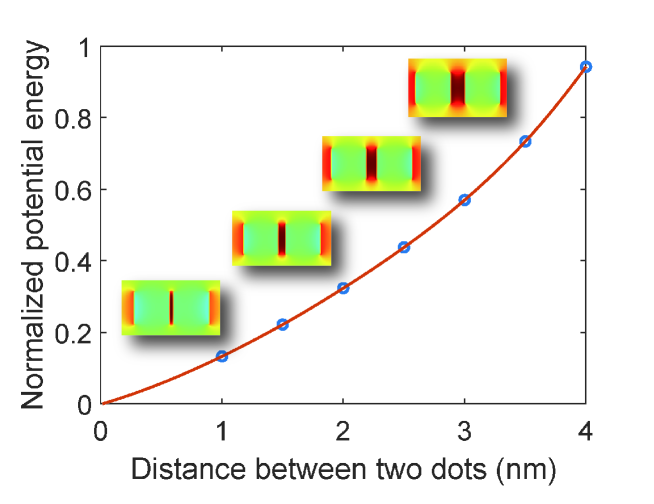
Here, we use the finite-difference time domain simulation software (Lumerical FDTD ver. 2020 R2.3). The simulations calculated the trapping potential energy of the single and double PQDs (dielectric cubes, ). Fig. S15 shows the potential energy as a function of the distance between two PQDs. The electric fields with 1 nm - 4 nm are shown in inset figures. This shows that the dots are attracted to one another through the optical field in the dipole limit.
References
- Utzat et al. 2019 Utzat, H.; Sun, W.; Kaplan, A. E.; Krieg, F.; Ginterseder, M.; Spokoyny, B.; Klein, N. D.; Shulenberger, K. E.; Perkinson, C. F.; Kovalenko, M. V., et al. Coherent single-photon emission from colloidal lead halide perovskite quantum dots. Science 2019, 363, 1068–1072
- Zhu et al. 2022 Zhu, C.; Marczak, M.; Feld, L.; Boehme, S. C.; Bernasconi, C.; Moskalenko, A.; Cherniukh, I.; Dirin, D.; Bodnarchuk, M. I.; Kovalenko, M. V., et al. Room-Temperature, Highly Pure Single-Photon Sources from All-Inorganic Lead Halide Perovskite Quantum Dots. Nano letters 2022,
- Raino et al. 2018 Raino, G.; Becker, M. A.; Bodnarchuk, M. I.; Mahrt, R. F.; Kovalenko, M. V.; Stoferle, T. Superfluorescence from lead halide perovskite quantum dot superlattices. Nature 2018, 563, 671–675
- Burkard et al. 1999 Burkard, G.; Loss, D.; DiVincenzo, D. P. Coupled quantum dots as quantum gates. Physical Review B 1999, 59, 2070
- Loss and DiVincenzo 1998 Loss, D.; DiVincenzo, D. P. Quantum computation with quantum dots. Physical Review A 1998, 57, 120
- Kim et al. 2011 Kim, D.; Carter, S. G.; Greilich, A.; Bracker, A. S.; Gammon, D. Ultrafast optical control of entanglement between two quantum-dot spins. Nature Physics 2011, 7, 223–229
- Rodary et al. 2019 Rodary, G.; Bernardi, L.; David, C.; Fain, B.; Lemaître, A.; Girard, J.-C. Real space observation of electronic coupling between self-assembled quantum dots. Nano Letters 2019, 19, 3699–3706
- Koley et al. 2021 Koley, S.; Cui, J.; Panfil, Y. E.; Banin, U. Coupled colloidal quantum dot molecules. Accounts of Chemical Research 2021, 54, 1178–1188
- Panfil et al. 2019 Panfil, Y. E.; Shamalia, D.; Cui, J.; Koley, S.; Banin, U. Electronic coupling in colloidal quantum dot molecules; the case of CdSe/CdS core/shell homodimers. The Journal of Chemical Physics 2019, 151, 224501
- Cui et al. 2019 Cui, J.; Panfil, Y. E.; Koley, S.; Shamalia, D.; Waiskopf, N.; Remennik, S.; Popov, I.; Oded, M.; Banin, U. Colloidal quantum dot molecules manifesting quantum coupling at room temperature. Nature Communications 2019, 10, 1–10
- Cassidy et al. 2021 Cassidy, J.; Yang, M.; Harankahage, D.; Porotnikov, D.; Moroz, P.; Razgoniaeva, N.; Ellison, C.; Bettinger, J.; Ehsan, S.; Sanchez, J., et al. Tuning the Dimensionality of Excitons in Colloidal Quantum Dot Molecules. Nano Letters 2021, 21, 7339–7346
- Krieg et al. 2020 Krieg, F.; Sercel, P. C.; Burian, M.; Andrusiv, H.; Bodnarchuk, M. I.; Stoferle, T.; Mahrt, R. F.; Naumenko, D.; Amenitsch, H.; Raino, G., et al. Monodisperse long-chain sulfobetaine-capped CsPbBr3 nanocrystals and their superfluorescent assemblies. ACS Central Science 2020, 7, 135–144
- Tennyson et al. 2018 Tennyson, E. M.; Roose, B.; Garrett, J. L.; Gong, C.; Munday, J. N.; Abate, A.; Leite, M. S. Cesium-incorporated triple cation perovskites deliver fully reversible and stable nanoscale voltage response. ACS Nano 2018, 13, 1538–1546
- Bhattacharyya et al. 2019 Bhattacharyya, S.; Rambabu, D.; Maji, T. K. Mechanochemical synthesis of a processable halide perovskite quantum dot–MOF composite by post-synthetic metalation. Journal of Materials Chemistry A 2019, 7, 21106–21111
- Zhao et al. 2019 Zhao, Q.; Hazarika, A.; Schelhas, L. T.; Liu, J.; Gaulding, E. A.; Li, G.; Zhang, M.; Toney, M. F.; Sercel, P. C.; Luther, J. M. Size-dependent lattice structure and confinement properties in CsPbI3 perovskite nanocrystals: negative surface energy for stabilization. ACS Energy Letters 2019, 5, 238–247
- Cheng et al. 2020 Cheng, O. H.-C.; Qiao, T.; Sheldon, M.; Son, D. H. Size-and temperature-dependent photoluminescence spectra of strongly confined CsPbBr 3 quantum dots. Nanoscale 2020, 12, 13113–13118
- Doherty et al. 2020 Doherty, T. A.; Winchester, A. J.; Macpherson, S.; Johnstone, D. N.; Pareek, V.; Tennyson, E. M.; Kosar, S.; Kosasih, F. U.; Anaya, M.; Abdi-Jalebi, M., et al. Performance-limiting nanoscale trap clusters at grain junctions in halide perovskites. Nature 2020, 580, 360–366
- Brown et al. 2021 Brown, A. A.; Vashishtha, P.; Hooper, T. J.; Ng, Y. F.; Nutan, G. V.; Fang, Y.; Giovanni, D.; Tey, J. N.; Jiang, L.; Damodaran, B., et al. Precise Control of CsPbBr3 Perovskite Nanocrystal Growth at Room Temperature: Size Tunability and Synthetic Insights. Chemistry of Materials 2021, 33, 2387–2397
- Lim et al. 2021 Lim, S.; Lee, G.; Han, S.; Kim, J.; Yun, S.; Lim, J.; Pu, Y.-J.; Ko, M. J.; Park, T.; Choi, J., et al. Monodisperse Perovskite Colloidal Quantum Dots Enable High-Efficiency Photovoltaics. ACS Energy Letters 2021, 6, 2229–2237
- Santori et al. 2002 Santori, C.; Fattal, D.; Vučković, J.; Solomon, G. S.; Yamamoto, Y. Indistinguishable photons from a single-photon device. Nature 2002, 419, 594–597
- Gschrey et al. 2015 Gschrey, M.; Thoma, A.; Schnauber, P.; Seifried, M.; Schmidt, R.; Wohlfeil, B.; Krüger, L.; Schulze, J.-H.; Heindel, T.; Burger, S., et al. Highly indistinguishable photons from deterministic quantum-dot microlenses utilizing three-dimensional in situ electron-beam lithography. Nature Communications 2015, 6, 1–8
- Zehtabi-Oskuie et al. 2013 Zehtabi-Oskuie, A.; Jiang, H.; Cyr, B. R.; Rennehan, D. W.; Al-Balushi, A. A.; Gordon, R. Double nanohole optical trapping: dynamics and protein-antibody co-trapping. Lab on a Chip 2013, 13, 2563–2568
- Jensen et al. 2016 Jensen, R. A.; Huang, I.-C.; Chen, O.; Choy, J. T.; Bischof, T. S.; Lončar, M.; Bawendi, M. G. Optical trapping and two-photon excitation of colloidal quantum dots using bowtie apertures. ACS Photonics 2016, 3, 423–427
- Jiang et al. 2021 Jiang, Q.; Roy, P.; Claude, J.-B.; Wenger, J. Single Photon Source from a Nanoantenna-Trapped Single Quantum Dot. Nano Letters 2021, 21, 7030–7036
- Harankahage et al. 2021 Harankahage, D.; Cassidy, J.; Yang, M.; Porotnikov, D.; Williams, M.; Kholmicheva, N.; Zamkov, M. Quantum Computing with Exciton Qubits in Colloidal Semiconductor Nanocrystals. The Journal of Physical Chemistry C 2021, 125, 22195–22203
- de Weerd et al. 2016 de Weerd, C.; Gomez, L.; Zhang, H.; Buma, W. J.; Nedelcu, G.; Kovalenko, M. V.; Gregorkiewicz, T. Energy transfer between inorganic perovskite nanocrystals. The Journal of Physical Chemistry C 2016, 120, 13310–13315
- Du et al. 2017 Du, X.; Wu, G.; Cheng, J.; Dang, H.; Ma, K.; Zhang, Y.-W.; Tan, P.-F.; Chen, S. High-quality CsPbBr 3 perovskite nanocrystals for quantum dot light-emitting diodes. RSC Advances 2017, 7, 10391–10396
- Ravindranath et al. 2019 Ravindranath, A. L.; Shariatdoust, M. S.; Mathew, S.; Gordon, R. Colloidal lithography double-nanohole optical trapping of nanoparticles and proteins. Optics Express 2019, 27, 16184–16194
- Sharifi et al. 2021 Sharifi, Z.; Dobinson, M.; Hajisalem, G.; Shariatdoust, M. S.; Frencken, A. L.; van Veggel, F. C.; Gordon, R. Isolating and enhancing single-photon emitters for 1550 nm quantum light sources using double nanohole optical tweezers. The Journal of Chemical Physics 2021, 154, 184204
- Alizadehkhaledi et al. 2019 Alizadehkhaledi, A.; Frencken, A. L.; van Veggel, F. C.; Gordon, R. Isolating nanocrystals with an individual erbium emitter: A route to a stable single-photon source at 1550 nm wavelength. Nano Letters 2019, 20, 1018–1022
- Jauffred and Oddershede 2010 Jauffred, L.; Oddershede, L. B. Two-photon quantum dot excitation during optical trapping. Nano Letters 2010, 10, 1927–1930
- Berthelot et al. 2014 Berthelot, J.; Aćimović, S. S.; Juan, M. L.; Kreuzer, M. P.; Renger, J.; Quidant, R. Three-dimensional manipulation with scanning near-field optical nanotweezers. Nature Nanotechnology 2014, 9, 295–299
- Chen et al. 2012 Chen, C.; Juan, M. L.; Li, Y.; Maes, G.; Borghs, G.; Van Dorpe, P.; Quidant, R. Enhanced optical trapping and arrangement of nano-objects in a plasmonic nanocavity. Nano Letters 2012, 12, 125–132
- Kotnala and Gordon 2014 Kotnala, A.; Gordon, R. Quantification of high-efficiency trapping of nanoparticles in a double nanohole optical tweezer. Nano Letters 2014, 14, 853–856
- Wheaton and Gordon 2015 Wheaton, S.; Gordon, R. Molecular weight characterization of single globular proteins using optical nanotweezers. Analyst 2015, 140, 4799–4803
- Hacohen et al. 2018 Hacohen, N.; Ip, C. J.; Gordon, R. Analysis of egg white protein composition with double nanohole optical tweezers. ACS Omega 2018, 3, 5266–5272
- Brus 1986 Brus, L. Electronic wave functions in semiconductor clusters: experiment and theory. The Journal of Physical Chemistry 1986, 90, 2555–2560
- Yang and Tan 2020 Yang, R. X.; Tan, L. Z. Understanding size dependence of phase stability and band gap in CsPbI3 perovskite nanocrystals. The Journal of Chemical Physics 2020, 152, 034702
- Wu et al. 2017 Wu, J.; Xiang, D.; Gordon, R. Monitoring gold nanoparticle growth in situ via the acoustic vibrations probed by four-wave mixing. Analytical Chemistry 2017, 89, 2196–2200
- Lovett et al. 2003 Lovett, B. W.; Reina, J. H.; Nazir, A.; Briggs, G. A. D. Optical schemes for quantum computation in quantum dot molecules. Physical Review B 2003, 68, 205319
- Becker et al. 2018 Becker, M. A. et al. Bright triplet excitons in caesium lead halide perovskites. Nature 2018, 553, 189–193
- Protesescu et al. 2015 Protesescu, L.; Yakunin, S.; Bodnarchuk, M. I.; Krieg, F.; Caputo, R.; Hendon, C. H.; Yang, R. X.; Walsh, A.; Kovalenko, M. V. Nanocrystals of Cesium Lead Halide Perovskites (CsPbX3, X = Cl, Br, and I): Novel Optoelectronic Materials Showing Bright Emission with Wide Color Gamut. Nano Letters 2015, 15, 3692–3696
- Li et al. 2018 Li, B.; Huang, H.; Zhang, G.; Yang, C.; Guo, W.; Chen, R.; Qin, C.; Gao, Y.; Biju, V. P.; Rogach, A. L., et al. Excitons and biexciton dynamics in single CsPbBr3 perovskite quantum dots. The Journal of Physical Chemistry Letters 2018, 9, 6934–6940
- Nair and Takagahara 1997 Nair, S. V.; Takagahara, T. Theory of exciton pair states and their nonlinear optical properties in semiconductor quantum dots. Physical Review B 1997, 55, 5153
- Xue et al. 2019 Xue, J.; Wang, R.; Chen, L.; Nuryyeva, S.; Han, T.-H.; Huang, T.; Tan, S.; Zhu, J.; Wang, M.; Wang, Z.-K., et al. A small-molecule “charge driver” enables perovskite quantum dot solar cells with efficiency approaching 13%. Advanced Materials 2019, 31, 1900111
- Andrews et al. 2011 Andrews, D. L.; Curutchet, C.; Scholes, G. D. Resonance energy transfer: beyond the limits. Laser Photonics Reviews 2011, 5, 114–123
- Zhang et al. 2020 Zhang, W.; Li, J.; Lei, H.; Li, B. Temperature-dependent Förster resonance energy transfer from upconversion nanoparticles to quantum dots. Optics Express 2020, 28, 12450–12459
- Nazir et al. 2005 Nazir, A.; Lovett, B. W.; Barrett, S. D.; Reina, J. H.; Briggs, G. A. D. Anticrossings in Förster coupled quantum dots. Physical Review B 2005, 71, 045334
- Nazir 2009 Nazir, A. Correlation-dependent coherent to incoherent transitions in resonant energy transfer dynamics. Physical Review Letters 2009, 103, 146404
- Rohrbach 2005 Rohrbach, A. Stiffness of optical traps: quantitative agreement between experiment and electromagnetic theory. Physical Review Letters 2005, 95, 168102
- Ezzeldien et al. 2021 Ezzeldien, M.; Al-Qaisi, S.; Alrowaili, Z. A.; Alzaid, M.; Maskar, E.; Es-Smairi, A.; Vu, T. V.; Rai, D. P. Electronic and optical properties of bulk and surface of CsPbBr3 inorganic halide perovskite a first principles DFT 1/2 approach. Scientific Reports 2021, 11
- Liu et al. 2020 Liu, X.; Zhao, H.; Wei, L.; Ren, X.; Zhang, X.; Li, F.; Zeng, P.; Liu, M. Ligand-modulated electron transfer rates from CsPbBr3 nanocrystals to titanium dioxide. Nanophotonics 2020, 10, 1967–1975
- Thomas et al. 2002 Thomas, P.; Möller, M.; Eichmann, R.; Meier, T.; Stroucken, T.; Knorr, A. Microscopic foundation of the Förster excitonic energy transfer process. Physica Status Solidi (b) 2002, 230, 25–29
- Förster 1948 Förster, T. Zwischenmolekulare Energiewanderung und Fluoreszenz. Annalen der Physik 1948, 437, 55–75
- Raino et al. 2016 Raino, G.; Nedelcu, G.; Protesescu, L.; Bodnarchuk, M. I.; Kovalenko, M. V.; Mahrt, R. F.; Stoferle, T. Single Cesium Lead Halide Perovskite Nanocrystals at Low Temperature: Fast Single-Photon Emission, Reduced Blinking, and Exciton Fine Structure. ACS Nano 2016, 10, 2485–2490
- Craig and Thirunamachandran 1982 Craig, D.; Thirunamachandran, T. Advances in Quantum Chemistry Volume 16; Elsevier, 1982; pp 97–160
- Thränhardt et al. 2002 Thränhardt, A.; Ell, C.; Khitrova, G.; Gibbs, H. Relation between dipole moment and radiative lifetime in interface fluctuation quantum dots. Physical Review B 2002, 65, 035327
- Shcherbakov-Wu et al. 2021 Shcherbakov-Wu, W.; Sercel, P. C.; Krieg, F.; Kovalenko, M. V.; Tisdale, W. A. Temperature-Independent Dielectric Constant in CsPbBr3 Nanocrystals Revealed by Linear Absorption Spectroscopy. The Journal of Physical Chemistry Letters 2021, 12, 8088–8095
- Sambale et al. 2007 Sambale, A.; Buhmann, S. Y.; Welsch, D.-G.; Tomaš, M.-S. Local-field correction to one- and two-atom van der Waals interactions. Physical Review A 2007, 75, 042109
- Paulus et al. 2000 Paulus, M.; Gay-Balmaz, P.; Martin, O. J. F. Accurate and efficient computation of the Green’s tensor for stratified media. Physical Review E 2000, 62, 5797–5807
- Johnson and Christy 1972 Johnson, P. B.; Christy, R. W. Optical Constants of the Noble Metals. Physical Review B 1972, 6, 4370–4379
- DuBose and Kamat 2021 DuBose, J. T.; Kamat, P. V. Directing Energy Transfer in Halide Perovskite–Chromophore Hybrid Assemblies. Journal of the American Chemical Society 2021, 143, 19214–19223
- Richter et al. 2006 Richter, M.; Ahn, K. J.; Knorr, A.; Schliwa, A.; Bimberg, D.; Madjet, M. E.-A.; Renger, T. Theory of excitation transfer in coupled nanostructures – from quantum dots to light harvesting complexes. Physica Status Solidi (b) 2006, 243, 2302–2310
- Specht et al. 2015 Specht, J. F.; Knorr, A.; Richter, M. Two-dimensional spectroscopy: An approach to distinguish Förster and Dexter transfer processes in coupled nanostructures. Physical Review B 2015, 91, 155313
- Carlson et al. 2020 Carlson, C.; Knorr, A.; Hughes, S. Screening of the quantum dot Förster coupling at small distances. Optics Letters 2020, 45, 3357
- Reich and Shklovskii 2016 Reich, K. V.; Shklovskii, B. I. Exciton transfer in array of epitaxially connected nanocrystals. ACS Nano 2016, 10, 10267–10274
- Pierrehumbert 2014 Pierrehumbert, R. In Encyclopedia of Astrobiology; Amils, R., Gargaud, M., Cernicharo Quintanilla, J., Cleaves, H. J., Irvine, W. M., Pinti, D., Viso, M., Eds.; Springer Berlin Heidelberg: Berlin, Heidelberg, 2014; pp 1–3
- Gordon 2022 Gordon, R. Future Prospects for Biomolecular Trapping with Nanostructured Metals. ACS Photonics 2022,