The Galactic interstellar medium has a preferred handedness of magnetic misalignment
Abstract
The Planck mission detected a positive correlation between the intensity () and -mode polarization of the Galactic thermal dust emission. The correlation is a parity-odd signal, whose statistical mean vanishes in models with mirror symmetry. Recent work has shown with strong evidence that local handedness of the misalignment between the dust filaments and the sky-projected magnetic field produces signals. However, it remains unclear whether the observed global signal is caused by statistical fluctuations of magnetic misalignment angles, or whether some parity-violating physics in the interstellar medium sets a preferred misalignment handedness. The present work aims to make a quantitative statement about how confidently the statistical-fluctuation interpretation is ruled out by filament-based simulations of polarized dust emission. We use the publicly available DUSTFILAMENTS code to simulate the dust emission from filaments whose magnetic misalignment angles are symmetrically randomized, and construct the probability density function of , a weighted sum of power spectrum. We find that Planck data has a tension with the simulated distribution. Our results strongly support that the Galactic filament misalignment has a preferred handedness, whose physical origin is yet to be identified.
I Introduction
The cosmic microwave background (CMB) is the most powerful cosmological probe to date. Observations of the CMB temperature and polarization anisotropies by the Planck satellite and many other experiments are in good agreement with the standard picture of a Lambda cold dark matter (CDM) universe that begins with an inflationary epoch Planck2018Params ; Planck2018Inflation ; ACT20 ; SPT21Params ; Polarbear20 . Yet the -mode polarization in CMB, which is regarded as the smoking gun of early-universe inflation, has not been observed BK16 ; BK18 ; BK21 . The Galactic foreground and, in particular, the thermal emission from interstellar dust grains has become one of the major obstacles to achieving higher-precision measurements of the -mode polarization of CMB PlanckXXX ; Planck2018FG ; BK15 . Thus, the future CMB science crucially depends on the capability of understanding the physics and the statistics of the Galactic thermal dust emission. Since the dust grains tend to align with their short axes parallel to the ambient magnetic field Purcell75 ; DUSTGrain , the problem of CMB foreground removal is entwined with the study of the Galactic magnetic field, too.
Planck mapped the full sky in nine frequency bands, of which seven are sensitive to polarization. In each polarization-sensitive frequency channel, Planck measures a intensity () map, a -polarization map and a -polarization map. The maps can be converted to a -mode scalar map and a -mode pseudo-scalar map. The statistics of the maps are often presented in the form of correlation between the components, i.e. the power spectra. The components are invariant under a parity transformation, whereas the component changes sign in the mirror world. Thus, for models that preserve mirror symmetry, the ensemble averages of parity-odd and power spectra are expected to vanish. A detection of or correlation beyond statistical fluctuations, either in the Galactic foreground or in the CMB, would provide valuable information of parity-breaking physics beyond the standard picture Bracco19 ; Eskilt22 ; Greco22 ; Diego22 ; Komatsu22 .
The channel at 353 GHz, the highest polarization-sensitive frequency, is the most sensitive to the Galactic polarized dust emission. The Planck 353 GHz polarized sky map exhibits a few non-trivial properties, such as a significantly non-unity , a positive correlation, and a weakly positive correlation PlanckXXX ; Planck2018FG ; Weiland20 . All these features except for the parity-odd signal can be qualitatively explained by the state-of-the-art magneto-hydrodynamic (MHD) simulations MHD1 ; MHD2 ; MHD3 and by phenomenologically modeling the magnetized filamentary structure of the interstellar medium (ISM) PlanckEBAsym ; DUSTFILAMENTS . In particular, the publicly available filament-based code DUSTFILAMENTS DUSTFILAMENTS is able to reproduce the , , and power spectra, as well as some non-Gaussian features (Minkowski functionals) of the Planck 353 GHz sky map. The DUSTFILAMENTS code is also shown to be in good agreement with MHD simulations.
It has been demonstrated with strong evidence that the parity-odd signal in Planck high-frequency maps is driven by misalignment between dust filaments and the sky-projected magnetic field Huffenberger20 ; Clark21 . However, a globally positive correlation over a wide range of scales (-), as seen in the Planck data, has only been reproduced in phenomenological simulations with artificial input of significantly skewed distribution of the magnetic misalignment angles. For simple models with symmetric distribution of the magnetic misalignment angles, the correlation arising from statistical fluctuations is typically much smaller than the observed one Huffenberger20 ; DUSTFILAMENTS . Thus, the observed signal can be regarded as a hint about a global preference of misalignment handedness. Quantification of the statistical significance of such a hint, the topic of the present work, is valuable for the exploration of parity-breaking mechanism in the ISM beyond the current understanding of the Galactic physics Planck2018FG ; Bracco19 .
The obvious strategy is to simulate dust emission maps with null hypothesis, that is, symmetric distribution of magnetic misalignment angles, and compare the correlation of the Planck data and that of the simulated maps. The problem of the direct comparison method is that even phenomenological filament-based simulations of Galactic dust emission are computationally expensive, and the dust power spectrum may not obey a multi-variable Gaussian distribution. Straightforward detection of a anomaly in the power spectrum would require at least millions of simulated dust maps, which, taking the DUSTFILAMENTS code for example, costs CPU hours.
The present work aims to find a more computationally economic approach to estimate the statistical significance of the global preference of misalignment handedness. The idea is to compress the information into a simple integrated quantity. Although the dust intensity and polarization maps are highly non-Gaussian, an integrated quantity contains sums of many adjacent modes, and therefore approximately obeys a Gaussian distribution, whose parameters can be estimated with an affordably small set of simulations.
II Data and Softwares
Following Section 3.3.1 of Ref. PlanckXXX , we produce a series of nested “large region” (LR) masks: LR72, LR63, LR53, LR42, LR33, and LR24, where the postfix in LRmn represents the fraction (mn%) of the sky that is unmasked. To avoid possible bias from noise correlations, we compute the correlation between two different half mission maps of Planck data release 3 Planck2018HFI . We have confirmed that all the results presented in this paper do not vary much if we use, say, even-odd splitting of the data Planck2018HFI or the SRoll maps with reduced large-scale systematic effects SRoll2 .
We use DUSTFILAMENTS, a code recently developed by Ref. DUSTFILAMENTS , to simulate dust maps. DUSTFILAMENTS is a three dimensional model composed of filaments that are imperfectly aligned with the magnetic field. Although the filament-only recipe is likely to be an oversimplification of the complex morphology of the ISM Konstantinou22 , DUSTFILAMENTS is able to reproduce the main features of the Planck 353 GHz maps. In particular, it generates frequency decorrelation and non-Gaussian features on small scales that are both in agreement with Planck data DUSTFILAMENTS . By default, we use the software settings suggested in Table 1 of Ref. DUSTFILAMENTS , which assumes a symmetric distribution of the magnetic misalignment angles, the null hypothesis that we want to test.
All the maps are processed with the standard Healpix software Healpix . Angular power spectra of masked maps are computed with NaMaster NaMaster , whose -bins are taken to be uniformly spacing with . Cross power spectra between two different maps are always symmetrized. For instance, the power spectrum actually refers to in NaMaster convention.
III Stacking the Dust Maps
Before carrying out a detailed statistical description, we would like to qualitatively demonstrate the anomalous signal in the Planck data by stacking the polarization maps. The polarization stacking approach, which we sketch below, can be found in details in Refs. WMAP7 ; Planck2016IandS .
With flat-sky approximation, the spin-2 component around a central pixel can be written as
| (1) |
The operator is defined in Fourier space as a multiplier . The local Cartesian coordinates are given by
| (2) |
where is the angular distance from the central pixel, and is the angle between the radial vector from the central pixel and the longitudinal vector (pointing to the south pole). We use instead of to approximate the radial distance, because the transformation given by Eq. (2) preserves the pixel area from spherical sky to flat sky111For the stacking in the present work, the difference between and is actually unimportant.. The components are obtained by rotating the components from the local Cartesian basis to the radial and tangential polar basis,
| (3) | |||||
| (4) |
The correlations between and the intensity at the central pixel, , are given by
| (5) | |||||
| (6) |
respectively. Here and are the and power spectra, and is the Bessel function of the first kind of order . The extra minus signs on the right-hand side of Eqs. (5-6) arise from the Bessel integral .
According to Eqs. (5-6), the patterns of stacked , around pixels with a skewed distribution of explore the , correlations, respectively. Because correlation has a much lower signal to noise ratio than , the conventional approach used in the literature, that stacking polarization maps around intensity peaks, does not yield a recognizable pattern. The signal to noise ratio can be enhanced if we stack around many more hot pixels. To focus on the scales where the anomalous signal is found, we filter both the intensity map and the polarization maps with a band-pass filter, defined by
| (7) |
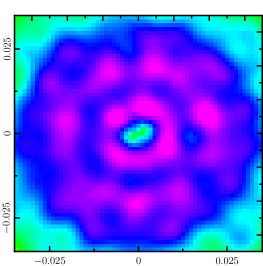
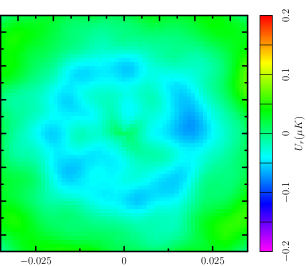
In Fig. 1 we show the stacked , patches around the hottest pixels that cover steradian within the LR63 mask. The left panels are the Planck result, and the right panels are done with the DUSTFILAMENTS simulation in Ref. DUSTFILAMENTS , which is publicly downloadable. The similar patterns of stacked in the upper panels confirm that the simple filament-based approximation can reproduce the observed dust correlation to a reasonably good accuracy. The rich ring pattern of stacked in Planck maps, however, is not seen in the DUSTFILAMENTS simulation. The much weaker signal in DUSTFILAMENTS simulation (faint blue ring in the lower right panel) arises from statistical fluctuations, or in cosmological terms, the cosmic variance of the particular simulation used here.
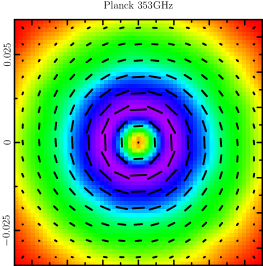
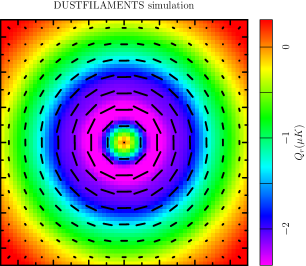
The above example gives a good visual illustration that the typical signal (stacked ) of DUSTFILAMENTS simulations is much smaller than the Planck observed one. The stacking approach, however, is not an optimal method for quantitative calculation of the statistics. This is because a large set of simulations is needed to compute the non-diagonal covariance matrix, and possibly non-Gaussian features of the stacked vector. Fourier-space modes are less coupled and hence are better for a statistical analysis, which we carry out below.
IV Statistical Analysis
Since we are mostly interested in a coherent nonzero signal over a wide range of angular scales (), a full likelihood analysis of power spectrum, which is computationally expensive, may be avoided by compressing the information to an integrated quantity
| (8) |
Unless otherwise stated, we fix the scale mask to be , the multipole range where the positive signal was found in Planck 353 GHz maps. The factor , where is roughly the spectral index of dust and power spectra found by Planck mission PlanckXXX ; Planck2018FG , approximately sets equal weights to all multipoles. The weighted sum of in the denominator makes insensitive to the overall normalizations of the simulated temperature and polarization maps. Note that the power spectra and hence also depend on the sky mask, because the dust maps are not statistically isotropic.
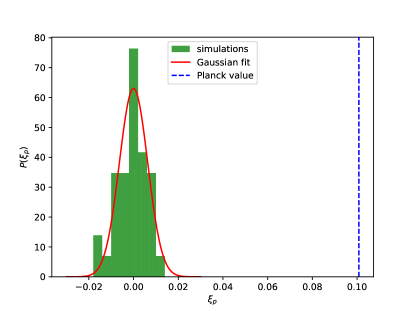
According to the central limit theorem, the integrated quantity should approximately obey a Gaussian distribution. This greatly simplify the problem, as we can then compute the probability density function with a small set of simulations. Fig. 2 shows the result from 36 DUSTFILAMENTS simulations, with sky mask LR63 and scale mask . The Planck is about away from the simulated distribution, suggesting that simulations with symmetric distribution of magnetic misalignment angles fails to describe the reality.
| scale mask | sky mask | standard deviation | excess kurtosis | Planck | tension |
|---|---|---|---|---|---|
| LR72 | |||||
| LR63 | |||||
| LR53 | |||||
| LR42 | |||||
| LR33 | |||||
| LR24 | |||||
| LR63 |
To further test the look-elsewhere effect, we show in Table 1 the results for various choices of sky mask and scale mask. In all cases, the tension between Planck data and simulations exceeds , strongly rejecting the simulations as an acceptable description of the reality. We also list the excess kurtosis as a measure of the deviation from Gaussian tail distribution. For a comparison, in Fig. 3 we show the distribution of excess kurtosis of 36 samples drawn from a perfect Gaussian distribution. The kurtosis values in Table 1 are all in good agreement with the distribution shown in Fig. 3, indicating no evidence of non-Gaussianity in .
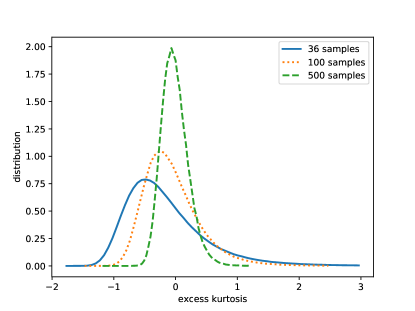
Unlike the CMB statistics that is known to be isotropic and very close to Gaussian, the statistics of Galactic dust emission is expected to be very non-Gaussian and spatially dependent. Although the central limit theorem guarantees that the integrated quantity approximately follows a Gaussian distribution, it is hard to quantify the level of proximity between and a perfect Gaussian function. Ideally one would also like to numerically test the convergence of towards a Gaussian distribution by increasing the number of simulations. As shown in Fig. 3, however, the distribution width of excess kurtosis does not shrink much if we increase the number of simulations from 36 to 100. Without investing much more computer power, we will not be able to tell whether the negative values of excess kurtosis in Table 1 are due to statistical fluctuations or are consequences of less extended tail distributions of . Nevertheless, the latter case (less extended tails of ) increases the tension between data and the null hypothesis, and therefore can only make our conclusion more robust.
V Conclusions
The major conclusion of this work, that the observed dust signal is inconsistent with a pure statistical fluctuation, may sound a bit trivial in the sense that the cosmic variance (statistical fluctuations) of high- power spectra are all suppressed. However, as one can see from the lower right panel of Fig. 1, even the input model perfectly preserves parity symmetry, a particular realization may still present recognizable patterns at sub-degree scales. Thus, a quantitative estimation of the tail distribution of correlation is still necessary, especially when the observed dust signal is small and the dust maps are highly non-Gaussian.
Since the null hypothesis of no preferred alignment handedness is ruled out, at least around a large neighborhood ( a few hundred ) of the solar system, there must exist a globally preferred handedness of the filament magnetic misalignment. Recent studies on the correlation between Farady depth and polarization of the synchrotron emission suggest helicity in the large-scale Galactic magnetic field West20 , which may lead to a dust correlation Bracco19 . However, this explanation has only been shown to be applicable to correlation on large angular scales () Bracco19 . The physical origin of the parity violation on small scales (up to ) remains unknown. Understanding the physical origin of this parity violation potentially has a great value for many fields of astrophysics and cosmology. We also warn that the parity violation of the dust foreground must be carefully taken into account when studying the recently discovered tantalizing - hints of cosmic birefringence Eskilt22 ; Greco22 ; Diego22 ; Komatsu22 .
VI Acknowledgements
This work is supported by the National key R&D Program of China (Grant No. 2020YFC2201600), National Natural Science Foundation of China (NSFC) under Grant No. 12073088, Guangdong Major Project of Basic and Applied Basic Research (Grant No. 2019B030302001), and National SKA Program of China No. 2020SKA0110402.
References
- (1) N. Aghanim, Y. Akrami, M. Ashdown, et al. Planck 2018 results. VI. Cosmological parameters. Astron. Astrophys., 641:A6, 2020.
- (2) Y. Akrami, F. Arroja, M. Ashdown, et al. Planck 2018 results. X. Constraints on inflation. Astron. Astrophys., 641:A10, 2020.
- (3) Simone Aiola, Erminia Calabrese, Loïc Maurin, et al. The Atacama Cosmology Telescope: DR4 Maps and Cosmological Parameters. JCAP, 12:047, 2020.
- (4) L. Balkenhol, D. Dutcher, P. A. R. Ade, et al. Constraints on CDM extensions from the SPT-3G 2018 EE and TE power spectra. Phys. Rev. D, 104(8):083509, 2021.
- (5) S. Adachi, M. A. O. Aguilar Faúndez, K. Arnold, et al. A Measurement of the CMB -mode Angular Power Spectrum at Subdegree Scales from670 Square Degrees of POLARBEAR Data. Astrophys. J., 904(1):65, 2020.
- (6) P. A. R. Ade, Z. Ahmed, R. W. Aikin, et al. Improved Constraints on Cosmology and Foregrounds from BICEP2 and Keck Array Cosmic Microwave Background Data with Inclusion of 95 GHz Band. Phys. Rev. Lett., 116:031302, 2016.
- (7) P. A. R. Ade, Z. Ahmed, R. W. Aikin, et al. BICEP2 / Keck Array x: Constraints on Primordial Gravitational Waves using Planck, WMAP, and New BICEP2/Keck Observations through the 2015 Season. Phys. Rev. Lett., 121:221301, 2018.
- (8) M. Tristram, A. J. Banday, K. M. Górski, et al. Improved limits on the tensor-to-scalar ratio using BICEP and Planck data. Phys. Rev. D, 105(8):083524, 2022.
- (9) R. Adam, P. A. R. Ade, N. Aghanim, et al. Planck intermediate results. XXX. The angular power spectrum of polarized dust emission at intermediate and high Galactic latitudes. Astron. Astrophys., 586:A133, February 2016.
- (10) Y. Akrami, M. Ashdown, J. Aumont, et al. Planck 2018 results. XI. Polarized dust foregrounds. Astron. Astrophys., 641:A11, 2020.
- (11) P. A. R. Ade, N. Aghanim, Z. Ahmed, R. W. Aikin, et al. Joint Analysis of BICEP2/ and Data. Phys. Rev. Lett., 114:101301, 2015.
- (12) E. M. Purcell. The Dusty Universe. 1975.
- (13) B. T. Draine. Interstellar Dust Grains. Annual Review of Astronomy & Astrophysics, 41:241–289, January 2003.
- (14) A. Bracco, S. Candelaresi, F. Del Sordo, and A. Brandenburg. Is there a left-handed magnetic field in the solar neighborhood?. Exploring helical magnetic fields in the interstellar medium through dust polarization power spectra. Astron. Astrophys., 621:A97, January 2019.
- (15) J. R. Eskilt. Frequency-dependent constraints on cosmic birefringence from the LFI and HFI Planck Data Release 4. Astron. Astrophys., 662:A10, June 2022.
- (16) Alessandro Greco, Nicola Bartolo, and Alessandro Gruppuso. Cosmic birefrigence: cross-spectra and cross-bispectra with CMB anisotropies. JCAP, 2022(3):050, March 2022.
- (17) P. Diego-Palazuelos, J. R. Eskilt, Y. Minami, M. Tristram, R. M. Sullivan, A. J. Banday, R. B. Barreiro, H. K. Eriksen, K. M. Górski, R. Keskitalo, E. Komatsu, E. Martínez-González, D. Scott, P. Vielva, and I. K. Wehus. Cosmic Birefringence from Planck Public Release 4. arXiv e-prints, page arXiv:2203.04830, March 2022.
- (18) Eiichiro Komatsu. New physics from the polarised light of the cosmic microwave background. arXiv e-prints, page arXiv:2202.13919, February 2022.
- (19) J. L. Weiland, G. E. Addison, C. L. Bennett, M. Halpern, and G. Hinshaw. An Examination of Galactic Polarization with Application to the Planck TB Correlation. Astrophys. J., 893(2):119, April 2020.
- (20) Chang-Goo Kim, Steve K. Choi, and Raphael Flauger. Dust Polarization Maps from TIGRESS: E/B Power Asymmetry and TE Correlation. Astrophys. J., 880(2):106, August 2019.
- (21) A. G. Kritsuk, S. D. Ustyugov, and M. L. Norman. The structure and statistics of interstellar turbulence. New Journal of Physics, 19(6):065003, June 2017.
- (22) Robert R. Caldwell, Chris Hirata, and Marc Kamionkowski. Dust-polarization Maps and Interstellar Turbulence. Astrophys. J., 839(2):91, April 2017.
- (23) P. A. R. Ade, N. Aghanim, M. Arnaud, et al. Planck intermediate results. XXXVIII. E- and B-modes of dust polarization from the magnetized filamentary structure of the interstellar medium. Astron. Astrophys., 586:A141, 2016.
- (24) Carlos Hervías-Caimapo and Kevin M. Huffenberger. Full-sky, Arcminute-scale, 3D Models of Galactic Microwave Foreground Dust Emission Based on Filaments. Astrophys. J., 928(1):65, March 2022.
- (25) Kevin M. Huffenberger, Aditya Rotti, and David C. Collins. The Power Spectra of Polarized, Dusty Filaments. Astrophys. J., 899(1):31, August 2020.
- (26) S. E. Clark, Chang-Goo Kim, J. Colin Hill, and Brandon S. Hensley. The Origin of Parity Violation in Polarized Dust Emission and Implications for Cosmic Birefringence. Astrophys. J., 919(1):53, September 2021.
- (27) N. Aghanim, Y. Akrami, M. Ashdown, et al. Planck 2018 results. III. High Frequency Instrument data processing and frequency maps. Astron. Astrophys., 641:A3, September 2020.
- (28) J. M. Delouis, L. Pagano, S. Mottet, J. L. Puget, and L. Vibert. SRoll2: an improved mapmaking approach to reduce large-scale systematic effects in the Planck High Frequency Instrument legacy maps. Astron. Astrophys., 629:A38, September 2019.
- (29) A. Konstantinou, V. Pelgrims, F. Fuchs, and K. Tassis. Polarization power spectra and dust cloud morphology. arXiv e-prints, page arXiv:2204.13127, April 2022.
- (30) K. M. Górski, E. Hivon, A. J. Banday, B. D. Wandelt, F. K. Hansen, M. Reinecke, and M. Bartelmann. HEALPix: A Framework for High-Resolution Discretization and Fast Analysis of Data Distributed on the Sphere. Astrophys. J., 622(2):759–771, April 2005.
- (31) David Alonso, Javier Sanchez, Anže Slosar, and LSST Dark Energy Science Collaboration. A unified pseudo-Cℓ framework. MNRAS, 484(3):4127–4151, April 2019.
- (32) E. Komatsu, K. M. Smith, J. Dunkley, et al. Seven-year Wilkinson Microwave Anisotropy Probe (WMAP) Observations: Cosmological Interpretation. Astrophys. J. Suppl., 192(2):18, February 2011.
- (33) P. A. R. Ade, N. Aghanim, Y. Akrami, et al. Planck 2015 results. XVI. Isotropy and statistics of the CMB. Astron. Astrophys., 594:A16, September 2016.
- (34) For the stacking in the present work, the difference between and is actually unimportant.
- (35) J. L. West, R. N. Henriksen, K. Ferrière, A. Woodfinden, T. Jaffe, B. M. Gaensler, and J. A. Irwin. Helicity in the large-scale Galactic magnetic field. MNRAS, 499(3):3673–3689, December 2020.