Quasi-2D Fermi surface of superconducting line-nodal metal \ceCaSb2
Abstract
We report on the Fermi surfaces and superconducting parameters of \ceCaSb2 single crystals (superconducting below ) grown by the self-flux method. The frequency of de-Haas–van-Alphen and Shubnikov–de-Haas oscillations evidences a quasi-two-dimensional (quasi-2D) Fermi surface, consistent with one of the Fermi surfaces forming Dirac lines predicted by first-principles calculations. Measurements in the superconducting state reveal that \ceCaSb2 is close to a type-I superconductor with the Ginzburg–Landau (GL) parameter of around unity. The temperature dependence of the upper critical field is well described by a model considering two superconducting bands, and the enhancement of the effective mass estimated from is consistent with the quasi-2D band observed by the quantum oscillations. Our results indicate that a quasi-2D band forming Dirac lines contributes to the superconductivity in \ceCaSb2.
I Introduction
Topological superconductivity is often found in the vicinity of a topological normal state. Indeed, the most promising candidate for the topological superconductivity is a doped topological insulator [1, 2, 3, 4, 5]. Superconductivity found in Dirac semimetals is also a candidate of topological superconductivity [6, 7, 8, 9]. Furthermore, recent theoretical and experimental works revealed that the surface superconductivity can be topological even though the bulk superconductivity is trivial [10, 11]. It is important to investigate materials with a novel electronic band structure as a candidate host of a novel superconducting state.
Line-nodal semimetals are a new type of topological material, in which a band crossing is protected by the crystalline symmetry and remains gapless along a certain line [12, 13]. In nodal-loop materials with the mirror symmetry, topological crystalline superconductivity and second-order topological superconductivity have been theoretically predicted [14]. Although many materials are predicted to have nodal lines in the absence of spin–orbit coupling (SOC) [15, 16], those nodal lines are in most cases gapped out by SOC to make the material a topological insulator or a point-nodal semimetal [17]. To realize a nodal line robust against SOC, an additional symmetry such as nonsymmorphic symmetry is required [12]. Therefore, line-nodal materials with nonsymmorphic symmetry are a good platform to investigate the interplay between nodal lines and superconductivity on [18].
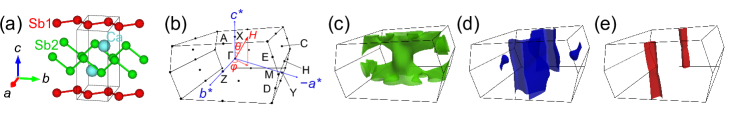
CaSb2 is a candidate of the Dirac-line material whose nodes are protected by the screw symmetry of the nonsymmorphic crystalline structure belonging to the space group (No. 11, ) [19]. First-principles calculation shows that \ceCaSb2 possesses three Fermi surfaces as shown in Fig. 1. Bands B and C, whose Fermi surfaces are nearly two-dimensional (2D), are degenerate along lines in the Brillouin-zone boundary, and those line degeneracies, or Dirac lines, cross the Fermi energy . \ceCaSb2 also has a topologically trivial three-dimensional (3D) Fermi surface from band A around the point of the Brillouin zone.
Recently, some of the present authors discovered superconductivity in \ceCaSb2 with a transition temperature of [22]. While the measurements of the nuclear quadrupole resonance suggest a conventional superconductivity [23], an unusual peak in under hydrostatic pressure implying a complex superconducting state was reported on a polycrystalline sample [24]. Furthermore, a theoretical analysis based on the symmetry indicators revealed that \ceCaSb2 can exhibit line-nodal superconductivity reflecting the band structure in the normal state [25]. Although there is a report of de-Haas–van-Alphen (dHvA) oscillations with the field in the direction [26], the authors of this work did not find a quantitative match between theory and experiment possibly because “the as-grown single crystals are self-doped.” Moreover, the 3D shapes of the Fermi surfaces based on the field-angle dependence of the quantum oscillations were not obtained. To fully understand the possible interplay between the superconductivity and Dirac lines, anisotropy of the superconducting state and underlying normal-state band structure (fermiology) is important.
In this paper, we report on the field-angle dependence of quantum oscillations and superconducting parameters of \ceCaSb2 single crystals for the first time. The field-angle dependence of the frequency of dHvA and Shubnikov–de-Haas (SdH) oscillations indicates a quasi-2D Fermi surface. This Fermi surface hosts Dirac lines according to first-principles calculations, and therefore our observation provides indirect evidence of the Dirac lines crossing . Via resistance and magnetization with and , we estimated the anisotropy in the Ginzburg–Landau (GL) coherence length , the GL parameter , and the penetration depth . We found that the quasi-2D Fermi surface observed by the quantum oscillations is likely playing a role in the superconductivity in \ceCaSb2.
II Experiment
Single crystals of \ceCaSb2 were grown by a self-flux method. Ca (Sigma-Aldrich, \unit) and Sb (Alfa Aesar, \unit) were placed in an alumina crucible (LSP ceramics) with a molar ratio of 1:5, and the crucible was sealed in a quartz tube under of argon at room temperature. The tube was heated in a box furnace (MTI Corporation, KSL-1100X) up to \unit in , kept at that temperature for , cooled down to \unit in , and then cooled down slowly to \unit at a rate of \unit[per-mode=symbol]\per. The remaining flux was removed by centrifugation.
The material and orientation of crystals were identified with an x-ray diffractometer (Rigaku, MiniFlex600) using the Cu- radiation. Crystals of \ceCaSb2 are platelets with a thickness of about , and we confirmed that the crystal grows in the plane as reported in Supplemental Material [27].
Direct-current (DC) magnetization above was measured with a commercial magnetometer (Quantum Design, MPMS3). DC magnetization down to was measured with a magnetometer (Quantum Design, MPMS-XL) equipped with a \ce^3He refrigerator (IQUANTUM, iHelium3). Alternating-current (AC) magnetic susceptibility was measured with a lock-in amplifier (Stanford Research Systems, SR830) using a homemade susceptometer similar to that reported in Ref. [28] compatible with the adiabatic-demagnetization-refrigerator (ADR) option of commercial equipment (Quantum Design, PPMS). Our crystal exhibits a single transition at [27], while a polycrystalline sample used in the original report [22] showed double transitions originating from the bulk and the grain boundary.
Magnetic torque was measured at the National High Magnetic Field Laboratory (Tallahassee, Florida, USA) under the DC field up to ( is the magnetic permeability of vacuum). We measured two samples A and B. The samples were mounted on self-sensing cantilevers with a length of (SCL-Sensor Tech, Vienna, Austria), and the cantilevers were placed in a \ce^3He refrigerator. Piezo-torque magnetometry was performed with a balanced Wheatstone bridge that uses two piezoresistive paths on the cantilever (with and without the samples) as well as two resistors at room temperature that can be adjusted to balance the circuit. The voltage across the Wheatstone bridge was measured using a lock-in amplifier (Stanford Research Systems, SR860).
Electrical resistance was measured by a standard four-probe method in PPMS. Gold wires with a diameter of (California Fine Wires, \unit) were attached to the crystal using silver epoxy (Epoxy Technology, H20E). The current was in the plane, but the in-plane angle is unknown. The horizontal rotator option was used for angular dependence of the SdH oscillation, and the ADR option was used for measurements below . Our crystal shows good metallic behavior, with a residual resistivity of and a residual-resistance ratio (RRR) of 184. The magnetoresistance reaches \unit with an out-of-plane field of , while the magnetoresistance is \unit with in-plane field [27]. Large RRR and magnetoresistance ensure the good quality of our crystals.
First-principles calculations based on the density functional theory (DFT) were performed using the QUANTUM ESPRESSO package [29, 30]. We considered fully relativistic pseudopotentials from the pslibrary1.0.0 database [31, 32]. The ion–electron interaction was treated with the projector augmented wave pseudopotentials, and the exchange and correlation interaction was treated within the generalized gradient approximation [33]. The electron wavefunctions were expanded in a plane-wave basis set with a cutoff of . The internal degrees of freedom were relaxed until the forces on each atom were less than , where is the Bohr radius. The Brillouin-zone sampling for the DFT calculation was performed using the Monkhorst–Pack scheme with a -point grid, and SOC was taken into account self-consistently. The Fermi surfaces were calculated on a further interpolated mesh of using the PAOFLOW code [34, 35]. The quantum-oscillation frequencies expected for the calculated Fermi surfaces were evaluated using the SKEAF code [36]. The calculated band structure is presented in Supplemental Material [27].
III Results
III.1 Normal state
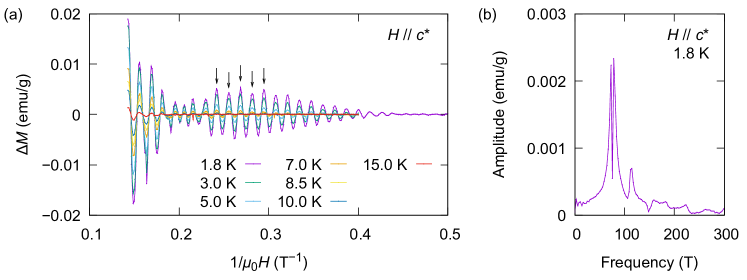
Firstly, we present the dHvA oscillations of \ceCaSb2 measured using DC magnetization in Fig. 2(a). The magnetic field is along the axis. (\ceCaSb2 has a monoclinic structure with , and thus we use the direction to indicate that the field is perpendicular to the plane.) We observed clear oscillations down to at or up to at . The oscillations exhibit a beating, evidencing the existence of two frequencies close to each other. In addition, the staggered amplitude of the beat (indicated by arrows) suggests another frequency. We comment that we did not observe dHvA oscillations with the in-plane field up to . The Fourier transform of the dHvA oscillations at is shown in Fig. 2(b). We see three distinct peaks; the peaks at correspond to the beating in the raw oscillations and the one at to the staggered amplitude.
| (\unit) | (\unit) | (\unit[per-mode=symbol]^2^-1^-1) | Possible origin | |||
|---|---|---|---|---|---|---|
| Band C | ||||||
| Band C | ||||||
| Band A (or B) | ||||||
| Band C | ||||||
| Band C | ||||||
| Band A (or B) | ||||||
| Band C | ||||||
| Band C | ||||||
| Band A or B |
We fitted the dHvA oscillations in Fig. 2(a) with the Lifshitz–Kosevich (LK) formula [37] with three components:
| (1) | ||||
| (2) | ||||
| (3) | ||||
| (4) | ||||
| (5) |
where is the electron factor, is the effective mass, is the electron mass, is the Boltzmann constant, is the reduced Planck constant, is the elementary charge, and , , and denote the flux density, temperature, and frequency, respectively. is the amplitude of each oscillation component. The phase shift reflects the dimensionality and the Berry phase; the trivial Berry phase results in and in 2D and 3D materials, respectively, while a nontrivial Berry phase as in Dirac systems leads to and or . The fitting results are summarized in Table 1. According to our first-principles calculation, expected oscillation frequencies around are from the Fermi surface of band A, from the small pocket around the Y point of band B, and from the minimum and maximum cross-sectional area of band C, if the chemical potential is shifted by (hole doping). The quasi-2D Fermi surface around the ZA line of band B is expected to exhibit oscillation frequencies above . We consider that the two frequencies contributing to the beating observed in the experiment originate from band C; the oscillation from band C in the calculation seems to have a much lower frequency in the experiment, or in other words, the Fermi surface is more 2D without a large deformation. The field-angle dependence discussed later shows that both frequencies follow quasi-2D behavior, and thus neither is attributable to the 3D small pocket of band B. The origin of the oscillation with is not clear, possibly related to band A or B. The observed values of indicate that band C may have a nontrivial Berry phase. Since the Dirac nodal lines protected by the nonsymmorphic symmetry are predicted on bands B and C, the observation of one of these Fermi surfaces can be indirect evidence of the Dirac lines crossing .
Comparing our results with the report in Ref. [26], our crystal seems less hole-doped or closer to the stoichiometry. The two frequencies originating from the electron Fermi surface of band C are larger by \qtyrange0.52.3. These shifts in the frequencies indicate more electron doping in our sample than that in Ref. [26]. Assuming that the other frequency comes from the hole Fermi surface of band A, a smaller frequency also suggests a relative electron doping in our sample. However, our first-principles calculation suggests that our crystal is hole-doped by . Therefore, our crystal is less hole-doped rather than electron-doped. The smaller doping may be reflected in the lower Dingle temperatures in our sample than in the previously reported crystal.
dHvA oscillations measured via magnetic torque are shown in Fig. 3. Figures 3(a) and (b) show the raw oscillations at different field angles. We see that the oscillation frequency becomes higher as the field rotates from the axis to the plane. The fitting results with the LK formula are summarized in Table 1. The peak positions of the Fourier-transformed spectra are presented as a function of in Fig. 3(c). In the dependence, we see that the lower two frequencies diverge toward following . This divergence evidences the presence of a quasi-2D Fermi surface, consistent with band C. The other frequency splits into two branches not following as increases. [A magnified view around low frequency is provided later as Fig. 4(b).] These oscillations may be related to the oscillation from band A and the oscillation from band B. The overall dependence evidences the presence of quasi-2D band C and other more 3D Fermi surfaces.
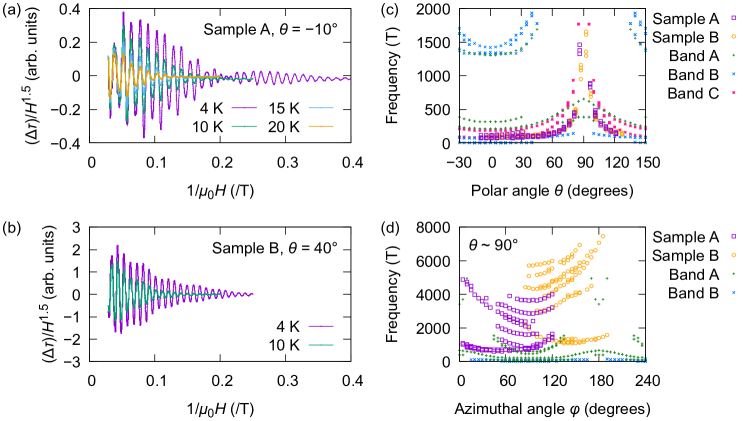
In the dependence at shown in Fig. 3(d), we did not observe a good agreement between experiment and theory. According to the first-principles calculation, we expect to see oscillations mainly from band A. However, observed oscillations seem dominated by 2D Fermi surfaces for the following reason. First, band C exhibits oscillations with about at around and at around . Therefore, the main oscillations in Fig. 3(d) ( for sample A and for sample B) are attributed to band C due to a small out-of-plane misalignment of the field. Next, if we scale the frequencies for sample A by a factor of 1100/700, the data roughly match with those for sample B. This fact suggests that all frequencies have the same dependence as the main oscillation from band C. Thus, most of the oscillation frequencies observed in Fig. 3(d) can be attributable to quasi-2D band C or the tubular part of band B. We could not detect oscillations from band A probably because of a large scattering. Since our calculation predicts that the effective mass for band A at is reasonably small ( ), the dominant reason for the absence of quantum oscillations from band A will be a large scattering or high Dingle temperature. As well as applying a higher field, eliminating the oscillations from bands B and C by precisely aligning the field direction will be necessary for the investigation of band A.
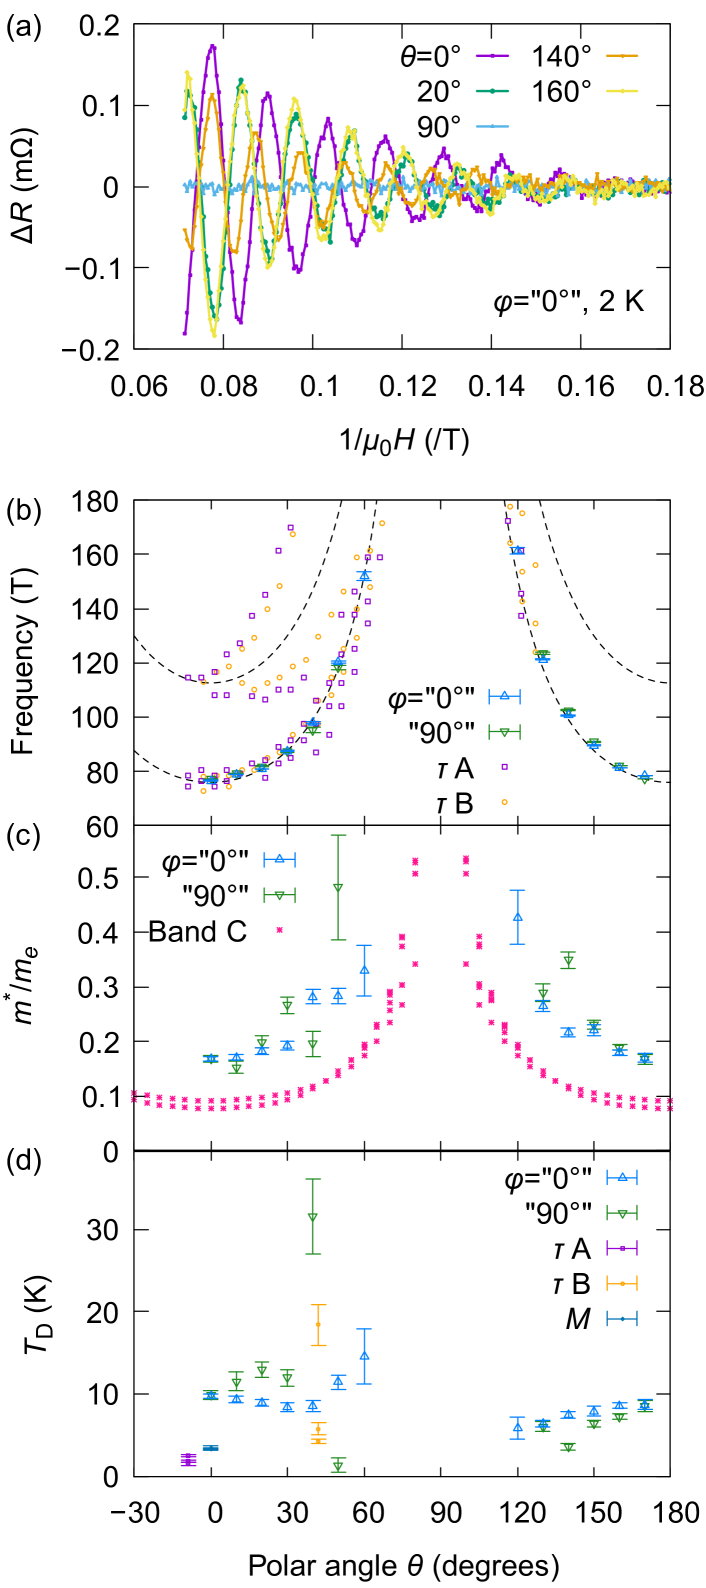
The SdH oscillations of \ceCaSb2 at are shown in Fig. 4(a). We observed only one frequency component although there are multiple components in dHvA oscillations. Probably the lower two frequencies observed in dHvA oscillations are not resolved, and the other oscillation was not observed because of its small amplitude. By fitting the data with the LK formula [37, 38], we extracted the frequency of the SdH oscillation, effective mass, and Dingle temperature at each angle as shown in Figs. 4(b–d). Here, the origin of is arbitrary since we do not know the in-plane direction of the crystal. The frequency of the SdH oscillation matches with the lower two frequencies of the dHvA oscillations, diverging toward . The effective mass is enhanced as the field rotates to the plane, and the masses at and are nearly double the value at . This increase in mass is consistent with the expected behavior for band C. These angular dependences of the frequency and effective mass again confirm the presence of a quasi-2D Fermi surface in \ceCaSb2. The Dingle temperature is almost independent of the angle and stays at around . The cause of higher Dingle temperature in the SdH oscillation than in the dHvA oscillation is not known; possibly the crystal slightly degraded while curing Ag epoxy at \unit or during repeated thermal cycles between room temperature and .
III.2 Superconducting state
We present in Fig. 5 the resistivity of \ceCaSb2 below under various field values. Onset of the superconducting transition is suppressed to below with [Fig. 5(a)] and [Fig. 5(b)].
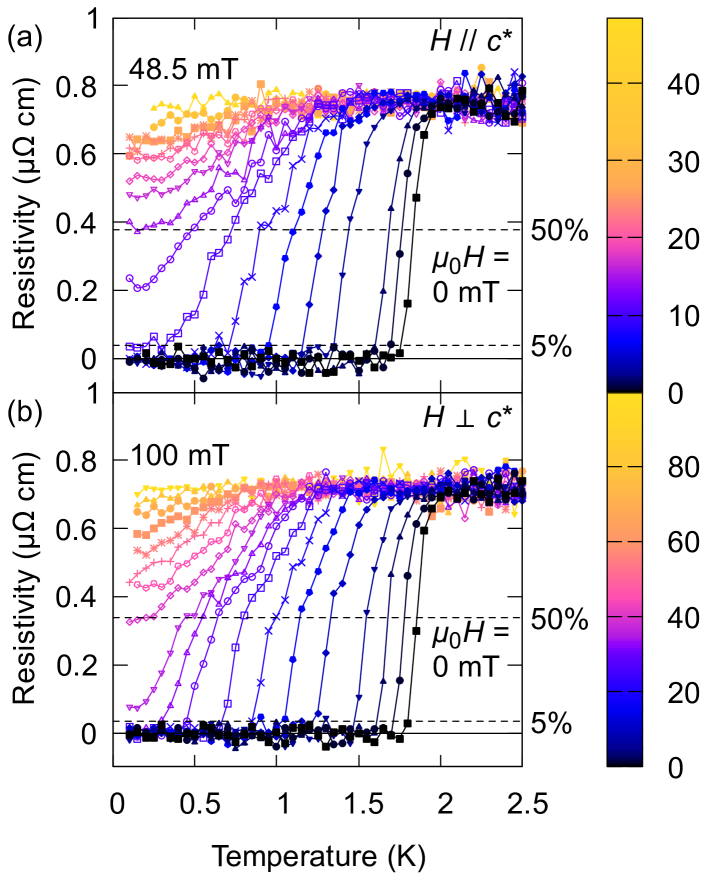
Figure 6 shows the superconducting phase diagram of \ceCaSb2. We defined the transition temperature based on two criteria: \unit and \unit of the normal-state resistivity under a high magnetic field. The temperature dependence of the upper critical field cannot be fully described by the Werthamer–Helfand–Hohenberg relation [39] but can be well fitted by a theoretical model for anisotropic two-gap superconductors [40]. This nonmonotonic temperature dependence of the slope of the – curve was previously attributed to the effect of the grain boundary for a polycrystalline sample, but our study using a single crystal reveals that this behavior is intrinsic to \ceCaSb2. Since \ceCaSb2 has only one band (band A) which is not related to Dirac lines around , the behavior of consistent with multiple superconducting gaps indicates that at least one of the two bands forming Dirac lines (band B or C) contributes to the superconductivity of \ceCaSb2.
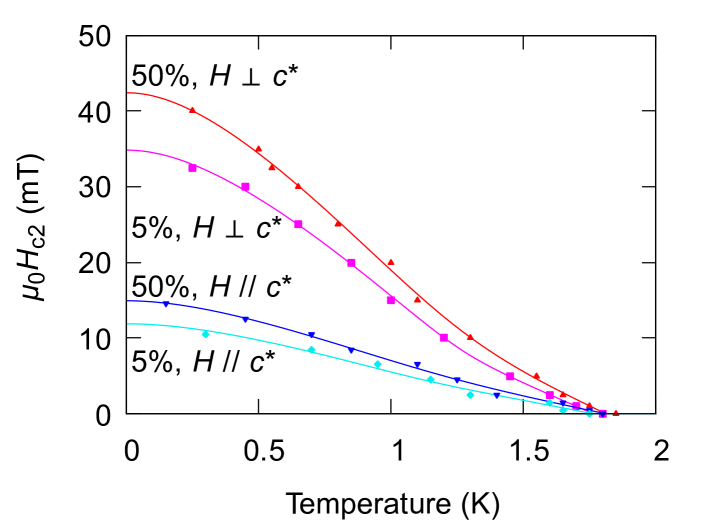
By fitting the data with the two-gap model, was estimated to be and . These values of are about 10-times smaller than that of a polycrystalline sample [22]. We consider that a cleaner sample has led to a longer coherence length or smaller . Compared to the report in Ref. [26], is about 1.5 times larger. This difference may be due to the different measurement techniques or crystal quality, a -axis component of the field by misalignment, or the anisotropy within the plane.
The anisotropy of can be explained by the field-angle dependence of the effective mass. Considering that the coherence length in the GL theory at is comparable to that in the Bardeen–Cooper–Schrieffer theory [41]: ( is the flux quantum, and are the Fermi velocity and wavelength, respectively, and is the superconducting gap), suggests that is -times larger with than with . This value is consistent with the fact that estimated from the SdH oscillation is nearly doubled at . Therefore, the anisotropy of can mainly be attributed to the field-angle dependence of . This fact indicates that the quasi-2D Fermi surface might be playing a major role near .
Figure 7 presents the temperature dependence of DC susceptibility after demagnetization correction. Under both in-plane and out-of-plane fields, our sample exhibits strong diamagnetism of before demagnetization correction. The demagnetization factors were initially estimated by approximating the crystal by an ellipsoid, but this approximation led to a volume fraction larger than \unit, suggesting an underestimation of the demagnetization factors. Thus, we adjusted the demagnetization factor for so that the volume fraction becomes \unit under in the zero-field-cooling (ZFC) process. For the demagnetization factor for , we used the maximum possible value that does not make the curve shown in Fig. 8(a) a multivalued function. This value still leads to a volume fraction larger than \unit, but a further increase of the demagnetization factor leads to an unphysical behavior. With these demagnetization factors, the shielding fraction in the field-cooling (FC) process is \unit of that in the ZFC process. Therefore, \ceCaSb2 is a type-II superconductor with a weak vortex pinning. The shielding fraction decreases with , indicating a lower critical field of .
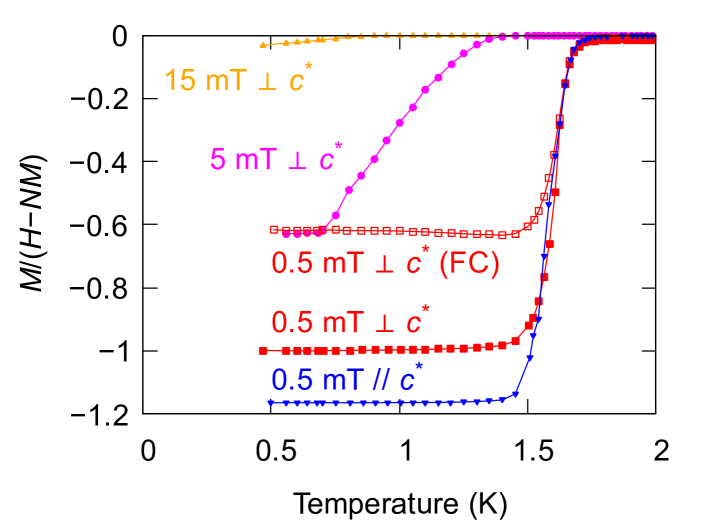
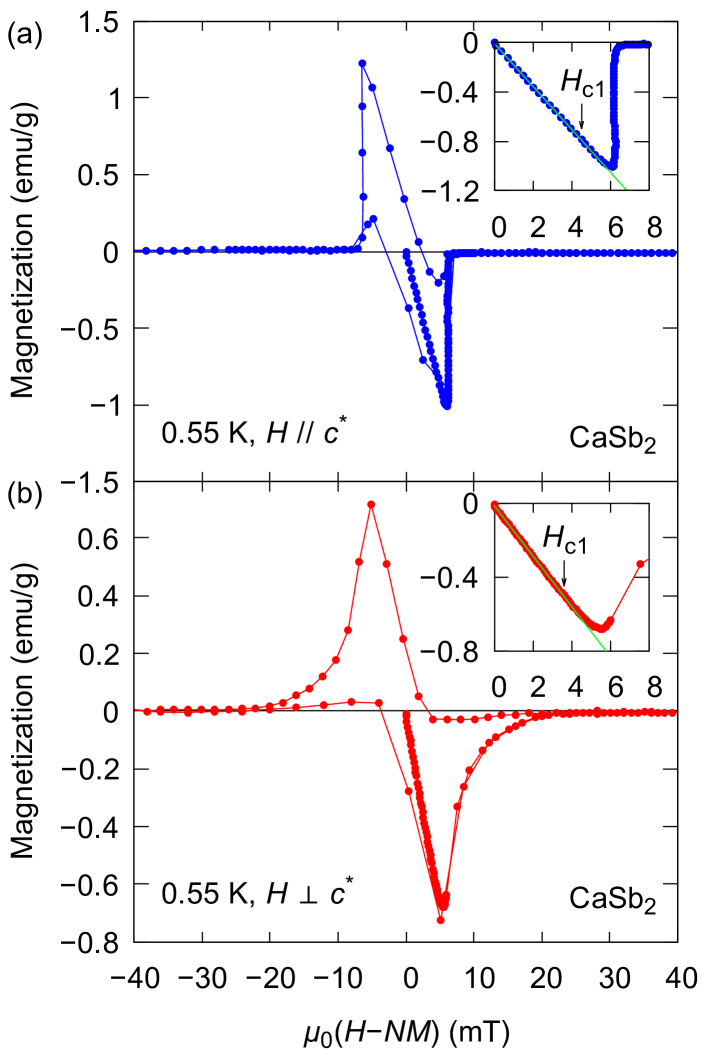
Figure 8 shows the field dependence of magnetization under (a) out-of-plane and (b) in-plane fields at after demagnetization correction. With , we observed nearly type-I behavior. Superconducting parameters [41] estimated from Figs. 6, 7, and 8 are summarized in Table 2. The GL coherence length was estimated as and . was estimated from the field range where the Pearson correlation coefficient between magnetization and field becomes maximum. The thermodynamic critical field was estimated by integrating the curve:
| (6) | ||||
| (7) |
where and are the free energy of the normal and superconducting states, respectively. Here, we averaged the two integrals of the curve to cancel the effect from vortex pinning. Both data with and lead to a consistent value of . Then, the GL parameter was calculated by . We comment that the commonly used relation for [42]
| (8) |
is not valid for \ceCaSb2. Indeed, Eq. 8 does not have a solution for with the critical fields found in our measurements. The penetration depth was estimated by and [or ]. Our analysis resulted in a larger than the previous report [26], which uses Eq. 8 with a correction term. We use a different estimation method taking the small value of and the certain amount of anisotropy into account. In any case, \ceCaSb2 is still close to the type-I superconductor, especially with .
| Direction | ||
|---|---|---|
| () | ||
| () | ||
| () | ||
| () | ||
| () | ||
IV Conclusion
We synthesized single crystals of \ceCaSb2 and observed a quasi-2D Fermi surface likely contributing to the superconductivity by the field-angle dependence of the quantum oscillations and superconducting parameters. The field-angle dependence of the main dHvA- and SdH-oscillation frequency diverges following . This result is consistent with one of the quasi-2D Fermi surfaces forming the Dirac nodal lines according to the first-principles calculation. Therefore, our observation gives indirect evidence of the crossing of the Dirac lines across in \ceCaSb2.
In the superconducting state, the GL parameter is close to unity with . Thus, \ceCaSb2 is close to the type-I superconductor. The temperature dependence of is well described by the two-gap model, and thus at least one band forming Dirac lines is supposed to take part in superconductivity. Our results, providing validity of the first-principles calculations and showing anisotropy of the superconducting parameters, suggest that \ceCaSb2 can be a good platform for investigations of the interplay between Dirac nodal lines in the normal state and superconductivity.
Acknowledgements.
Research at the University of Maryland was supported by the US Department of Energy Award No. DE-SC0019154 (magnetic and transport experiments), the Gordon and Betty Moore Foundation’s EPiQS Initiative through Grant No. GBMF9071 (materials synthesis), and the Maryland Quantum Materials Center. The National High Magnetic Field Laboratory is supported by the National Science Foundation Cooperative Agreement No. DMR-1644779 and the State of Florida. DC magnetization down to was measured in the Research Center for Low Temperature and Materials Sciences, Kyoto University. Measurements in Kyoto were supported by the Japan Society for the Promotion of Science (JSPS) Core-to-Core Program (No. JPJSCCA20170002) and the JSPS KAKENHI (No. JP17H06136, JP20H05158, and JP20F20020). Y.J.H. is supported by the JSPS Research Fellowship. J.S. acknowledges the Rosalind Franklin Fellowship from the University of Groningen. The theoretical calculations were carried out at the Texas Advanced Computing Center at the University of Texas, Austin. M.B.N. and A.J. acknowledge support from the US Department of Energy through Grant No. DE-SC0019432.References
- Hor et al. [2010] Y. S. Hor, A. J. Williams, J. G. Checkelsky, P. Roushan, J. Seo, Q. Xu, H. W. Zandbergen, A. Yazdani, N. P. Ong, and R. J. Cava, Superconductivity in \ceCu_xBi2Se3 and its Implications for Pairing in the Undoped Topological Insulator, Phys. Rev. Lett. 104, 057001 (2010).
- Fu and Berg [2010] L. Fu and E. Berg, Odd-Parity Topological Superconductors: Theory and Application to \ceCu_xBi2Se3, Phys. Rev. Lett. 105, 097001 (2010).
- Sasaki et al. [2011] S. Sasaki, M. Kriener, K. Segawa, K. Yada, Y. Tanaka, M. Sato, and Y. Ando, Topological Superconductivity in \ceCu_xBi2Se3, Phys. Rev. Lett. 107, 217001 (2011).
- Matano et al. [2016] K. Matano, M. Kriener, K. Segawa, Y. Ando, and G.-q. Zheng, Spin-rotation symmetry breaking in the superconducting state of \ceCu_xBi2Se3, Nat. Phys. 12, 852 (2016).
- Yonezawa et al. [2017] S. Yonezawa, K. Tajiri, S. Nakata, Y. Nagai, Z. Wang, K. Segawa, Y. Ando, and Y. Maeno, Thermodynamic evidence for nematic superconductivity in \ceCu_xBi2Se3, Nat. Phys. 13, 123 (2017).
- Kobayashi and Sato [2015] S. Kobayashi and M. Sato, Topological Superconductivity in Dirac Semimetals, Phys. Rev. Lett. 115, 187001 (2015).
- Aggarwal et al. [2016] L. Aggarwal, A. Gaurav, G. S. Thakur, Z. Haque, A. K. Ganguli, and G. Sheet, Unconventional superconductivity at mesoscopic point contacts on the 3D Dirac semimetal \ceCd3As2, Nat. Mater. 15, 32 (2016).
- He et al. [2016] L. He, Y. Jia, S. Zhang, X. Hong, C. Jin, and S. Li, Pressure-induced superconductivity in the three-dimensional topological Dirac semimetal \ceCd3As2, npj Quantum Mater. 1, 16014 (2016).
- Oudah et al. [2016] M. Oudah, A. Ikeda, J. N. Hausmann, S. Yonezawa, T. Fukumoto, S. Kobayashi, M. Sato, and Y. Maeno, Superconductivity in the antiperovskite Dirac-metal oxide \ceSr_3-xSnO, Nat. Commun. 7, 13617 (2016).
- Xu et al. [2016] G. Xu, B. Lian, P. Tang, X.-L. Qi, and S.-C. Zhang, Topological Superconductivity on the Surface of Fe-Based Superconductors, Phys. Rev. Lett. 117, 047001 (2016).
- Zhang et al. [2018] P. Zhang, K. Yaji, T. Hashimoto, Y. Ota, T. Kondo, K. Okazaki, Z. Wang, J. Wen, G. D. Gu, H. Ding, and S. Shin, Observation of topological superconductivity on the surface of an iron-based superconductor, Science 360, 182 (2018).
- Fang et al. [2015] C. Fang, Y. Chen, H.-Y. Kee, and L. Fu, Topological nodal line semimetals with and without spin-orbital coupling, Phys. Rev. B 92, 081201(R) (2015).
- Fang et al. [2016] C. Fang, H. Weng, X. Dai, and Z. Fang, Topological nodal line semimetals, Chin. Phys. B 25, 117106 (2016).
- Shapourian et al. [2018] H. Shapourian, Y. Wang, and S. Ryu, Topological crystalline superconductivity and second-order topological superconductivity in nodal-loop materials, Phys. Rev. B 97, 094508 (2018).
- Yu et al. [2015] R. Yu, H. Weng, Z. Fang, X. Dai, and X. Hu, Topological Node-Line Semimetal and Dirac Semimetal State in Antiperovskite \ceCu3PdN, Phys. Rev. Lett. 115, 036807 (2015).
- Yamakage et al. [2016] A. Yamakage, Y. Yamakawa, Y. Tanaka, and Y. Okamoto, Line-Node Dirac Semimetal and Topological Insulating Phase in Noncentrosymmetric Pnictides CaAg ( = P, As), J. Phys. Soc. Jpn. 85, 013708 (2016).
- Kobayashi et al. [2017] S. Kobayashi, Y. Yamakawa, A. Yamakage, T. Inohara, Y. Okamoto, and Y. Tanaka, Crossing-line-node semimetals: General theory and application to rare-earth trihydrides, Phys. Rev. B 95, 245208 (2017).
- Kobayashi et al. [2016] S. Kobayashi, Y. Yanase, and M. Sato, Topologically stable gapless phases in nonsymmorphic superconductors, Phys. Rev. B 94, 134512 (2016).
- Funada et al. [2019] K. Funada, A. Yamakage, N. Yamashina, and H. Kageyama, Spin-Orbit-Coupling-Induced Type-I/type-II Dirac Nodal-Line Metal in Nonsymmorphic \ceCaSb2, J. Phys. Soc. Jpn. 88, 044711 (2019).
- Momma and Izumi [2011] K. Momma and F. Izumi, VESTA 3 for three-dimensional visualization of crystal, volumetric and morphology data, J. Appl. Crystallogr. 44, 1272 (2011).
- Ayachit [2015] U. Ayachit, The ParaView Guide: A Parallel Visualization Application (Kitware Inc., Clifton Park, NY, USA, 2015).
- Ikeda et al. [2020] A. Ikeda, M. Kawaguchi, S. Koibuchi, T. Hashimoto, T. Kawakami, S. Yonezawa, M. Sato, and Y. Maeno, Superconductivity in the nonsymmorphic line-nodal compound \ceCaSb2, Phys. Rev. Mater. 4, 041801 (2020).
- Takahashi et al. [2021] H. Takahashi, S. Kitagawa, K. Ishida, M. Kawaguchi, A. Ikeda, S. Yonezawa, and Y. Maeno, -Wave Superconductivity in the Dirac Line-Nodal Material \ceCaSb2, J. Phys. Soc. Jpn. 90, 073702 (2021).
- Kitagawa et al. [2021] S. Kitagawa, K. Ishida, A. Ikeda, M. Kawaguchi, S. Yonezawa, and Y. Maeno, Peak in the superconducting transition temperature of the nonmagnetic topological line-nodal material \ceCaSb2 under pressure, Phys. Rev. B 104, L060504 (2021).
- Ono et al. [2021] S. Ono, H. C. Po, and K. Shiozaki, -enriched symmetry indicators for topological superconductors in the 1651 magnetic space groups, Phys. Rev. Res. 3, 023086 (2021).
- Oudah et al. [2022] M. Oudah, J. Bannies, D. A. Bonn, and M. C. Aronson, Superconductivity and quantum oscillations in single crystals of the compensated semimetal \ceCaSb2, Phys. Rev. B 105, 184504 (2022).
- [27] See Supplemental Material at [URL will be inserted by publisher] for basic properties of the crystals: x-ray diffraction pattern, AC susceptibility, resistivity, and calculated band structure.
- Yonezawa et al. [2015] S. Yonezawa, T. Higuchi, Y. Sugimoto, C. Sow, and Y. Maeno, Compact AC susceptometer for fast sample characterization down to 0.1 K, Rev. Sci. Instrum. 86, 093903 (2015).
- Giannozzi et al. [2009] P. Giannozzi, S. Baroni, N. Bonini, M. Calandra, R. Car, C. Cavazzoni, D. Ceresoli, G. L. Chiarotti, M. Cococcioni, I. Dabo, A. Dal Corso, S. de Gironcoli, S. Fabris, G. Fratesi, R. Gebauer, U. Gerstmann, C. Gougoussis, A. Kokalj, M. Lazzeri, L. Martin-Samos, N. Marzari, F. Mauri, R. Mazzarello, S. Paolini, A. Pasquarello, L. Paulatto, C. Sbraccia, S. Scandolo, G. Sclauzero, A. P. Seitsonen, A. Smogunov, P. Umari, and R. M. Wentzcovitch, QUANTUM ESPRESSO: a modular and open-source software project for quantum simulations of materials, J. Phys. Condens. Matter 21, 395502 (2009).
- Giannozzi et al. [2017] P. Giannozzi, O. Andreussi, T. Brumme, O. Bunau, M. B. Nardelli, M. Calandra, R. Car, C. Cavazzoni, D. Ceresoli, M. Cococcioni, N. Colonna, I. Carnimeo, A. D. Corso, S. de Gironcoli, P. Delugas, R. A. D. Jr, A. Ferretti, A. Floris, G. Fratesi, G. Fugallo, R. Gebauer, U. Gerstmann, F. Giustino, T. Gorni, J. Jia, M. Kawamura, H.-Y. Ko, A. Kokalj, E. Küçükbenli, M. Lazzeri, M. Marsili, N. Marzari, F. Mauri, N. L. Nguyen, H.-V. Nguyen, A. O. de-la Roza, L. Paulatto, S. Poncé, D. Rocca, R. Sabatini, B. Santra, M. Schlipf, A. P. Seitsonen, A. Smogunov, I. Timrov, T. Thonhauser, P. Umari, N. Vast, X. Wu, and S. Baroni, Advanced capabilities for materials modelling with QUANTUM ESPRESSO, J. Phys. Condens. Matter 29, 465901 (2017).
- Perdew et al. [1996] J. P. Perdew, K. Burke, and M. Ernzerhof, Generalized Gradient Approximation Made Simple, Phys. Rev. Lett. 77, 3865 (1996).
- Kresse and Joubert [1999] G. Kresse and D. Joubert, From ultrasoft pseudopotentials to the projector augmented-wave method, Phys. Rev. B 59, 1758 (1999).
- Dal Corso [2014] A. Dal Corso, Pseudopotentials periodic table: From H to Pu, Comput. Mater. Sci. 95, 337 (2014).
- Buongiorno Nardelli et al. [2018] M. Buongiorno Nardelli, F. T. Cerasoli, M. Costa, S. Curtarolo, R. De Gennaro, M. Fornari, L. Liyanage, A. R. Supka, and H. Wang, PAOFLOW: A utility to construct and operate on ab initio Hamiltonians from the projections of electronic wavefunctions on atomic orbital bases, including characterization of topological materials, Comput. Mater. Sci. 143, 462 (2018).
- Cerasoli et al. [2021] F. T. Cerasoli, A. R. Supka, A. Jayaraj, M. Costa, I. Siloi, J. Sławińska, S. Curtarolo, M. Fornari, D. Ceresoli, and M. Buongiorno Nardelli, Advanced modeling of materials with PAOFLOW 2.0: New features and software design, Comput. Mater. Sci. 200, 110828 (2021).
- Rourke and Julian [2012] P. Rourke and S. Julian, Numerical extraction of de Haas–van Alphen frequencies from calculated band energies, Comput. Phys. Commun. 183, 324 (2012).
- Shoenberg [1984] D. Shoenberg, Magnetic oscillations in metals (Cambridge University Press, Cambridge, 1984).
- Ando et al. [1982] T. Ando, A. B. Fowler, and F. Stern, Electronic properties of two-dimensional systems, Rev. Mod. Phys. 54, 437 (1982).
- Werthamer et al. [1966] N. R. Werthamer, E. Helfand, and P. C. Hohenberg, Temperature and Purity Dependence of the Superconducting Critical Field, . III. Electron Spin and Spin-Orbit Effects, Phys. Rev. 147, 295 (1966).
- Gurevich [2003] A. Gurevich, Enhancement of the upper critical field by nonmagnetic impurities in dirty two-gap superconductors, Phys. Rev. B 67, 184515 (2003).
- Tinkham [2004] M. Tinkham, Introduction to Superconductivity (Dover Publications, New York, 2004).
- Abrikosov [1988] A. A. Abrikosov, Fundamentals of the Theory of Metals (Elsevier Science Publishers B.V., Amsterdam, 1988).