Rejuvenated accretors have less bound envelopes:
Impact of
Roche lobe overflow on subsequent common envelope events
Abstract
Common-envelope (CE) evolution is an outstanding open problem in stellar evolution, critical to the formation of compact binaries including gravitational-wave sources. In the “classical” isolated binary evolution scenario for double compact objects, the CE is usually the second mass transfer phase. Thus, the donor star of the CE is the product of a previous binary interaction, often stable Roche-lobe overflow (RLOF). Because of the accretion of mass during the first RLOF, the main-sequence core of the accretor star grows and is “rejuvenated”. This modifies the core-envelope boundary region and decreases significantly the envelope binding energy for the remaining evolution. Comparing accretor stars from self-consistent binary models to stars evolved as single, we demonstrate that the rejuvenation can lower the energy required to eject a CE by for both black hole and neutron star progenitors, depending on the evolutionary stage and final orbital separation. Therefore, binaries experiencing first stable mass transfer may more easily survive subsequent CE events and result in possibly wider final separations compared to current predictions. Despite their high mass, our accretors also experience extended “blue loops”, which may have observational consequences for low-metallicity stellar populations and asteroseismology.
1 Introduction
Common envelope (CE) evolution is important for massive isolated binaries to become gravitational-wave (GW) sources, despite recent debates on its relevance for the progenitors of the most massive binary black holes (e.g., van den Heuvel et al., 2017; Pavlovskii et al., 2017; Klencki et al., 2021, 2022; van Son et al., 2022; Marchant et al., 2021). CE remains a crucial step in the formation, among many other compact binaries, of cataclysmic variable (e.g., Paczynski, 1976), double white dwarfs (e.g., Zorotovic et al., 2010; Korol et al., 2017; Kremer et al., 2017; Renzo et al., 2021; Thiele et al., 2021), binary neutron stars (NS, e.g., Vigna-Gómez et al., 2018, 2020), merging black hole-neutron stars (e.g., Kruckow et al., 2018; Broekgaarden & Berger, 2021), and possibly low-mass binary black holes (BH, e.g., Dominik et al., 2012; van Son et al., 2022).
In the “classical scenario” for binary BHs and/or NSs (e.g., Tutukov & Yungelson, 1993; Belczynski et al., 2016; Tauris et al., 2017), the progenitor binary experiences a first dynamically stable mass transfer through Roche-lobe overflow (RLOF) between two non-compact stars. Subsequently, the initially more massive RLOF-donor collapses to a compact object without disrupting the binary (e.g., Blaauw, 1961; Renzo et al., 2019). Only afterwards, as the initially less massive RLOF-accretor expands, a second mass-transfer phase occurs and it can be dynamically unstable, that is a CE (e.g., Dominik et al., 2012; Belczynski et al., 2016; Kruckow et al., 2018). This second mass transfer is responsible for the orbital shrinking (Paczynski, 1976) allowing the system to merge within the age of the Universe. Therefore, in this scenario, the donor star of the CE is the former accretor of the first RLOF (e.g., Klencki et al., 2021; Law-Smith et al., 2020; Renzo & Götberg, 2021).
The first stable RLOF typically occurs during the main sequence of the initially less massive star and accretion modifies its structure (e.g., Neo et al., 1977; Packet, 1981; Blaauw, 1993; Cantiello et al., 2007; Renzo & Götberg, 2021). On top of the enrichment of the envelope with CNO-processed material from the donor star core (Blaauw, 1993; Renzo & Götberg, 2021; El-Badry et al., 2022), and the substantial spin-up (e.g., Packet, 1981), accretors are expected to adjust their core-size to the new mass in a “rejuvenation” process (e.g., Neo et al., 1977; Hellings, 1983, 1984). The readjustment is driven by mixing at the boundary between the convective core and the envelope, which refuels the burning region of hydrogen (H), increasing the stellar lifetime. This mixing also affects the thermal structure of the partially H-depleted layer above the helium-rich core (He), which we refer to as core-envelope boundary (CEB) region. It is in the CEB that the density rises and most of the envelope binding energy is accumulated for the remaining stellar lifetime (e.g., Tauris & Dewi, 2001; Ivanova et al., 2013, 2020). Consequently, the success or failure of the CE ejection, and the final separation, are likely decided in the CEB layer and may be different depending on whether the CE-donor accreted mass previously or not.
Here, we use structure and evolution binary models to study the impact of the first RLOF phase on the outcome of possible subsequent CE events. Sec. 2 describe our MESA calculations. In Sec. 3 we show the ratio of binding energy of our accretor models divided by the binding energy of single stars with same total post-RLOF mass. We discuss our findings and conclude in Sec. 4. Appendix A presents a proof-of-principle numerical experiment illustrating the effect of changing the CEB region and rotation on the envelope binding energy, and Appendixes B–D present additional plots of our model grids.
2 Pre-common envelope evolution
We use MESA (version 15140, Paxton et al., 2011, 2013, 2015, 2018, 2019; Jermyn et al., 2022) to compute the evolution of binaries which experience mass transfer after the end of the donor’s main sequence, that is case B RLOF (Kippenhahn & Weigert, 1967). Our output files are compatible for use in the population synthesis code POSYDON (Fragos et al., 2022) and publicly available together with our input files and customized routines at doi:10.5281/zenodo.7036016. Our setup is similar to Renzo & Götberg (2021), except for the metallicity: here we adopt , relevant for the progenitor population of GW events (e.g., van Son et al., 2022). Moreover, we apply throughout the star a small amount of mixing with diffusivity min_D_mix=0.01 . This improves the numerical stability by smoothing properties across adjacent cells, without introducing significant quantitative variations, and is a typical numerical technique used in asteroseismology calculations (J. Fuller, private comm.).
We adopt an initial period days and choose initial masses . We focus on the initially less massive stars, which after accretion become , roughly representative of NS, uncertain core-collapse outcome, and BH progenitors, respectively. However, the core-collapse outcome (NS or BH formation, with explosion or not), cannot be decided solely based on the (total or core) mass of a star (e.g., O’Connor & Ott, 2011; Farmer et al., 2016; Patton & Sukhbold, 2020; Zapartas et al., 2021; Patton et al., 2022).
During the binary evolution, we account for tidal interactions assuming each stellar layer reacts on its own timescale (see Paxton et al. 2015). At mass transfer, our MESA models assume that the accretion efficiency is limited by rotationally-enhanced wind mass loss (e.g., Sravan et al., 2019; Wang et al., 2020; Renzo & Götberg, 2021; Sen et al., 2022). However, this may lead to less conservative mass transfer than suggested by observations (e.g., Wang et al., 2021).
After the donor detaches from the Roche lobe, our simulations artificially separate111We make the routine to separate a MESA binary on-the-fly publicly available https://github.com/MESAHub/mesa-contrib/ the stars and continue the evolution of the accretor as a single star until it reaches carbon depletion (defined by central carbon mass fraction ). ducing the complexity by not simulating the late evolutionary phases of the RLOF-donors saves significant computing time at a small price in accuracy of the RLOF-accretors. Separating the stars, we neglect further possible, but not expected, mass-transfer episodes (case BB RLOF, Delgado & Thomas 1981; Laplace et al. 2020). We also neglect post-RLOF tides, which are expected to be negligible for wide pre-CE binaries. Finally, we ignore the impact of the donor’s supernova ejecta with the accretor (which has a small and short-lasting effect only on the outermost layers, e.g., Hirai et al., 2018; Ogata et al., 2021, Hirai R., private communication) and the orbital consequences of the core-collapse (e.g., Brandt & Podsiadlowski, 1995; Kalogera, 1996; Tauris & Takens, 1998; Renzo et al., 2019). To illustrate the physical reason why the first RLOF may influence the envelope structure of the accretor much later on, we also compute comparison stars. For each mass, we compute non-rotating single stars with otherwise identical setup, and “engineered” stars which we modify at terminal age main sequence (TAMS, central hydrogen mass fraction ) to mimic crudely the impact of rejuvenation of the accretors CEB (see Appendix A).
At the onset of a CE event, the photospheric radius is the size of the Roche lobe of the donor star determined by the binary separation and mass ratio (e.g., Paczyński, 1971; Eggleton, 1983). Thus, we compare the internal structure of accretors to single and engineered stars at various epochs defined by a fixed photospheric radius .
3 Accretors from self-consistent binary models
Fig. 1 shows the evolution of our binaries on the Hertzsprung-Russell (HR) diagram. The thin dashed lines show the evolution of the donor stars (e.g., Morton, 1960; Götberg et al., 2018; Laplace et al., 2021) from zero age main sequence (ZAMS), through RLOF, until our definition of detachment. The solid lines correspond to the full evolution of the accretors, from ZAMS, through RLOF, until carbon depletion. The yellow outline of the tracks highlight the RLOF mass transfer (see e.g., Renzo & Götberg 2021). During this phase the accretor progressively spins-up, and accretes CNO-processed material from the donor’s inner layers which are mixed downwards in the envelope by meridional circulations and thermohaline mixing, and its core is rejuvenated because of the increased mass (see also Sravan et al., 2019; Renzo & Götberg, 2021; Wang et al., 2020). During the brief RLOF phase, our accretors grow to , respectively, corresponding to an overall mass transfer efficiency and 0.43, respectively (see discussion in Renzo & Götberg, 2021). The binaries started with an initial separation of and widen to days by RLOF detachment. We expect further widening caused by the wind mass loss of both stars, allowing us to neglect tides in the remaining evolution and the impact of the RLOF-donor collapse (Hirai et al., 2018; Ogata et al., 2021).
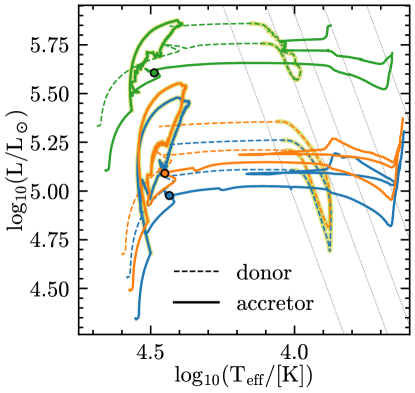
All three accretor models experience a blueward evolution after beginning to ascend the Hayashi track. In the two lowest mass models, this results in a blue-loop, which last years. These models spend a significant fraction of their He core burning as hot yellow/blue supergiants, and reach . Our most massive accretor () evolves towards hotter temperatures during core He burning, but never fully recovers closing the blue loop. Its excursion to hottest temperatures occurs after He core depletion and lasts years.
Blue loops are not expected for single stars with (e.g., Walmswell et al., 2015), and their occurrence is known to be sensitive to the He profile above the H-burning shell, and specifically the mean molecular weight profile (Walmswell et al., 2015; Farrell et al., 2022). Thus it is not surprising that RLOF-accretion, which modifies the CEB, may lead to blue loops, and formation of yellow supergiants. We note that comparison single stars also experience late blue-ward evolution, but not a “loop” back to red. This behavior is likely related to the relatively high wind mass-loss rate assumed (see Renzo et al. 2017), and the models with initial mass are qualitatively similar to the most massive accretor in Fig. 1 even without accreting matter from a companion: the occurrence of blue loops is notoriously sensitive to many single-star physics uncertainties, and while they appear consistently in our accretor models, their physicality should be tested further.
However, in the context of CE progenitors, blue loops are not crucial since they correspond to a decrease in radius, which would not result in binary interactions during the loop. They might change the mass-loss history of the accretor, but since they occur in a short evolutionary phase, their impact should be limited.
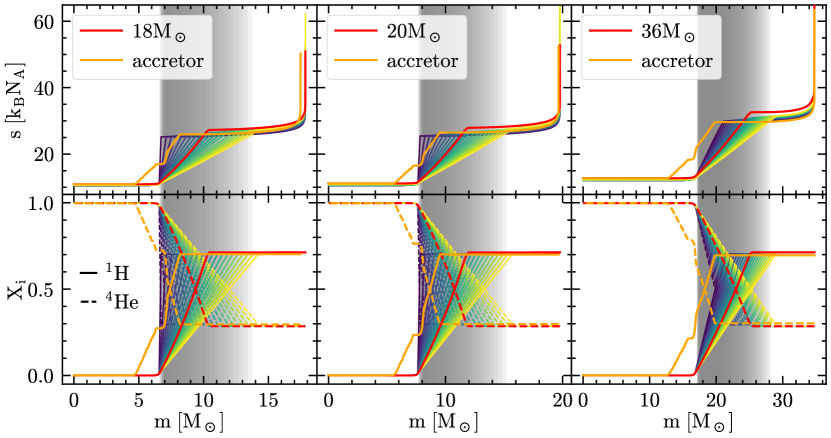
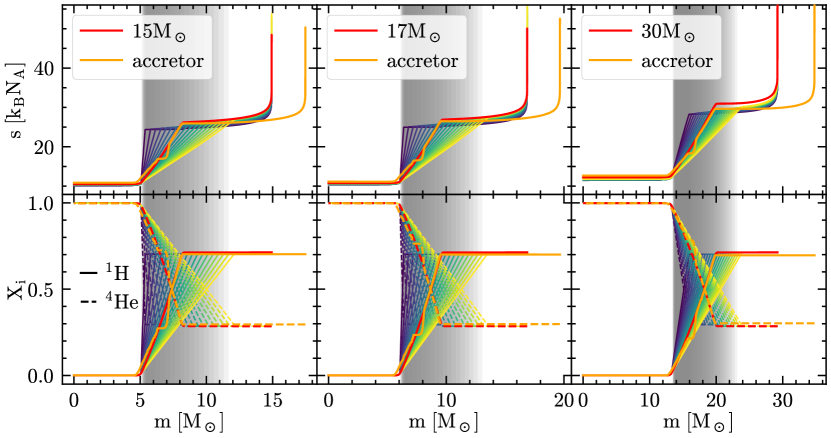
Fig. 2 shows the specific entropy (s) profile – which determines the instantaneous dynamical response of the gas – and the H and He mass fractions at TAMS for our accretor models (orange), single non-rotating stars (red) and “engineered” models of roughly same total mass as the accretor post-RLOF. A gray region highlights the CEB, and their overlap produces the shade in Fig. 2. We compare our models at the same total post-RLOF mass () because it enters in Eq. 1 and is typically used in rapid population synthesis codes to construct accretors from single star models (e.g., Hurley et al., 2002; Breivik et al., 2020). We present in Fig. 10 a comparison between TAMS profiles of accretors, single stars, and engineered models with the same initial mass as an alternative comparison that should bracket the range of sensible comparison models.
Because of the timing and duration of RLOF, accretion affects the CEB layers in more subtle ways than we impose in our “engineered” models. One expects the CEB in accretors to be steeper than in a star evolving as single, resulting in models qualitatively more similar to our engineered models with the steeper entropy and composition in the CEB (darker lines in Fig. 2-3, Fig. 6, and Fig. 10-11). The convective core of the accretor post-RLOF would naturally become more massive in a star with homogeneous composition. However, the He-enriched CEB can impede or prevent the growth of the core (e.g., Yoon & Langer, 2005). The He-enrichment increases with the stellar age, and thus with the duration of the pre-RLOF evolution. This duration depends on the binary architecture: for our binaries with initial days and , RLOF starts after 10, 9, and 5 Myrs from the least massive to the most massive system, which correspond to central H mass fractions , and for the accretors (cf. height of the plateaus in the orange lines in Fig. 2). Our oversimplified engineered models do not exhibit such plateau because they are constructed assuming instantaneous rejuvenation at TAMS (see Appendix A.1).
To quantify the impact of the first RLOF phase on the outcome of the second mass transfer phase, we evolve forward all the TAMS profiles shown in Fig. 2 and compare them at fixed outer radii. In the “classical” binary evolution path, after the RLOF-donor collapses to a compact object, the evolutionary expansion of the RLOF-accretor triggers a CE. This phase of evolution is a complicated physics problem, not necessarily well-described as an energetically closed system (e.g., Ivanova et al., 2013, 2020; Renzo et al., 2021). However, a common oversimplification is to assume energy conservation (“ algorithm”, e.g., Webbink, 1984; de Kool, 1990; De Marco et al., 2011) to determine CE ejection and final separation. Here we focus on the RLOF-accretor/CE-donor binding energy profile as an indication for the ease of CE ejection. Even if imperfect, following common practice, we adopt this quantity as a proxy for the physical processes which determine the CE outcome and that allows us to compare models to each other. We calculate the cumulative binding energy outside mass coordinate as (e.g., de Kool, 1990; Dewi & Tauris, 2000; Lau et al., 2022a):
| (1) |
with radius, the internal energy of a shell of mass thickness and outer Lagrangian mass coordinate , and the gravitational constant. The integral goes from mass coordinate , which can be thought of as the mass of the “core” surviving a hypothetical CE, to the surface. The parameter is the fraction of internal energy (including recombination energy) that can be used to lift the shared CE (e.g., Han et al., 1995). It is possible that may not be constant during a CE (e.g., if recombination happens in already unbound material it cannot contribute to the CE energetics, Lau et al. 2022b) or across binary systems entering a CE at different evolutionary stages. For , Eq. 1 give the gravitational binding energy (dashed lines in Fig. 6-7), while assumes perfectly fine-tuned use of all the internal energy (solid lines, see also Klencki et al., 2021). These two cases bracket the range of possible use of internal energy to eject the CE. The additional inclusion of a rotational-energy term (with the specific moment of inertia) in the integral in Eq. 1 contributes to less than of the cumulative binding energy only in the outermost layers – likely to be crossed during a dynamical plunge-in in CE evolution – and only for – afterwards, even the accretor spin down significantly (see also Appendix A.2).
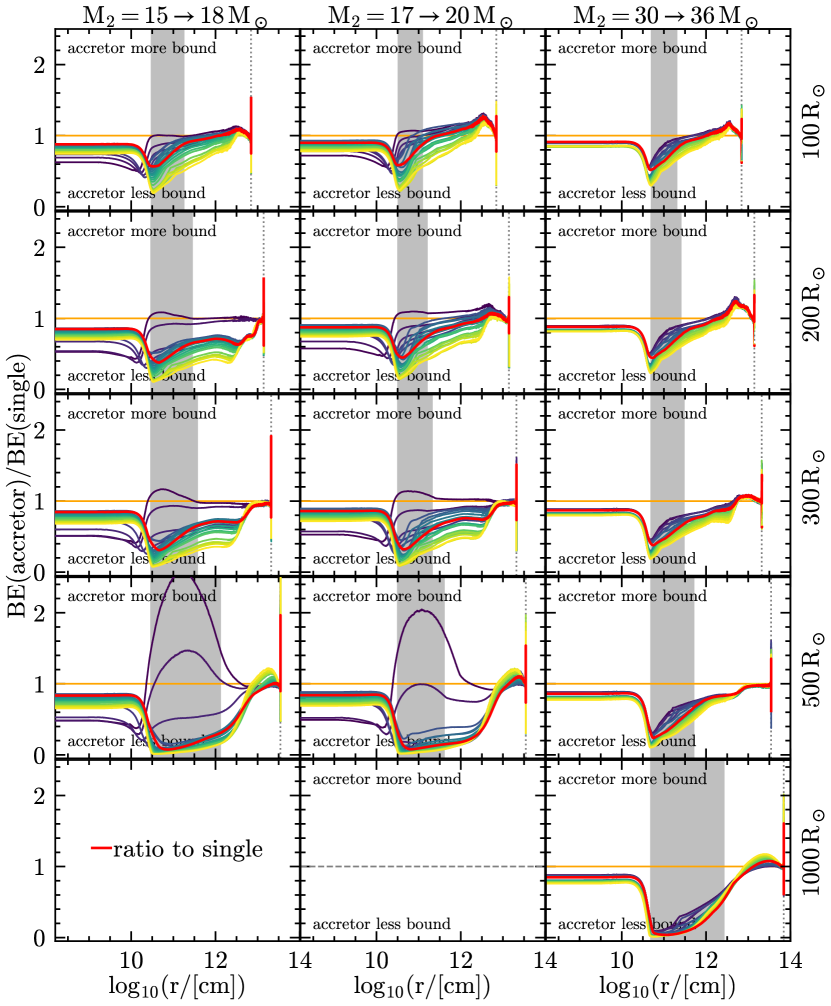
Because of the large range of across the stellar structures, it is hard to appreciate directly the magnitude of the effect of RLOF-driven rejuvenation on the profile (shown in Fig. 9). Fig. 3 presents the ratio of the local value of the cumulative binding energy from the surface of our accretor models divided by the comparison single stars, as a function of radius. The two lowest mass accretors (left and central column) do not expand to before carbon depletion. To compute the ratio, we interpolate linearly the single star models on the mesh of our accretor, using the fractional Lagrangian mass coordinate as independent coordinate. We calculate these ratios when both the stars reach for the first time radii (see vertical gray dotted lines), corresponding to the assumed Roche lobe radius of the donor at the onset of the CE.
In each panel, radial coordinates for which the lines in Fig. 3 are below one correspond to radii at which the accretor models are less bound than the comparison single star or engineered model. For , the outermost layers (more likely to be crossed by the binary during the dynamical plunge-in phase of the CE) may be slightly less bound in single stars than accretors (red line greater than 1) – partly because of the impact of rotation. But for most of the envelope radius, the ratio is smaller than one, suggesting it would take less energy to eject the outer layers of the envelope of the accretors down to such . All of our accretor models, regardless of them being NS or BH progenitor, and regardless of their evolutionary phase, are qualitatively more similar to the darker lines representing engineered models with steeper CEB profiles.

The minimum ratio of binding energies occur roughly at the inner edge of the CEB layer in Fig. 3. Considering the ratio to single stars (red lines), the minima range between 0.56-0.07, 0.58-0.08, and 0.51-0.04 from our least to most massive binary. In other words, at the radius where the difference between accretors and single stars models is largest, which is also the location where the outcome of a common envelope is likely to be decided, the accretor’s binding energy is roughly between of the binding energy of a single star. Regardless of the mass, the larger the outer radius the smaller the minimum of the ratio of binding energies: the differences caused by RLOF accretion and rejuvenation of the core grows as stars evolve and their core contracts.
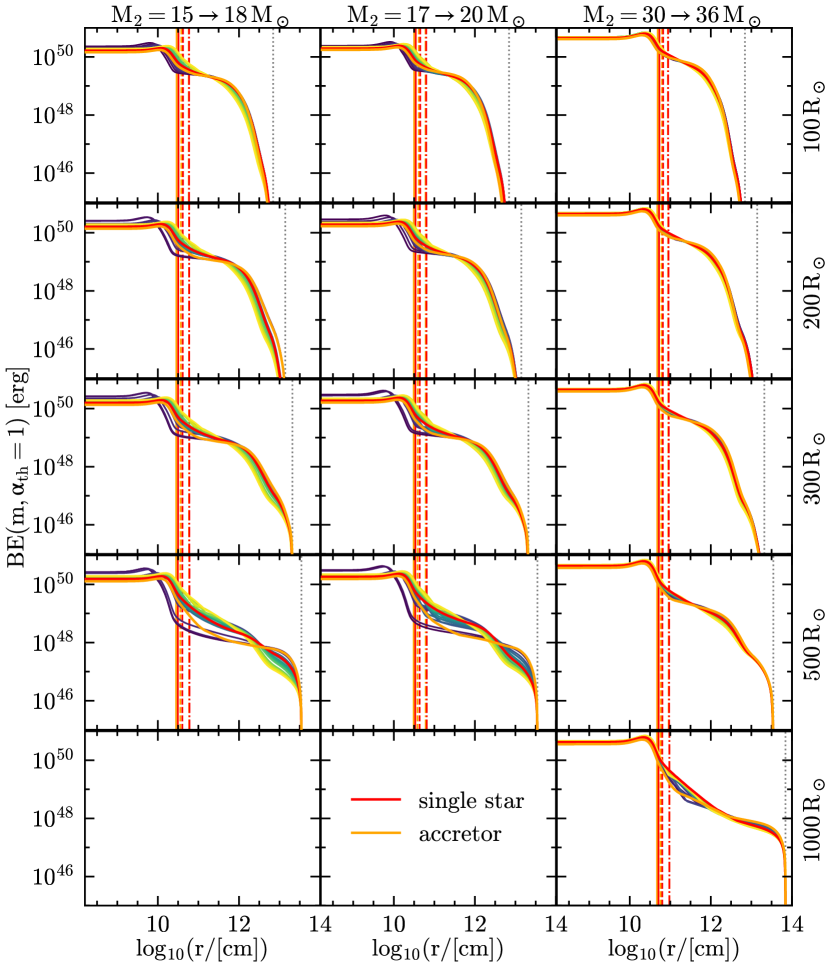
Defining the He core boundary as the outermost location where and , we can fix in Eq. 1 to obtain an integrated binding energy for the envelope:
| (2) |
Fig. 4 shows the evolution of this integrated envelope binding energy as a function of the outer radius. Each panel shows one of our binaries, from top to bottom: 36+30 , 20+17 , 18+15 . For each binary, the lower panel shows the ratios of the envelope binding energy of the accretor divided by the binding energy of the comparison single star (i.e., the ratio of the solid lines to the dotted lines in the panel above). To compute these ratios, we interpolate our accretor models on the time-grid of the single stars using the central temperature as independent coordinate. In each of the lower panels the ratios are lower than one (marked by the gray dashed lines) suggesting that post-RLOF accretor stars have envelopes that require less energy to be ejected in a CE event. The only times the binding energy of the accretor is higher than the corresponding single stars is during the blue-ward evolution discussed earlier, which would not trigger a CE.
4 Discussion & Conclusions
We have modeled the impact of mass transfer on the envelope structure of the accretor, focusing on thermal timescale, post-donor-main sequence case B RLOF (see Fig. 1). The accretion of mass drives the growth of the accretor’s core, changing the core/envelope boundary region and “rejuvenating” the star (Fig. 2). As the accretors evolve beyond the main sequence, they experience large blue-loops which are not expected in single stars of the same mass – with potential implications for asteroseismology (e.g., Dorn-Wallenstein et al., 2020), and the search for non-interacting companions to compact objects (e.g., Breivik et al., 2017; Andrews et al., 2019; Chawla et al., 2021).
The rejuvenation is driven by convective core boundary mixing (e.g., Hellings, 1983, 1984; Cantiello et al., 2007; Renzo & Götberg, 2021), and does not occur in its absence (Braun & Langer, 1995). The hydrodynamics of convective boundaries in stellar regime is an active topic of research (e.g., Anders et al., 2022a, b), and observations of the width of the main sequence (e.g., Brott et al., 2011) and asteroseismology (e.g., Moravveji et al., 2016) suggest the presence of convective boundary mixing in the core of massive main-sequence stars. In our one-dimensional accretor models, the dominant core boundary mixing is overshooting, with rotationally driven instabilities contributing to a lesser extent during late RLOF. We adopt an exponentially decreasing overshooting diffusion coefficient (Claret & Torres 2017) which may underestimate the amount of mixing at the accretor core boundary. After RLOF, a thick convective shell develops above the core (see Renzo & Götberg, 2021), which also contributes to the different binding energy profiles (see Fig. 9).
We have focused on the structural consequences of RLOF accretion, specifically their impact on the subsequent binary interaction in the “classical” scenario to a GW merger: the CE event initiated by the RLOF-accretor. Accretors have overall lower binding energy of the envelope (both integrated from the surface to the He core, see Fig. 4 and as a function of radius, see Fig. 3, 9, and 11). The systematically lower binding energy our accretor models compared to single stars of the same outer radius and total mass may imply easier to eject (post-RLOF, second) CE and wider post-CE separations.
Before the onset of the dynamical instability in a CE event, a pre-CE thermal timescale phase of mass transfer may occur (e.g., Hjellming & Webbink, 1987; Nandez et al., 2014; Pejcha et al., 2017; Blagorodnova et al., 2021). This phase may impact the envelope structure of CE-donors (through tidal interactions and mass loss) whether they are RLOF-accretors (as in our models) or not. Multidimensional studies are needed to assess whether rejuvenation, rotation, tides, and the impact of the companion’s supernova shock on accretor stars counteract or compound each other.
A key uncertainty in CE outcome is the location of the separation between the (possibly) ejected envelope and the remaining core (e.g., Tauris & Dewi, 2001). This affects equally each CE donor and can have an amplitude comparable to the effect of rejuvenation in accretors (see Fig. 9 for three possible definition of “core”). In the case of rejuvenated CE donors, uncertainties in the core definition compound with the effect of rejuvenation itself.
Not all binary architectures necessarily result in rejuvenated accretors like the ones described here. Very massive BH progenitors () may not expand as red supergiants at all or avoid unstable mass transfer (e.g., van Son et al., 2022; Marchant et al., 2021). Since their main-sequence lifetimes are roughly independent of mass ( Myr), at the first RLOF, accretors this massive may already have a deep core/envelope chemical gradient to prevent rejuvenation. However, more massive stars are generally easier to mix (including reaching rotationally-induced chemically homogeneous evolution, e.g., Yoon & Langer, 2005; de Mink & Mandel, 2016). Shorter initial periods (i.e., earlier mass transfer) and smaller radii during the binary interactions can prevent the red supergiant phase even at lower masses (Cantiello et al., 2007).
We have focused on accretor models for progenitors of NS and BH. However, the physical processes described should be similar in all accretor stars with convective main sequence cores, down to initial mass (see also Wang et al., 2020). Thus, also a fraction of progenitors of binaries with white dwarfs, if sufficiently massive and experiencing a (case B) RLOF phase of evolution, may be influenced by the structural differences between single stars and RLOF-accretors.
Including the structural reaction to accretion during RLOF in population synthesis simulations could impact the distribution of post-CE orbital separations, the predicted number of “reverse” stellar mergers (e.g., Zapartas et al., 2017), and the rate of GW mergers. Our grid consists only of three binaries, but could be extended to inform semi-analytic approximations of the binding energy of CE-donor that have accreted mass in a previous stable mass transfer phase (see also Fig. 11).
References
- Anders et al. (2022a) Anders, E. H., Jermyn, A. S., Lecoanet, D., & Brown, B. P. 2022a, ApJ, 926, 169, doi: 10.3847/1538-4357/ac408d
- Anders et al. (2022b) Anders, E. H., Jermyn, A. S., Lecoanet, D., et al. 2022b, ApJ, 928, L10, doi: 10.3847/2041-8213/ac5cb5
- Andrews et al. (2019) Andrews, J. J., Breivik, K., & Chatterjee, S. 2019, ApJ, 886, 68, doi: 10.3847/1538-4357/ab441f
- Belczynski et al. (2016) Belczynski, K., Holz, D. E., Bulik, T., & O’shaughnessy, R. 2016, Nature, 534, 512, doi: 10.1038/nature18322
- Blaauw (1961) Blaauw, A. 1961, Bull. Astron. Inst. Netherlands, 15, 265
- Blaauw (1993) Blaauw, A. 1993, in Astronomical Society of the Pacific Conference Series, Vol. 35, Massive Stars: Their Lives in the Interstellar Medium, ed. J. P. Cassinelli & E. B. Churchwell, 207
- Blagorodnova et al. (2021) Blagorodnova, N., Klencki, J., Pejcha, O., et al. 2021, A&A, 653, A134, doi: 10.1051/0004-6361/202140525
- Brandt & Podsiadlowski (1995) Brandt, N., & Podsiadlowski, P. 1995, MNRAS, 274, 461, doi: 10.1093/mnras/274.2.461
- Braun & Langer (1995) Braun, H., & Langer, N. 1995, A&A, 297, 483
- Breivik et al. (2017) Breivik, K., Chatterjee, S., & Larson, S. L. 2017, ApJ, 850, L13, doi: 10.3847/2041-8213/aa97d5
- Breivik et al. (2020) Breivik, K., Coughlin, S., Zevin, M., et al. 2020, ApJ, 898, 71, doi: 10.3847/1538-4357/ab9d85
- Broekgaarden & Berger (2021) Broekgaarden, F. S., & Berger, E. 2021, ApJ, 920, L13, doi: 10.3847/2041-8213/ac2832
- Brott et al. (2011) Brott, I., de Mink, S. E., Cantiello, M., et al. 2011, A&A, 530, A115, doi: 10.1051/0004-6361/201016113
- Cantiello et al. (2007) Cantiello, M., Yoon, S., Langer, N., & Livio, M. 2007, A&A, 465, L29
- Chawla et al. (2021) Chawla, C., Chatterjee, S., Breivik, K., et al. 2021, arXiv e-prints, arXiv:2110.05979. https://arxiv.org/abs/2110.05979
- Claret & Torres (2017) Claret, A., & Torres, G. 2017, ApJ, 849, 18, doi: 10.3847/1538-4357/aa8770
- de Kool (1990) de Kool, M. 1990, ApJ, 358, 189, doi: 10.1086/168974
- De Marco et al. (2011) De Marco, O., Passy, J.-C., Moe, M., et al. 2011, MNRAS, 411, 2277, doi: 10.1111/j.1365-2966.2010.17891.x
- de Mink & Mandel (2016) de Mink, S. E., & Mandel, I. 2016, MNRAS, 460, 3545, doi: 10.1093/mnras/stw1219
- Delgado & Thomas (1981) Delgado, A. J., & Thomas, H. C. 1981, A&A, 96, 142
- Dewi & Tauris (2000) Dewi, J. D. M., & Tauris, T. M. 2000, A&A, 360, 1043
- Dominik et al. (2012) Dominik, M., Belczynski, K., Fryer, C., et al. 2012, ApJ, 759, 52, doi: 10.1088/0004-637X/759/1/52
- Dorn-Wallenstein et al. (2020) Dorn-Wallenstein, T. Z., Levesque, E. M., Neugent, K. F., et al. 2020, ApJ, 902, 24, doi: 10.3847/1538-4357/abb318
- Eggleton (1983) Eggleton, P. P. 1983, ApJ, 268, 368, doi: 10.1086/160960
- El-Badry et al. (2022) El-Badry, K., Seeburger, R., Jayasinghe, T., et al. 2022, MNRAS, 512, 5620, doi: 10.1093/mnras/stac815
- Farmer & Bauer (2018) Farmer, R., & Bauer, E. B. 2018, pyMesa, doi: 10.5281/zenodo.1205271
- Farmer et al. (2016) Farmer, R., Fields, C. E., Petermann, I., et al. 2016, ApJS, 227, 22, doi: 10.3847/1538-4365/227/2/22
- Farmer et al. (2019) Farmer, R., Renzo, M., de Mink, S. E., Marchant, P., & Justham, S. 2019, The Astrophysical Journal, 887, 53, doi: 10.3847/1538-4357/ab518b
- Farrell et al. (2022) Farrell, E., Groh, J. H., Meynet, G., & Eldridge, J. J. 2022, MNRAS, 512, 4116, doi: 10.1093/mnras/stac538
- Fragos et al. (2022) Fragos, T., Andrews, J. J., Bavera, S. S., et al. 2022, arXiv e-prints, arXiv:2202.05892. https://arxiv.org/abs/2202.05892
- Fryer et al. (2012) Fryer, C. L., Belczynski, K., Wiktorowicz, G., et al. 2012, The Astrophysical Journal, 749, 91, doi: 10.1088/0004-637X/749/1/91
- Fryer et al. (2022) Fryer, C. L., Olejak, A., & Belczynski, K. 2022, ApJ, 931, 94, doi: 10.3847/1538-4357/ac6ac9
- Gagnier et al. (2019) Gagnier, D., Rieutord, M., Charbonnel, C., Putigny, B., & Espinosa Lara, F. 2019, Astronomy and Astrophysics, 625, 1, doi: 10.1051/0004-6361/201832581
- Götberg et al. (2018) Götberg, Y., de Mink, S. E., Groh, J. H., et al. 2018, A&A, 615, A78, doi: 10.1051/0004-6361/201732274
- Han et al. (1995) Han, Z., Podsiadlowski, P., & Eggleton, P. P. 1995, MNRAS, 272, 800, doi: 10.1093/mnras/272.4.800
- Heger et al. (2000) Heger, A., Langer, N., & Woosley, S. E. 2000, ApJ, 528, 368
- Hellings (1983) Hellings, P. 1983, Ap&SS, 96, 37, doi: 10.1007/BF00661941
- Hellings (1984) —. 1984, Ap&SS, 104, 83, doi: 10.1007/BF00653994
- Hirai et al. (2018) Hirai, R., Podsiadlowski, P., & Yamada, S. 2018, The Astrophysical Journal, 864, 119, doi: 10.3847/1538-4357/aad6a0
- Hjellming & Webbink (1987) Hjellming, M. S., & Webbink, R. F. 1987, ApJ, 318, 794, doi: 10.1086/165412
- Hunter (2007) Hunter, J. D. 2007, Computing in Science and Engineering, 9, 90, doi: 10.1109/MCSE.2007.55
- Hurley et al. (2002) Hurley, J. R., Tout, C. A., & Pols, O. R. 2002, MNRAS, 329, 897, doi: 10.1046/j.1365-8711.2002.05038.x
- Ivanova et al. (2020) Ivanova, N., Justham, S., & Ricker, P. 2020, Common Envelope Evolution, 2514-3433 (IOP Publishing), doi: 10.1088/2514-3433/abb6f0
- Ivanova et al. (2013) Ivanova, N., Justham, S., Chen, X., et al. 2013, The Astronomy and Astrophysics Review, 21, 59, doi: 10.1007/s00159-013-0059-2
- Jermyn et al. (2022) Jermyn, A. S., Bauer, E. B., Schwab, J., et al. 2022, arXiv e-prints, arXiv:2208.03651. https://arxiv.org/abs/2208.03651
- Kalogera (1996) Kalogera, V. 1996, ApJ, 471, 352, doi: 10.1086/177974
- Kippenhahn & Weigert (1967) Kippenhahn, R., & Weigert, A. 1967, ZAp, 65, 251
- Klencki et al. (2022) Klencki, J., Istrate, A., Nelemans, G., & Pols, O. 2022, A&A, 662, A56, doi: 10.1051/0004-6361/202142701
- Klencki et al. (2021) Klencki, J., Nelemans, G., Istrate, A. G., & Chruslinska, M. 2021, A&A, 645, A54, doi: 10.1051/0004-6361/202038707
- Korol et al. (2017) Korol, V., Rossi, E. M., Groot, P. J., et al. 2017, Monthly Notices of the Royal Astronomical Society, 470, 1894, doi: 10.1093/mnras/stx1285
- Kremer et al. (2017) Kremer, K., Breivik, K., Larson, S. L., & Kalogera, V. 2017, ApJ, 846, 95, doi: 10.3847/1538-4357/aa8557
- Kruckow et al. (2018) Kruckow, M. U., Tauris, T. M., Langer, N., Kramer, M., & Izzard, R. G. 2018, MNRAS, 481, 1908, doi: 10.1093/mnras/sty2190
- Langer (1998) Langer, N. 1998, Astronomy and Astrophysics, 329, 551
- Laplace et al. (2020) Laplace, E., Götberg, Y., De Mink, S. E., Justham, S., & Farmer, R. 2020, Astronomy and Astrophysics, 637, A6, doi: 10.1051/0004-6361/201937300
- Laplace et al. (2021) Laplace, E., Justham, S., Renzo, M., et al. 2021, A&A, 656, A58, doi: 10.1051/0004-6361/202140506
- Lau et al. (2022a) Lau, M. Y. M., Hirai, R., González-Bolívar, M., et al. 2022a, MNRAS, doi: 10.1093/mnras/stac049
- Lau et al. (2022b) Lau, M. Y. M., Hirai, R., Price, D. J., & Mandel, I. 2022b, arXiv e-prints, arXiv:2206.06411. https://arxiv.org/abs/2206.06411
- Law-Smith et al. (2020) Law-Smith, J. A. P., Everson, R. W., Ramirez-Ruiz, E., et al. 2020, arXiv e-prints, arXiv:2011.06630. https://arxiv.org/abs/2011.06630
- Lubow & Shu (1975) Lubow, S. H., & Shu, F. H. 1975, ApJ, 198, 383, doi: 10.1086/153614
- Luger et al. (2021) Luger, R., Bedell, M., Foreman-Mackey, D., et al. 2021, arXiv e-prints, arXiv:2110.06271. https://arxiv.org/abs/2110.06271
- Maeder & Meynet (2000) Maeder, A., & Meynet, G. 2000, ARA&A, 38, 143, doi: 10.1146/annurev.astro.38.1.143
- Marchant et al. (2021) Marchant, P., Pappas, K. M. W., Gallegos-Garcia, M., et al. 2021, A&A, 650, A107, doi: 10.1051/0004-6361/202039992
- Moravveji et al. (2016) Moravveji, E., Townsend, R. H. D., Aerts, C., & Mathis, S. 2016, ApJ, 823, 130, doi: 10.3847/0004-637X/823/2/130
- Morton (1960) Morton, D. C. 1960, ApJ, 132, 146, doi: 10.1086/146908
- Müller & Vink (2014) Müller, P. E., & Vink, J. S. 2014, Astronomy and Astrophysics, 564, 1, doi: 10.1051/0004-6361/201323031
- Nandez et al. (2014) Nandez, J. L. A., Ivanova, N., & Lombardi, J. C., J. 2014, ApJ, 786, 39, doi: 10.1088/0004-637X/786/1/39
- Neo et al. (1977) Neo, S., Miyaji, S., Nomoto, K., & Sugimoto, D. 1977, \pasj, 29, 249
- O’Connor & Ott (2011) O’Connor, E., & Ott, C. D. 2011, ApJ, 730, 70
- Ogata et al. (2021) Ogata, M., Hirai, R., & Hijikawa, K. 2021, MNRAS, 505, 2485, doi: 10.1093/mnras/stab1439
- Packet (1981) Packet, W. 1981, A&A, 1, doi: 10.1017/CBO9781107415324.004
- Paczyński (1971) Paczyński, B. 1971, ARA&A, 9, 183, doi: 10.1146/annurev.aa.09.090171.001151
- Paczynski (1976) Paczynski, B. 1976, in Structure and Evolution of Close Binary Systems, ed. P. Eggleton, S. Mitton, & J. Whelan, Vol. 73, 75
- Patton & Sukhbold (2020) Patton, R. A., & Sukhbold, T. 2020, MNRAS, 499, 2803, doi: 10.1093/mnras/staa3029
- Patton et al. (2022) Patton, R. A., Sukhbold, T., & Eldridge, J. J. 2022, MNRAS, 511, 903, doi: 10.1093/mnras/stab3797
- Pavlovskii et al. (2017) Pavlovskii, K., Ivanova, N., Belczynski, K., & Van, K. X. 2017, Monthly Notices of the Royal Astronomical Society, 465, 2092, doi: 10.1093/mnras/stw2786
- Paxton et al. (2011) Paxton, B., Bildsten, L., Dotter, A., et al. 2011, ApJS, 192, 3, doi: 10.1088/0067-0049/192/1/3
- Paxton et al. (2013) Paxton, B., Cantiello, M., Arras, P., et al. 2013, ApJS, 208, 4, doi: 10.1088/0067-0049/208/1/4
- Paxton et al. (2015) Paxton, B., Marchant, P., Schwab, J., et al. 2015, ApJS, 220, 15, doi: 10.1088/0067-0049/220/1/15
- Paxton et al. (2018) Paxton, B., Schwab, J., Bauer, E. B., et al. 2018, ApJS, 234, 34, doi: 10.3847/1538-4365/aaa5a8
- Paxton et al. (2019) Paxton, B., Smolec, R., Schwab, J., et al. 2019, ApJS, 243, 10, doi: 10.3847/1538-4365/ab2241
- Pejcha et al. (2017) Pejcha, O., Metzger, B. D., Tyles, J. G., & Tomida, K. 2017, ApJ, 850, 59, doi: 10.3847/1538-4357/aa95b9
- Perez & Granger (2007) Perez, F., & Granger, B. E. 2007, Computing in Science Engineering, 9, 21, doi: 10.1109/MCSE.2007.53
- Ramírez-Agudelo et al. (2015) Ramírez-Agudelo, O. H., Sana, H., de Mink, S. E., et al. 2015, A&A, 580, A92, doi: 10.1051/0004-6361/201425424
- Renzo et al. (2020) Renzo, M., Farmer, R. J., Justham, S., Mink, S. E. D., & Marchant, P. 2020, Monthly Notices of the Royal Astronomical Society, 4341, 4333, doi: 10.1093/mnras/staa549
- Renzo & Götberg (2021) Renzo, M., & Götberg, Y. 2021, ApJ, 923, 277, doi: 10.3847/1538-4357/ac29c5
- Renzo et al. (2022) Renzo, M., Hendriks, D. D., van Son, L. A. C., & Farmer, R. 2022, Research Notes of the American Astronomical Society, 6, 25, doi: 10.3847/2515-5172/ac503e
- Renzo et al. (2017) Renzo, M., Ott, C., Shore, S., & De Mink, S. 2017, Astronomy and Astrophysics, 603, doi: 10.1051/0004-6361/201730698
- Renzo et al. (2019) Renzo, M., Zapartas, E., de Mink, S. E., et al. 2019, Astronomy & Astrophysics, 66, 1, doi: 10.1051/0004-6361/201833297
- Renzo et al. (2021) Renzo, M., Callister, T., Chatziioannou, K., et al. 2021, ApJ, 919, 128, doi: 10.3847/1538-4357/ac1110
- Sen et al. (2022) Sen, K., Langer, N., Marchant, P., et al. 2022, A&A, 659, A98, doi: 10.1051/0004-6361/202142574
- Sravan et al. (2019) Sravan, N., Marchant, P., & Kalogera, V. 2019, The Astrophysical Journal, 885, 130, doi: 10.3847/1538-4357/ab4ad7
- Tauris & Dewi (2001) Tauris, T. M., & Dewi, J. D. M. 2001, A&A, 369, 170, doi: 10.1051/0004-6361:20010099
- Tauris et al. (2017) Tauris, T. M., Kramer, M., Freire, P. C. C., et al. 2017, ApJ, 846, 170, doi: 10.3847/1538-4357/aa7e89
- Tauris & Takens (1998) Tauris, T. M. M., & Takens, R. J. J. 1998, Astronomy and Astrophysics, 1059, 1047
- Thiele et al. (2021) Thiele, S., Breivik, K., & Sanderson, R. E. 2021, arXiv e-prints, arXiv:2111.13700. https://arxiv.org/abs/2111.13700
- Tutukov & Yungelson (1993) Tutukov, A. V., & Yungelson, L. R. 1993, MNRAS, 260, 675, doi: 10.1093/mnras/260.3.675
- van den Heuvel et al. (2017) van den Heuvel, E. P. J., Portegies Zwart, S. F., & de Mink, S. E. 2017, MNRAS, 471, 4256, doi: 10.1093/mnras/stx1430
- van der Walt et al. (2011) van der Walt, S., Colbert, S. C., & Varoquaux, G. 2011, Computing in Science and Engineering, 13, 22, doi: 10.1109/MCSE.2011.37
- van Son et al. (2022) van Son, L. A. C., de Mink, S. E., Callister, T., et al. 2022, ApJ, 931, 17, doi: 10.3847/1538-4357/ac64a3
- Vigna-Gómez et al. (2018) Vigna-Gómez, A., Neijssel, C. J., Stevenson, S., et al. 2018, Monthly Notices of the Royal Astronomical Society, 481, 4009, doi: 10.1093/mnras/sty2463
- Vigna-Gómez et al. (2020) Vigna-Gómez, A., MacLeod, M., Neijssel, C. J., et al. 2020, PASA, 37, e038, doi: 10.1017/pasa.2020.31
- Virtanen et al. (2020) Virtanen, P., Gommers, R., Oliphant, T. E., et al. 2020, Nature Methods, 17, 261, doi: 10.1038/s41592-019-0686-2
- Walmswell et al. (2015) Walmswell, J., Tout, C. A., & Eldridge, J. J. 2015, MNRAS, 447, 2951, doi: 10.1093/mnras/stu2666
- Wang et al. (2020) Wang, C., Langer, N., Schootemeijer, A., et al. 2020, ApJ, 888, L12, doi: 10.3847/2041-8213/ab6171
- Wang et al. (2021) Wang, L., Gies, D. R., Peters, G. J., et al. 2021. https://arxiv.org/abs/2103.13642
- Webbink (1984) Webbink, R. F. 1984, ApJ, 277, 355, doi: 10.1086/161701
- Yoon & Langer (2005) Yoon, S. C., & Langer, N. 2005, A&A, 443, 643, doi: 10.1051/0004-6361:20054030
- Zapartas et al. (2017) Zapartas, E., de Mink, S. E., Izzard, R. G., et al. 2017, A&A, 601, A29, doi: 10.1051/0004-6361/201629685
- Zapartas et al. (2021) Zapartas, E., Renzo, M., Fragos, T., et al. 2021, A&A, 656, L19, doi: 10.1051/0004-6361/202141506
- Zorotovic et al. (2010) Zorotovic, M., Schreiber, M. R., Gänsicke, B. T., & Nebot Gómez-Morán, A. 2010, A&A, 520, A86, doi: 10.1051/0004-6361/200913658
Appendix A Impact of core-envelope boundary and rotation on the binding energy profile
In this appendix, we introduce our “engineered” models and illustrate with examples how the envelope binding energy depends on the CEB region (Sec. A.1) and on the initial rotation rate of the star (Sec. A.2). Both can be significantly modified by accretion during the first RLOF.
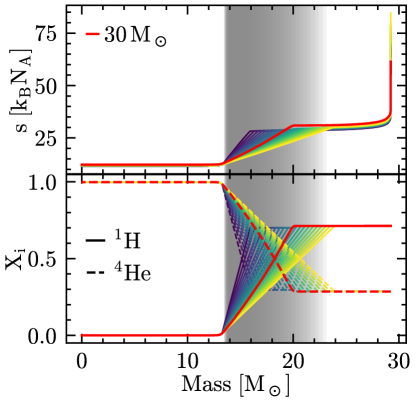
Fig. 5 shows an example grid of “engineered stars” of , similar to Fig. 2. Starting from a non-rotating single star at TAMS (e.g., red model in Fig. 5), we modify the CEB specific entropy (s) which controls the thermal properties of the gas, and its H, and He profiles – but do not change the mass fractions of other elements. Specifically, we keep the same inner and outer profiles, but impose a linear connection from the outer boundary of the H-depleted core to a mass coordinate which we specify as a parameter (see Fig. 5 and Fig. 2). We let MESA relax the TAMS profiles to the desired entropy and composition profiles and then recover gravothermal and hydrostatic equilibrium, and then evolve until either carbon depletion or when the photospheric radius of these models first exceeds .
A.1 Steepness of the core-envelope boundary
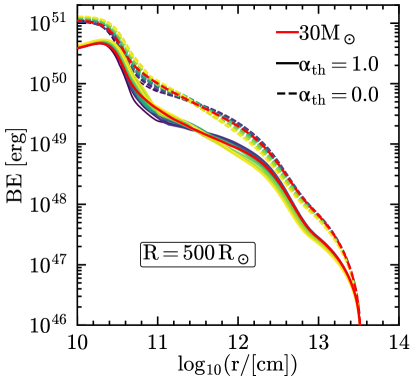
Fig. 6 shows a comparison of the gravitational and binding energy profiles of a single star (red solid line) to “engineered” models, when stars first reach radius . Fig. 6 shows that binding energy depends on the structure of the CEB region. In single stars, the CEB is determined by the extent of the convective boundary mixing and the recession in mass coordinate of the convective core. In Fig. 6, lines of different colors show a trend with shallower entropy and composition profiles at TAMS (lighter curves in Fig. 5) evolving into more bound inner envelopes (larger binding energy inside ), and vice versa.
A.2 Rotation
Mass transfer through RLOF also spins up the accreting star, often to critical rotation333At critical rotation, the centrifugal force balances the gravitational pull at the equator, corresponding to critical angular frequency , with the Eddington luminosity, and the stellar luminosity. (e.g., Lubow & Shu, 1975; Packet, 1981; Cantiello et al., 2007; Renzo & Götberg, 2021). To illustrate the impact of rotation, it is worth considering the CEB region and envelope structure of single-star models rotating since birth, although spinning up a star late during its main-sequence evolution has different structural consequences than natal rotation (see Renzo & Götberg 2021).

Rotation has two main evolutionary effects: (i) mixing can change the core size directly (see Heger et al. 2000; Maeder & Meynet 2000), (ii) by inflating the equatorial region, rotation changes the temperature and opacity structure, and therefore the line-driving of the wind (e.g., Müller & Vink, 2014; Gagnier et al., 2019), affecting the rate of recession of the convective core (e.g., Renzo et al., 2017, 2020). Moreover, rotation can have a dynamical effect, resulting in mass loss through the combination of centrifugal forces and radiative pressure ( limit, Langer 1998). One-dimensional stellar evolution codes commonly assume that rotation increases the total mass loss rate (e.g., Langer, 1998; Heger et al., 2000) though this may not always be true throughout the evolution (e.g., Gagnier et al., 2019).
Fig. 7 shows the gravitational binding energy profile of the single, non-rotating star, compared to single stars of the same mass and varying initial . For , corresponding to a generous upper-bound for the typical birth rotation rate of single massive stars (e.g., Ramírez-Agudelo et al., 2015), the effect is modest but non-negligible. For more extreme initial rotation rates (achievable during RLOF), the ratio of the He core mass to total mass is significantly changed by rotational mixing, which can result in larger binding energy differences than changing the CEB region at fixed core mass.
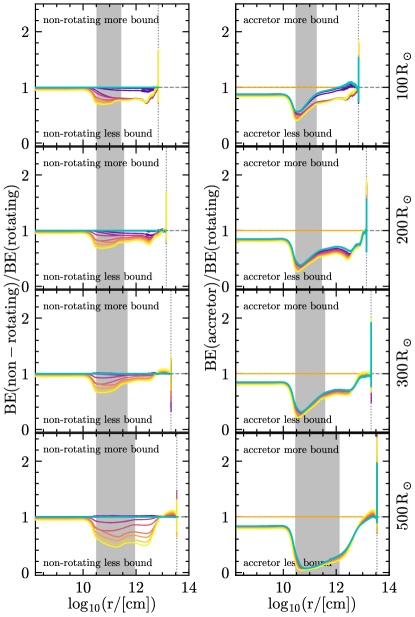
Fig. 8 shows the ratio of the binding energy (cf. Fig. 3) of a reference model divided the binding energy of the rotating models of Fig. 7. The left column uses as reference model for the numerator the non-rotating single , while the right column uses our accretor. The ordering of colors shows that the faster the initial rotation, the larger its structural effect on the star. However, single star models, regardless of their initial rotation rate, are more similar to each other than any single rotating star is to the accretor: in each row, the ratios in the left column are closer to one than the ration in the right column. Moreover, the binding energy profiles of fast-rotating models (yellow) differ more than slow- and non-rotating models (blue and cyan) when compared to our accretor (i.e., their ratios are farther from one). Therefore, we do not recommend the use of fast-rotating single stars to mimic the effect of mass accretion and rejuvenation. For stars accreting through RLOF in a binary both effects illustrated in Fig. 6 and Fig. 7 act simultaneously, although the timing and amplitude of the impact of mixing and rotation can be different than for single stars (e.g., Renzo & Götberg, 2021). Future work should investigate how to include the effect in rapid population-synthesis, for example with a prescription for (see Appendix D).
Appendix B Binding energy profiles
In Fig. 9, we show the binding energy of our accretor models (solid lines, including the internal energy, i.e. in Eq. 1), single stars with initial mass roughly equal to the corresponding accretor’s post-RLOF mass, and our engineered models (see also Fig. 11 for the profile defined in Appendix D). The two lowest mass accretors (left and central column) do not expand to before carbon depletion. Generally speaking, the accretors (orange) have lower binding energies than corresponding single stars (red), and their profiles are qualitatively closer to the engineered models with the steepest core (darker curves), although local deviations from this trend can occur for some .
Appendix C Comparison with same core mass
Fig. 2 compares our accretor models to stars of the same total post-RLOF mass. However, it is not obvious that models of the same total mass are the most relevant comparison: for instance, the (helium or carbon-oxygen) core mass is often used to determine the final compact object (e.g., Fryer et al., 2012; Farmer et al., 2019; Patton & Sukhbold, 2020; Renzo et al., 2022; Fryer et al., 2022), and comparing models of roughly the same core mass might be more appropriate (but is sensitive to the condition defining the core edge). We show in Fig. 10 a comparison of our accretors with models of the same total initial mass, which constitute the extreme opposite comparison point.
Appendix D Common envelope
de Kool (1990) introduced a binding energy parameter to account for the internal structure of the stars when calculating the post-CE orbit using energy conservation:
| (D1) |
where again the Lagrangian mass coordinate can be interpreted as a variable core mass (see also De Marco et al., 2011; Ivanova et al., 2013). While de Kool (1990) implicitly used , we calculate with (including recombination energy), which provides a best case scenario for the ejection of the CE by harvesting the entire internal energy available in the gas. We show in Fig. 11 the profiles for our models.
