Pulse Shape Simulation and Discrimination using Machine-Learning Techniques
S. Dutta1*, S. Ghosh3, S. Bhattacharya1, and S. Saha2
1High Energy Nuclear and Particle Physics Division, Saha Institute of Nuclear Physics - a CI of Homi Bhabha National Institute, Kolkata - 700064, INDIA
2Applied Nuclear Physics Division,
Saha Institute of Nuclear Physics - a CI of Homi Bhabha National Institute, Kolkata - 700064, INDIA
3Department of Physics and Astronomy, Purdue University, West Lafayette, IN, 47907, USA
*shubhamdutta16@yahoo.com
Abstract
An essential metric for the quality of a particle-identification experiment is its statistical power to discriminate between signal and background. Pulse shape discrimination (PSD) is a basic method for this purpose in many nuclear, high-energy and rare-event search experiments where scintillator detectors are used. Conventional techniques exploit the difference between decay-times of the pulse from signal and background events or pulse signals caused by different types of radiation quanta to achieve good discrimination. However, such techniques are efficient only when the total light-emission is sufficient to get a proper pulse profile. This is only possible when there is significant recoil energy due to the incident particle in the detector. But, rare-event search experiments like neutrino or dark-matter direct search experiments don’t always satisfy these conditions. Hence, it becomes imperative to have a method that can deliver a very efficient discrimination in these scenarios. Neural network based machine-learning algorithms have been used for classification problems in many areas of physics especially in high-energy experiments and have given better results compared to conventional techniques. We present the results of our investigations of two network based methods viz. Dense Neural Network and Recurrent Neural Network, for pulse shape discrimination and compare the same with conventional methods.
1 Introduction
Pulse shape discrimination (PSD) have been widely used to discriminate between the different radiation quanta, such as photons (X-rays, gamma rays etc), electrons, neutrons, protons, alpha particles, etc. which, on interaction with a medium, leave traces of signals that differ in shape characterized by various pulse parameters, such as rise time, fall time, charge content and various others. In a mixed radiation field experiment, PSD is considered as indispensable method to discriminate between the signal from the radiation quanta of interest and the background. Various PSD techniques have been evolved and utilized, mostly in the time domain, such as charge integration, mean-time, zero cross-over, pulse gradient, time-over-threshold, time-of-flight techniques, etc. In addition, PSD in the frequency domain has also been demonstrated by digital signal processing techniques such as discrete wavelet transform and found to perform better than conventional time domain technique for discrimination between neutrons and gamma-rays using liquid organic scintillator[1].
Inorganic scintillators are quite often used in radiation detection for their much higher light output as compared to the organic scintillators. Manifestation of photo-peaks in inorganic scintillators helps in carrying out nuclear spectroscopic investigation in the energy domain. Thallium doped Cesium Iodide [CsI(Tl)] scintillator has been used across the energy domain for spectroscopic as well as calorimetric investigation exploiting the PSD techniques for improved particle identification. This method has been widely used for discrimination between light charged particles at in nuclear reaction studies at low and intermediate energy domain [2] and proposed to be utilized as a new technique to discriminate between the hadronic and the electromagnetic showers in the high energy domain at the collider experiment Belle II [3].
When an energetic particle passes through a scintillator, the amount of light produced is dependent on the energy-loss per unit path-length () or specific energy loss (SEL) of the incident particle. This quantity varies with energy and the incident particle-type due to the difference in the nature of interaction of the incident particle with the scintillating medium. As the particle loses energy in the medium, the SEL changes resulting in variation in the intensity of light-output as a function of time. Hence, scintillators have the property of producing pulses with different decay-times based on the incident particle-type. This is the underlying principle acting as the basis for pulse shape discrimination.
Inorganic scintillators have also been used because of their high light output and variation of the pulse shapes by the interaction of different hadronic and electromagnetic particles in experiments searching for rare events, such as dark matter search (DMS) experiment using CsI(Tl) scintillator[4], neutrinoless double beta decay experiment using 48Ca enriched Calcium Fluoride () scintillator[5], etc. The DMS experiment, in particular, looks for a very small amount of energy (of the order of a few keV to 100 keV) dumped into the scintillator by nuclear recoil suffered due to very rare interaction of the dark matter particles with its nuclei. A major challenge in the DMS experiment is the overwhelming presence of unwanted background caused by the electrons, muons, gamma rays, neutrons, etc. [6] which must be filtered out. PSD has been effectively used[7] to filter out the unwanted electromagnetic background. Furthermore, the amount of kinetic energy imparted to the recoiling nucleus becomes less as the DMS experiments look for lighter DM candidates (sub-GeV to a few GeV of mass). Efficient discrimination by the conventional PSD techniques involving time or frequency domain information becomes increasingly constrained at such tiny recoil energy domain. In this work, it is demonstrated that the machine learning (ML) technique using effective algorithms has the potential of better discrimination than the conventional methods.
Machine learning (ML) is a class of computer algorithms that “train” on existing data to learn its general features in order to be able to predict the outcome, when new data is fed to it. To be specific, this pertains to supervised learning, nonetheless ML is also capable of doing unsupervised learning. MLs are used for both classification and regression problems. This is akin to fitting a dataset with a function by adjusting the function-parameters, and then using the fitted-function to predict new outcomes. However, ML is much more diverse in the sense that one need not provide any functional form, a priori. ML itself finds the best function that captures the general trend of the dataset while training. Here, we have explored PSD with Boosted Decision Trees (BDT) [8] and network-based ML [9].
In this paper, we confine our attention to the task of discrimination of scintillation signals caused by gamma rays predominantly through the electron recoil, termed as electron scintillation (ES) and that due to nuclear recoil caused by the neutrons, which is termed as nuclear scintillation (NS) in a couple of inorganic crystalline scintillators such as CsI(Tl) and Bismuth Germanate (BGO).
The paper is organized as follows. Section 2 introduces the nuances and relevant details of the ML techniques followed. GEANT4 simulation, as applied to the task of pulse shape discrimination, has been discussed in Section 3. Simulation deals with the scintillation caused by gamma rays predominantly through the electron recoil, termed as electron scintillation (ES), such as CsI(Tl) and Bismuth Germanate (BGO). Experimental details and training of data for ML have been described in Section 4. Analysis of results and comparison of ML based results with a few conventional PSD methods have been discussed in Section 5, followed by conclusion.
2 Boosted Decision Tree (BDT)
BDT, as the name suggests, is a series of decision trees to classify data. This is a very intuitive model of ML, as it iteratively asks questions and partitions the data based on them until an optimal decision boundary is reached. A schematic of BDT is given in figure 1.
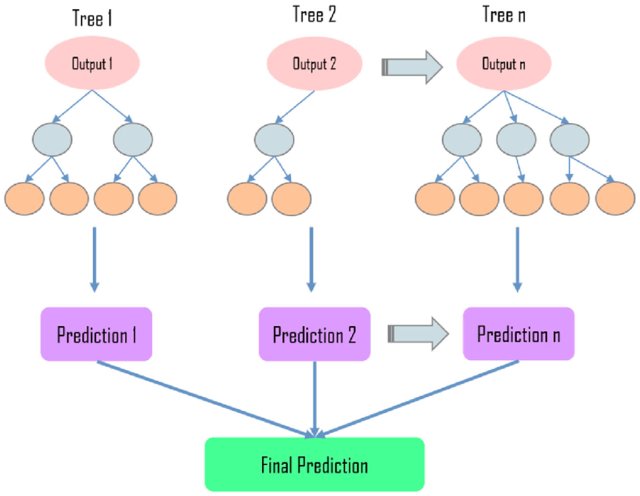
In BDT many weak trees, i.e. trees that perform slightly better than random guessing, are combined by giving appropriate weightage to each tree. The highest weightage is given to the tree that has the least error. The BDT score that is calculated for an event reflects the probability of assigning the event to a particular class. All the trees, however, do not see the same form of the training data. Each successive tree sees a training data in which misclassified datapoints (from the previous tree) are given more weightage or boosted. Thus, each successive tree tries to correct the mistakes of the previous one [11].
3 Network-based ML
Network based machine learning algorithms have shown dramatic improvements in classification problems [12]. These algorithms have become ubiquitous through their wide range of applications, starting from facial-recognition to self-driving cars. In physics, they have been applied for particle identification problems in high energy physics [13] [14] [15] [16] and have given better results compared to conventional methods and other ML-based methods as well.
The basic unit of a network is a node that takes in several inputs and gives an output. Each input can be thought of as a parameter-value based on the which the node makes a decision which is reflected in the value calculated at the output. The model of a node, also called perceptron in the context of neural networks, is shown in figure 2. Each node in the network acts as a non-linear Fisher discriminant [17]. In other words, each node is capable of drawing a non-linear decision boundary in the input space of the network. A multi-layered organisation of nodes is called a multi-layered perceptron (MLP), in which the no. of layers, no. of nodes and the weights of connections between the nodes are tuned to get the most optimal decision boundary. Such networks thus, act as universal approximators [18].
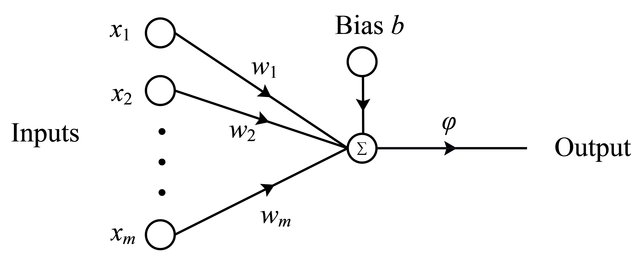
The perceptron is modeled after a neuron. It takes several inputs weighted by for the input, adds a bias to it and then the sum is fed to some non-linear activation function like the sigmoid to produce the output. Mathematically, this can be written as,
| (1) |
The inputs can either be outputs of perceptrons from the previous layer or some parameter value that is given as input to the network.
The events from the datasets are split into training and test events randomly. The training events are further grouped into batches of fixed no. of events viz. a training batch. The networks are trained in many training epochs. Each training epoch consists of passing the training batches through the network, then calculating the change in weights and biases after each batch using the back-propagation method [20] and then finally evaluating the discrimination efficiency by passing the test events. The network never “sees” the test events while training in any of the training epochs.
3.1 Dense Neural Network
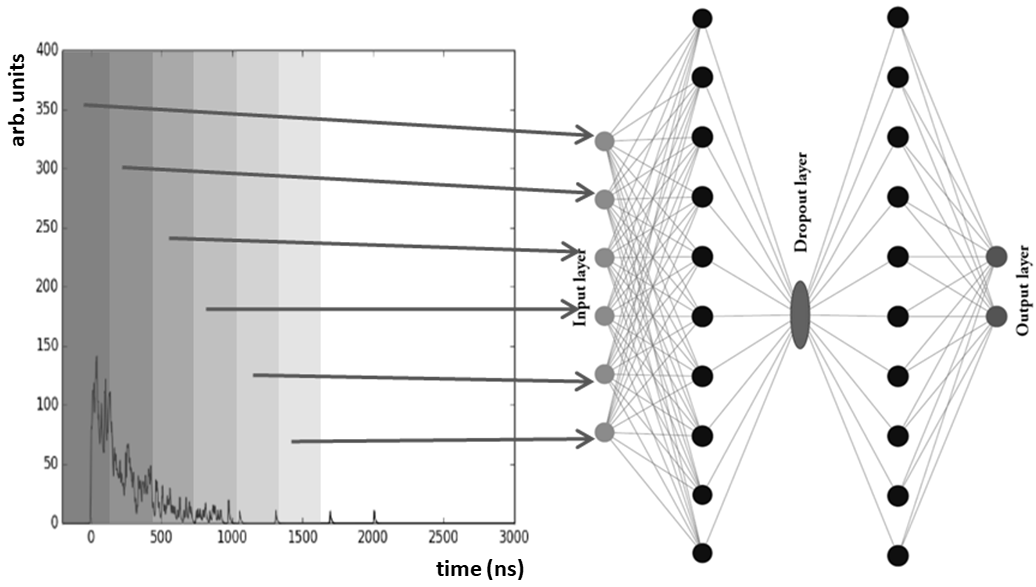
A basic dense neural network (DNN) was made to serve as a benchmark for the performance of network-based methods. The network consisted of 6 input nodes, 2 hidden layers having 10 nodes each and an output layer having 2 nodes. It is called a dense network because all nodes of a particular layer are connected to all the nodes from the previous layer. The schematic of the network is shown in figure 3. The total no. of training parameters in the network is 202. Dropouts [21] were added in order to prevent over-training of the network. The input to the network is the area under the pulse starting from t=0 to various cut-points in time as shown in figure 3. Calculating the value for the input nodes in this way ensures that the input values to the network remains between . This does away the need for scaling the input before feeding it to the network. All the nodes have rectified linear unit (ReLU) [22] activations except for the nodes in the last (output) layer which have softmax activations. The trained-network assigns a score in the range – to every pulse. A score of indicates that the network classifies the pulse to belong to background with certainty, while a score of means it is classified as signal.
3.2 Recurrent Neural Network
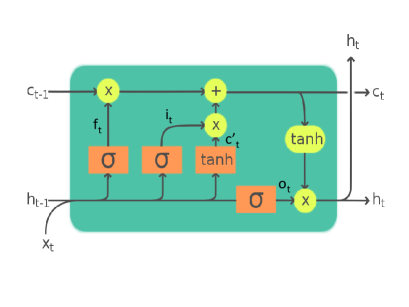
Recurrent Neural Networks (RNN) are used for language processing algorithms. The RNN studied here, is built using Long Short Term Memory (LSTM) cells [23] [24] (figure 4). They have an inherent memory component which is implemented by feeding a weighted value of the previous input to the cell. The relations pertaining to the LSTM cell are given by the following and it is schematically shown in figure 4.
| (2) | ||||
where , , , , and are respectively the vectors forget gate, input gate, cell activation, output gate, cell state and hidden state. ’s are the weight matrices and ’s are the biases. The subscripts ‘’ and ‘’ denote the current and previous time-stamps respectively. ‘’ is the sigmoid function and ‘’ represents the Hadamard product. The vector is what passes to the next layer of the network. The gate vectors regulate the correlation that the network forms between the different data-points in time.
The pulse-data that is being given as input to the network is a time-series data. Thus, each data-point in time is related with the previous data-point. The memory feature of the RNN can exploit this correlation and learn to distinguish the time-series dataset better. With this motivation an RNN was constructed for PSD. It has 5 LSTM units followed by a dense connected hidden layer with 15 nodes. The total no. of training parameters is 262. The entire time-slice data is fed to each LSTM unit in the input in the form of a vector. The training follows the same method as mentioned in Section 3.1.
4 Detector Simulation
The detector simulation to produce pulses serves broadly two purposes. First, a detailed simulation helps to mimic the actual detector response that can aid in designing, evaluating and optimizing detector shielding. For rare-event search experiments, detector shielding is a very important aspect as it helps to further cut-down the background events. This can then be corroborated by performing experiments at the site and comparing the results with simulation. Second, it enables us to have a large dataset to train and validate the performance of the machine learning (ML) algorithms. Simulation also gives us handles to simulate any scenario at will, which is essential for doing proper systematic studies.
GEANT4 [26] package is used to simulate the production and transportation of scintillation photons when deposits energy in the scintillators. The PMT-response is simulated using a separate code that takes the output from GEANT4 to produce the final scintillation pulse. Scintillation photons are generated in GEANT4 when the parameters that characterize the scintillation light-output are provided to it. The scintillation spectrum, rise-time, the fast and slow decay-time constants and light yield are the main parameters. The spectrum is provided as a list of wavelengths and corresponding intensity relative to the maximum. There is provision to specify the fast and slow components of the spectrum corresponding to the fast and slow decay-times. GEANT4 generates scintillation photons based on these parameters having isotropic distribution and linear polarization. However, this is only the generation part of the photons.
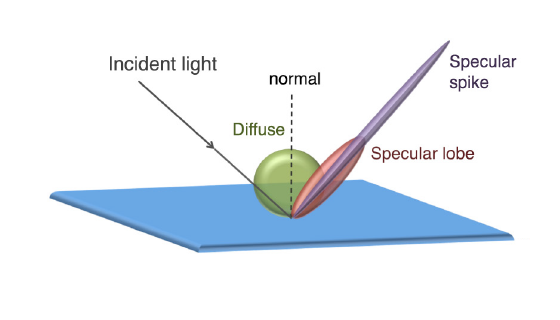
The simulation of photon transportation is carried out when the refractive index of the medium is provided. In order to simulate processes at the interface of two media, the surface boundary needs to be defined. This definition includes the surface roughness and the nature of the boundary as dielectric-dielectric or dielectric-metal. This is particularly important for reflection of photons at the boundary surface. Under the unified model [27], reflectance has 4 main types viz. specular spike, specular lobe, backscatter and Lambertian (diffused) (figure 5). For each wavelength that was given in the scintillation spectrum, a list of 4 numbers is provided. These numbers represent the probability for a photon, of a particular wavelength, to be reflected following one of the 4 types. In case the boundary is in between two transparent media, then the refractive index is used to calculate the total internal reflection.
The reflectance of teflon is modeled as having 99% reflectivity [28], remaining 1% is transmitted or absorbed. Among the photons that are reflected, the main type of reflection is diffused (90%) and the rest is specular lobe (10%). The detection of a photon is simulated by changing the status of a flag (associated with the photon) to ‘DETECTED’ or ‘ABSORBED’. This is implemented both as boundary process and bulk process within the PMT glass window. GEANT4 provides a handle, termed as ‘EFFICIENCY’, which is a number corresponding to each wavelength that quantifies the detection efficiency (quantum efficiency) of the PMT.
The PMT simuation was done using a separate code that implements the PMT response. There are mainly two components at play here. First is the gain of the PMT and second is the transit time spread (TTS). However, for a slow scintillator (compared to TTS of PMT) the TTS does not play a big role. The gain corresponding to a photon is sampled from a distribution as described in [29]. The final pulse is produced by convoluting the scintillation pulse obtained from GEANT4 with the PMT response that includes the gain and TTS. If a profile of the electrical noise is available for the setup that too can be included here.
5 Experimental and Training Data
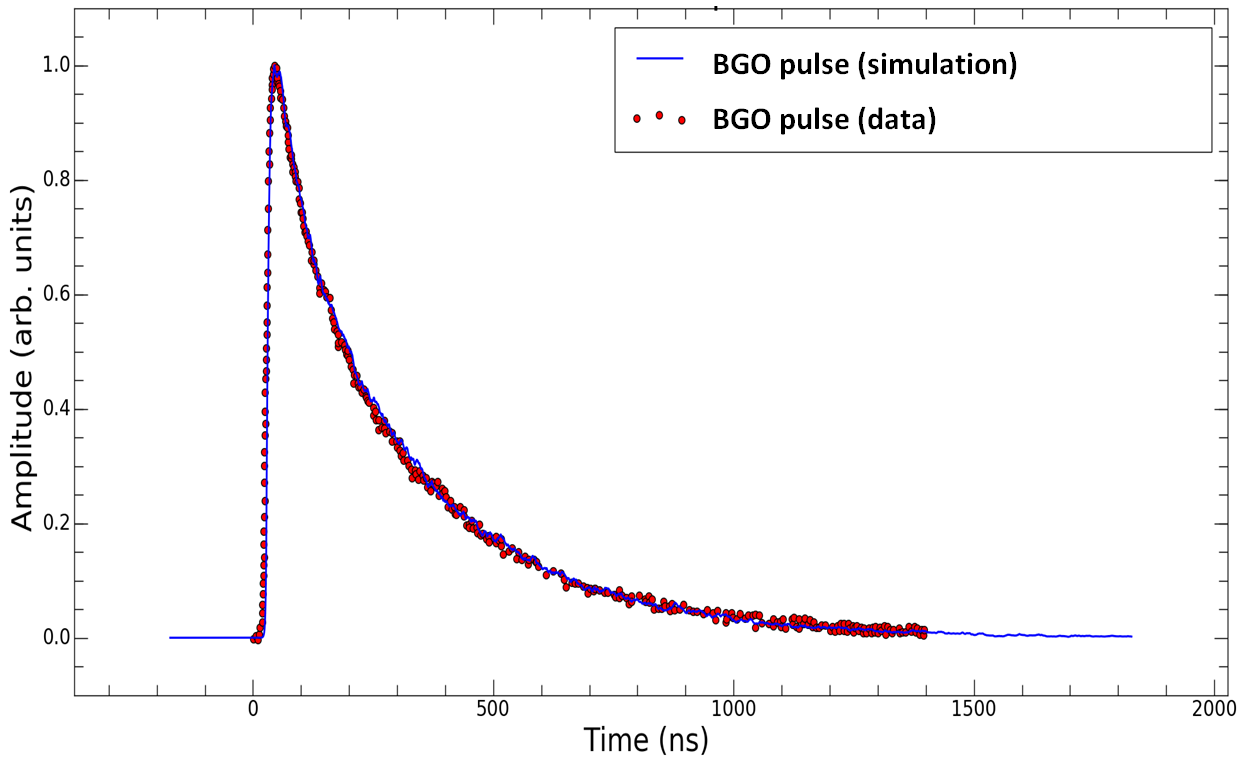
The experimental data is obtained from two detector setups. In the present work this was done for BGO and CsI(Tl) scintillators. Experimental validation of the simulation of both setups gives us confidence that the simulation can be tuned for different detectors. The BGO data was taken from [30] for the first setup. A 137Cs -source of 662 keV is placed in front of a cylindrical BGO crystal having 2 mm thickness 13 mm diameter. The energy spectrum is obtained using integrated charge of pulse that is acquired using a digital oscilloscope (LeCroy WaveRunner 64xi).
In the second case, a cylindrical CsI(Tl) crystal having 50 mm thickness 50 mm diameter is studied. Here too, a 662 keV -source of Cs137 is used to obtain the energy-spectrum and pulse-data with which the simulated data is compared. The two end-faces of the crystal were optically coupled to PMTs. The pulse from one of the PMTs is used as a trigger, while the pulse from the other one is used for the energy and pulse measurement. The spectrum data is obtained using a CAEN DT5720 digitizer. The pulse-data is collected using a digital oscilloscope (Tektronix DPO4104) which is capable of storing data through USB port in a thumb-drive.
The validation of the simulation was done in two ways. First, by taking average of 100 pulses near the photo-peak, when the scintillators are irradiated with the 137Cs source and comparing the same with simulation. In order to validate the variation of the pulse due to difference in energy deposited within the crystal, comparison with experimentally obtained energy spectra is done. The simulated energy spectra was obtained by time-integrating the simulated pulses. The results are shown in figure 6 and 7 for BGO and CsI(Tl) respectively.
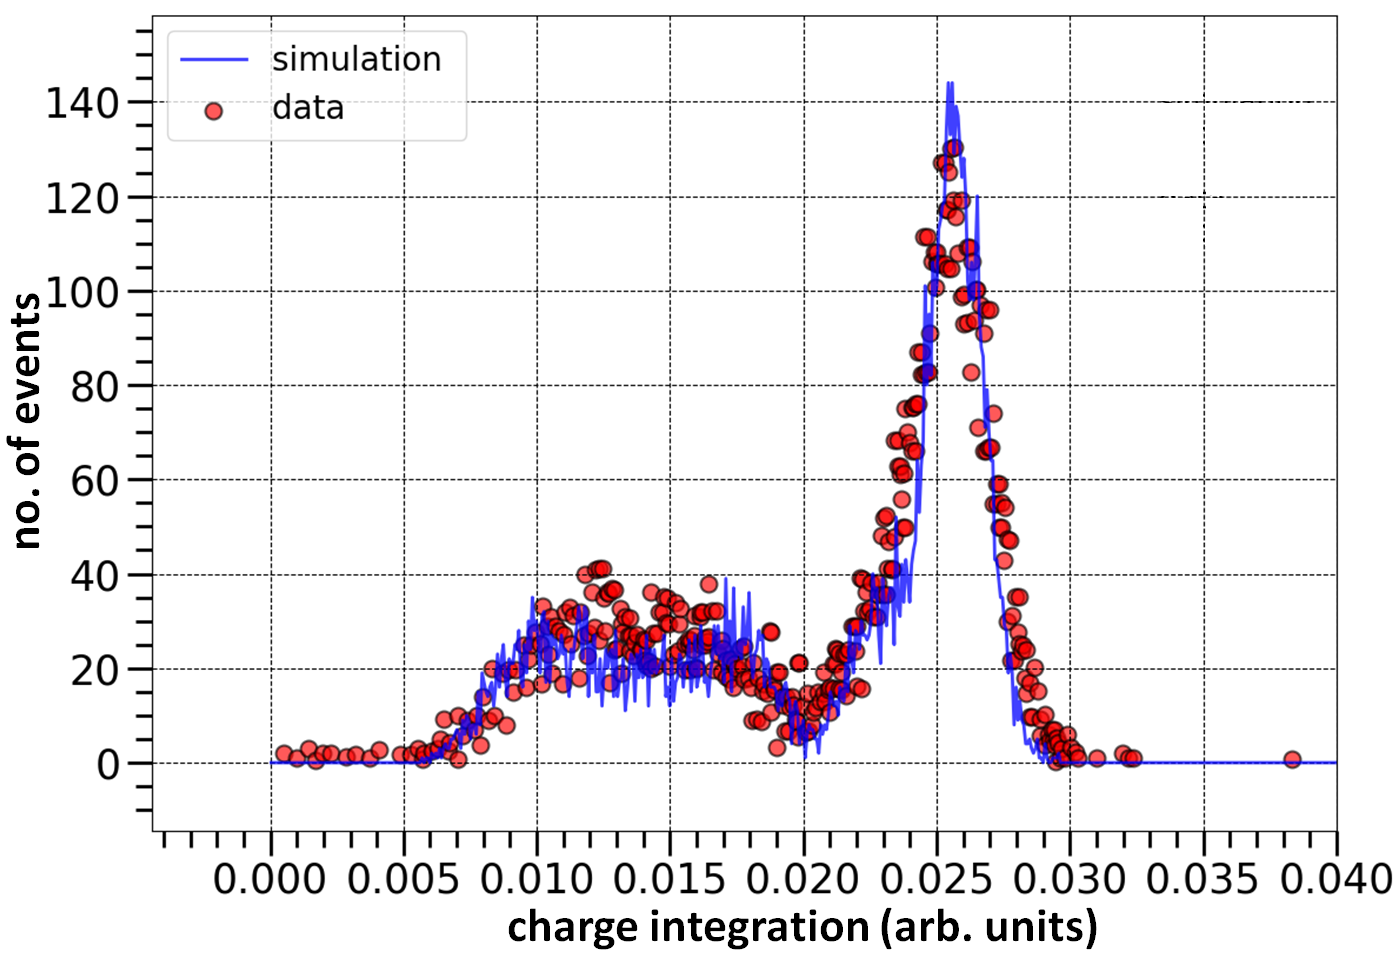
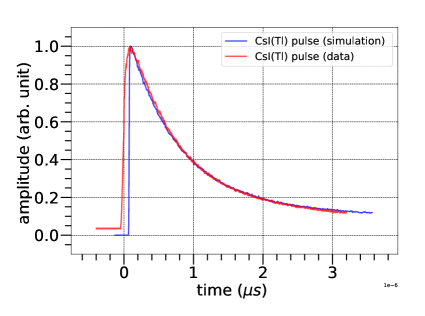
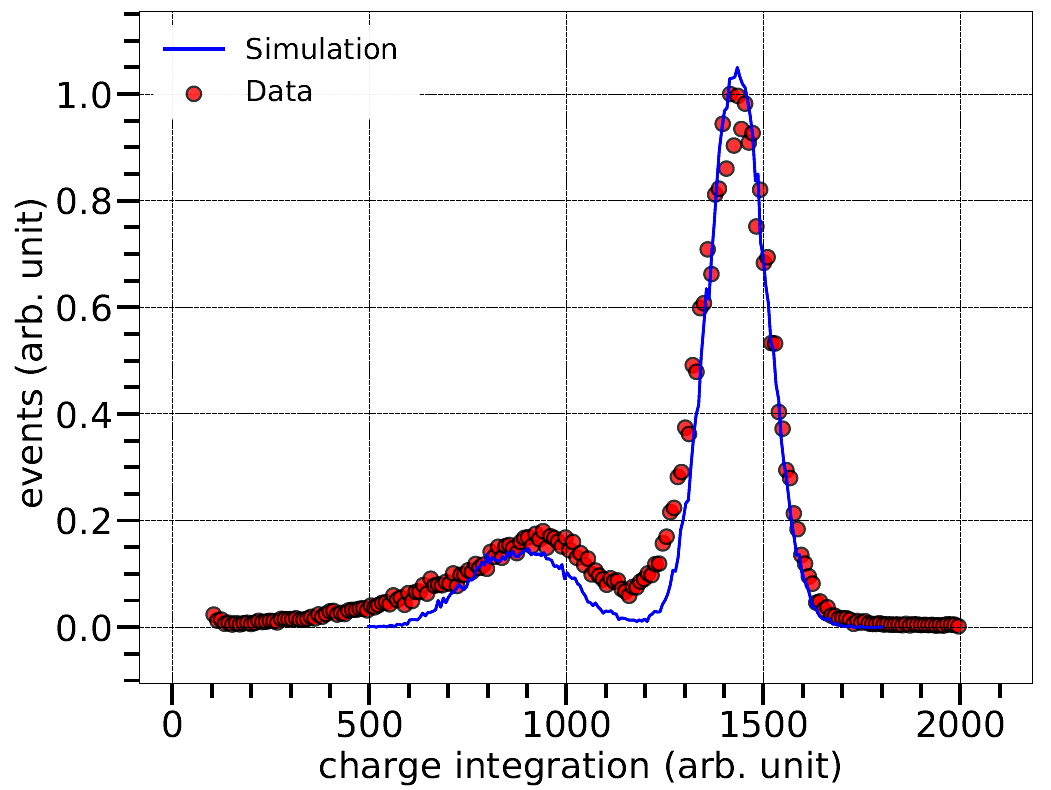
The spectra matches reasonably well near the photo-peak and Compton valley in both the cases. The experimental data for BGO has a backscatter peak which is less prominent in the simulation. In case of CsI, the Compton valley is more broadened in the experimental data due to the presence of electronic noise.
As mentioned in section 1, the pulses for different particles differ by their decay time for the same energy deposit [31]. In order to study the PSD capabilities of the different methods explored in this paper, two categories of pulses were simulated that differ by their decay times. Both the categories of pulses are generated by impinging -ray photons on the scintillators. The first category of pulses, labelled as signal, have the decay times obtained from literature and/or experiment. The second category of pulses, labelled as background, have decay-time components (both fast and slow) 10% larger than the first category. The scintillation parameters provided to GEANT4 for the two categrories are summarized in Table 1. The labelling as signal and background for the two categories have been used for the sake of clarity in the text when referring to them.
| Parameter | Category I (signal) | Category II (background) |
|---|---|---|
| Rise Time () | ||
| Fast Decay Time () | 1.30 | 1.43 |
| Slow Decay Time () | 4.50 | 4.95 |
| Light yield (per MeV) |
Since, the motivation is to have better PSD capabilities at low energy deposits (10s of keV) in the scintillator, the simulated pulses for both signal and background are obtained by allowing low energy -rays to fall on the scintillators. The low energy analysis is done for 4 keV and 20 keV incident . 50K samples were generated for each category (signal and background) for a total of 100K samples out of which 70K samples were used for training and 30K for testing. The samples for training and testing were selected randomly.
6 Analysis
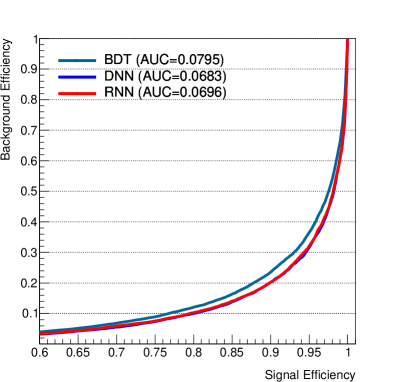
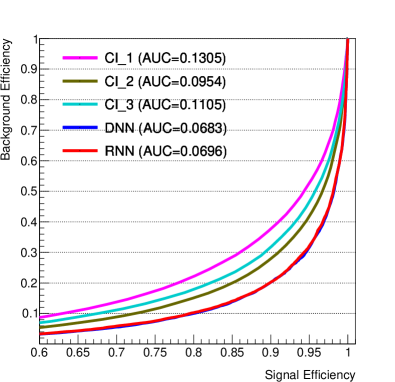
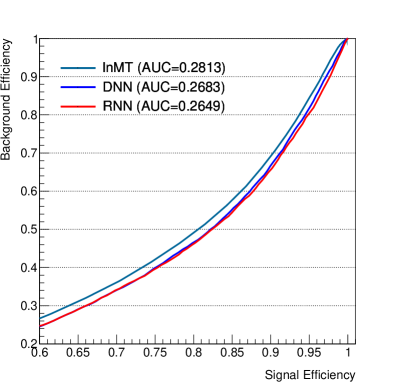
The performance of the ML algorithms have been compared with conventional methods. All the methods were applied to the same signal and background datasets and their discrimination capability is analyzed. The figure-of-merit is obtained by making Receiver Operating Characteristic (ROC) plots and then calculating the area-under-curve (AUC). The ROC curve is made by calculating the signal and background efficiencies, defined as fraction of signal and background events that pass a particular selection criteria respectively, and then plotting these quantities in the background efficiency vs. signal efficiency plane for all selection criteria.
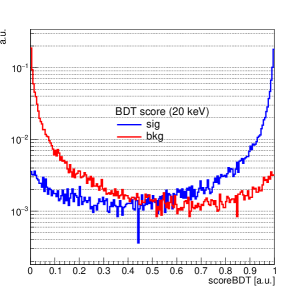
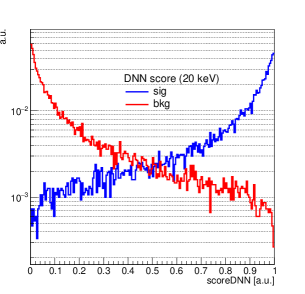
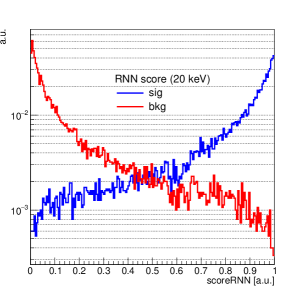
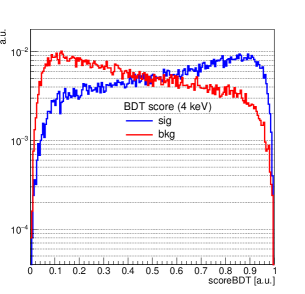
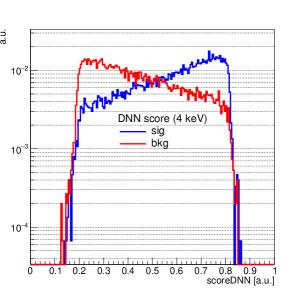
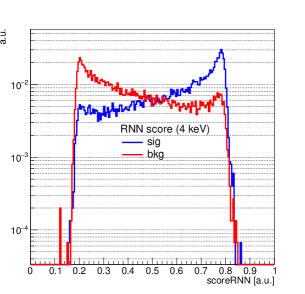
Figures 8 and 9 show the distribution of the scores of the ML methods at recoil energies of 20 keV and 4 keV respectively. The distributions clearly show that the performance degrades as we go to lower energies. This is also reflected in the ROC plots shown in figures 10(a) and 10(b); the AUC values are mentioned alongside the legends. It can be concluded from the AUC values, that the network-based methods perform better than BDT. So, only the network based methods have been compared with the conventional methods of Charge Integration (CI) and Mean-time (lnMT) method.
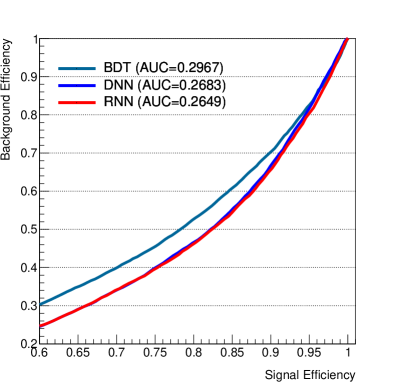
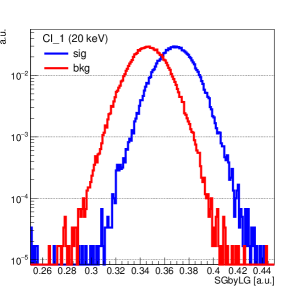
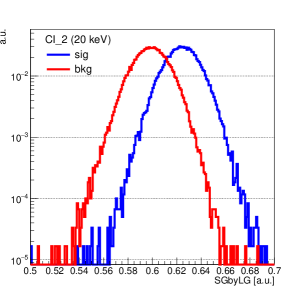
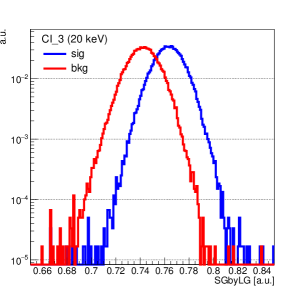
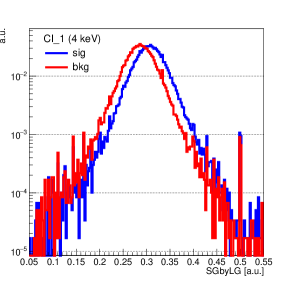
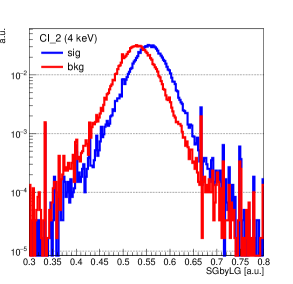
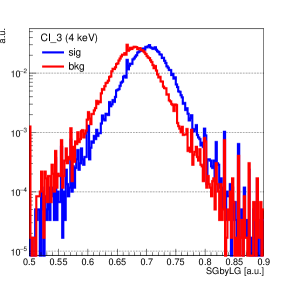
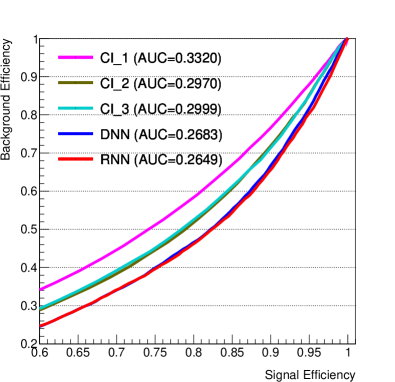
In the CI method, the ratio of charge within a short gate (time window) to the same within a long gate is calculated. The distribution of the ratio for three different short gates is plotted in figures 11 and 12, while the long gate is kept constant at 10 s. The three ratios corresponding to the three short gates are labelled as CI 1, CI 2 and CI 3. Figure 13 shows the ROC plots for 20 keV and 4 keV along with the AUC values. The networks clearly provide better discrimination.
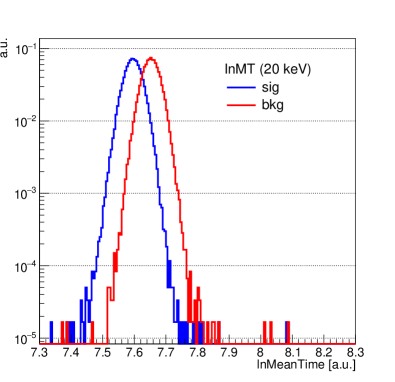
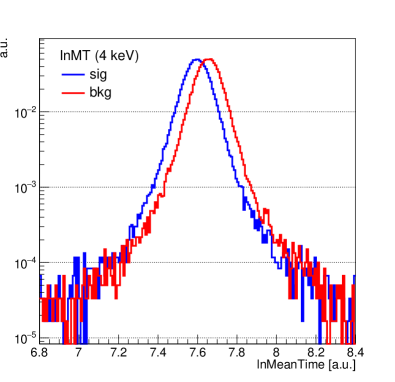
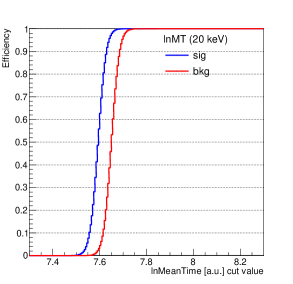
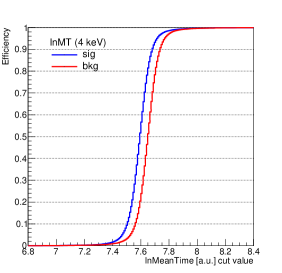
The mean-time, or to be specific the natural log of mean-time, has a good discrimination at low energy deposits [31]. The expression for the mean time is given by,
| (3) |
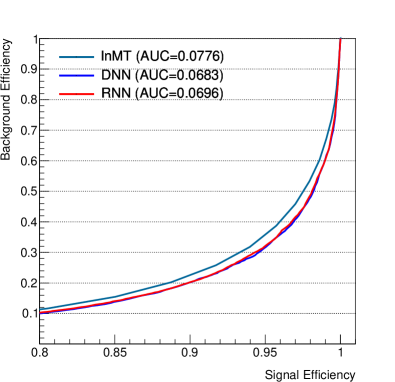
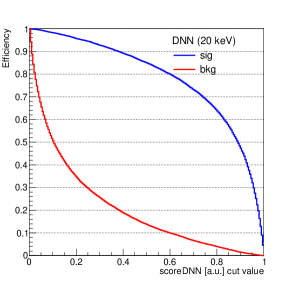
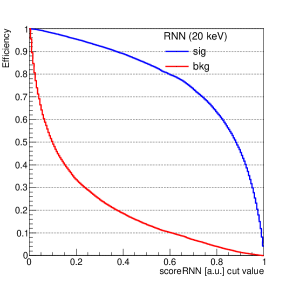
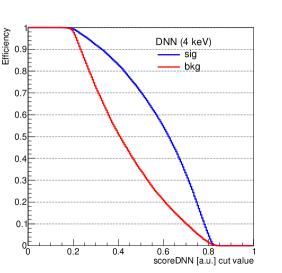
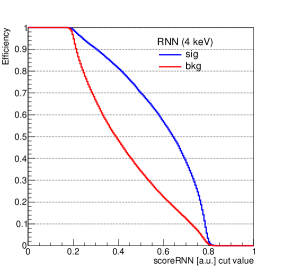
where, is the amplitude at time . The distribution of the mean time (after taking the natural log) is shown in figure 14, while figure 15 shows the corresponding ROC plot. Although, the difference between the AUC values of the mean time and the network is very small, but if we take a look at the variation of the signal and background efficiencies with the value of the discriminating threshold in figures 16 and 17, it can be observed that the signal efficiency remains stable while the background efficiency drops quickly for the networks compared to the mean time. The networks thus, do provide an advantage over mean-time method.
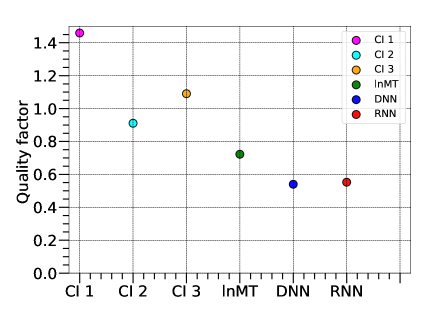
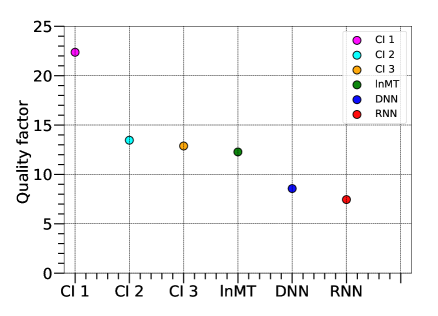
The comparison is also done by calculating another figure-of-merit, the quality factor (QF), which is given by the relation,
| (4) |
where, and are the fraction of signal and background events that satisfy the selection criteria. The best or ideal scenario is when and which gives the value of . The quality factor is calculated at a signal efficiency of 95% i.e. . Figure 18 shows the quality factors calculated for the different methods. The quality factor plots corroborate with the ROC plots that the networks perform better than the conventional methods and also shows that the RNN has an edge over the DNN at low recoil energies.
7 Conclusion
We have demonstrated the efficacy of ML-based algorithms for PSD at low recoil energies. The ML methods were compared with the conventional methods - charge integration and mean time. The comparison was done by calculating the AUC values from the ROC plots. The methods were applied to the same datasets so as to have a fair comparison. The datasets were generated from simulation using GEANT4 and a private PMT simulation code. The simulation results were validated by comparing with experimental data and was done for the two inorganic crystals - BGO and CsI(Tl). The match between the simulation and experiment was reasonably well. In case of CsI(Tl) the simulation gave a narrower photo-peak as compared to experiment. This is expected due to the presence of electronic noise in the experimental data. The performance of the PSD methods were benchmarked using only CsI(Tl) datasets.
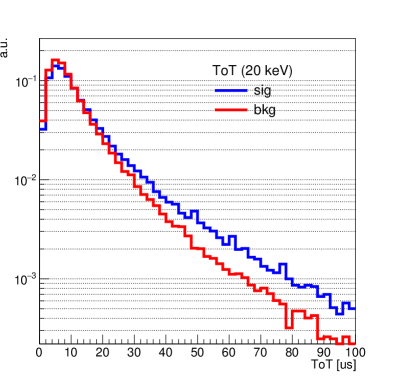
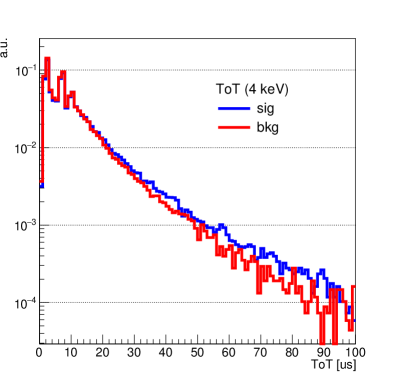
The ML methods showed an improvement compared to the conventional methods in all the cases. We also tried comparing the results with Time-over-Threshold (ToT) method. But at such low energies the distribution of the signal and background were found to overlap and hence, failed to provide any discrimination. The distributions of the ToT-value for signal and background are shown in figure 19.
Two network-based ML methods were analyzed in this paper - Dense Neural Network (DNN) and Recurrent Neural Network (RNN). The RNN, which is more adapted for time-series data, did not show marked improvement when compared with DNN. The AUC and quality factor (QF) values are tabulated in Table 2 which also includes the conventional methods. The best among the three is taken in case of charge integration (CI) method.
| Method | AUC | QF | ||
|---|---|---|---|---|
| 20 keV | 4 keV | 20 keV | 4 keV | |
| CI | 0.0954 | 0.2970 | 0.9108 | 13.46 |
| lnMT | 0.0776 | 0.2813 | 0.7225 | 12.28 |
| DNN | 0.0683 | 0.2683 | 0.5401 | 8.56 |
| RNN | 0.0696 | 0.2649 | 0.5525 | 7.45 |
It can be concluded that ML methods are capable of performing better at very low recoil energies. The next step would be to apply and test the ML methods in a real-world scenario.
References
- [1] S. Yousefi, L. Lucchese and M. Aspinall, Digital discrimination of neutrons and gamma-rays in liquid scintillators using wavelets, Nuclear Instruments and Methods in Physics Research Section A: Accelerators, Spectrometers, Detectors and Associated Equipment 598 (2009) 551.
- [2] M. Alderighi, A. Anzalone, R. Basssini, I. Berceanu, J. Blicharska, C. Boiano et al., Particle identification method in the csi(tl) scintillator used for the chimera 4 detector, Nuclear Instruments and Methods in Physics Research Section A: Accelerators, Spectrometers, Detectors and Associated Equipment 489 (2002) 257.
- [3] S. Longo, J. Roney, C. Cecchi, S. Cunliffe, T. Ferber, H. Hayashii et al., Csi(tl) pulse shape discrimination with the belle ii electromagnetic calorimeter as a novel method to improve particle identification at electron–positron colliders, Nuclear Instruments and Methods in Physics Research Section A: Accelerators, Spectrometers, Detectors and Associated Equipment 982 (2020) 164562.
- [4] H. Park, D. Choi, J. Choi, I. Hahn, M. Hwang, W. Kang et al., Neutron beam test of csi crystal for dark matter search, Nuclear Instruments and Methods in Physics Research Section A: Accelerators, Spectrometers, Detectors and Associated Equipment 491 (2002) 460.
- [5] S. Umehara, T. Kishimoto, M. Nomachi, S. Ajimura, T. Iida, K. Nakajima et al., Search for neutrino-less double beta decay with candles, Physics Procedia 61 (2015) 283.
- [6] S. Ghosh, S. Dutta, N.K. Mondal and S. Saha, Measurements of gamma ray, cosmic muon and residual neutron background fluxes for rare event search experiments at an underground laboratory, Astroparticle Physics 139 (2022) 102700.
- [7] H. Lee, H. Bhang, J. Choi, S. Choi, I. Hahn, E. Jeon et al., Neutron calibration facility with an am-be source for pulse shape discrimination measurement of CsI(tl) crystals, Journal of Instrumentation 9 (2014) P11015.
- [8] Y. Freund and R.E. Schapire, A decision-theoretic generalization of on-line learning and an application to boosting, Journal of Computer and System Sciences 55 (1997) 119.
- [9] I. Goodfellow, Y. Bengio and A. Courville, Deep Learning, MIT Press (2016).
- [10] E. Jumin, N. Zaini, A.N. Ahmed, S. Abdullah, M. Ismail, M. Sherif et al., Machine learning versus linear regression modelling approach for accurate ozone concentrations prediction, Engineering Applications of Computational Fluid Mechanics 14 (2020) 713 [https://doi.org/10.1080/19942060.2020.1758792].
- [11] T. Hastie, R. Tibshirani and J. Friedman, The Elements of Statistical Learning, Springer Series in Statistics, Springer New York Inc., New York, NY, USA (2001).
- [12] A. Krizhevsky, I. Sutskever and G.E. Hinton, Imagenet classification with deep convolutional neural networks, in Advances in Neural Information Processing Systems, F. Pereira, C.J.C. Burges, L. Bottou and K.Q. Weinberger, eds., vol. 25, Curran Associates, Inc., 2012, https://proceedings.neurips.cc/paper/2012/file/c399862d3b9d6b76c8436e924a68c45b-Paper.pdf.
- [13] A.D. Florio, F. Pantaleo and A.C. and, Convolutional neural network for track seed filtering at the CMS high-level trigger, Journal of Physics: Conference Series 1085 (2018) 042040.
- [14] The CMS collaboration, A deep neural network to search for new long-lived particles decaying to jets, Machine Learning: Science and Technology 1 (2020) 035012.
- [15] DUNE collaboration, Neutrino interaction classification with a convolutional neural network in the dune far detector, Phys. Rev. D 102 (2020) 092003.
- [16] A. Aurisano, A. Radovic, D. Rocco, A. Himmel, M. Messier, E. Niner et al., A convolutional neural network neutrino event classifier, Journal of Instrumentation 11 (2016) P09001.
- [17] G. Cowan, Statistical data analysis, Oxford Science Publications (1998).
- [18] K. Hornik, M. Stinchcombe and H. White, Multilayer feedforward networks are universal approximators, Neural Networks 2 (1989) 359.
- [19] C. Shao, A quantum model for multilayer perceptron, 1808.10561.
- [20] D.E. Rumelhart, G.E. Hinton and R.J. Williams, Learning representations by back-propagating errors, Nature 323 (1986) 533.
- [21] N. Srivastava, G. Hinton, A. Krizhevsky, I. Sutskever and R. Salakhutdinov, Dropout: A simple way to prevent neural networks from overfitting, Journal of Machine Learning Research 15 (2014) 1929.
- [22] V. Nair and G.E. Hinton, Rectified linear units improve restricted boltzmann machines, in ICML, 2010.
- [23] S. Hochreiter and J. Schmidhuber, Long Short-Term Memory, Neural Computation 9 (1997) 1735 [https://direct.mit.edu/neco/article-pdf/9/8/1735/813796/neco.1997.9.8.1735.pdf].
- [24] F.A. Gers, J. Schmidhuber and F. Cummins, Learning to Forget: Continual Prediction with LSTM, Neural Computation 12 (2000) 2451 [https://direct.mit.edu/neco/article-pdf/12/10/2451/814643/089976600300015015.pdf].
- [25] Wikipedia contributors, “Long short-term memory — Wikipedia, the free encyclopedia.” https://en.wikipedia.org/w/index.php?title=Long_short-term_memory&oldid=1068745091, 2022.
- [26] S. Agostinelli, J. Allison, K. Amako, J. Apostolakis, H. Araujo, P. Arce et al., Geant4—a simulation toolkit, Nuclear Instruments and Methods in Physics Research Section A: Accelerators, Spectrometers, Detectors and Associated Equipment 506 (2003) 250.
- [27] S. Jan, G. Santin, D. Strul et al., Gate (geant4 application for tomographic emission): a simulation toolkit for pet and spect. to appear in phys, Med. Biol (2004) .
- [28] C. Silva, J.P. da Cunha, A. Pereira, V. Chepel, M.I. Lopes, V. Solovov et al., Reflectance of polytetrafluoroethylene for xenon scintillation light, Journal of Applied Physics 107 (2010) 064902.
- [29] J. Rademacker, An exact formula to describe the amplification process in a photomultiplier tube, Nucl. Instrum. Meth. A 484 (2002) 432 [physics/0406036].
- [30] R. Ogawara and M. Ishikawa, Signal pulse emulation for scintillation detectors using Geant4 Monte Carlo with light tracking simulation, Rev. Sci. Instrum. 87 (2016) 075114.
- [31] H.S. Lee et al., Neutron calibration facility with an Am-Be source for pulse shape discrimination measurement of CsI(Tl) crystals, JINST 9 (2014) P11015 [1409.0948].