Four eccentric mergers increase the evidence that LIGO–Virgo–KAGRA’s binary black holes form dynamically
Abstract
The growing population of compact binary mergers detected with gravitational waves contains multiple events that are challenging to explain through isolated binary evolution. Such events have higher masses than are expected in isolated binaries, component spin-tilt angles that are misaligned, and/or non-negligible orbital eccentricities. We investigate the orbital eccentricities of binary black hole candidates from the third gravitational-wave transient catalogue of the LIGO-Virgo-KAGRA Collaboration with an aligned-spin, moderate-eccentricity waveform model. Within this framework, we find that at least four of these events show significant support for eccentricity at a gravitational-wave frequency of Hz ( credibility, under a log-uniform eccentricity prior that spans the range ). Two of these events are new additions to the population: GW191109 and GW200208_22. If the four eccentric candidates are truly eccentric, our results suggest that densely-populated star clusters may produce 100% of the observed mergers. However, it remains likely that other formation environments with higher yields of eccentric mergers—for example, active galactic nuclei—also contribute. We estimate that we will be able to confidently distinguish which formation channel dominates the eccentric merger rate after detections of events with at LIGO–Virgo sensitivity, with only detectably-eccentric events required to distinguish formation channels with third-generation gravitational-wave detectors.
1 Introduction
The LIGO-Virgo-KAGRA (LVK) collaboration has so far reported 90 gravitational-wave signals of probable ( credible) astrophysical origin (Abbott et al., 2019, 2021b, 2021c, 2021a), all consistent with coming the mergers of a compact binary: a binary black hole (BBH), binary neutron star (BNS) or neutron star–black hole binary (NSBH). The provenance of these compact-object binary mergers is an open question in gravitational-wave astrophysics. In order for an isolated pair of stars to merge as a compact binary on an observable timescale, it must undergo specific evolutionary scenarios. Typically, isolated binaries must harden either through Roche-lobe overflow mass transfer (van den Heuvel et al., 2017; Neijssel et al., 2019; Bavera et al., 2020; Olejak et al., 2021; Gallegos-Garcia et al., 2021) or common-envelope evolution (Livio & Soker, 1988; Bethe & Brown, 1998; Ivanova et al., 2013; Kruckow et al., 2016), or be born with a small enough separation that chemically-homogeneous evolution is possible (e.g., de Mink et al., 2010; de Mink & Mandel, 2016; Marchant et al., 2016). Compact objects can instead be driven to merge rapidly by dynamical interactions, which can happen in populous environments like star clusters (e.g., Rodriguez et al., 2018b, a; Samsing et al., 2018; Fragione et al., 2020).
The different processes that facilitate the merger of a binary leave their signature on the resulting gravitational-wave signal. Multiple studies have shown how the compact-object masses, spins, and orbital eccentricities inferred from the signal may act as identifiers of different formation scenarios, both for individual events and for the contribution of different formation pathways to the entire population (e.g., Vitale et al., 2017; Stevenson et al., 2015; Gerosa & Berti, 2017; Bavera et al., 2020; Mapelli, 2020; Sedda et al., 2020; Zevin et al., 2021b; Fragione et al., 2022). In addition, the redshift evolution of the merger rate should contain distinct contributions from different formation channels (e.g., Mandic et al., 2016; Franciolini et al., 2021), although this will only be resolvable after detections (Fishbach et al., 2018).
Non-zero orbital eccentricity is arguably the most robust signature of dynamical formation.111Lidov-Kozai resonant oscillations can drive up the eccentricity of a merging binary in an isolated triple system (Lidov, 1962; Kozai, 1962; Naoz, 2016; Antonini et al., 2017), but the relative contribution of this channel to the observable eccentric merger rate is thought to be low even if optimistically low black-hole natal kicks and metallicities are assumed (Silsbee & Tremaine, 2017; Rodriguez & Antonini, 2018). A binary undergoing isolated evolution is expected to circularise before its gravitational-wave frequency reaches the start of the LVK frequency band at Hz (Peters, 1964). In contrast, dynamically-induced mergers often merge so rapidly that they retain non-negligible orbital eccentricity at Hz, a quantity that we refer to as . Robust predictions exist for the distribution of binary eccentricities in dense star clusters (e.g., Samsing, 2018; Samsing & Ramirez-Ruiz, 2017; Samsing & D’Orazio, 2018; Zevin et al., 2019; Rodriguez et al., 2018b, a), with of mergers in these environments retaining . Expectations from galactic nuclei and active galactic nuclei (AGN) disks are also becoming clearer, with up to of mergers in AGN disks thought to retain (e.g. Samsing et al., 2020; Tagawa et al., 2021b; Gondán & Kocsis, 2021; Vajpeyi et al., 2021).
Existing detectors are sensitive to eccentricities for BBH mergers (Lower et al., 2018; Romero-Shaw et al., 2019). Signal detection currently depends on achieving a high signal-to-noise ratio when the data are match-filtered using a quasi-circular signal template, so eccentric signals have reduced detectability compared to quasi-circular signals. Roughly half of the of mergers in dense star clusters with are recoverable with such a search (Zevin et al., 2021a). Therefore, accounting for current detector sensitivities and the loss of signal-to-noise power when using quasi-circular templates to search for eccentric signals, we expect to be able to measure the eccentricities of of mergers from dense star clusters. This percentage is an underestimate for the true fraction of detectably-eccentric sources recovered, since it is based on the overlap between eccentric and quasi-circular waveforms with otherwise identical parameters.
Although non-zero orbital eccentricity is one calling card of dynamical formation, the component masses of a compact-object merger may also help to distinguish its origins. While pair-instability supernovae prevent black holes forming between around and M⊙ in isolation (Heger & Woosley, 2002; Belczynski et al., 2016; Marchant et al., 2016; Woosley, 2017; Fishbach & Holz, 2017), dynamical environments can build massive black holes through hierarchical mergers or accretion (e.g., Fishbach et al., 2017; Rodriguez et al., 2019; Gerosa & Berti, 2019; Anagnostou et al., 2020; Kimball et al., 2020; Kremer et al., 2020a; Samsing & Hotokezaka, 2020; Fragione & Silk, 2020; Gerosa & Fishbach, 2021; Banerjee, 2021; Zevin & Holz, 2022). Nonetheless, the uncertain limits and range of the pair-instability mass gap (Sakstein et al., 2020; Belczynski, 2020; Farmer et al., 2019; Woosley & Heger, 2021; Ziegler & Freese, 2021) reduce the efficacy of compact-object mass as an identifier of formation channel.
The spin directions of a binary’s components can indicate its formation mechanism (Farr et al., 2017; Stevenson et al., 2017; Talbot & Thrane, 2017). Isolated binaries are expected to have spins approximately aligned with the binary angular momentum vector (e.g., Campanelli et al., 2006; O’Shaughnessy et al., 2017; Gerosa et al., 2018; Kalogera, 2000), while dynamically-assembled pairs in spherically-symmetric environments should have an isotropic distribution of relative spin tilts (e.g., Rodriguez et al., 2016). However, mergers with aligned spins are not necessarily of isolated origin: gas torques in AGN disks can align component spins (Bogdanović et al., 2007) if the timescale for dynamical interaction is sufficiently long (Liu & Lai, 2017; Tagawa et al., 2020), and dynamically-assembled binaries in open clusters can have aligned spins because few dynamical encounters can occur before merger (Trani et al., 2021).
Black hole spin magnitudes, too, can distinguish binary formation mechanisms. Merger products should develop high spins as they accumulate angular momentum through repeated mergers, so high spin magnitude can indicate dynamical formation (Fishbach et al., 2017; Kimball et al., 2020; Tagawa et al., 2021a), since the spins of black holes that form via stellar collapse are typically expected to be small. However, chemically homogeneous evolution (Marchant et al., 2016; Mandel & de Mink, 2016; Qin et al., 2019), mass transfer and/or tidal locking in tight binaries (Valsecchi et al., 2010; Qin et al., 2019; Neijssel et al., 2021; Izzard et al., 2003; Belczynski et al., 2020; Bavera et al., 2020; Zevin & Bavera, 2022; Broekgaarden et al., 2022), and differential rotation between the stellar core and envelope (Hirschi et al., 2005) can also produce rapidly-spinning black holes.
In addition to those proceeding via isolated evolution or dynamical formation, mergers can also occur between primordial black holes that form through direct collapse of density fluctuations in the early Universe. While primordial black holes can have masses and spins that mimic those of isolated or dynamical black holes, with no upper or lower mass limit and preferentially zero spin (unless spun-up by accretion over the majority of cosmic history), primordial mergers should have zero eccentricity at detection (Green & Kavanagh, 2021; Franciolini et al., 2021). Non-zero orbital eccentricity is also, therefore, a reliable way to rule out the primordial binary hypothesis.
Within the growing population of LVK observations are events that are challenging to explain through isolated stellar evolution. The first event to breach the pair-instability mass gap at confidence was GW190521 (Abbott et al., 2020), which also exhibited signs of spin-induced precession and/or orbital eccentricity greater than at 10 Hz (Romero-Shaw et al., 2020b; Gayathri et al., 2022; Calderón Bustillo et al., 2021; Gamba et al., 2021). A second binary black hole merger, GW190620, also supports a dynamical formation hypothesis, with at credibility (Romero-Shaw et al., 2021a). New events that support the dynamical formation hypothesis have emerged in GWTC-2.1 and GWTC-3. These include additional upper mass-gap events, such as GW190426_19 (Abbott et al., 2021c) and GW200220_06 (Abbott et al., 2021a), and events consistent with having negatively-aligned or substantially misaligned component spins, such as GW191109 and GW200129 (Abbott et al., 2021a; Hannam et al., 2021).222The strength of the support for anti-aligned or misaligned spins in GW200129 and GW191109 is contested by Payne et al. (2022) and Tong et al. in prep., respectively, who show that this support may be highly dependent on the data cleaning methods used. On top of these individual-event clues, population-level hints of dynamical formation come from evidence for hierarchical mergers (Kimball et al., 2021) and the mass-gap-encroaching shape of the inferred mass distribution. Hints of misaligned spins (negative effective spin parameter ) have been claimed at the population level (Abbott et al., 2021d); some follow-up studies show that the population is consistent with the majority of binaries having non-zero and misaligned component spins, while others argue that the population is consistent with a majority of binaries having and only a small subset having significant positive (Roulet et al., 2021; Galaudage et al., 2021).
Eccentricity is not included in the gravitational-waveform models used by the LVK to produce the inferences reported in their catalogues, because incorporating the effects of eccentricity makes physically-accurate waveform models too slow for conventional inference methods. In Romero-Shaw et al. (2019, 2020a, 2020b, 2021a), we used an efficient reweighting method to obtain measurements of the orbital eccentricity of gravitational-wave sources up to and including the second LVK gravitational-wave transient catalogue, GWTC-2. In this work, we use the same method to analyse additional binary black hole candidates from the most recent updates to the catalogue of LVK events: GWTC-2.1 (Abbott et al., 2021c) and GWTC-3 (Abbott et al., 2021a). Our results come with important caveats: we cannot distinguish eccentricity from spin-induced precession, our analysis does not include higher-order modes, and we are limited to studying moderate eccentricities () and restricted spins (). The limitations of our method are explained in detail in Section 2. Within our analysis framework, we report an additional two binaries with significant support for ( credibility), adding to the building circumstantial evidence for a dynamically-formed subset within the observed mergers.
This paper is structured as follows. In Section 2 we describe our methodology, and note its limitations. In Section 3 we present results from our analysis of new events from GWTC-2.1 and GWTC-3, taking the total number of BBH candidates investigated for signatures of eccentricity to . Two events, GW191109 and GW200208_22, have of their posterior support at and have inconclusive but positive ln Bayes factors in favour of the eccentric hypothesis, with ln , where we use the convention that ln constitutes “strong” evidence. We present analyses of eccentricity at the population level in Section 4, and demonstrate that detectably-eccentric mergers are required to confidently distinguish different dynamical formation scenarios at current detector sensitivity. In Section 5, we conclude with some final thoughts. Results for events with negligible eccentricity are provided in Appendix A.
2 Method
We use a reweighting method (see Payne et al., 2019; Romero-Shaw et al., 2019) to efficiently calculate posterior probability distributions using the aligned-spin eccentric waveform model SEOBNRE (Cao & Han, 2017). First, we run an importance-sampling step, performing Bayesian inference using bilby and the bilby_pipe pipeline (Ashton et al., 2019; Romero-Shaw et al., 2020c). We run five parallel analyses with unique seeds for each event with the dynesty sampler (Speagle, 2019), utilising spin-aligned quasi-circular model IMRPhenomD (Khan et al., 2016) as the ‘proposal’ model. For these initial analyses, we use live points, walks and auto-correlation times. For follow-up analyses on eccentric candidates, we use live points and walks. We use a sampling rate of Hz and a reference frequency of Hz for every event. We analyse publicly-available data from GWTC-2.1 and GWTC-3 (Abbott et al., 2021c, a, a, b) and use detector noise curves generated using BayesWave (Cornish & Littenberg, 2015; Littenberg & Cornish, 2015).
We reweight the proposal samples obtained in the initial step to our ‘target’ model: SEOBNRE, a spin-aligned eccentric waveform approximant containing the inspiral, merger and ringdown sections of the signal. Since this is a time-domain model, we use a Fourier transform to obtain frequency-domain waveforms for use in the likelihood, softening the abrupt start of the time-domain inspiral using a half-Tukey window to avoid spectral leakage.
We use standard priors on right ascension , declination , source inclination , polarisation , coalescence phase and geocent time . Our prior on mass ratio is uniform between and , and our priors on the aligned component spin magnitudes , are capped at the SEOBNRE maximum of . We use uniform priors on chirp mass and priors on luminosity distance that are uniform in the source frame. When reconstructing the eccentricity distribution with SEOBNRE, we employ a log-uniform prior on eccentricity, which covers the range . We marginalise over phase and coalescence time to mitigate definitional differences between the two models.
Including all events in GWTC-3, we report results for BBH candidates in total. In this work, we present analyses of events added to the catalogue in GWTC-2.1 and GWTC-3; for analyses of events added to the catalogue in earlier LVK publications using the same method as used here, see Romero-Shaw et al. (2019) and Romero-Shaw et al. (2021a). We reserve detailed analyses of other events, including binaries that contain neutron stars, for future work.333BNS mergers have so far been found to be consistent with quasi-circularity (Romero-Shaw et al., 2020a; Lenon et al., 2020). The events that we do not discuss in this work are:
-
•
Events for which the reweighting process failed to achieve an adequate effective sample size. The number of effective samples in a posterior distribution after reweighting is
(1) We deem any events with undersampled, and do not include them in this work. Potential causes of undersampling are explored in Appendix B.
-
•
Binaries likely to contain at least one neutron star. These include those confidently designated as binary neutron stars (BNS; GW170817, GW190425), neutron star–black hole (NSBH) binaries (GW191219, GW200105, GW200115), and events with secondaries of ambiguous mass that may be black holes or neutron stars (GW190814, GW190917, GW200210). We neglect BNS and likely NSBH events from the analysis presented in the main body of this paper because their formation mechanisms may be drastically different from those of BBH mergers, and we wish to make statements about the formation channels that produce the BBH mergers in our population. When studied with the reweighting method, we find that GW190814A fails to achieve a high reweighting efficiency; this is expected, since higher-order modes are known to be present in this signal, and both models used in this work incorporate only the mode (Abbott et al., 2020). GW190412, which is thought to be a unequal-mass black hole binary with mass ratio , also has higher-order mode content, and also ends up undersampled. We do not provide posterior probability distributions for GW190917 and GW200210, despite their adequate sample size after reweighting; their mass ratio posteriors rail against the lower mass ratio prior limits, implying that the true probability distribution extends below the lowest value of mass ratio contained within the prior, and the eccentricity distribution inferred for both events is uninformative. We leave eccentric analyses of systems containing low-mass black holes or neutron stars for future work.
2.1 Caveats
Our analysis method leads our results to have the following caveats:
-
1.
Since the waveform model that we employ, SEOBNRE, does not support misaligned spins, we are not able to disentangle the effects of orbital eccentricity and spin-induced precession on the signal. This may lead us to infer non-zero eccentricity for a quasi-circular system undergoing spin-precession; see Romero-Shaw et al. (2020b).
-
2.
SEOBNRE enforces a dimensionless aligned-spin magnitude upper limit of . Any binary that is truly highly-spinning will produce a signal that is poorly-specified by our choice of waveform model, and will therefore bias our results.
-
3.
Similarly, the upper limit of our eccentricity prior is at a detector-frame gravitational-wave frequency of Hz. Any binary with an eccentricity higher than this will not be correctly specified by our choice of waveform model. However, we have seen in the case of GW190521 that systems consistent with larger eccentricities (Calderón Bustillo et al., 2020; Gayathri et al., 2022; Gamba et al., 2021) can still show signs of high eccentricity in our analyses, railing against the model-enforced upper limit of the prior (see, e.g., Romero-Shaw et al., 2020b). Such railing, in which the peak of the posterior distribution is seen to “pile up“ at the prior boundary, implies that the truly most probable region of the parameter space likely exists outside the range covered by the prior.
-
4.
Waveforms produced with IMRPhenomD and SEOBNRE do not contain higher harmonics, which may mislead inference when higher harmonics are present in the data. Neglecting higher-order modes can bias recovery of parameters like spins and mass ratios (Shaik et al., 2020), so we expect that inferences of eccentricity would also be biased. Although there are no tailored studies to assess the eccentricity bias when higher-order modes are neglected, quasi-circular and spin-precessing waveform templates with higher-order modes may be more likely mistaken for eccentric waveforms than those without higher-order modes (Romero-Shaw et al., 2020b). Recent analyses including both eccentricity and higher-order modes (Iglesias et al., 2022) obtain qualitatively consistent results to previous analyses neglecting higher-order modes.
-
5.
SEOBNRE sets the initial argument of periapsis based on the fixed starting frequency of waveform generation. This parameter is therefore not adjustable and cannot be sampled over. We anticipate that being able to sample over this parameter could lead to a shift in the locations of the peaks of the recovered eccentricity distributions in events with high signal-to-noise ratio (SNR ), but the consequences of neglecting this parameter for the events studied here are likely to be small (Clarke et al., 2022).
-
6.
Different waveform models and simulations use different definitions of eccentricity, and use different prescriptions to set initial conditions. This means that an eccentricity inferred with SEOBNRE does not exactly equate to the eccentricity that would be inferred with another model, and that comparisons to predictions made by simulations of dynamical environments should be taken as indicative rather than absolute. Work is ongoing to establish a translation guide between the eccentricities defined by various simulations (Knee et al., 2022).
-
7.
We restrict our analyses to events that have been flagged as likely compact binary merger signals by LVK searches. In order to be flagged as such, a signal must bear significant resemblance to a quasi-circular inspiral track so that it achieves a high match with the waveforms used in those templated searches. As a result, the events we analyse are highly likely to have small or negligible eccentricities.
3 Eccentricity measurements

| Event name | (%) | (%) | |||
|---|---|---|---|---|---|
| GW190403 | |||||
| GW190805 | |||||
| GW191105 | |||||
| GW191109 | |||||
| GW191126 | |||||
| GW191127 | |||||
| GW200208_22 | |||||
| GW200209 | |||||
| GW200216 | |||||
| GW200322 |

In Figure 1, we provide marginal one-dimensional eccentricity posterior distributions for BBH candidates. We note that we have removed two events that were found to have below-threshold significance in GWTC-2.1 (GW190924A and GW190909A; Abbott et al., 2021c), from this plot and from all analyses presented in Section 4. In Table 1, we provide numerical summaries of the eccentricity measurements for newly-analysed events in GWTC-3, including ln Bayes factors for the detectably-eccentric region of the parameter space relative to the quasi-circular hypothesis. To calculate these values, we restrict the eccentricity posteriors to , the minimum expected detectable eccentricity (Lower et al., 2018), and , since this is an often-used conservative threshold for detectable eccentricity resulting from dynamical binary formation (e.g., Wen, 2003; Gondán et al., 2018; Samsing et al., 2018; Rodriguez et al., 2018b, a; Gondán & Kocsis, 2021). We restrict the eccentricity prior to astrophysically-motivated ranges for these Bayes-factor calculations to avoid contamination from quasi-circular samples, which do not represent the eccentric hypothesis. We present in Figure 2 marginal posteriors on log for the ten newly-analysed events in GWTC-3 that have positive ln Bayes factors in favour of the eccentric hypothesis when compared to the quasi-circular hypothesis. We adopt the convention that a “detection” of eccentricity is not made unless ln , so do not claim that any of these events definitively prefer the eccentric model over the quasi-circular model. Posterior probability distributions on all parameters of all analysed events are provided online.444github.com/IsobelMarguarethe/eccentric-GWTC-3
3.1 New events in GWTC-3 with majority posterior support for

There are two new events that show significant evidence for eccentricities above within their posterior probability distributions, with of their posterior probability support above . For these events, and for the two eccentric candidates GW190521 and GW190620 (Romero-Shaw et al., 2020b, 2021a), we conduct our analysis with more aggressive sampler settings (4000 live points and 200 walks) to obtain a higher number of effective samples. These results are those shown in Fig. 1 and all other figures, and in Table 1. The waveforms corresponding to the median posterior parameters for GW190521, GW190620, GW191109 and GW200208 are shown in Fig. 3.
3.1.1 GW191109

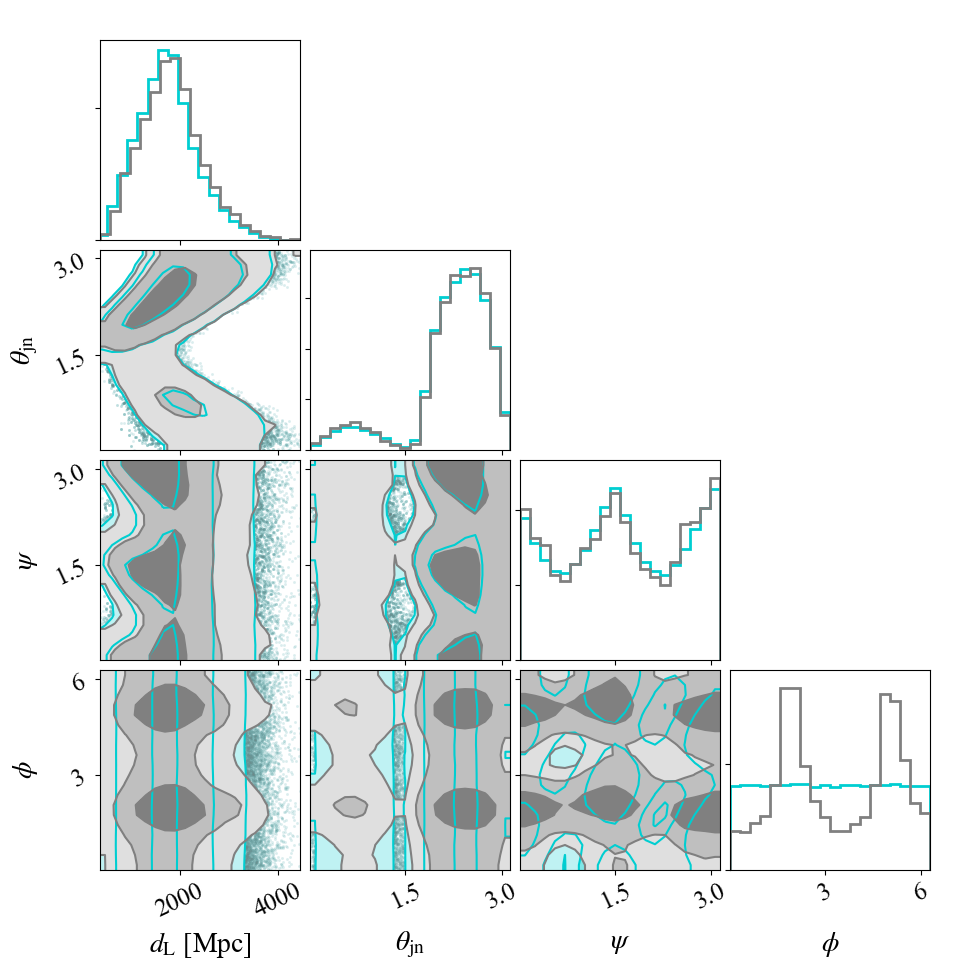
GW191109 was found by the LVK analysis to have the highest support for negative spin of all new GWTC-3 events. Our initial quasi-circular analysis recovers this preference for negatively-aligned spins, but when we reweight to the eccentric posterior, higher spin magnitudes have lower weights. This is similar to the reweighting behaviour observed for eccentric candidate GW190620 (Romero-Shaw et al., 2021a), although we retain some appreciable deviation from the spin prior for after reweighting for GW191109. Other parameters are consistent with those recovered in the LVK analysis. Proposal (quasi-circular) posteriors for GW191109 are shown in Fig. 4 in teal, and target (eccentric) posteriors are overplotted in grey.
We find that GW191109 has % of its posterior support above , % of its posterior above , and a ln Bayes factor of ln () in favour of the () hypothesis relative to the quasi-circular hypothesis. For this event, we obtain a reweighting efficiency of , and obtain . Visible in Figure 1 is the double-peaked structure of the eccentricity posterior for GW191109: the main peak is at the upper limit of the eccentricity prior, , but there is a subdominant mode at .
The eccentric (target) posterior distribution on the phase of coalescence, , for GW191109 has periodic peaks that are not present in the quasi-circular (proposal) posterior distribution. Since GW191109 is relatively high-mass, its measurement gives the shape of its orbit just a few cycles before the coalescence itself. Having distinctly non-zero orbital eccentricity at this point means that the orbit close-to-merger is elongated, so the gravitational-wave emission varies more strongly with . Additionally, is likely to closely correlate with the argument of periapsis, ; while describes the phase of the orbit, describes the angle of rotation of the orbit itself. Since is set indirectly through the reference frequency and eccentricity in our analyses, the narrow range of and fixed may restrict enough that only certain values of can produce waveforms consistent with the data.
3.1.2 GW200208_22

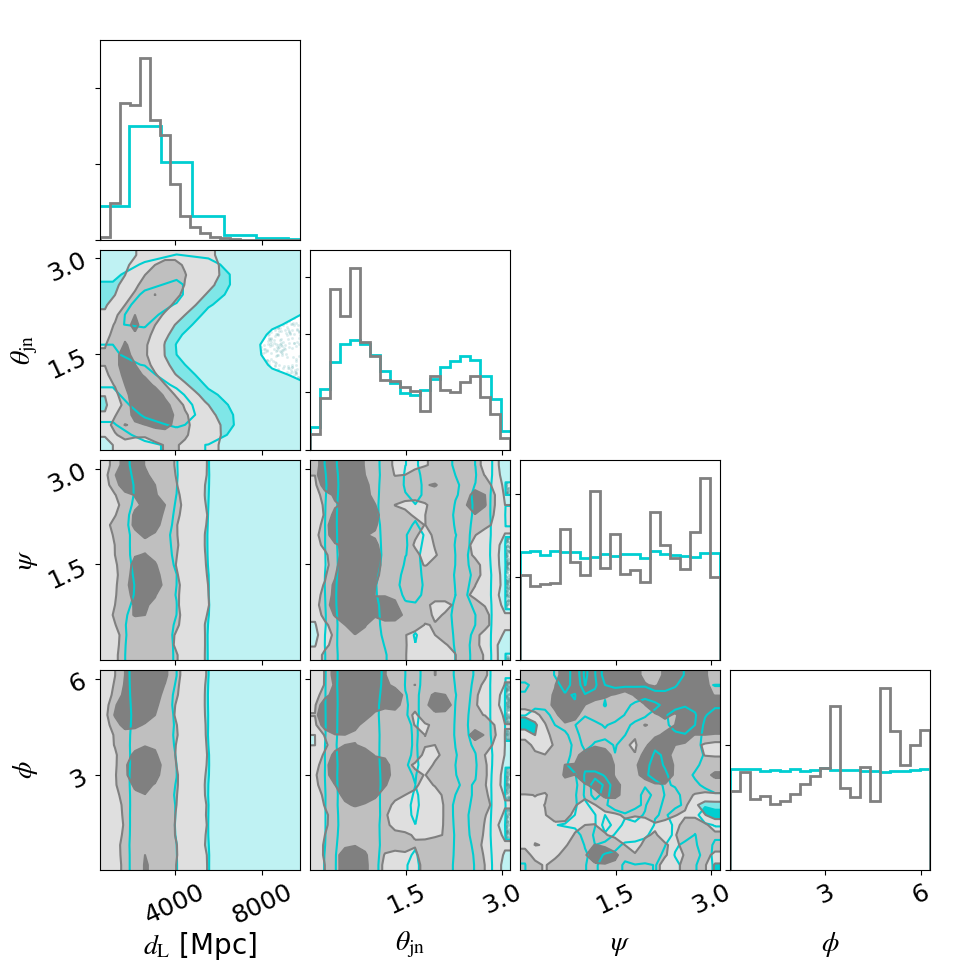
We find that, when analysed with our default sampling settings, the mass ratio posterior for GW200208_22 rails against the lower limit of the prior, indicating that the lower limit is too high to capture the full extent of the posterior. Therefore, for this event, we reduce the lower mass ratio prior limit from 0.125 to 0.025. We notice also that the posterior rails against the upper limits of and at , implying that the true distribution extends above the upper limits allowed by the prior. However, since this is a limit enforced by SEOBNRE, we do not relax this limit. In Fig. 5, we show proposal (quasi-circular) posteriors for GW200208_22 in teal and target (eccentric) posteriors in grey.
We find that GW200208_22 has % of its posterior support above , with % above , and ln Bayes factor for () relative to the quasi-circular hypothesis of (). In our analysis, GW200208_22 has a a source-frame chirp mass of M⊙. The reweighting efficiency for GW200208_22 is relatively low at %, consistent with our expectations for low-chirp mass (long-duration) eccentric signals. Additionally, waveform model choice been shown to be important for this event (Abbott et al., 2021a), so posterior differences that are not correlated with eccentricity may be a result of waveform systematics. We obtain effective samples for this event.
Our posteriors peak at a lower total mass ( M⊙) than that found in the LVK analysis ( M⊙), although the posteriors do overlap: while the LVK posteriors and our IMRPhenomD posteriors are multimodal, the eccentric posterior favours the lower-mass peak. The median primary mass recovered with the eccentric model ( M⊙) is significantly lighter than the median of the LVK analysis ( M⊙), for the same reason. As a result, the median luminosity distance recovered is roughly Gpc smaller than the median LVK result. It is possible for eccentric systems to masquerade as higher-mass quasi-circular systems when their gravitational-wave signals are analysed assuming quasi-circularity, since eccentricity can drive a binary to merge on a faster timescale and merge at a lower frequency (see, e.g., Calderón Bustillo et al., 2020; Favata et al., 2022). In addition to the inclusion of eccentricity, another reason for the discrepancy in median posterior parameters may be our enforced limit on the spin prior magnitude due to the limitations of SEOBNRE: while the LVK analysis finds that ( credibility) with of its posterior support above , we infer a posterior that rails against the upper limit of the prior at .
As in the LVK analysis, the mass ratio posterior recovered with IMRPhenomD is quite flat, with a slight preference for unequal masses (). When we reweight to SEOBNRE, the long tail out to high masses is downweighted and only the peak at chirp mass M⊙ remains. More equal mass ratios are favoured by the eccentric model over unequal masses. Higher values of and are also downweighted, with the eccentric model preferring samples with high values of eccentricity and low values of spin. Again, the reason for the difference may be the enforced spin prior limitation. It is possible that the data is best-fit by a waveform with and , but prefers a waveform with and to one with . In this case, because of our restricted prior, the vast majority of the eccentric posterior is at high eccentricities with low spins. Previous analyses have show that, when spin amplitude is restricted, higher eccentricities may be favoured (see O’Shea & Kumar, 2021)
3.2 Other new events in GWTC-3 with non-negligible support for
Another two candidates from O3b, GW191126 and GW191127, have of their posterior support at and ln . Their marginal eccentricity posterior distributions show peaks at our prior upper limit of and non-negligible tails down to lower eccentricities. While we also analyse these event with more aggressive sampler settings, we do not discuss these events in detail here; we reserve a detailed analysis of these events, in conjunction with the marginal eccentric candidates presented in Romero-Shaw et al. (2021a), for future work.
3.3 Notable new events in GWTC-3 with
3.3.1 Mass-gap events
GW190426_19 has the highest mass of all binary mergers reported by the LVK, with both components more massive than predicted by isolated evolution: M⊙, M⊙ (Abbott et al., 2021c). Our analysis of GW190426_19 recovers parameters consistent with those recovered in the LVK analysis, including the slight deviation from the prior at higher values of . Another high-mass event, GW200220_06, is found by the LVK to have mass-gap components: M⊙, M⊙ (Abbott et al., 2021a), consistent with our findings. We find that GW190426_19 and GW200220_06 do not contain hints of orbital eccentricity.
GW190426_19 and GW200220_06 have high reweighting efficiencies of and respectively, with and of their posterior support above . Reweighting to SEOBNRE pushes the preferred mass-ratio and source-frame chirp mass to slightly lower values for GW190426B, but this shift does not appear correlated with eccentricity; we put the difference down to waveform systematics. There is virtually no difference between the quasi-circular and eccentric posteriors for GW200220_06.
Being consistent with quasi-circular at Hz does not mean that these binaries are not dynamically formed: we expect only of our detected mergers from globular clusters to retain detectable eccentricity at this frequency (Zevin et al., 2021a), and more massive mergers circularise at lower frequencies than their lower-mass counterparts. It is nonetheless worth noting that the eccentricity, spin magnitude, and spin-tilt measurements for these systems are inconclusive. If they contained merger remnants, which became bound through dynamical interactions, their dimensionless spin magnitudes should be , and their spin tilt angles would likely be misaligned (e.g., Pretorius, 2005; González et al., 2007; Buonanno et al., 2008). Alternatively, such massive binaries may form in isolation if the pair-instability mass gap is narrower than predicted (as suggested in the wake of GW190521 by, e.g., Costa et al., 2021), or if our standard priors on mass ratio are misleading inference (also suggested to explain GW190521 by Fishbach & Holz, 2020).
3.3.2 Spinning events
A number of the events that strongly support nonzero spins are undersampled after the reweighting process: GW200129, which exhibits support for signs of spin-induced precession, GW191204, which has a posterior tightly constrained away from zero, and GW191216, which has negligible support for (Abbott et al., 2021a). However, some are adequately-sampled: GW191103, for example, which has samples after reweighting. The marginal eccentricity posterior for this event is uninformative, and correlated with spin: lower magnitudes of are favoured for samples with . The eccentric reweighting process disfavours larger values of , while the marginal posterior is relatively unchanged. GW191103A has only of its posterior support above after reweighting.
3.4 Spin-induced precession or eccentricity?
There are currently no waveform models that incorporate the simultaneous effects of eccentricity and spin-induced precession on the signal. Since the two effects can cause similar phase and amplitude modulations in gravitational-wave signals (e.g., Calderón Bustillo et al., 2020), they can cause spin-aligned analyses to recover eccentricity, or quasi-circular analyses to recover misaligned spins (Calderón Bustillo et al., 2021; Romero-Shaw et al., 2020b). Therefore, any non-zero eccentricity measurements that we infer in our analysis may, in actuality, be caused by the binary having misaligned spins.
Whilst we cannot simultaneously infer the presence of spin-induced precession and eccentricity, we can attempt to deduce which effect is more likely to be present in the signal. We perform analyses on GW190521, GW190620, GW191109 and GW200208_22 using a precessing waveform approximant; see Romero-Shaw et al. (2020b) for an extensive comparison between the eccentric and spin-precessing hypotheses for GW190521. For the study presented here, we employ one of the preferred waveforms used in the transient catalogue of the LVK (Abbott et al., 2021b, c, a): quasi-circular spin-precessing model IMRPhenomXPHM (Pratten et al., 2021), allowing the full range of available spin orientations in our priors and component spin magnitudes up to , and using the same aggressive sampler settings as employed for our follow-up analyses using SEOBNRE.
| Event | ln | ln |
|---|---|---|
| GW190521 | 3.06 | 2.30 |
| GW190620 | 2.52 | 2.10 |
| GW191109 | -1.74 | -2.14 |
| GW200208_22 | 1.51 | 0.96 |
Table 2 contains the relative natural log (ln) Bayes factors of the spin-aligned, eccentric hypothesis (calculated from our SEOBNRE posteriors above thresholds of and ) against the quasi-circular, spin-precessing hypothesis (caculated from our IMRPhenomXPHM posteriors) for GW190521, GW190620, GW191109 and GW200208_22. There is a marginal preference for the eccentric hypothesis for GW190521, GW190620, and GW200208_22, and a marginal preference for the spin-precessing hypothesis for GW191109; however, in no case is the evidence for either hypothesis overwhelming. Thus, each one of our potentially-eccentric candidates could be eccentric, spin-precessing, or both.
4 Eccentricity in the population

As the catalogue of mergers grows, it becomes increasingly likely that random noise fluctuations emulate the effects of eccentricity in a subset of BBH merger signals. Additionally, while we highlight four events that have clear peaks above in their eccentricity posterior probability distributions, there are multiple other events that show significant support for . We wish to quantify the fraction of observed mergers that truly support the eccentric merger hypothesis, without assuming any specific formation channel. We perform population analyses under the hypothesis that some binaries have some support for eccentricity above some threshold eccentricity, . We consider two possibilities: that and that any eccentricity lower than this is not detectable; and a more conservative hypothesis with . We calculate a likelihood for , the fraction of the population support for :
| (2) |
Here, represents each event in our population, and are our eccentricity prior bounds, and is the marginal posterior probability distribution for the eccentricity of event . Drawing proposals for the value of from a uniform prior and computing over this range produces a posterior probability distribution for . This posterior is plotted in Figure 6 for both conditions.
The highest-probability representing the fraction of observed BBH with is , corresponding to mergers, while the maximum-posterior for BBH observed with is , corresponding to mergers. We can exclude with greater than credibility in both cases. We therefore conclude that the population support for eccentricity in GWTC-3 is consistent with a non-negligible fraction of mergers exhibiting detectable eccentricity at Hz.
The fact that we include only the adequately-sampled events in the calculation of may bias our results. Reweighting can fail to produce sufficient samples if the target (eccentric) posterior probability distribution exists in a region of the parameter space not well-covered by the proposal (quasi-circular) posterior. For example, injection studies (O’Shea & Kumar, 2021) show that a quasi-circular waveform used to recover an eccentric signal can result in a posterior distribution that does not contain the injected mass parameters. In such a case, an analysis reliant on likelihood reweighting is likely to either be undersampled or return an eccentricity posterior distribution consistent with zero eccentricity.
Because we use a reweighting-based method and neglect undersampled events—both of which bias us towards detecting more events consistent with quasi-circularity—our estimates of can be considered as lower limits when we assume that none of the events are spin-precessing. On the other hand, if the potential degeneracy between eccentricity and precession (e.g., Romero-Shaw et al., 2020b; Calderón Bustillo et al., 2020) is leading quasi-circular systems to be interpreted as eccentric by our analysis, then our inferred values of may be artificially high. More accurate estimates of require studies to determine exactly which regions of the parameter space undersampling and eccentricity-precession degeneracy are most prevalent, and are left for future work.
4.1 Implications for population formation channels
Simulations suggest that – of BBH mergers in dense star clusters should enter the LVK sensitivity band with (see, e.g., Samsing, 2018; Samsing et al., 2018; Zevin et al., 2019; Rodriguez et al., 2018b, a, 2019; Kremer et al., 2020b). As noted above, Zevin et al. (2021a) showed that, from a simulated population of mergers from the CMC Cluster Catalog (Kremer et al., 2020b), only of globular cluster mergers could be detected with , assuming a templated search using quasi-circular waveforms with otherwise identical parameters to the injected eccentric signals. Under this assumption, we expect to detect only of sources with , since gravitational-wave signals from compact binary mergers are detected using search methods that assume quasi-circular inspirals. This fraction may be higher, if eccentric signals achieve maximum SNR against quasi-circular templates with different source parameters (as suggested by the results of, e.g., O’Shea & Kumar (2021)). However, if the parameters preferred by the quasi-circular model are totally removed from the true quasi-circular parameters, then the eccentricity posterior obtained through the reweighting method is unlikely to both recover a high eccentricity and be well-sampled; therefore, we use as our expected eccentric fraction. The predictions in Zevin et al. (2021a) were obtained using a different eccentric waveform model, TEOBResumS (Nagar et al., 2018); for an overview of key differences between TEOBResumS and SEOBNRE, see Knee et al. (2022). Since the overlap between SEOBNRE and TEOBResumS is in LVK noise over the eccentricity range studied here (Knee et al., 2022), we assume in this paper that the results of Zevin et al. (2021a) are robust to waveform choice. However, we caution that this may not be the case; a repeated study using SEOBNRE is required to obtain waveform model-specific predictions. We reserve this for future work, and note that our distributions for based on predictions using the alternative waveform model are therefore approximate.
4.1.1 Comparing detector-frame eccentricity measurements to simulation predictions
Eccentricity distributions obtained from simulations of dense star clusters are naturally quoted at a reference frequency of Hz in the source frame, while we measure eccentricity at a reference frequency of Hz in the detector frame. Since redshifting pushes detector-frame frequencies lower than their source-frame origins, this means that the lower limits that we report for possibly eccentric events are overly conservative for binaries in the source frame. On the flip side, upper limits reported for non-eccentric events are less conservative for source-frame binaries. We convert measurements of eccentricity into the source frame by establishing the source-frame frequency corresponding to a detector-frame frequency of Hz: Hz. We then back-evolve from Hz to Hz using Peter’s equations (Peters, 1964).
An additional complication comes from conflicting definitions of the reference frequency at which eccentricity is quoted. The reference frequency of the SEOBNRE model, , is defined relative to a closed Keplerian orbit, with a semi-major axis that changes as the binary inspirals. Meanwhile, simulations of cluster mergers report eccentricities defined at the peak frequency of gravitational-wave emission, . Within SEOBNRE, an eccentric correction is applied such that the minimum frequency of gravitational-wave content is . This means that at Hz, the maximum difference between and is Hz (for ). We start analysis for most events from Hz, with the exception of GW190521, which we start from Hz. Therefore, this internal eccentric correction does not cause the waveform to start within our analysis band. However, our reported measurements are not directly comparable to the predictions of globular cluster simulations, since (Wen, 2003)
| (3) |
The maximal difference between and is therefore Hz (for ).
We convert from an eccentricity distribution defined at Hz in the detector frame to its equivalent at Hz in the source frame using Eq. 3 and Peter’s equations (Peters, 1964). We caution that these results be taken as indicative rather than exact measurements: evolving back to Hz pushes to lower frequencies. Therefore, we are implicitly assuming that the inspiral of the system was unperturbed at lower frequencies, corresponding to earlier times.
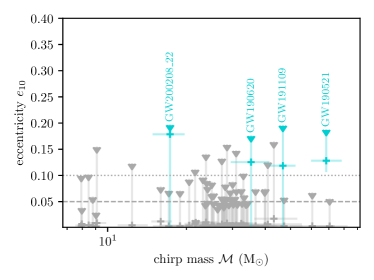
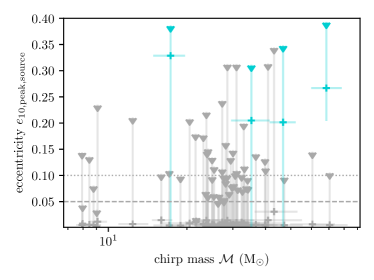
In the left-hand panel of Fig. 7, we plot measured median and upper credible intervals on eccentricity at Hz in the detector frame, , against source-frame chirp mass of the 62 BBH analysed in this work. On the right-hand side, we plot median and upper credible intervals for , the eccentricity at a peak gravitational-wave frequency of Hz in the source frame, following the conversions described above. The number of binaries with is the same as that with detector-frame eccentricity at Hz Keplerian frequency : we find four binaries above this threshold in both cases.

4.1.2 Constraining the fractional contribution of mergers formed in dense star clusters
We can now use the fraction of binaries detected with to constrain the fractional presence of mergers produced in dense star clusters within the population. Consistent with Zevin et al. (2021a), we call this the branching fraction, In Fig. 8, we plot in teal the likelihood on calculated following Zevin et al. (2021a), which treats the number of eccentric mergers in the observed population as a Poisson counting problem. The likelihood for detecting four eccentric binaries within 62 mergers is represented by the teal curve, with the grey shaded rectangle indicating the region in which the prior probability goes to zero ().
Since we still have a small population and many uncertainties from both our method and our theoretical models, we cannot constrain very tightly or confidently at this stage. Since we require that the eccentric posterior probability distribution overlaps enough with the quasi-circular posterior probability distribution in order to retain a sufficient sample size after reweighting, we are biased towards detecting low- or negligible-eccentricity sources; high-eccentricity () sources may be mistaken for quasi-circular mergers if they are not undersampled. Therefore, we may be under-reporting the true number of eccentric mergers in the set of adequately-sampled events we consider. Conversely, spin effects can mislead inferences of eccentricity (e.g., Calderón Bustillo et al., 2020; Romero-Shaw et al., 2020b; O’Shea & Kumar, 2021); the signals that we infer to show the fingerprints of eccentricity may in fact be due to spin-induced precession. If four of our eccentric candidates are truly eccentric, and if all eccentric mergers are formed within globular clusters, then globular clusters must contribute at least of observed mergers, at credibility (to calculate this we use the posterior, i.e., we ignore parts of the likelihood greater than one).
4.2 A population model for the eccentricity distribution

There are multiple pathways that can lead to BBH mergers with detectable eccentricity in the LIGO-Virgo sensitivity band. As the population grows, it may be possible to distinguish mergers from these different channels by studying the shape of the population eccentricity distribution. In Figure 9, we illustrate a simplified population model containing three mechanisms that may produce eccentric mergers with distinct eccentricity distributions: mergers facilitated by interactions within globular cluster mergers (GCS), binary mergers occurring within field triples (TRIPLES), and mergers inside active galactic nuclei (AGN). These populations are represented as follows:
-
•
GCS: We represent the distribution shown in Figure 1 of. Zevin et al. (2021a) using a Gaussian mixture model containing four Gaussians in log at with widths . These peaks, respectively, correspond to: mergers that form in clusters and are ejected before they merge; mergers that occur after dynamical interactions within clusters; gravitational-wave capture mergers; and gravitational-wave capture mergers that become bound within the LVK band, merging with eccentricities close to unity.
-
•
TRIPLES: Binaries can be driven to merge rapidly in isolation if gravitational energy is removed from their orbit by a third object with which they are bound. In some cases, the eccentricity of these binaries can be amplified through Lidov-Kozai oscillations (e.g., Lidov, 1962; Kozai, 1962). Following Lower et al. (2018) and references therein, we model the primary component expected eccentricity distribution from field triples as a single Gaussian in log centred at with width for simplicity. We ignore the small higher-eccentricity peak expected for of field triples since the contribution from this channel is expected to be small (e.g., Silsbee & Tremaine, 2017; Rodriguez & Antonini, 2018), and we include it in our model for illustrative purposes only (we do not include it in our toy-population-model analyses).
-
•
AGN: In the dense centre and accretion disk of an active galactic nucleus, binaries can be driven to merge through dynamical interactions. The eccentricity distribution of dynamical mergers inside AGN differs from that expected in globular clusters because the central gravitational potential of the nucleus is greater, and various interactions can also occur within the accretion disk. The distribution expected from AGN is highly uncertain and depends greatly on the properties of the AGN. With reference to Samsing et al. (2020) (see the right-hand panel of their Figure 5 in particular), we represent the contribution from AGN as a Gaussian in log centred at and . We recognise this as a greatly simplified model, and present this as a proof-of-concept that can be extended to include more complete distributions predicted by complex AGN models.

Inferring the formation mechanisms of binaries should incorporate contributions from multiple different channels, likely many more than are represented in our simple model. For the sake of this proof-of-principle demonstration, we generate populations of events from the GCs channel only, approximating each event’s eccentricity posterior probability distribution as a delta function. Since our eccentricity measurements typically have broader posteriors than a delta function, the result of this simple demonstration should be taken as a lower limit. We generate populations ranging in size from to events, and recover the population distribution using the hyper submodule of bilby (Ashton et al., 2019; Romero-Shaw et al., 2020c). We obtain ln Bayes factors, ln , for the strength of the GC hypothesis relative to the AGN hypothesis, taking ln as a “confident” preference for the GC hypothesis. We study only the range of eccentricities that is accessible to each era of detector:
-
•
LVK sensitivity limit: Although sensitivity to eccentricity varies slightly with mass (see Appendix C of Romero-Shaw et al. (2021a)), we take as the range within which existing detectors can measure eccentricity. This is consistent with our own measurements, as well as the predictions of Lower et al. (2018).
-
•
Einstein Telescope / Cosmic Explorer sensitivity limit: We use samples from the range of eccentricities to which the Einstein Telescope (ET) and Cosmic Explorer (CE) are expected to be sensitivity; this is approximately (Lower et al., 2018).
For each and for each sensitivity threshold, we perform parameter estimation on mock populations. We plot our results in Figure 10, where the average ln for each obtained is marked with a diamond. We find that we will be able to confidently distinguish a BBH merger population dominated by those formed in GCs from one in which mergers form in AGN with detectably-eccentric events. This is a lower limit, since real detections have non-negligible uncertainties. Additionally, it will be trickier to disentangle the contributions of multiple channels that contribute comparable numbers of eccentric binaries to the population. We leave a detailed simulation study that accounts for these complications for future work.
5 Conclusion
In this work, we analyse BBH signal candidates newly added to the LVK catalogue of gravitational-wave transients in GWTC-2.1 and GWTC-3 for signs of orbital eccentricity using an aligned-spin, eccentric waveform model. We find that two of these events have significant support for detectable eccentricity at Hz: GW191109 and GW200208_22. Together with two events from GWTC-2, GW190521 and GW190620 (Romero-Shaw et al., 2021a), four of the BBH we have studied show significant support for measurable eccentricity. At just over , this is slightly more than the of mergers that should be expected with detectable eccentricity from GCs (Zevin et al., 2021a), and may indicate that there are more eccentric mergers in the population than can be explained by dense star clusters alone. However, as we show in Section 4, the difference can be explained by Poisson noise. Additionally, some of these mergers may be spin-precessing binaries that are masquerading as eccentric BBH in our analyses due to our enforced assumption of spin-alignment.
While we cannot say conclusively that these four binaries are eccentric and spin-aligned, our results do show that these signals are consistent with those that contain hints of orbital eccentricity, and are better-fit by eccentric waveforms than they are by quasi-circular waveforms. If they are eccentric, and/or have large spin magnitudes and/or spin tilts, then these binaries are difficult to explain through isolated evolution scenarios and add weight to the hypothesis that the BBH detected by the LVK are dynamically formed.
We have focused on the particular dynamical formation environment of globular star clusters in this paper. However, we emphasise that this is due to the robustness of predictions from this channel, as opposed to any sign that this particular dynamical formation environment is preferred over other dynamical formation environments. In fact, this formation environment may be particularly unlikely when other parameters of these systems are considered. Three of the four potentially eccentric events have notably high primary masses, all with median source-frame measurements above the tentative pair-instability supernova mass gap lower limit of M (e.g., Heger & Woosley, 2002; Belczynski et al., 2016; Woosley, 2017; Marchant & Moriya, 2020) (the exception, GW200208_22, has a median source-frame primary mass of M⊙ after reweighting to the eccentric model). The relatively low escape velocities of globular clusters (typically km s-1; Gnedin et al., 2002; Antonini & Rasio, 2016; Baumgardt & Hilker, 2018) mean that merger remnants are more often kicked out of the cluster than in environments with deeper central potential wells, such as AGN or nuclear star clusters (e.g., Antonini & Rasio, 2016; Fragione et al., 2020; Ford & McKernan, 2021; Fragione et al., 2022; Mahapatra et al., 2021). Additionally, because globular clusters undergo mass segregation soon after their formation at high redshift, it is likely that the heaviest binaries merge outside of the observable range of current detectors (Antonini & Rasio, 2016; Romero-Shaw et al., 2021b). To assess the probability of formation in globular clusters relative to the probability of formation in AGN, we would need a multidimensional version of the toy-model analysis demonstrated in Section 4.2 incorporating robust predictions for eccentricity, mass, spin and redshift from these different environments; see , e.g., Yang et al. (2019); Samsing et al. (2020); McKernan et al. (2020); Tagawa et al. (2020, 2021c, 2021b); Vajpeyi et al. (2021); Gayathri et al. (2021) for a range of recent predictions for binary black hole mergers occurring in AGN.
There are many roads to forming merging BBH dynamically, and we show in this paper that in a future when eccentricity can be tightly constrained, it will be possible to disentangle contributing dynamical channels with detectably-eccentric mergers at current detector sensitivity limits. As detectors improve, the threshold for detectable eccentricity decreases, so fewer detectably-eccentric events are required to distinguish contributions from different dynamical channels. Even so, without a method to confidently measure eccentricity and the full range of spin effects simultaneously, it will not be possible to use the method we have demonstrated to identify the dominant dynamical formation channel. We will therefore turn our focus towards extricating measurements of eccentricity from the restraints of spin-aligned, moderately-spinning waveform models in the future.
6 Acknowledgements
We thank Vijay Varma, Katerina Chatziioannou, Alan Knee, Teagan Clarke, Makai Baker, and attendees of the Niels Bohr Institute’s Workshop on Black Hole Dynamics for enlightening suggestions, observations, and discussions. We also thank Mike Zevin for his insights on our work and comments on our manuscript. We are grateful to our anonymous reviewer, whose advice on our manuscript improved its contents. This work is supported through Australian Research Council (ARC) Centre of Excellence CE170100004, and Discovery Project DP220101610. IMR-S acknowledges support received from the Herchel Smith Postdoctoral Fellowship Fund. The authors are grateful for computational resources provided by the LIGO Laboratory and supported by National Science Foundation Grants PHY-0757058 and PHY-0823459. This research has made use of data or software obtained from the Gravitational Wave Open Science Center (gw-openscience.org), a service of LIGO Laboratory, the LIGO Scientific Collaboration, the Virgo Collaboration, and KAGRA. LIGO Laboratory and Advanced LIGO are funded by the United States National Science Foundation (NSF) as well as the Science and Technology Facilities Council (STFC) of the United Kingdom, the Max-Planck-Society (MPS), and the State of Niedersachsen/Germany for support of the construction of Advanced LIGO and construction and operation of the GEO600 detector. Additional support for Advanced LIGO was provided by the Australian Research Council. Virgo is funded, through the European Gravitational Observatory (EGO), by the French Centre National de Recherche Scientifique (CNRS), the Italian Istituto Nazionale di Fisica Nucleare (INFN) and the Dutch Nikhef, with contributions by institutions from Belgium, Germany, Greece, Hungary, Ireland, Japan, Monaco, Poland, Portugal, Spain. The construction and operation of KAGRA are funded by Ministry of Education, Culture, Sports, Science and Technology (MEXT), and Japan Society for the Promotion of Science (JSPS), National Research Foundation (NRF) and Ministry of Science and ICT (MSIT) in Korea, Academia Sinica (AS) and the Ministry of Science and Technology (MoST) in Taiwan.
References
- Abbott et al. (2019) Abbott, B. P., et al. 2019, Phys. Rev. X, 9, 031040, doi: 10.1103/PhysRevX.9.031040
- Abbott et al. (2021a) Abbott, R., Abbott, T. D., Acernese, F., et al. 2021a, arXiv e-prints, arXiv:2111.03606. https://arxiv.org/abs/2111.03606
- Abbott et al. (2020) Abbott, R., Abbott, T. D., Abraham, S., et al. 2020, Phys. Rev. Lett., 125, 101102, doi: 10.1103/PhysRevLett.125.101102
- Abbott et al. (2020) Abbott, R., Abbott, T. D., Abraham, S., et al. 2020, ApJ, 896, L44, doi: 10.3847/2041-8213/ab960f
- Abbott et al. (2021b) —. 2021b, Physical Review X, 11, 021053, doi: 10.1103/PhysRevX.11.021053
- Abbott et al. (2021c) Abbott, R., Abbott, T. D., Acernese, F., et al. 2021c, arXiv e-prints, arXiv:2108.01045. https://arxiv.org/abs/2108.01045
- Abbott et al. (2021d) —. 2021d, arXiv e-prints, arXiv:2111.03634. https://arxiv.org/abs/2111.03634
- Abbott et al. (2021a) Abbott, R., et al. 2021a, Gravitational Wave Open Science Center Strain Data Release for GWTC-2.1, LIGO Open Science Center, doi: https://doi.org/10.7935/qf3a-3z67
- Abbott et al. (2021b) —. 2021b, Gravitational Wave Open Science Center Strain Data Release for GWTC-3, LIGO Open Science Center, doi: https://doi.org/10.7935/pr1e-j706
- Anagnostou et al. (2020) Anagnostou, O., Trenti, M., & Melatos, A. 2020, arXiv e-prints, arXiv:2010.06161. https://arxiv.org/abs/2010.06161
- Antonini & Rasio (2016) Antonini, F., & Rasio, F. A. 2016, ApJ, 831, 187, doi: 10.3847/0004-637X/831/2/187
- Antonini et al. (2017) Antonini, F., Toonen, S., & Hamers, A. S. 2017, Astrophys. J., 841, 77, doi: 10.3847/1538-4357/aa6f5e
- Ashton et al. (2019) Ashton, G., et al. 2019, Astrophys. J. Suppl., 241, 27, doi: 10.3847/1538-4365/ab06fc
- Banerjee (2021) Banerjee, S. 2021, MNRAS, 500, 3002, doi: 10.1093/mnras/staa2392
- Baumgardt & Hilker (2018) Baumgardt, H., & Hilker, M. 2018, MNRAS, 478, 1520, doi: 10.1093/mnras/sty1057
- Bavera et al. (2020) Bavera, S. S., Fragos, T., Qin, Y., et al. 2020, A&A, 635, A97, doi: 10.1051/0004-6361/201936204
- Belczynski (2020) Belczynski, K. 2020, ApJ, 905, L15, doi: 10.3847/2041-8213/abcbf1
- Belczynski et al. (2016) Belczynski, K., Heger, A., Gladysz, W., et al. 2016, A&A, 594, A97, doi: 10.1051/0004-6361/201628980
- Belczynski et al. (2020) Belczynski, K., Klencki, J., Fields, C. E., et al. 2020, A&A, 636, A104, doi: 10.1051/0004-6361/201936528
- Bethe & Brown (1998) Bethe, H. A., & Brown, G. E. 1998, Astrophys. J., 506, 780, doi: 10.1086/306265
- Bogdanović et al. (2007) Bogdanović, T., Reynolds, C. S., & Miller, M. C. 2007, ApJ, 661, L147, doi: 10.1086/518769
- Broekgaarden et al. (2022) Broekgaarden, F. S., Stevenson, S., & Thrane, E. 2022, arXiv e-prints, arXiv:2205.01693. https://arxiv.org/abs/2205.01693
- Buonanno et al. (2008) Buonanno, A., Kidder, L. E., & Lehner, L. 2008, Phys. Rev. D, 77, 026004, doi: 10.1103/PhysRevD.77.026004
- Calderón Bustillo et al. (2020) Calderón Bustillo, J., Sanchis-Gual, N., Torres-Forné, A., & Font, J. A. 2020, Confusing head-on and precessing intermediate-mass binary black hole mergers
- Calderón Bustillo et al. (2021) Calderón Bustillo, J., Sanchis-Gual, N., Torres-Forné, A., et al. 2021, Phys. Rev. Lett., 126, 081101, doi: 10.1103/PhysRevLett.126.081101
- Campanelli et al. (2006) Campanelli, M., Lousto, C. O., & Zlochower, Y. 2006, Phys. Rev. D, D74, 084023, doi: 10.1103/PhysRevD.74.084023
- Cao & Han (2017) Cao, Z., & Han, W.-B. 2017, Phys. Rev., D96, 044028, doi: 10.1103/PhysRevD.96.044028
- Clarke et al. (2022) Clarke, T. A., Romero-Shaw, I. M., Lasky, P. D., & Thrane, E. 2022, arXiv e-prints, arXiv:2206.14006. https://arxiv.org/abs/2206.14006
- Cornish & Littenberg (2015) Cornish, N. J., & Littenberg, T. B. 2015, Class. Quant. Grav., 32, 135012, doi: 10.1088/0264-9381/32/13/135012
- Costa et al. (2021) Costa, G., Bressan, A., Mapelli, M., et al. 2021, MNRAS, 501, 4514, doi: 10.1093/mnras/staa3916
- de Mink et al. (2010) de Mink, S. E., Cantiello, M., Langer, N., & Pols, O. R. 2010, in American Institute of Physics Conference Series, Vol. 1314, American Institute of Physics Conference Series, ed. V. Kalogera & M. van der Sluys, 291–296, doi: 10.1063/1.3536387
- de Mink & Mandel (2016) de Mink, S. E., & Mandel, I. 2016, Mon. Not. Roy. Astron. Soc., 460, 3545, doi: 10.1093/mnras/stw1219
- Farmer et al. (2019) Farmer, R., Renzo, M., de Mink, S. E., Marchant, P., & Justham, S. 2019, Astrophys. J., 887, 53
- Farr et al. (2017) Farr, W. M., Stevenson, S., Coleman Miller, M., et al. 2017, Nature, 548, 426, doi: 10.1038/nature23453
- Favata et al. (2022) Favata, M., Kim, C., Arun, K. G., Kim, J., & Lee, H. W. 2022, Phys. Rev. D, 105, 023003, doi: 10.1103/PhysRevD.105.023003
- Fishbach & Holz (2017) Fishbach, M., & Holz, D. E. 2017, Astrophys. J., 851, L25, doi: 10.3847/2041-8213/aa9bf6
- Fishbach & Holz (2020) Fishbach, M., & Holz, D. E. 2020, arXiv e-prints, arXiv:2009.05472. https://arxiv.org/abs/2009.05472
- Fishbach et al. (2017) Fishbach, M., Holz, D. E., & Farr, B. 2017, Astrophys. J., 840, L24, doi: 10.3847/2041-8213/aa7045
- Fishbach et al. (2018) Fishbach, M., Holz, D. E., & Farr, W. M. 2018, apjl, 863, L41, doi: 10.3847/2041-8213/aad800
- Ford & McKernan (2021) Ford, K. E. S., & McKernan, B. 2021, arXiv e-prints, arXiv:2109.03212. https://arxiv.org/abs/2109.03212
- Fragione et al. (2022) Fragione, G., Kocsis, B., Rasio, F. A., & Silk, J. 2022, ApJ, 927, 231, doi: 10.3847/1538-4357/ac5026
- Fragione et al. (2020) Fragione, G., Loeb, A., & Rasio, F. A. 2020, ApJ, 902, L26, doi: 10.3847/2041-8213/abbc0a
- Fragione & Silk (2020) Fragione, G., & Silk, J. 2020, MNRAS, 498, 4591, doi: 10.1093/mnras/staa2629
- Franciolini et al. (2021) Franciolini, G., Cotesta, R., Loutrel, N., et al. 2021, arXiv e-prints, arXiv:2112.10660. https://arxiv.org/abs/2112.10660
- Galaudage et al. (2021) Galaudage, S., Talbot, C., Nagar, T., et al. 2021, arXiv e-prints, arXiv:2109.02424. https://arxiv.org/abs/2109.02424
- Gallegos-Garcia et al. (2021) Gallegos-Garcia, M., Berry, C. P. L., Marchant, P., & Kalogera, V. 2021, ApJ, 922, 110, doi: 10.3847/1538-4357/ac2610
- Gamba et al. (2021) Gamba, R., Breschi, M., Carullo, G., et al. 2021, arXiv e-prints, arXiv:2106.05575. https://arxiv.org/abs/2106.05575
- Gayathri et al. (2021) Gayathri, V., Yang, Y., Tagawa, H., Haiman, Z., & Bartos, I. 2021, ApJ, 920, L42, doi: 10.3847/2041-8213/ac2cc1
- Gayathri et al. (2022) Gayathri, V., Healy, J., Lange, J., et al. 2022, Nature Astron., 6, 344, doi: 10.1038/s41550-021-01568-w
- Gerosa & Berti (2017) Gerosa, D., & Berti, E. 2017, Phys. Rev., D95, 124046, doi: 10.1103/PhysRevD.95.124046
- Gerosa & Berti (2019) Gerosa, D., & Berti, E. 2019, Phys. Rev. D, 100, 041301, doi: 10.1103/PhysRevD.100.041301
- Gerosa et al. (2018) Gerosa, D., Berti, E., O’Shaughnessy, R., et al. 2018, Phys. Rev. D, 98, 084036, doi: 10.1103/PhysRevD.98.084036
- Gerosa & Fishbach (2021) Gerosa, D., & Fishbach, M. 2021, Nature Astronomy, 5, 749, doi: 10.1038/s41550-021-01398-w
- Gnedin et al. (2002) Gnedin, O. Y., Zhao, H., Pringle, J. E., et al. 2002, ApJ, 568, L23, doi: 10.1086/340319
- Gondán & Kocsis (2021) Gondán, L., & Kocsis, B. 2021, Mon. Not. Roy. Astron. Soc., doi: 10.1093/mnras/stab1722
- Gondán et al. (2018) Gondán, L., Kocsis, B., Raffai, P., & Frei, Z. 2018, Astrophys. J., 860, 5, doi: 10.3847/1538-4357/aabfee
- González et al. (2007) González, J. A., Sperhake, U., Brügmann, B., Hannam, M., & Husa, S. 2007, Phys. Rev. Lett., 98, 091101, doi: 10.1103/PhysRevLett.98.091101
- Green & Kavanagh (2021) Green, A. M., & Kavanagh, B. J. 2021, Journal of Physics G Nuclear Physics, 48, 043001, doi: 10.1088/1361-6471/abc534
- Hannam et al. (2021) Hannam, M., Hoy, C., Thompson, J. E., et al. 2021, arXiv e-prints, arXiv:2112.11300. https://arxiv.org/abs/2112.11300
- Heger & Woosley (2002) Heger, A., & Woosley, S. E. 2002, Astrophy. J., 567, 532, doi: 10.1086/338487
- Hirschi et al. (2005) Hirschi, R., Meynet, G., & Maeder, A. 2005, A&A, 443, 581, doi: 10.1051/0004-6361:20053329
- Iglesias et al. (2022) Iglesias, H. L., Lange, J., Bartos, I., et al. 2022, arXiv e-prints, arXiv:2208.01766. https://arxiv.org/abs/2208.01766
- Ivanova et al. (2013) Ivanova, N., Justham, S., Chen, X., et al. 2013, A&A Rev., 21, 59, doi: 10.1007/s00159-013-0059-2
- Izzard et al. (2003) Izzard, R. G., Ramirez-Ruiz, E., & Tout, C. A. 2003, Monthly Notices of the Royal Astronomical Society, 348, 1215
- Kalogera (2000) Kalogera, V. 2000, apj, 541, 319, doi: 10.1086/309400
- Khan et al. (2016) Khan, S., Husa, S., Hannam, M., et al. 2016, Phys. Rev., D93, 044007, doi: 10.1103/PhysRevD.93.044007
- Kimball et al. (2021) Kimball, C., Talbot, C., Berry, C. P., et al. 2021, Astrophys. J. Lett., 915, L35
- Kimball et al. (2020) Kimball, C., Talbot, C., Berry, C. P. L., et al. 2020, arXiv e-prints, arXiv:2005.00023. https://arxiv.org/abs/2005.00023
- Knee et al. (2022) Knee, A. M., Romero-Shaw, I. M., Lasky, P. D., McIver, J., & Thrane, E. 2022, arXiv e-prints, arXiv:2207.14346. https://arxiv.org/abs/2207.14346
- Kozai (1962) Kozai, Y. 1962, Astrophys. J., 67, 591, doi: 10.1086/108790
- Kremer et al. (2020a) Kremer, K., Spera, M., Becker, D., et al. 2020a, ApJ, 903, 45, doi: 10.3847/1538-4357/abb945
- Kremer et al. (2020b) Kremer, K., Ye, C. S., Rui, N. Z., et al. 2020b, apjs, 247, 48, doi: 10.3847/1538-4365/ab7919
- Kruckow et al. (2016) Kruckow, M. U., Tauris, T. M., Langer, N., et al. 2016, Astron. Astrophys., 596, A58, doi: 10.1051/0004-6361/201629420
- Lenon et al. (2020) Lenon, A. K., Nitz, A. H., & Brown, D. A. 2020, MNRAS, 497, 1966, doi: 10.1093/mnras/staa2120
- Lidov (1962) Lidov, M. L. 1962, Planetary and Space Science, 9, 719, doi: 10.1016/0032-0633(62)90129-0
- Littenberg & Cornish (2015) Littenberg, T. B., & Cornish, N. J. 2015, Phys. Rev. D, 91, 084034, doi: 10.1103/PhysRevD.91.084034
- Liu & Lai (2017) Liu, B., & Lai, D. 2017, ApJ, 846, L11, doi: 10.3847/2041-8213/aa8727
- Livio & Soker (1988) Livio, M., & Soker, N. 1988, Astrophys. J., 329, 764, doi: 10.1086/166419
- Lower et al. (2018) Lower, M., et al. 2018, Phys. Rev. D, 98, doi: 10.1103/PhysRevD.98.083028
- Mahapatra et al. (2021) Mahapatra, P., Gupta, A., Favata, M., Arun, K. G., & Sathyaprakash, B. S. 2021, ApJ, 918, L31, doi: 10.3847/2041-8213/ac20db
- Mandel & de Mink (2016) Mandel, I., & de Mink, S. E. 2016, MNRAS, 458, 2634, doi: 10.1093/mnras/stw379
- Mandic et al. (2016) Mandic, V., Bird, S., & Cholis, I. 2016, Phys. Rev. Lett., 117, 201102, doi: 10.1103/PhysRevLett.117.201102
- Mapelli (2020) Mapelli, M. 2020, Frontiers in Astronomy and Space Sciences, 7, 38, doi: 10.3389/fspas.2020.00038
- Marchant et al. (2016) Marchant, P., Langer, N., Podsiadlowski, P., Tauris, T. M., & Moriya, T. J. 2016, A&A, 588, A50, doi: 10.1051/0004-6361/201628133
- Marchant & Moriya (2020) Marchant, P., & Moriya, T. J. 2020, A&A, 640, L18, doi: 10.1051/0004-6361/202038902
- McKernan et al. (2020) McKernan, B., Ford, K. E. S., O’Shaugnessy, R., & Wysocki, D. 2020, MNRAS, 494, 1203, doi: 10.1093/mnras/staa740
- Nagar et al. (2018) Nagar, A., et al. 2018, Phys. Rev. D, 98, 104052, doi: 10.1103/PhysRevD.98.104052
- Naoz (2016) Naoz, S. 2016, ARA&A, 54, 441, doi: 10.1146/annurev-astro-081915-023315
- Neijssel et al. (2021) Neijssel, C. J., Vinciguerra, S., Vigna-Gómez, A., et al. 2021, ApJ, 908, 118, doi: 10.3847/1538-4357/abde4a
- Neijssel et al. (2019) Neijssel, C. J., Vigna-Gómez, A., Stevenson, S., et al. 2019, MNRAS, 490, 3740, doi: 10.1093/mnras/stz2840
- Olejak et al. (2021) Olejak, A., Belczynski, K., & Ivanova, N. 2021, A&A, 651, A100, doi: 10.1051/0004-6361/202140520
- O’Shaughnessy et al. (2017) O’Shaughnessy, R., Gerosa, D., & Wysocki, D. 2017, Phys. Rev. Lett., 119, 011101, doi: 10.1103/PhysRevLett.119.011101
- O’Shea & Kumar (2021) O’Shea, E., & Kumar, P. 2021, arXiv e-prints, arXiv:2107.07981. https://arxiv.org/abs/2107.07981
- Payne et al. (2022) Payne, E., Hourihane, S., Golomb, J., et al. 2022, arXiv e-prints, arXiv:2206.11932. https://arxiv.org/abs/2206.11932
- Payne et al. (2019) Payne, E., Talbot, C., & Thrane, E. 2019, Phys. Rev. D, 100, 123017, doi: 10.1103/PhysRevD.100.123017
- Peters (1964) Peters, P. C. 1964, Phys. Rev., 136, B1224, doi: 10.1103/PhysRev.136.B1224
- Pratten et al. (2021) Pratten, G., García-Quirós, C., Colleoni, M., et al. 2021, Phys. Rev. D, 103, 104056, doi: 10.1103/PhysRevD.103.104056
- Pretorius (2005) Pretorius, F. 2005, Phys. Rev. Lett., 95, 121101, doi: 10.1103/PhysRevLett.95.121101
- Qin et al. (2019) Qin, Y., Marchant, P., Fragos, T., Meynet, G., & Kalogera, V. 2019, ApJ, 870, L18, doi: 10.3847/2041-8213/aaf97b
- Rodriguez et al. (2018a) Rodriguez, C. L., Amaro-Seoane, P., Chatterjee, S., et al. 2018a, Phys. Rev., D98, 123005, doi: 10.1103/PhysRevD.98.123005
- Rodriguez et al. (2018b) Rodriguez, C. L., Amaro-Seoane, P., Chatterjee, S., & Rasio, F. A. 2018b, Phys. Rev. Lett., 120, 151101, doi: 10.1103/PhysRevLett.120.151101
- Rodriguez & Antonini (2018) Rodriguez, C. L., & Antonini, F. 2018, ApJ, 863, 7, doi: 10.3847/1538-4357/aacea4
- Rodriguez et al. (2019) Rodriguez, C. L., Zevin, M., Amaro-Seoane, P., et al. 2019, Phys. Rev. D, 100, 043027, doi: 10.1103/PhysRevD.100.043027
- Rodriguez et al. (2016) Rodriguez, C. L., Zevin, M., Pankow, C., Kalogera, V., & Rasio, F. A. 2016, Astrophys. J., 832, L2, doi: 10.3847/2041-8205/832/1/L2
- Romero-Shaw et al. (2021a) Romero-Shaw, I., Lasky, P. D., & Thrane, E. 2021a, ApJ, 921, L31, doi: 10.3847/2041-8213/ac3138
- Romero-Shaw et al. (2020a) Romero-Shaw, I. M., Farrow, N., Stevenson, S., Thrane, E., & Zhu, X.-J. 2020a, Mon. Not. Roy. Astron. Soc., 496, L64, doi: 10.1093/mnrasl/slaa084
- Romero-Shaw et al. (2021b) Romero-Shaw, I. M., Kremer, K., Lasky, P. D., Thrane, E., & Samsing, J. 2021b, MNRAS, 506, 2362, doi: 10.1093/mnras/stab1815
- Romero-Shaw et al. (2019) Romero-Shaw, I. M., Lasky, P. D., & Thrane, E. 2019, Mon. Not. Roy. Astron. Soc., 490, 5210, doi: 10.1093/mnras/stz2996
- Romero-Shaw et al. (2020b) Romero-Shaw, I. M., Lasky, P. D., Thrane, E., & Bustillo, J. C. 2020b, Astrophys. J. Lett., 903, L5, doi: 10.3847/2041-8213/abbe26
- Romero-Shaw et al. (2020c) Romero-Shaw, I. M., et al. 2020c, Mon. Not. Roy. Astron. Soc., 499, 3295, doi: 10.1093/mnras/staa2850
- Roulet et al. (2021) Roulet, J., Chia, H. S., Olsen, S., et al. 2021, Physical Review D, 104, 083010, doi: 10.1103/PhysRevD.104.083010
- Sakstein et al. (2020) Sakstein, J., Croon, D., McDermott, S. D., Straight, M. C., & Baxter, E. J. 2020, arXiv e-prints, arXiv:2009.01213. https://arxiv.org/abs/2009.01213
- Samsing (2018) Samsing, J. 2018, Phys. Rev. D, D97, 103014, doi: 10.1103/PhysRevD.97.103014
- Samsing & D’Orazio (2018) Samsing, J., & D’Orazio, D. J. 2018, Mon. Not. Roy. Astron. Soc., 481, doi: 10.1093/mnras/sty2334
- Samsing et al. (2018) Samsing, J., D’Orazio, D. J., Askar, A., & Giersz, M. 2018, arXiv e-prints, arXiv:1802.08654. https://arxiv.org/abs/1802.08654
- Samsing & Hotokezaka (2020) Samsing, J., & Hotokezaka, K. 2020, arXiv e-prints, arXiv:2006.09744. https://arxiv.org/abs/2006.09744
- Samsing & Ramirez-Ruiz (2017) Samsing, J., & Ramirez-Ruiz, E. 2017, Astrophys. J., 840, L14, doi: 10.3847/2041-8213/aa6f0b
- Samsing et al. (2020) Samsing, J., Bartos, I., D’Orazio, D. J., et al. 2020, arXiv e-prints, arXiv:2010.09765. https://arxiv.org/abs/2010.09765
- Sedda et al. (2020) Sedda, M. A., Mapelli, M., Spera, M., Benacquista, M., & Giacobbo, N. 2020, Astrophys. J., 894, 133, doi: 10.3847/1538-4357/ab88b2
- Shaik et al. (2020) Shaik, F. H., Lange, J., Field, S. E., et al. 2020, Phys. Rev. D, 101, 124054, doi: 10.1103/PhysRevD.101.124054
- Silsbee & Tremaine (2017) Silsbee, K., & Tremaine, S. 2017, Astrophys. J., 836, 39, doi: 10.3847/1538-4357/aa5729
- Speagle (2019) Speagle, J. S. 2019, arXiv e-prints, arXiv:1904.02180. https://arxiv.org/abs/1904.02180
- Stevenson et al. (2017) Stevenson, S., Berry, C. P. L., & Mandel, I. 2017, Mon. Not. Roy. Astron. Soc., 471, 2801, doi: 10.1093/mnras/stx1764
- Stevenson et al. (2015) Stevenson, S., Ohme, F., & Fairhurst, S. 2015, Astrophys. J., 810, 58, doi: 10.1088/0004-637X/810/1/58
- Tagawa et al. (2020) Tagawa, H., Haiman, Z., Bartos, I., & Kocsis, B. 2020, Astrophys. J., 899, 26, doi: 10.3847/1538-4357/aba2cc
- Tagawa et al. (2021a) Tagawa, H., Haiman, Z., Bartos, I., Kocsis, B., & Omukai, K. 2021a, MNRAS, 507, 3362, doi: 10.1093/mnras/stab2315
- Tagawa et al. (2021b) Tagawa, H., Kocsis, B., Haiman, Z., et al. 2021b, Astrophys. J. Lett., 907, L20, doi: 10.3847/2041-8213/abd4d3
- Tagawa et al. (2021c) —. 2021c, ApJ, 908, 194, doi: 10.3847/1538-4357/abd555
- Talbot & Thrane (2017) Talbot, C., & Thrane, E. 2017, Phys. Rev. D, 96, 023012
- Trani et al. (2021) Trani, A. A., Tanikawa, A., Fujii, M. S., Leigh, N. W. C., & Kumamoto, J. 2021, MNRAS, 504, 910, doi: 10.1093/mnras/stab967
- Vajpeyi et al. (2021) Vajpeyi, A., Thrane, E., Smith, R., McKernan, B., & Ford, K. E. S. 2021, arXiv e-prints, arXiv:2111.03992. https://arxiv.org/abs/2111.03992
- Valsecchi et al. (2010) Valsecchi, F., Glebbeek, E., Farr, W. M., et al. 2010, Nature, 468, 77, doi: 10.1038/nature09463
- van den Heuvel et al. (2017) van den Heuvel, E. P. J., Portegies Zwart, S. F., & de Mink, S. E. 2017, MNRAS, 471, 4256, doi: 10.1093/mnras/stx1430
- Vitale et al. (2017) Vitale, S., Lynch, R., Sturani, R., & Graff, P. 2017, Class. Quant. Grav., 34, 03LT01, doi: 10.1088/1361-6382/aa552e
- Wen (2003) Wen, L. 2003, Astrophys. J., 598, 419, doi: 10.1086/378794
- Woosley (2017) Woosley, S. E. 2017, apj, 836, 244, doi: 10.3847/1538-4357/836/2/244
- Woosley & Heger (2021) Woosley, S. E., & Heger, A. 2021, ApJ, 912, L31, doi: 10.3847/2041-8213/abf2c4
- Yang et al. (2019) Yang, Y., Bartos, I., Gayathri, V., et al. 2019, Phys. Rev. Lett., 123, 181101, doi: 10.1103/PhysRevLett.123.181101
- Zevin & Bavera (2022) Zevin, M., & Bavera, S. S. 2022, arXiv e-prints, arXiv:2203.02515. https://arxiv.org/abs/2203.02515
- Zevin & Holz (2022) Zevin, M., & Holz, D. E. 2022, arXiv e-prints, arXiv:2205.08549. https://arxiv.org/abs/2205.08549
- Zevin et al. (2021a) Zevin, M., Romero-Shaw, I. M., Kremer, K., Thrane, E., & Lasky, P. D. 2021a, arXiv e-prints, arXiv:2106.09042. https://arxiv.org/abs/2106.09042
- Zevin et al. (2019) Zevin, M., Samsing, J., Rodriguez, C., Haster, C.-J., & Ramirez-Ruiz, E. 2019, Astrophys. J., 871, 91, doi: 10.3847/1538-4357/aaf6ec
- Zevin et al. (2021b) Zevin, M., Bavera, S. S., Berry, C. P. L., et al. 2021b, apj, 910, 152, doi: 10.3847/1538-4357/abe40e
- Ziegler & Freese (2021) Ziegler, J., & Freese, K. 2021, Phys. Rev. D, 104, 043015, doi: 10.1103/PhysRevD.104.043015
Appendix A Likely non-eccentric new events in GWTC-3
| Event name | (%) | (%) | |||
|---|---|---|---|---|---|
| GW190426_16 | |||||
| GW190916 | |||||
| GW190926 | |||||
| GW191103 | |||||
| GW191222 | |||||
| GW191230 | |||||
| GW200112 | |||||
| GW200128 | |||||
| GW200208 | |||||
| GW200219 | |||||
| GW200220_O6 | |||||
| GW200220_12 | |||||
| GW200224 | |||||
| GW200302 | |||||
| GW200306 | |||||
| GW200308 | |||||
| GW200311 | |||||
| GW200316 |

In Table 3, we provide summary statistics for the newly-studied events in GWTC-3 that are both adequately sampled and have . Marginal posterior distributions on log are displayed in Figure 11. Full posterior distributions on all parameters of these events are provided online.555github.com/IsobelMarguarethe/eccentric-GWTC-3
Appendix B Undersampled events in GWTC-3
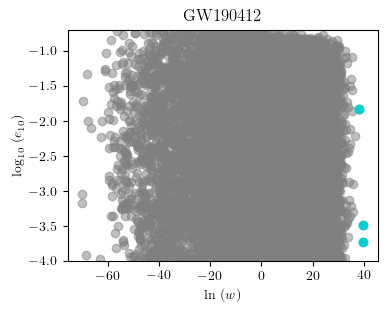
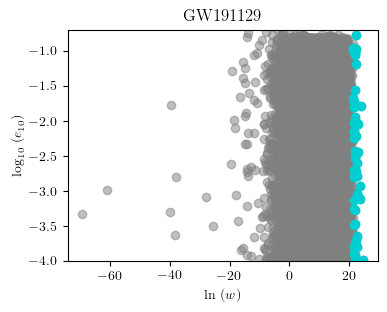
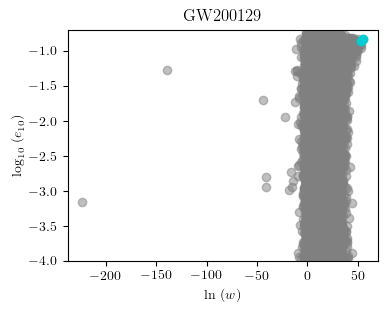
We consider any event with to be undersampled. With such few samples, measurements can be misleading, so we do not include in this work the analyses of the events in GWTC-3 for which the reweighting process is unsuccessful. However, even when an event is undersampled, it can be informative to study a scatter plot of weights versus eccentricities to gain an understanding of the reason for undersampling. Three examples are shown in Figure 12, in which the (see Eq. 1) dominating samples are highlighted. Firstly, the locations of the scatter points across the eccentricity range are informative: if the event has no support at all for high eccentricities, it will not be possible for highly-eccentric samples to be drawn, so there will be no scatter points at high eccentricities.
Secondly, the distribution of weights across the eccentricity range is informative. If highly-weighted samples are spread evenly across the range of eccentricities—as is the case for our first two examples—waveform systematics are a probable suspect for underweighting: these samples are likely to reside in an area of the wider parameter space (for example, a particular combination of masses and spins) for which the IMRPhenomD waveform does not well-represent the SEOBNRE waveform. If instead the dominating samples are localised to a particular part of the eccentricity range—as is the case for our final example, GW200129—the situation is both more interesting and more frustrating. In this case, it is likely that there is strong support for eccentricity in the data, but that the eccentric posterior does not overlap the quasi-circular posterior to an adequate extent for the reweighting method to be efficient.