Parallel Compositing of Volumetric Depth Images for Interactive Visualization of Distributed Volumes at High Frame Rates
Abstract
We present a parallel compositing algorithm for Volumetric Depth Images (VDIs) of large three-dimensional volume data. Large distributed volume data are routinely produced in both numerical simulations and experiments, yet it remains challenging to visualize them at smooth, interactive frame rates. VDIs are view-dependent piecewise constant representations of volume data that offer a potential solution. They are more compact and less expensive to render than the original data. So far, however, there is no method for generating VDIs from distributed data. We propose an algorithm that enables this by sort-last parallel generation and compositing of VDIs with automatically chosen content-adaptive parameters. The resulting composited VDI can then be streamed for remote display, providing responsive visualization of large, distributed volume data.
{CCSXML}<ccs2012> <concept> <concept_id>10003120.10003145.10003146</concept_id> <concept_desc>Human-centered computing Visualization techniques</concept_desc> <concept_significance>300</concept_significance> </concept> <concept> <concept_id>10010147.10010371.10010372</concept_id> <concept_desc>Computing methodologies Rendering</concept_desc> <concept_significance>300</concept_significance> </concept> </ccs2012>
\ccsdesc[300]Human-centered computing Visualization techniques \ccsdesc[300]Computing methodologies Rendering
\printccsdesc1 Introduction
Interactive direct volume rendering is a commonly used technique for the analysis of large scalar field data generated by scientific simulations or experimental measurement devices. Rendering at high, consistent frame rates and low latency is crucial for enabling smooth viewpoint changes and zooming, which are important for gaining depth perception and spatial understanding. Distributed compute clusters are therefore commonly used to accelerate rendering of large data, distributing the data and parallelizing the calculations among processors. But consistently high frame rates are difficult to achieve in such a setting, due to the time-consuming raycasting procedure and the remote rendering setup, which introduces additional network latency.
Here, we propose the use of view-dependent piecewise-constant representations of volume data, also known as Volumetric Depth Images (VDIs) [FSE13], to decouple interactive viewpoint changes and zooming from network latency and distributed volume raycasting. These representations are generated by dividing the volume-rendering integral along each ray into chunks that store cumulative color and opacity. The resulting representation can be much smaller than the volume data [FSE13], can be compressed and streamed efficiently [FFSE14], and recent work has shown that it can be rendered at high frame rates, providing high-fidelity approximations near the viewpoint from which it was generated [GGI∗22]. However, there currently exists no method to generate such representations on distributed volume data.
We present a sort-last parallel generation approach for Volumetric Depth Images (VDIs) [FSE13]. VDIs are generated on each processing element (PE) on its volume domain in parallel—we call these “sub-VDIs”—and we present an efficient algorithm to composit them in parallel into a single VDI with compositing load balancing in image space. We design the compositing algorithm such that it can adapt to arbitrary, potentially non-convex data domain decompositions, as may arise, for example, in in situ visualization of distributed computer simulations.
We implement and benchmark our method on real-world datasets. We test the parallel compositing algorithm for accuracy and scalability, showing that it can be used to enable responsive visualization at high frame rates for large distributed volume data. We implement our method as an extension of the existing open-source visualization library scenery[GPG∗19].
In particular, we contribute the following:
-
•
We propose the use of view-dependent piecewise-constant volume representations, such as VDIs, for interactive visualization of distributed volumes at high, consistent frame rates.
-
•
We provide an efficient parallel compositing algorithm for scalable sort-last generation of VDIs over distributed data.
2 Related Work
Before presenting the parallel VDI generation and compositing algorithm for distributed-memory volume data, we review the state of the art and related works in relevant areas and recall the main VDI concepts.
2.1 Distributed Volume Rendering
Volume rendering is widely used for the visualization of 3D scalar fields. Soon after the volume raycasting algorithm was first presented by Levoy [Lev88], parallel volume visualization began to receive research interest [Neu93, MPHK93] with the purpose of achieving interactive visualization by distributing the data and parallelizing the rendering calculations. Recent work in parallel volume rendering has focused on achieving efficient rendering at high degrees of parallelism and for large data sizes [BWHG17, HBC12, CDM06].
A commonly used strategy for parallel volume rendering is sort-last rendering [MCEF94, HBC12, PYR∗09]. There, the volume data are distributed among the processes taking part in the rendering. Each process performs a front-to-back raycasting on its data, producing a full-resolution sub-image. The sub-images from the various processes are then composited into a single image corresponding to the overall data.
Cavin et al. [CMF05] provide a theoretical comparison of some of the algorithms used for compositing the sub-images. Perhaps the simplest is the direct-send algorithm [EP07], where the image is divided among the processes such that each process is responsible for compositing of the total pixels in the final image. For this, each process receives fragments of images from all other processes, corresponding to the part of the final image that it “owns”. Peterka et al. [PYR∗09] used the direct-send approach in their study of parallel volume rendering on an IBM Blue Gene/P system.
Other frequently used compositing algorithms include the binary-swap algorithm [MPHK94], which uses a tree data structure with pairs of processes communicating for compositing at every node of the tree, and the hybrid radix-k compositing algorithm [PGR∗09], which combines the direct-send and binary-swap algorithms, offering configurable parameters for optimization on different hardware architectures. Recent work [LMPM21] has aimed to optimize interactivity in distributed rendering by compressing the image data on the GPU before compositing, but interactive frame rates still require a finely granular domain decomposition, and responsive visualization remains a challenge due to network latency between the user and the distributed cluster.
2.2 Explorable Image Representations
Multiple explorable image representations have been proposed in literature, often with the goal of decoupling rendering from interactive visualization in remote rendering applications. Shade et al. [SGHS98] introduced the view-dependent Layered Depth Image representation, enabling deferred rendering by storing multiple pixels along each line of sight, but their approach is limited to surface and geometry data. Stone et al. [SSS16] rendered omnidirectional stereoscopic images of molecular dynamics simulations on remote compute clusters. The images were streamed and reprojected locally at frame rates that enabled Virtual Reality (VR). However, omnidirectional stereoscopic images require warping to prevent distortions [SSP04], which requires depth information and therefore cannot be applied to volume data. For reprojecting volume data, Zellmann et al. [ZAL12, Zel21] transmitted a single depth layer along with the color buffer from the remote rendering server and provided a number of heuristics to create the depth buffer. While the use of a single depth value per pixel creates small message sizes, it is not conducive to producing high-quality reprojections, and holes may occur where rays do not intersect the depth layer. This has been addressed by view-dependent piecewise-constant volume representations [FSE13, LRBR16, BJNN97], which produce a continuous representation of the volume by storing multiple layers and composited color and opacity in-between. These representations include the Volumetric Depth Image (VDI) representation that we build on, and are described in more detail in Sec. 2.2.1.
Tikhonova et al. [TCM10a, TCM10b] and, more recently, Rapp et al. [RPD22], have proposed compact view-dependent representations that enable interactive transfer function changes. The VDI differs from these representations as it is generated for a given transfer function, stores preclassified color and opacity within each contained segment, and is intended to enable fast rendering from novel viewpoints. Rapp et al. [RPD22] do support viewpoint changes, but require bilinear interpolation of Lagrange multipliers, which is slow.
Recent years have witnessed widespread research interest in novel view synthesis – using one or more images of a scene to generate images from new viewpoints – using deep-learning techniques. Mildenhall et al. [MST∗21] proposed the NeRF (Neural Radiation Fields) representation, training a neural network to encode a continuous volume using just its weights, enabling rendering by raycasting over samples collected from the network. Numerous works have built on this representation, improving rendering quality [BMT∗21] and extending it to dynamic scenes [PCPMMN21]. However, their application to the visualization of high-resolution scientific volume data has not been demonstrated so far.
Exploratory visualization of numerical simulations was done post-hoc using the Cinema [AJO∗14] database, which stores images generated in situ using a range of visualization parameters, including different camera viewpoints. All parameters, including viewpoints, however, must be specified in advance, and the database becomes large if many viewpoints are required. Our approach, on the other hand, generates a compact VDI at regular time intervals, which can be streamed to enable approximate rendering with full 6 degrees-of-freedom camera viewpoint changes.
2.2.1 View-Dependent Piecewise-Constant Volume Representations
We review the different techniques that have been used to generate view-dependent piecewise-constant volume representations, including the Volumetric Depth Image [FSE13] representation we build on.
View-dependent representations of volume data are generated by raycasting the volume and decomposing the volume rendering integral into segments, each of which contain pre-classified composited color and opacity. The distinguishing feature of these representations, in comparison to other techniques that compress volume data, is that they produce an exact image when rendered from the original viewpoint of generation, owing to the associativity of the over operator [PD84] used in alpha-compositing. Rendering from deviating viewpoints involves accumulation over the segments, which is much cheaper than evaluating the full integral [KM05]. Close approximations to volume rendering are achieved around the viewpoint of generation [FSE13].
Previous work in generating view-dependent representations has proposed a variety of strategies to determine the size and extent of the segments generated along the rays. Brady et al. [BJNN97] use constant-size segments in each ray, which leads to segments containing composited color and opacity over potentially highly heterogeneous samples, hampering the quality of rendering from a different viewpoint. Lochmann et al. [LRBR16] create segments of constant opacity by partitioning the total transmittance equally among the segments. This, however, does not account for potentially varying color values within the segments. Frey et al. [FSE13] proposed the Volumetric Depth Image (VDI), which uses homogeneity as a criteria for the creation of segments, accumulating a sample into a segment unless it differs from the segment by more than a pre-defined sensitivity parameter . Recent work [GGI∗22] has proposed the use of an iterative search to determine the value of automatically. While the VDI can provide high-fidelity approximate renderings, there exists no technique to generate it on distributed volume data. We address this issue by proposing a sort-last parallel generation technique for the VDI.
3 The Volumetric Depth Image (VDI)
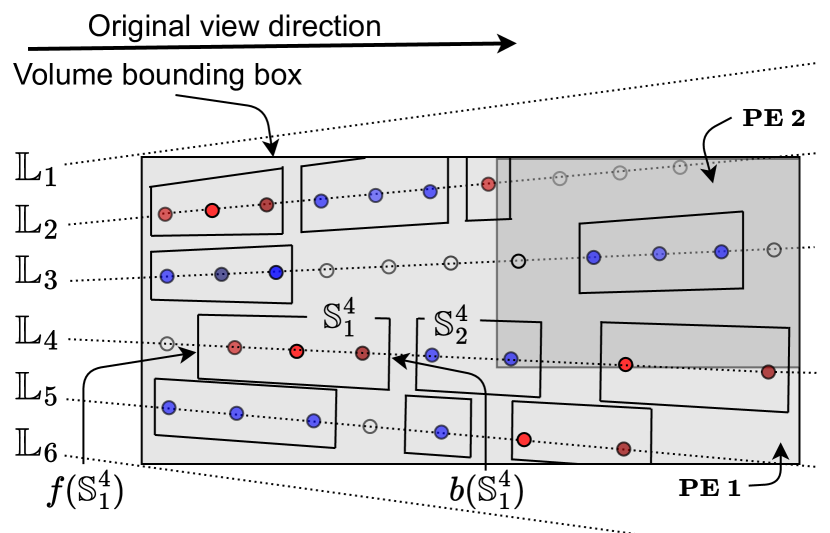
Frey et al. proposed the Volumetric Depth Image [FSE13] as a view-dependent representation of volume data. They call the segments generated along each ray supersegments. Each supersegment is represented by its front and back faces, and , and its color and opacity, and .
Each ray cast into the volume creates a so-called list of up to supersegments where represents the index of the supersegment in the list (Fig. 1). The total number of lists created, , corresponds to the viewport resolution the VDI is generated on, i.e. where is the width of the viewport and the height.
The decomposition of the volume rendering integral into supersegments is governed by a termination criterion , which depends on a sensitivity parameter . Samples along each ray are merged into a supersegment until
| (1) |
where and are the color and the length-adjusted transmittance of the next sample. In words, a sample along the ray is merged into the current unless it differs from the premultiplied color of by more than , in which case a new is started. This criterion therefore generates homogeneous that are important for generating high-quality approximated renderings from changed viewpoints.
The value of the sensitivity parameter that generates an accurate VDI depends on the dataset and on the transfer function. A greedy-optimal per-ray value is found automatically by iterative bisection search. At each iteration, a pass is performed through the volume and the total number of times is met is used to modify the value of for the next iteration; if was met more times than the budget, the value of is increased for the next iteration, and vice-versa. This process continues until a value of is found that maximizes the number of supersegments generated, while staying below the limit of in total. This iterative search enables VDIs to be generated automatically, accurately adapting to the contents of the data and the transfer function.
4 Representing VDIs densely in memory
VDI generation techniques [FSE13] have so far represented VDIs at full resolution in memory. Any lists that pass through empty regions, and therefore do not generate supersegments, or generate less than the maximum number of supersegments, store zeros in the remaining locations. This gives the VDI a regular 3D structure in memory, which improves the performance of raycasting-based rendering as it leads to better memory access patterns. For the parallel compositing of VDIs, which requires communication of VDIs between PEs, however, this generates unnecessary communication overhead.
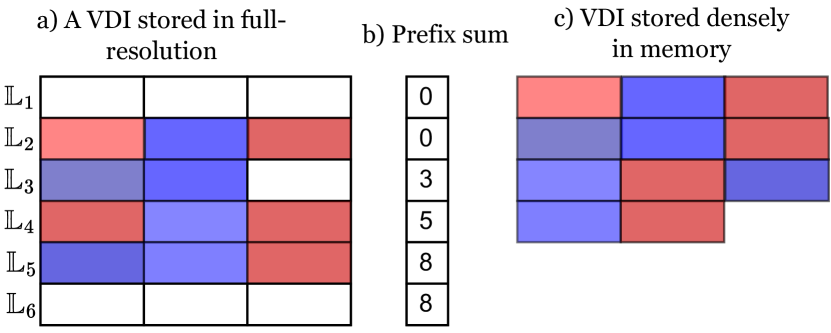
We therefore introduce a technique for generating VDIs that are represented densely in memory for the purpose of parallel compositing. Only those supersegments that are actually generated are stored, as illustrated in Fig. 2. The difference between the memory required for a dense representation, in comparison to the full-resolution representation, is expected to become larger when more PEs are used in our sort-last parallel generation approach. This is because data becoming divided more finely among PEs leads to sub-VDIs that are increasingly sparse.
The procedure for generating dense VDIs begins similarly to full-resolution VDIs. For each ray, a value of is computed using the iterative search (Sec. 3), which would lead to the generation of up to supersegments. No supersegments are actually generated at this stage, but value of , and the number of supersegments that it would generate, are both stored in a buffer. Next, a prefix sum is calculated on this buffer, which records for each list the total number of supersegments generated by all lists before (Fig. 2(b)). The entry i in the prefix buffer, corresponding to the list , therefore records the index in the linearized array at which the supersegments generated by are to be stored. All lists can therefore generate their supersegments in parallel, using the value of determined in the first step. In our implementation, both the search and the supersegment generation steps are parallelized across the lists, while the prefix sum is calculated on the CPU.
Table 1 compares the time to generate a dense VDI representation with the time to generate a full-resolution representation, which avoids the prefix-sum computation step and the GPU kernel synchronization at the end of the per-ray search. We find that generating the dense representation is, in fact, faster than generating the full-resolution representation, with the additional time to compute the prefix sum being more than compensated by the fact that empty supersegments do not need to be written to memory. Although it is possible to render the densely represented VDIs directly, this is significantly slower than rendering VDIs represented at full resolution Fig.4. The VDI we finally stream for rendering after parallel generation is therefore represented at full resolution, but we use the dense representation for parallel compositing.
| Dataset | Full | Dense | Memory Ratio |
|---|---|---|---|
| Kingsnake | 0.38 | 0.28 | 1:0.13 |
| Rayleigh-Taylor | 0.67 | 0.58 | 1:0.42 |
| Richtmyer-Meshkov | 1.55 | 1.43 | 1:0.34 |
5 Generating a VDI on distributed data
We propose a method to generate a VDI representing data that is distributed across Processing Elements (PE), e.g., compute nodes in a cluster, GPUs within a node, etc. The final VDI then represents the entire volume data in the viewport, though it may lie on multiple PEs, and can be transmitted for display.
Our strategy for the parallel generation of VDIs bears similarity to techniques commonly used in the generation of images from distributed data. We follow a sort-last parallel rendering approach [MCEF94], in order to achieve scalability with the volume data size, and to conform to arbitrary domain decompositions, e.g. produced by an in situ simulation. Distributed VDI generation therefore begins with a domain decomposition, with each PE handling a part of the overall volume (Fig.1). Each PE generates a VDI at full viewport resolution, stored densely in memory, corresponding to its local data, called a sub-VDI. The sub-VDIs are composited into a single VDI representing the entire volume data with compositing load balanced in image-space, following the direct-send parallel image compositing algorithm [EP07]. The compositing stage receives supersegments produced on each PE and combines them to produce a total of up to supersegments per list, ensuring that as little detail as possible is lost.
5.1 Phase 1: Distributed generation of sub-VDIs
Distributed sub-VDI generation starts from a domain decomposition of the volume. As in typical sort-last rendering approaches, no transfer of volume data between PEs is performed. A VDI corresponding to the full viewport resolution is generated on each PE. All PEs share the camera viewpoint, from which rays are cast to generate supersegments. The sub-VDI produced is stored densely in memory. As the number of PEs increases and the domain is increasingly finely granular, the size of sub-VDIs produced, in general, decreases, as the sub-VDIs are increasingly sparse, and the dense storage of VDIs eliminates sparse regions.
Any given ray in the view frustum can, in general, pass through the domain of multiple PEs. The search for a value of that would generate a total of up to supersegments along the ray would require communication between PEs at each iteration, adding up the number of supersegments generated on each PE for a value of to modify the value of used for the next iteration. This would lead to expensive communication and synchronization between processes, as the search typically takes several iterations to converge.
To avoid these communication and synchronization costs, we instead choose a strategy that allows each PE to act independently during sub-VDI generation. A PE does not make any assumptions about the number of supersegments that may be generated for a given ray on another PE, and instead generates up to supersegments (we refer to them as sub-) within its own domain. This ensures that the volume rendering integral is never under-resolved for the given budget of . In Fig. 1, for example, ray 2 passes through the domain of both PE 1 and PE 2, but encounters only empty regions in PE 2. All supersegments required along the ray are generated on PE 1 (Fig. 3). Ray 3, on the other hand, generates a full on each PE, thereby over-resolving the ray with 6 sub-, which are then accumulated and reduced during compositing.
Our strategy of generating up to sub- per-ray on every PE it passes through generates more sub- than required, which increases the amount of data to be communicated for compositing. As mentioned previously, we choose this strategy as it allows us to eliminate the costs of communicating and synchronizing all PEs, while still preserving the quality of the genrated VDI, as each section of the ray is resolved with at least as many sub- as will finally be required. If more sub- are generated along the ray overall than required, these can be reduced by accumulating in the parallel compositing phase.
5.2 Phase 2: Parallel compositing of sub-VDIs
The second phase is to composites the distributed sub-VDIs stored on each PE to a single VDI representing the entire volume.
At the end of phase 1, each ray has produced up to sub- on each PE where it intersected the data. These need to be combined to produce a total of up to supersegments for each ray. The first step is therefore to bring the sub-supersegments for a ray from each PE onto a single PE where they can be combined.
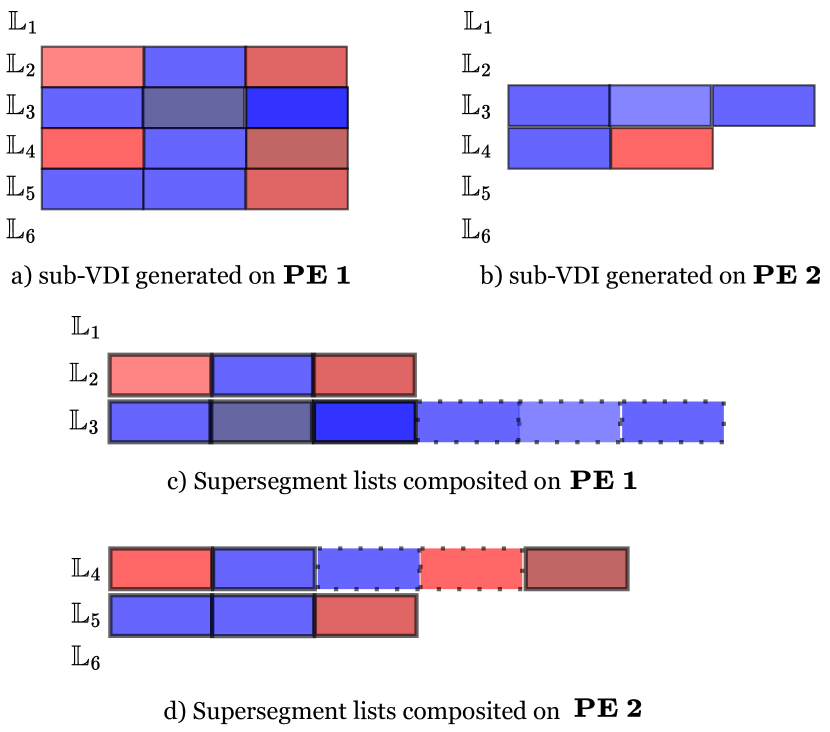
We design an algorithm based on the direct-send approach for compositing sub-images in distributed volume rendering [Neu93]. The number of supersegment lists in the final composited VDI is divided equally among the PEs, with each PE responsible for producing composited supersegment lists for the pixels in its part of the image space. In Fig. 3, for example, both PE 1 and PE 2 composit three each.
This requires communication of the sub- generated during Phase 1 between the PEs. Ech PE sends to all PEs, including itself, the sub- that that PE is responsible for compositing. Differing number of sub-, and therefore differing amounts of memory, in general, are to be sent to each PE. This is achieved by means of an MPI_AllToAllv call, which allows for variable length messages. In addition, the prefix-sum buffer generated for the sub-VDI is also transmitted in chunks correscponding to the image space decomposition, as it is required for reading sub- from the dense representation. Each PE, therefore, now has all the data required for producing the final supersegments for the lists in its part of the image-space.
The first step towards generating the final sub- is determining the order in which the sub- lie along the ray. The sub- in any list cannot be assumed to be contiguous. There may be gaps in depth between consecutive sub- when the ray passes into the domain of another PE, before returning to the first PE. In Fig.1, for instance, Ray 4 generates sub- in PE 2, which are to be placed in-between sub- from PE 1. The input from each PE, however, does already contain sub- in sorted order, since it was created by front-to-back raycasting. Therefore, to iteratively determine the next sub- in a list, the depths of the front-most sub- for this list from all PEs are compared, and the sub- with the lowest starting depth is selected as the next one along the ray, before being popped off the input. The sorted set of sub- for Ray 4 is produced on PE 2, which is responsible for compositing (Fig. 3(d)).
The process of combining the sub- can be formulated as another supersegment generation task, performed by raycasting through the sub-, which are, after all, piecewise constant representations of the original volume. We therefore treat each sub- as a sample along the ray. These samples are raycast through, and combined into homogenous supersegments . Since the sub- are each of different lengths, the process of raycasting through them is analogous to volume raycasting with irregular step size. The transmittance obtained from a sub- is the transmittance stored in sub-, corrected by its length [EHK∗04] as:
| (2) |
where is the adjusted transmittance, is the transmittance stored in sub-, and is the length of sub-.
Empty spaces between sub- are treated as transparent samples along the ray. At each sample, the sub- can either be merged with the previous supersegment, or can begin a new one. This is determined using the same criterion (Eq. 1) as before and therefore requires determining another that leads to the generation of total supersegments. This is again done using a per-ray iterative search (Sec. 3), which therefore requires multiple passes through the sub-. The sub- in in Fig.3(d) are, for example, combined to produce the depicted in Fig.1. Please see the supplementary document for an algorithm describing the process for combining sub- into in detail.
While the sub-VDIs communicated for compositing were represented densely in memory to reduce communication cost, the supersegment lists produced after compositing are represented in full-resolution in memory. The rendering of VDIs is faster when they are represented in full-resolution and we cannot transfer the task of converting from dense to full representation to the display client as it needs to remain responsive for interactive visualization. The lists composited by each PE are therefore stored in the full representation. These can then be gathered using an MPI_Gather call onto the root process, from where they can be streamed for (remote) display, potentially after lossless compression.
5.2.1 Handling Non-Convex Data Decompositions
A key feature of our compositing method is that it can handle non-convex domain decompositions and therefore work with any application-given data distribution.
A non-convex domain decomposition is one where a ray can intersect the boundary of the domain of a PE in more than two points. Such decompositions occur, e.g., in numerical simulations in complex-shaped simulation domains, where the domain decomposition balances the computations in each sub-domain and the communication overhead across PEs [ILZ∗19], not necessarily producing an equal division of data among PEs. Such situations are challenging for distributed volume rendering, due to the non-commutativity of the over operator [PD84]:
| (3) |
This implies that in non-convex domain decompositions, volume rendering cannot composit color across disjoint segments of a ray without requiring communication or synchronization between the PEs, or redistribution of the volume data.
Our method avoids this problem by generating sub- that store world-space front and back depth values along the ray. A sub- necessarily terminates when the ray leaves the domain of a PE. Since sub- are ordered by their depth during compositing, subsequent over operations are done in the correct order. The sub- along a ray can therefore be generated in parallel without synchronization or communication between the PEs.
We note that our method includes non-convex distributed volume rendering as a limit case: when generating only a single sub- per sub-domain intersection, the compositing algorithm can, in addition to placing the supersegments in order, also perform over-operator compositing along the supersegment lists. This effectively performs volume rendering of a plain image on a non-convex domain decomposition without requiring synchronization or communication between PEs.
6 Implementation
We have implemented the algorithms described in the previous sections on top of the open-source rendering framework scenery. Both sub-VDI generation and VDI compositing are implemented as compute shaders via the Vulkan API. For work distribution in the compute shaders, a local work-group size of 16x16 is used, i.e., the screen space is divided into 2D blocks of that size. Upon raycasting, each ray within the block corresponds to a thread on the GPU, and a single pixel on screen.
In our system, the final VDI generated is compressed using LZ4, which we found to provide faster and higher compression than Snappy and ZSTD, before streaming. For a =1920x1080, =20 VDI, this produces 225 MiB of data, while the corresponding uncompressed size, when represented in full-resolution, is 950 MiB.
The full source code is available under the open-source BSD license and can be found at https://github.com/scenerygraphics/scenery-insitu/.
7 Experimental setup
We tested our system on the hidden for double-blind review high-performance computer. Each node contains 8 NVIDIA A100-SXM4 GPUs with 40 GB of DRAM each, 2 AMD EPYC 7352 CPUs with 24 cores each, and 1 TB RAM, and runs Red Hat Enterprise Linux version 7.9. C++ code was compiled using GCC 10.3.0, Java code was run using OpenJDK 11.0.2, and OpenMPI version 4.1.1 was used. Rendering of VDIs, performed to verify the quality of VDIs generated, ran on an Nvidia RTX 3090 on a workstation with Ubuntu 20.04. Processes were always distributed in a block manner across nodes, i.e., all 8 GPUs on a node were occupied before using another node, if necessary.
The datasets used for the evaluation are described in Table 2. All datasets are commonly used for the evaluation of visualization tools and algorithms. In the following tables, the datasets are referred to by their abbreviation. In each case, we used a simple domain decomposition, splitting the volumes along their z-axis equally among PEs.
For the image comparisons in Figures 8-11, we have used scikit-image to calculate both the Structural Similarity Index (SSIM) and the Peak Signal-to-Noise Ratio (PSNR) between the ground-truth DVR renderings and the respective VDI-based renderings.
| Dataset (Abbreviation) | Dimensions | Size | ||
|---|---|---|---|---|
| Kingsnake (KS) |
|
795 MiB | ||
| Rayleigh-Taylor Instability[CCM04] (RT) |
|
2 GiB | ||
| Rotating Stratified Turbulence[RPMM15] (RS) |
|
128 GiB | ||
| Richtmyer-Meshkov[CDD∗02] (RM) |
|
7.5 GiB | ||
| Forced Isotropic Turbulence[YDS12] (FI) |
|
128 GiB |


8 Results and Evaluation
We evaluate the parallel VDI generation on real-world datasets, described in Table 2, testing performance and rendering quality.
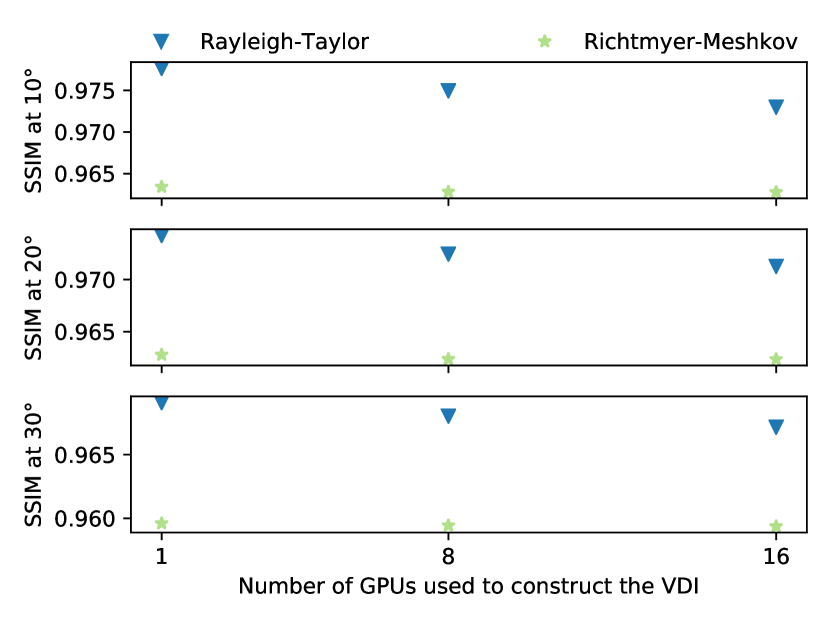
Our sort-last parallel compositing approach models sub- as a discretized representation of the signal along the ray, and composites over them to produce supersegments. To evaluate the accuracy of this approach, we generate VDIs on multiple GPUs and compare the quality of the rendering with a VDI generated on a single GPU, where compositing is not required. To eliminate potential bias in the results caused by the domain decomposition splitting the data among PEs only along along the z-dimension, results are averaged over two different camera viewpoints for VDI generation (), where the second is a 90° rotation of the camera about the dataset from the first, with the camera pointing at the center of the dataset in both cases. VDIs are then rendered for different viewpoints about the viewpoint of generation, and quality is compared to ground truth Direct Volume Rendering (DVR). Fig. 5 presents the results with image similarity measured using the SSIM [WBSS04] metric. While there is a marginal decline in SSIM values, we observe that VDI rendering quality remains similarly high for VDIs generated on multiple GPUs as for a VDI generated on a single GPU. Full resolution images are provided in Supplementary Material for visual comparison.
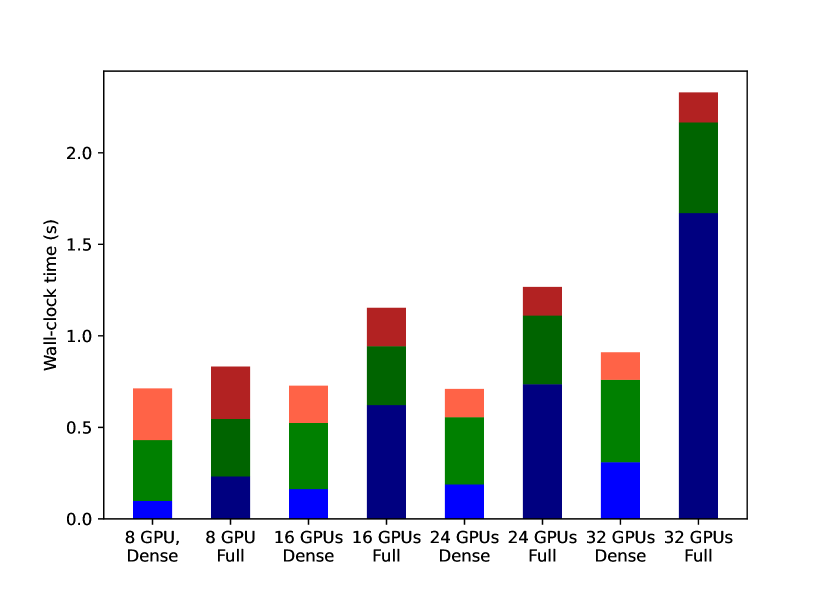
We profile the runtime performance of the individual components of the parallel compositing of sub-VDIs (Sec. 5.2) in order to evaluate performance and to quantify the benefits of using the dense VDI representation over the full-resolution representation for compositing. Fig. 6 plots, for both dense and full representation, the timings of the three stages of parallel compositing; the distribution of sub-VDIs among PEs for compositing, the actual compositing of the sub- into , and the subsequent gather of composited supersegments lists at the root node. An MPI_Barrier was placed before MPI calls for profiling. Measurements were averaged over 50 iterations, with the dataset rotating 10° in camera space at every 10th iteration. VDIs were generated on the FI dataset (Table 2) for the measurements, though we note that the performance of this phase does not scale with the size of the dataset.
We observe that densely represented VDIs provide significantly better scalability with respect to the number of GPUs. At 32 GPUs, the entire parallel compositing process, i.e., all three components together, is 2.6X faster on the dense representation than the full representation. Overall parallel compositing time at 32 GPUs, when using the dense representation, is 1.3X the time at 8 GPUs (dense). Note that for sort-last parallel image compositing algorithms like ours, the ideal case for the compositing step is to have a constant time with increasing PEs, and, in general, compositing times tend to increase with increasing PEs due to increasing communication costs as the total amount of data to be composited also increases. We note that, even with the dense representation, the time to distribute the sub-VDIs at 32 GPUs is 3.2X the time at 8 GPUs (dense), implying that it would likely become the bottleneck at large scale, which is as per expectation for a strong scaling parallel compositing study.
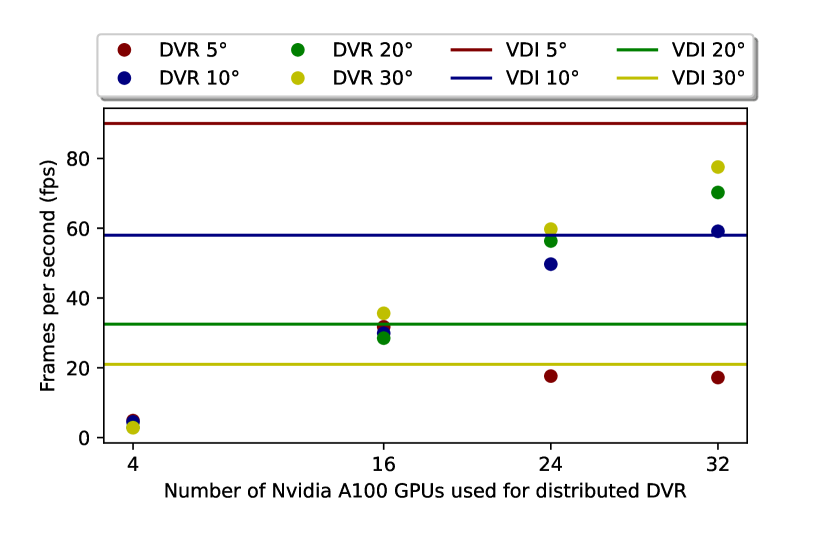
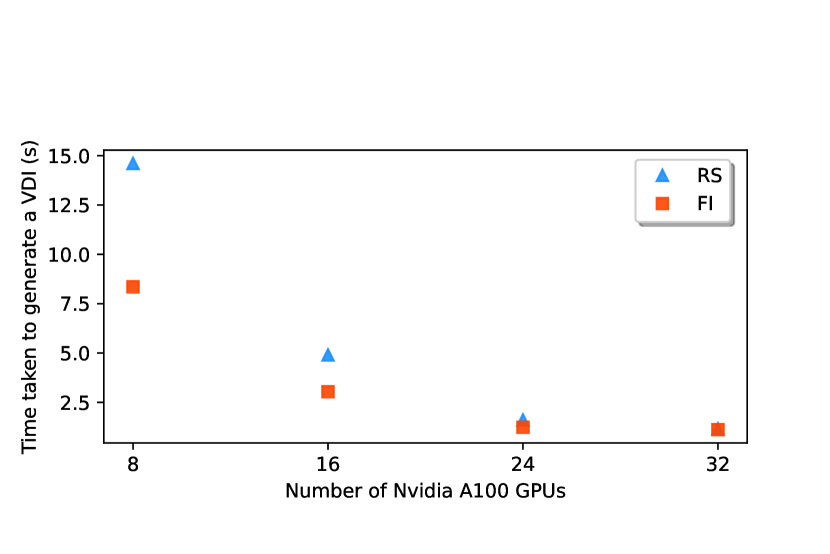
Fig. 7 shows the overall time taken to generate a VDI, with varying number of GPUs, for the large Rotating Stratified Turbulence [RPMM15] (RS) and Forced Isotropic Turbulence [YDS12] (FI), each of which is 128 GiB (Table 2). Once again, results are averaged over two viewpoints which are at 90° rotations about the dataset from each other.
tWe observe wide variation between sub-VDI generation times at the two viewpoints, caused by our unusual domain decomposition, which slices the volume along its z-axis equally among the GPUs. When the camera is placed perpendicular to the slices, all rays pass through the data. When large amount of data is handled by a single PE, this represents a worst case scenario for the adaptive search employed in the sub-VDI generation, as all rays must traverse the large volume multiple times to find an optimal . When VDIs are generated on the RS dataset on 8 GPUs from this viewpoint, average generation times go up to 28 seconds, while if 24 or 32 GPUs are used for the data in the same configuration, VDIs are generated in 2.22 or 1.04 seconds respectively. This worst case scenario for the search, exposed by the slice domain decomposition, leads to the exaggerated speed-ups noticeable in Fig. 7 when comparing 8 and 16, and 16 and 24 GPUs.
At 24 and 32 GPUs, on the other hand, we observe that VDIs are generated in between 1.0 and 2.2 seconds, for both viewpoints and datasets. Generation times are only slightly higher at 32 GPUs than the overall parallel compositing time reported in Fig. 6, indicating that compositing would become the bottleneck at larger scale. This is typical in strong scaling with parallel compositing, also observed by highly optimized implementations like IceT [LMPM21]; as the volume data gets divided into increasing number of PEs, image – or sub-VDI – generation time decreases while communication for compositing increases.
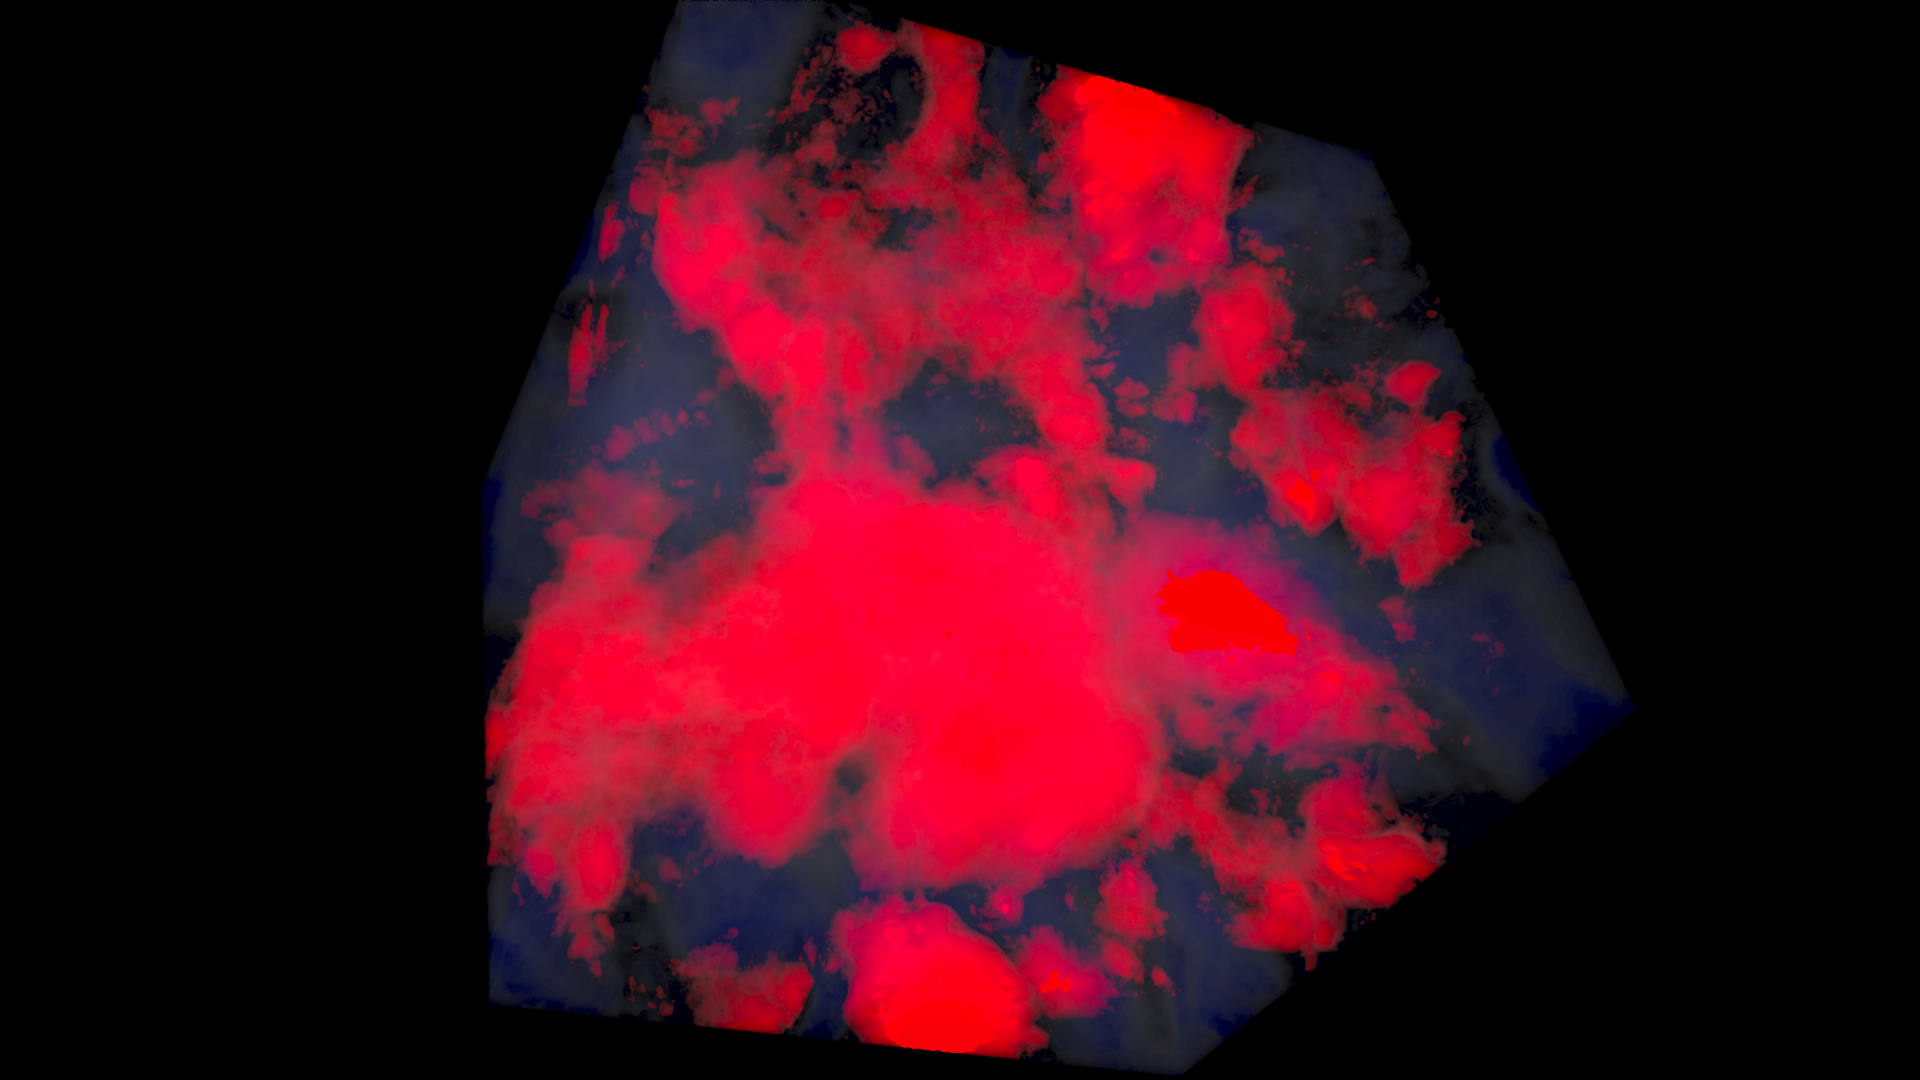
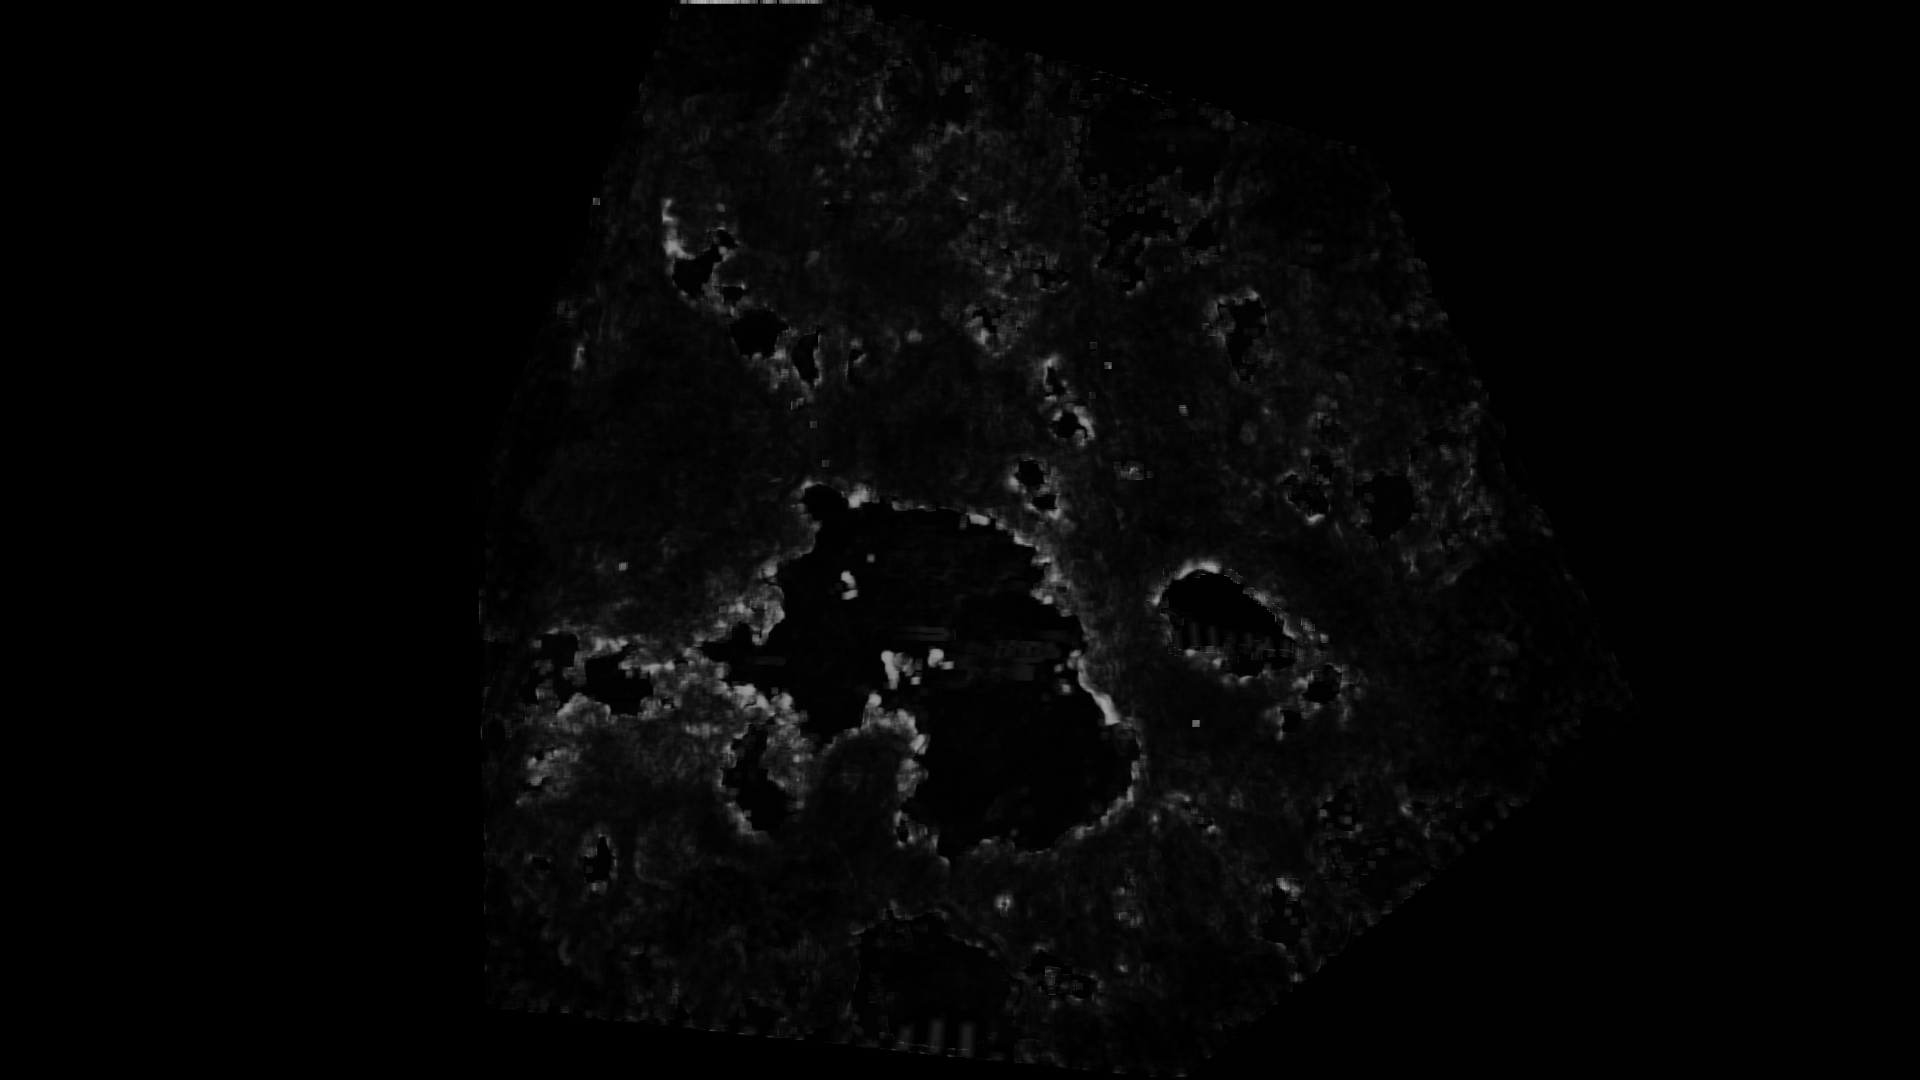
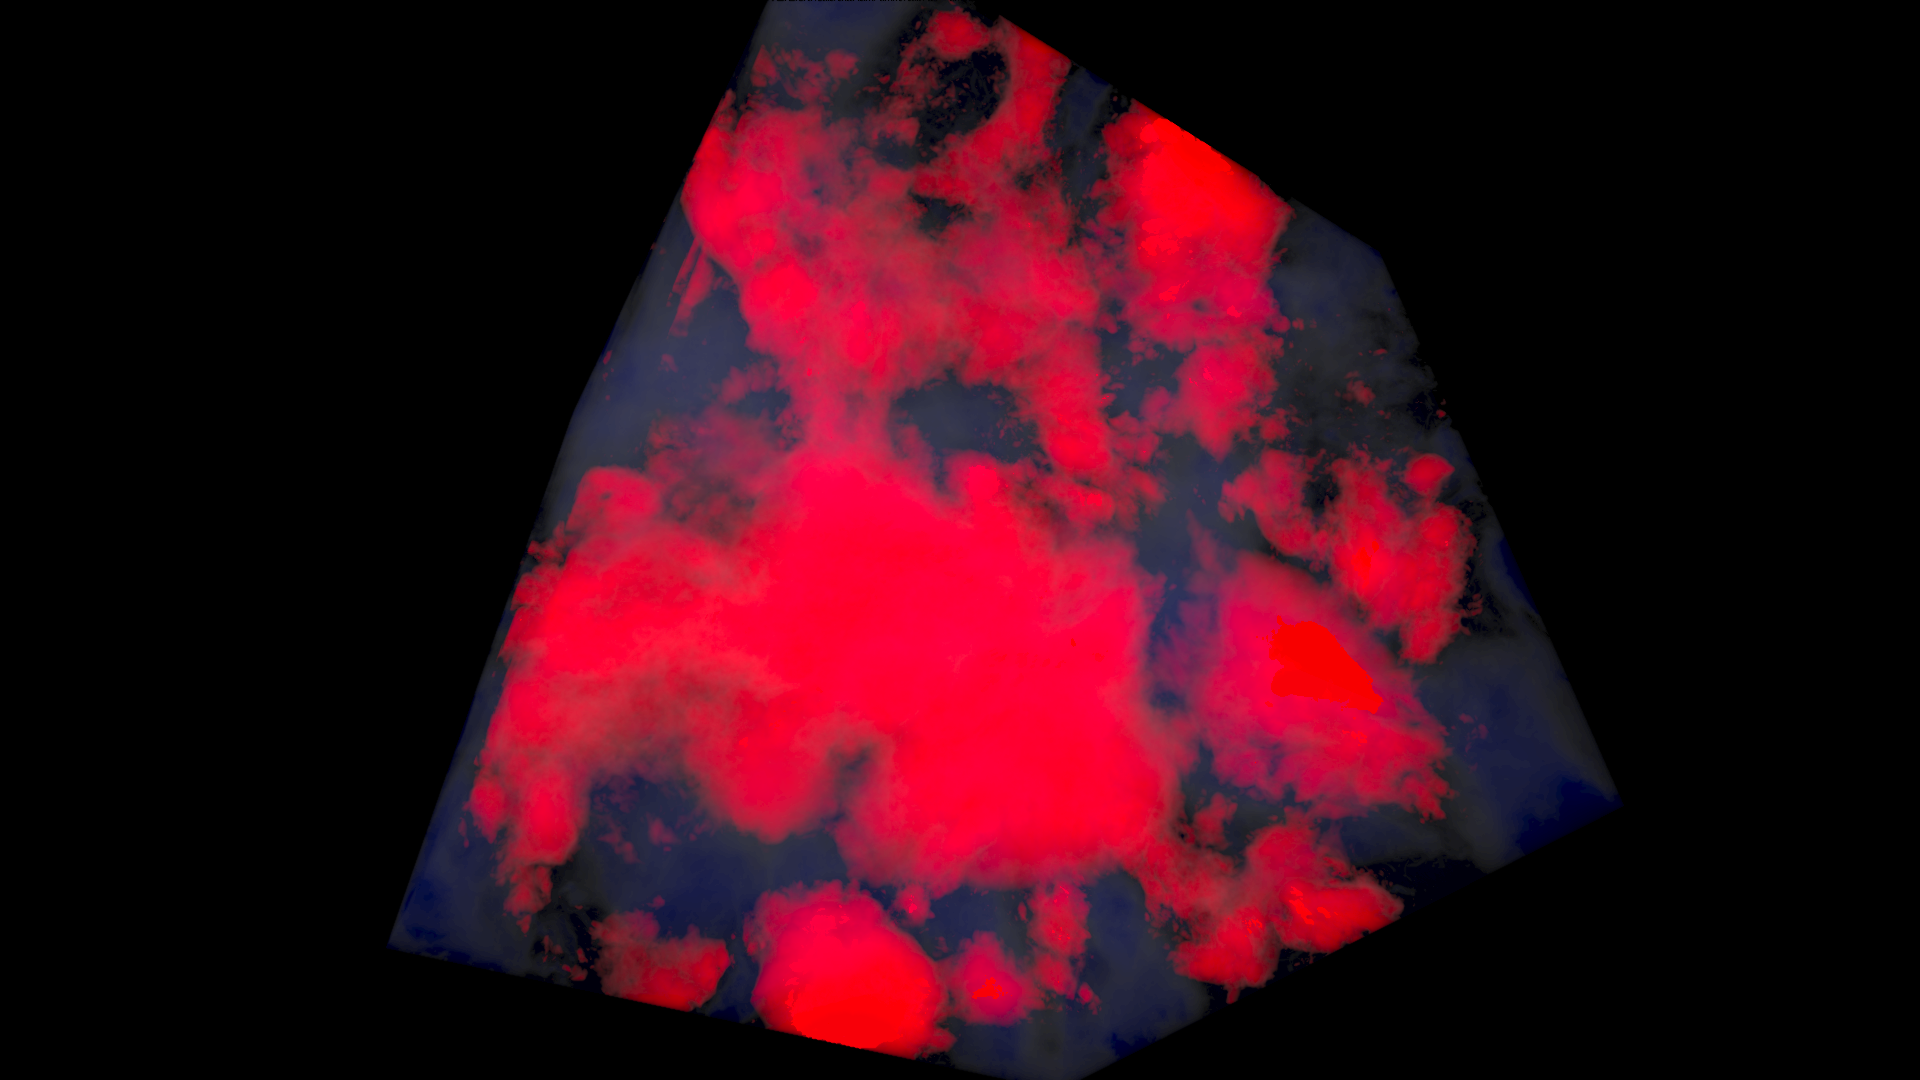
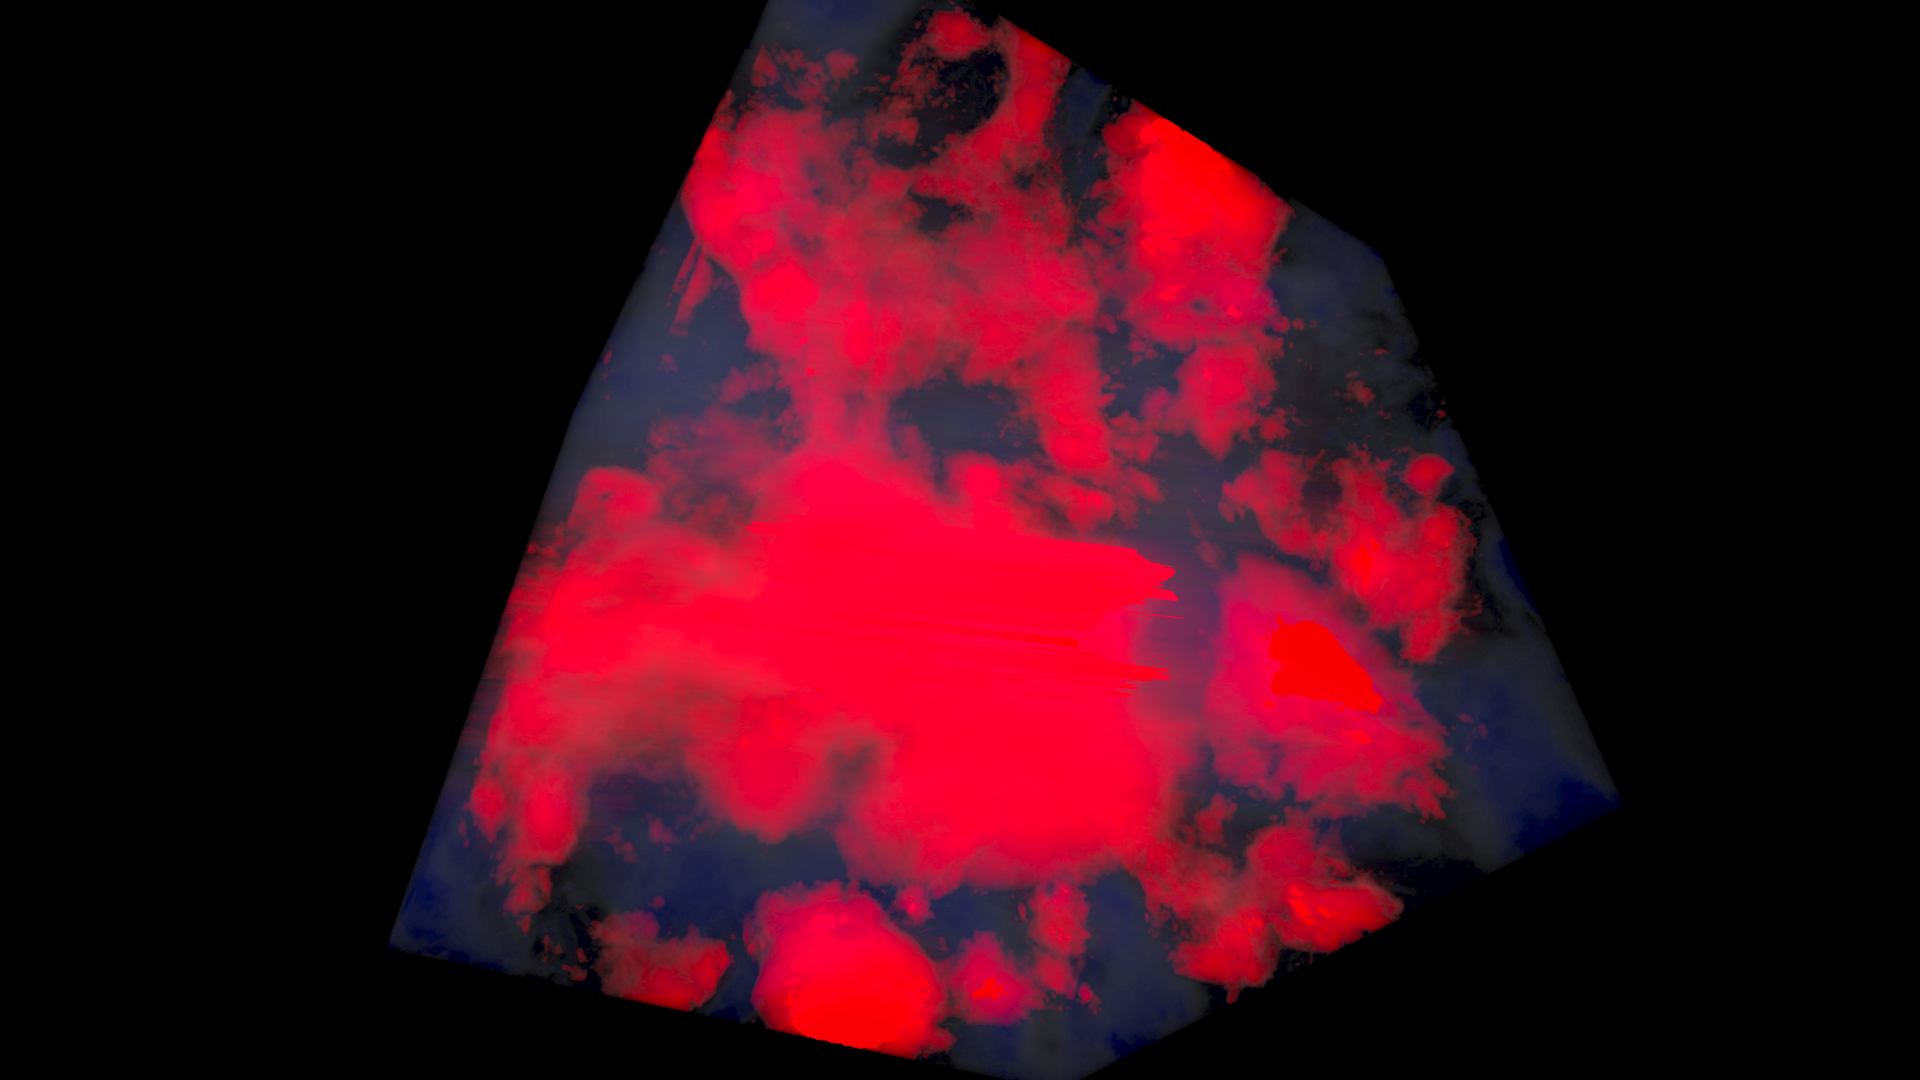
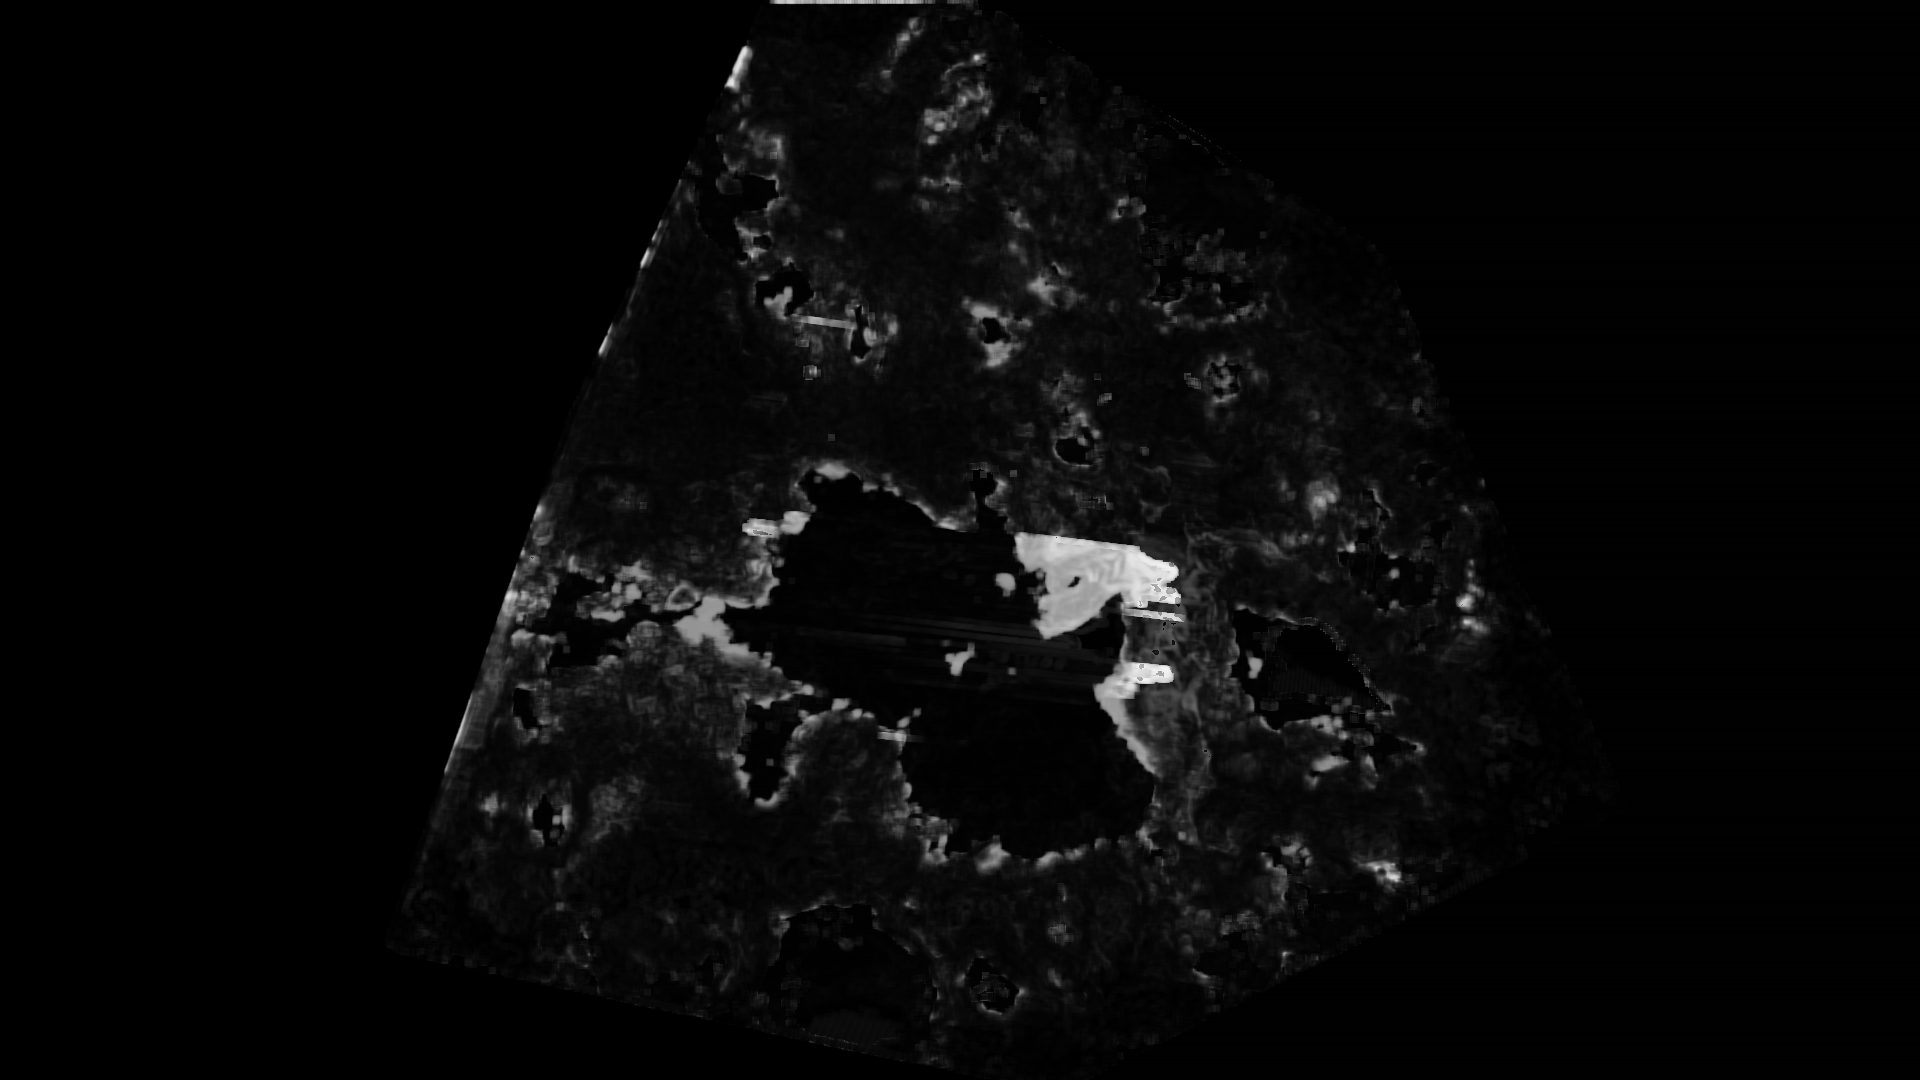
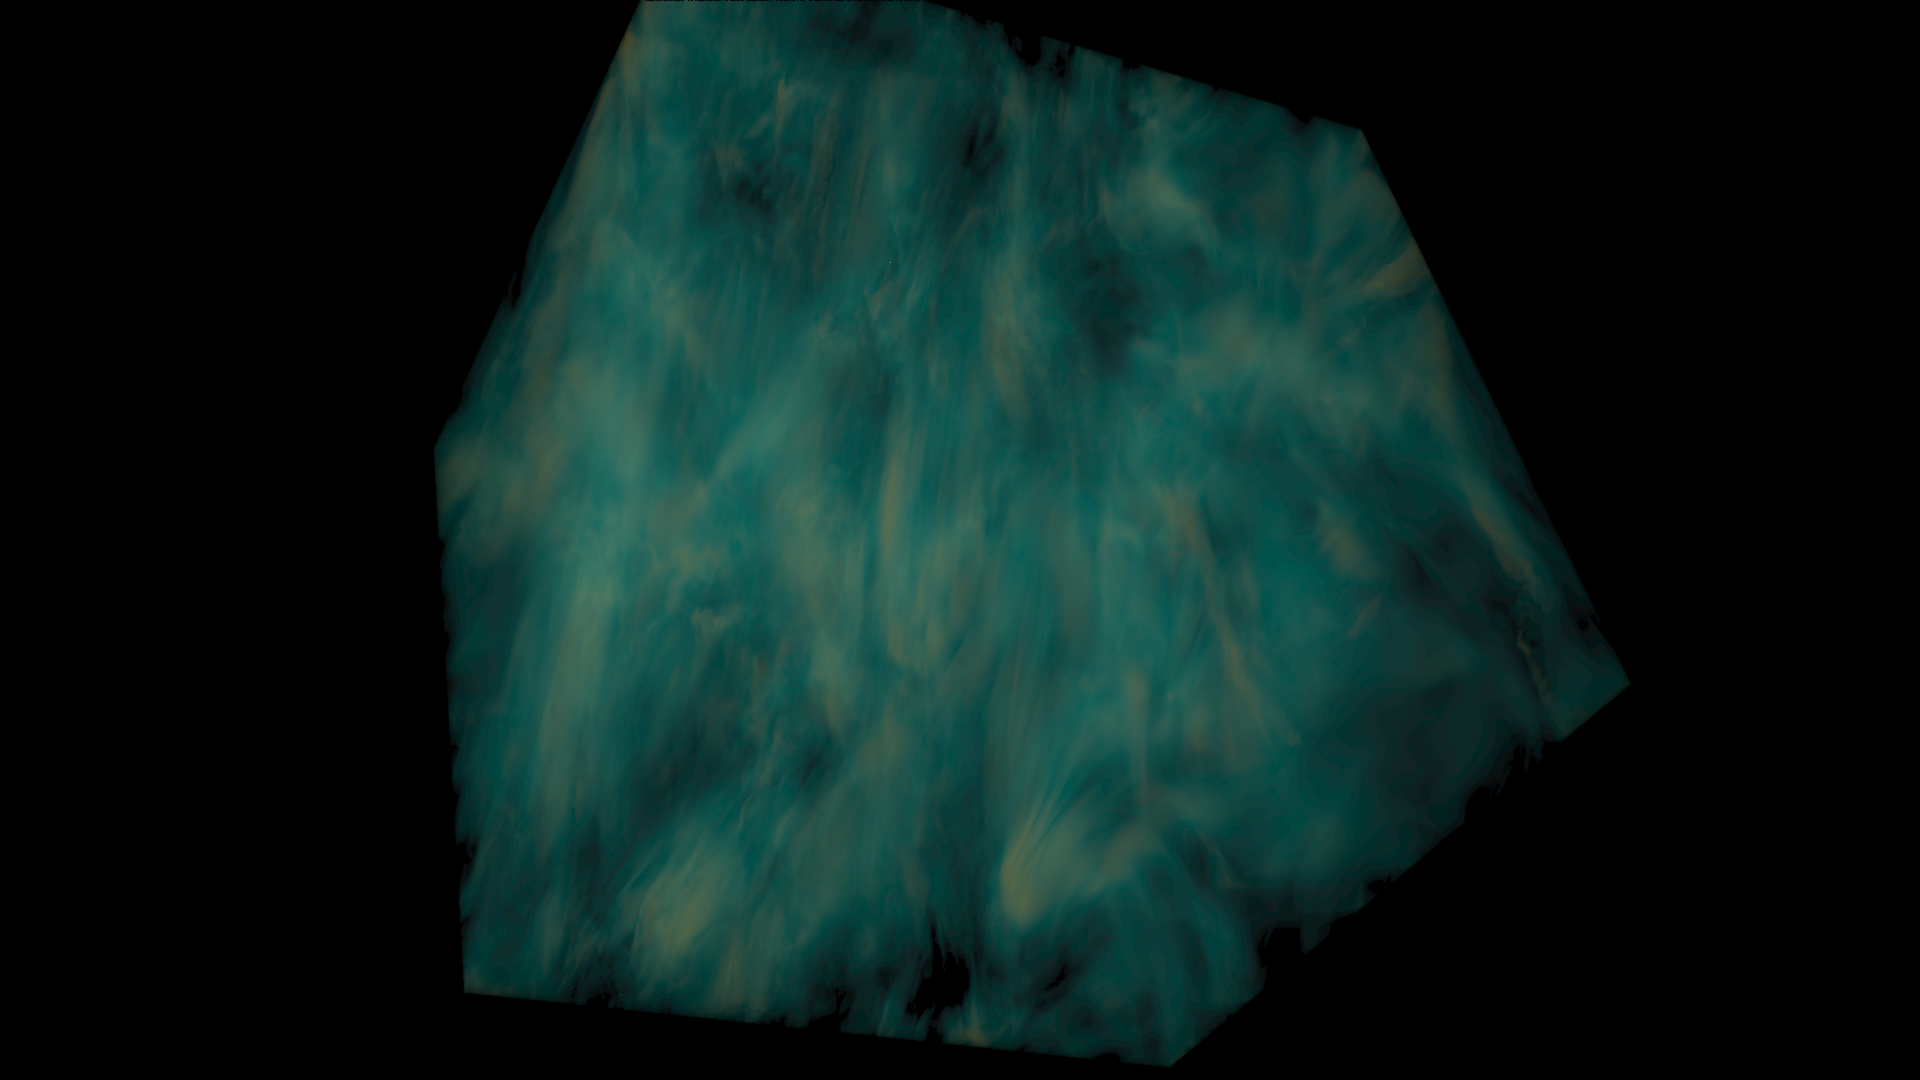
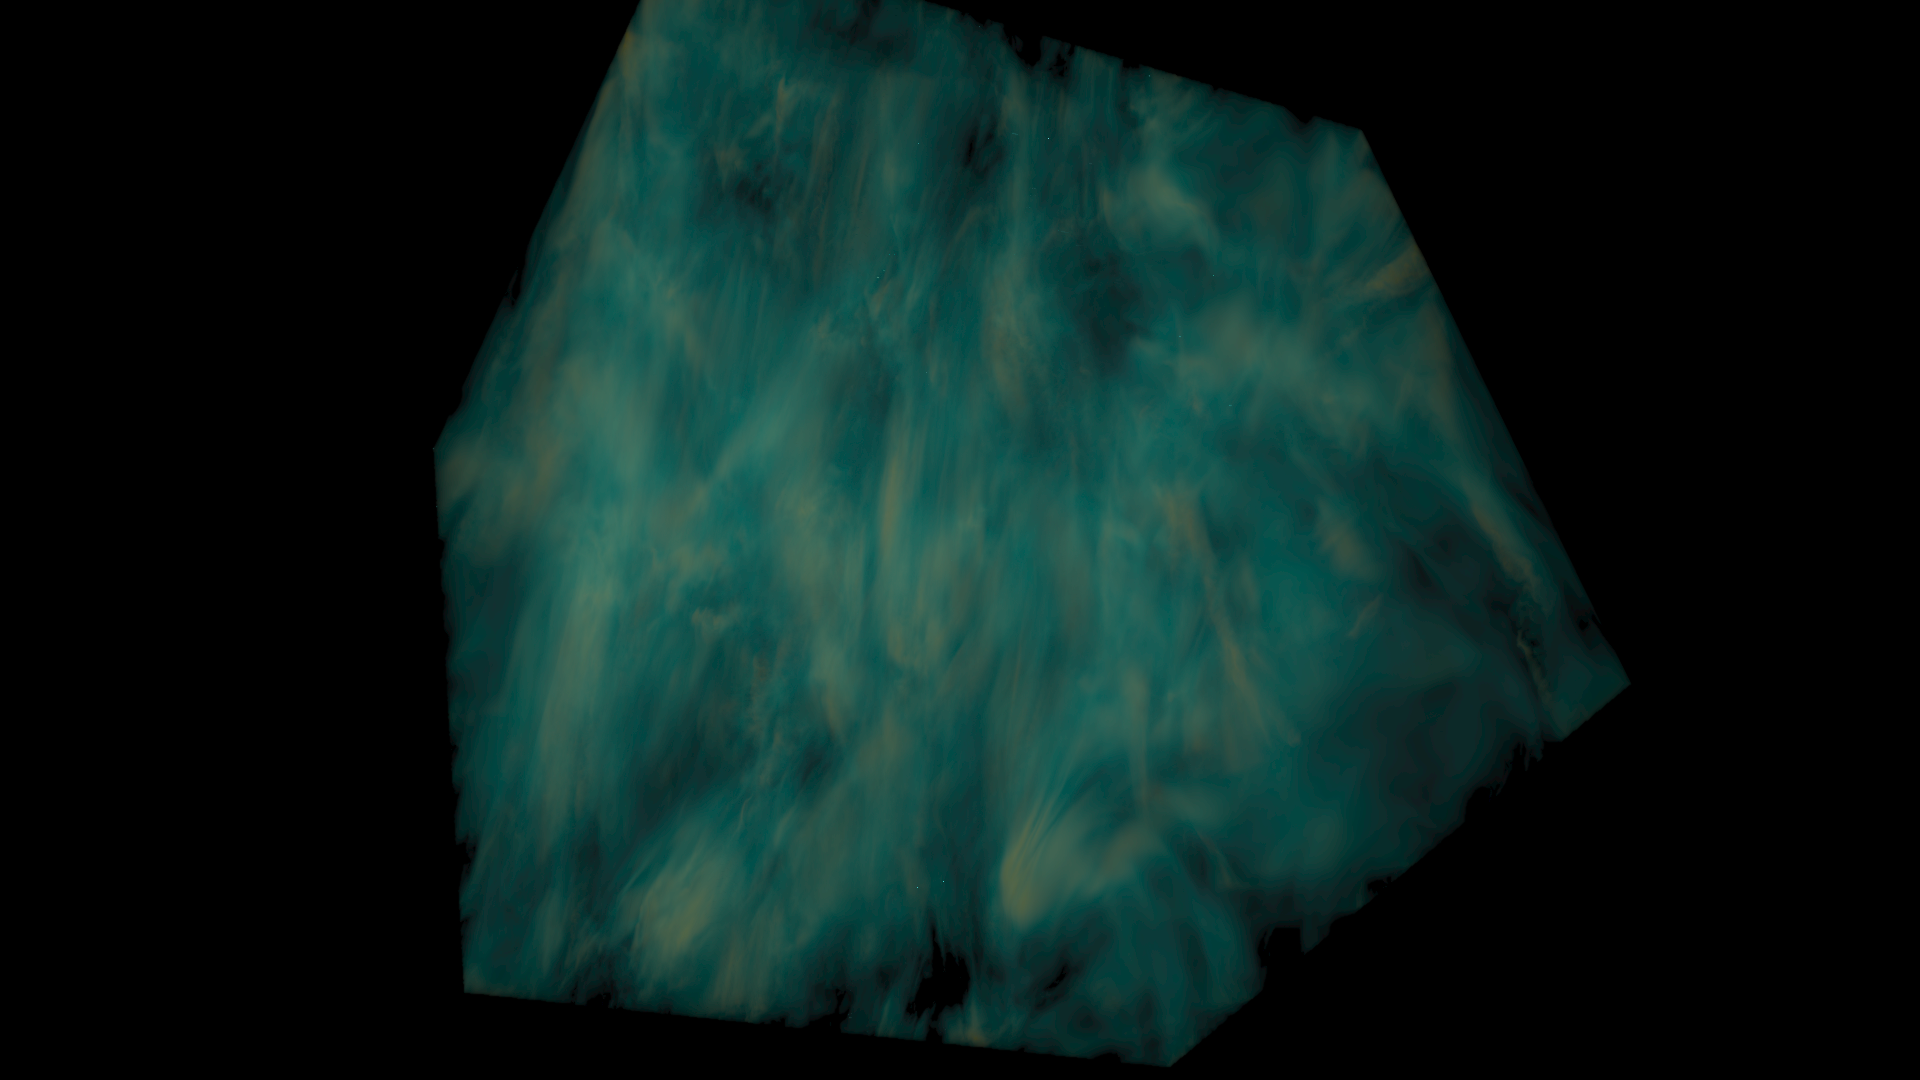
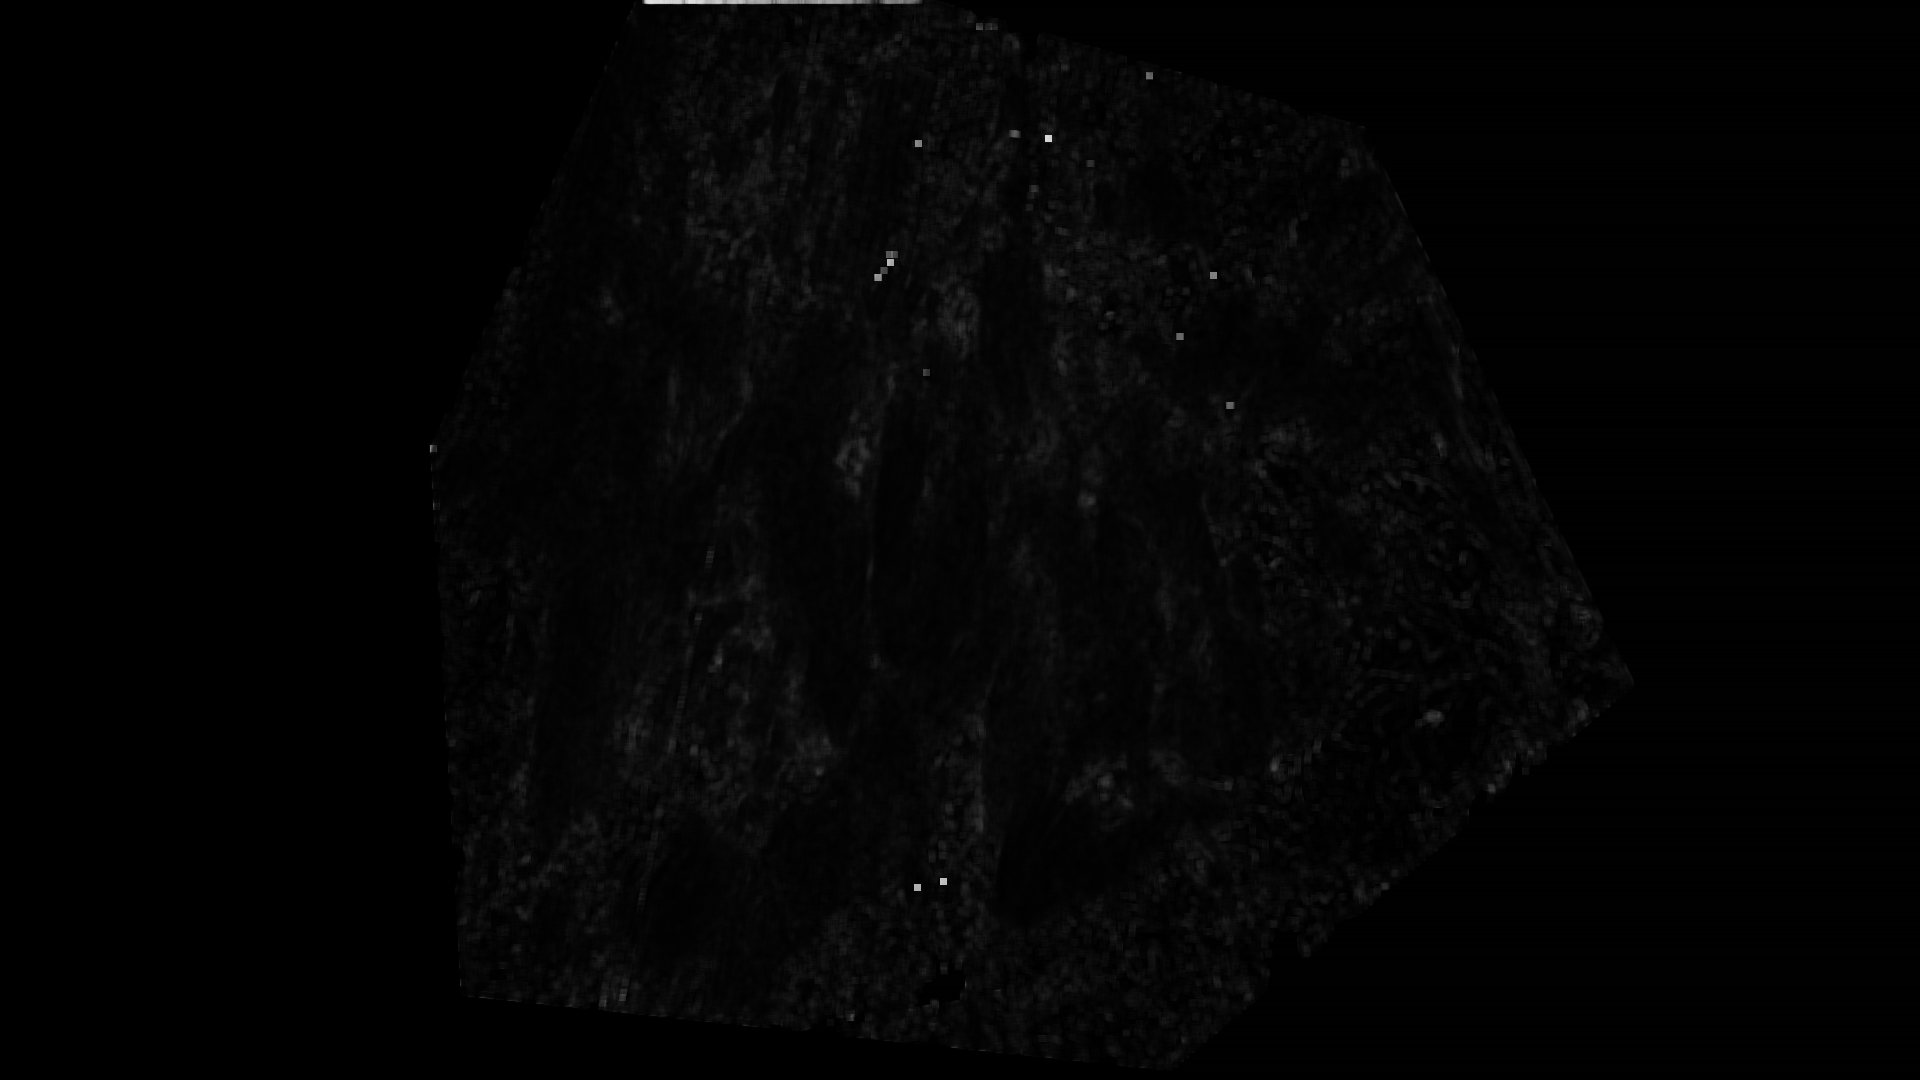
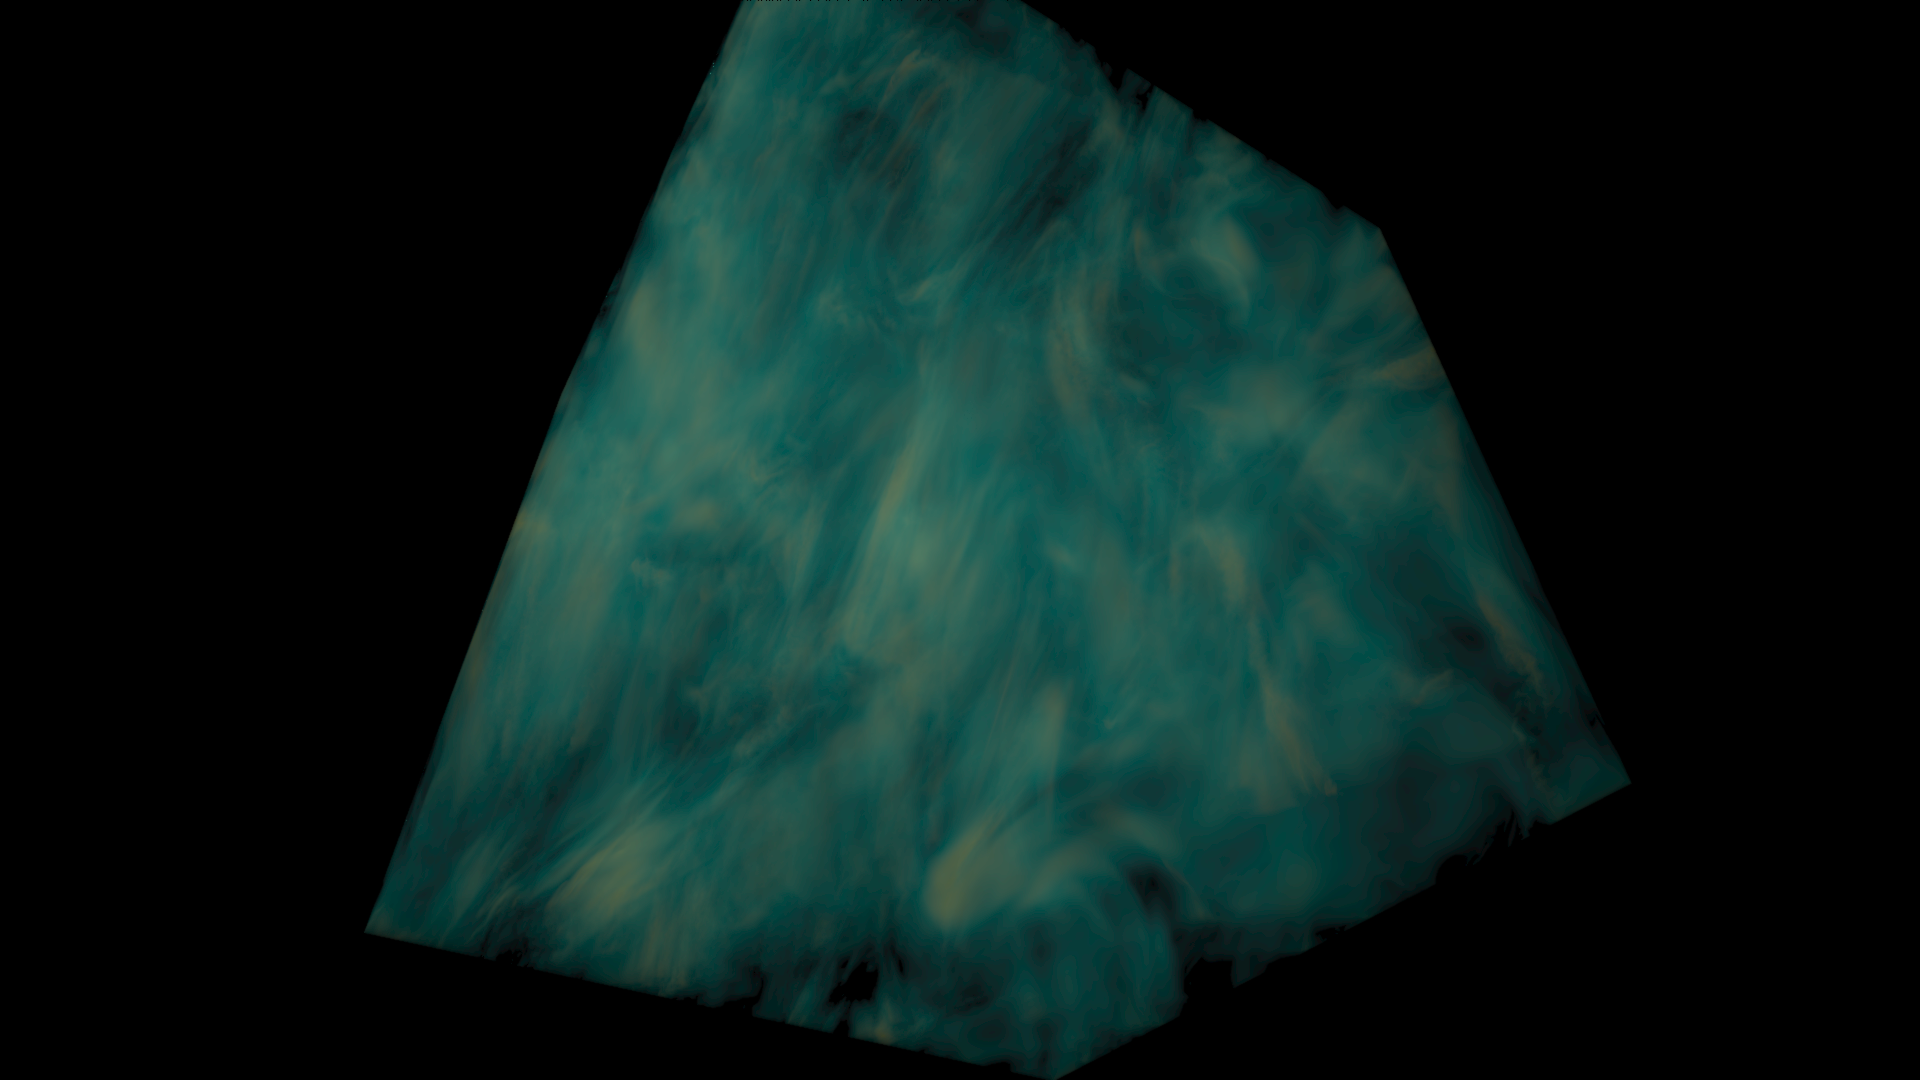
Once the final VDI is generated, it can be streamed out for interactive rendering. Fig. 8-11 show rendering quality of the VDIs generated on the RS and FI datasets, compared to ground truth distributed DVR, along with the corresponding SSIM and PSNR metric. In the figures, we show both renderings together with the SSIM-based difference image - brighter color means higher difference. While a wide variation was noticed in the VDI generation performance between the two viewpoints of generation, the rendering quality of both VDIs remained similarly high. Full resolution images are provided in Supplementary Material for comparison.
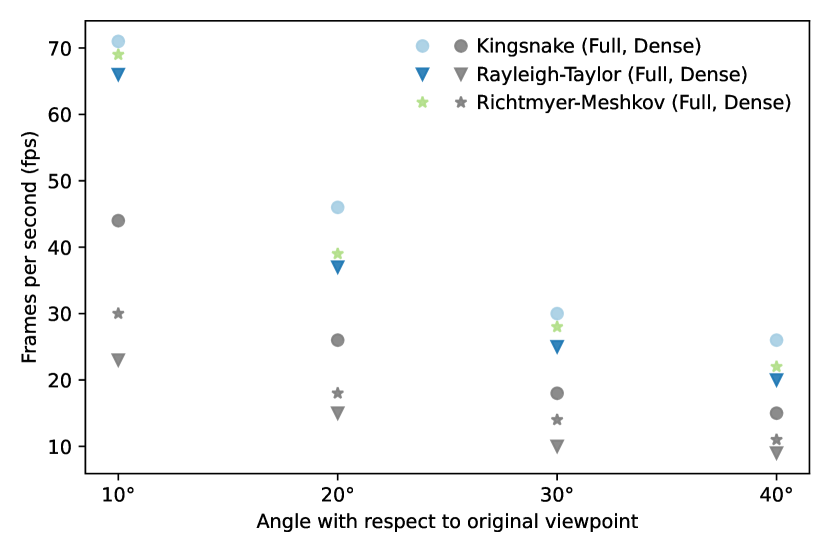
We compare the performance of the VDI rendering, running locally on the user’s display, to the performance of distributed DVR. VDIs are generated on the RS dataset on the two previously described viewpoints, and rendered at increasing deviations from the viewpoint of generation . Frame rates are compared against distributed DVR from the same viewpoint, and averaged over the two . While distributed DVR consists of two phases, the image generation on the individual PEs followed by parallel compositing, Fig. 12 reports DVR frame rates only for the first image generation phase, i.e., excluding compositing, and therefore always overestimates the DVR frame rates. We observe that at small deviations from , VDI rendering is still faster than DVR. While DVR produces higher frame rates for larger viewpoint deviations, this requires a higher number of GPUs, at which stage the compositing may also limit frame rates. We also observe high variability in DVR frame rates, another consequence of the slice domain decomposition. While we chose the decomposition for technical reasons, we argue that this may resemble a practical scenario where load balance may not be optimal for the visualization, as, for example, in the in situ visualization of a running simulation. The rendering of the VDI, on the other hand, would remain responsive as it takes place on the user’s local machine, albeit the generation time of the VDI itself would be affected by the domain decomposition. The rendering of the VDI also has the advantage of not being encumbered by the network latency to the cluster. Please see Supplementary Material for interactive videos on both the RS and FI datasets.
9 Conclusions
We have presented a sort-last parallel generation approach for Volumetric Depth Images, enabling responsive visualization of large, distributed volumes at high, consistent frame rates. To provide scalability to the parallel compositing, we introduced a technique to represent the VDIs densely in memory, i.e., storing only the supersegments that were actually generated. We found that not only did this significantly reduce communication costs during compositing (Fig. 6), but also the densely represented VDIs were marginally faster to generate than those represented in full-resolution (Table 1). At the same time, the final VDIs generated by our parallel compositing approach were represented in full-resolution, as we found this was faster to render than the dense representation (Fig. 4). Our parallel compositing was found to scale reasonably well, overall compositing time only 1.3X at 32 GPUs compared to 8 GPUs.
Sort-last generation was enabled by our parallel compositing approach, which modeled the sub- received for compositing as discretized samples, of varying length, of the signal along the ray, and -composited over them, dividing them into the final supersegments along the ray. This process was found to produce accurate results (Fig. 5), even on large datasets (Figs. 8-11), and allowed us to generate sub-VDIs on the PEs in parallel, without any communication during that phase. Although we did not benchmark it, we believe this is much more optimal than communicating and synchronizing between all PEs at every iteration of the search, since there are usually several iterations, and the search is an essential step for generating accurate VDIs automatically.
Our slice-based domain decomposition, however, revealed the weaknesses in the search strategy used for generating VDIs, the worst case configurations leading to sub-VDI generation times in the tens of seconds. Future work could look at determining faster methods to automatically and accurately generate supersegments along a ray.
We argue, however, that challenging domain decompositions also adversely affect frame rates of interactive distributed volume rendering, and it is in these scenarios where the VDI is particularly useful; once generated, it can provide high, consistent visualization frame rates, unencumbered by network latency to the compute cluster. Even in the most challenging camera configurations, VDIs were generated in between 1 and 2 seconds, when 24 or 32 GPUs were used for the 128 GiB volumes.
These generation times are on par with, or lower than, the time-steps of several numerical simulations. We presented results here on data loaded from a file, in order to test our algorithms in isolation, but we see the distributed generation of the VDI finding application in the interactive in situ visualization and steering of numerical simulations. We also see potential applications with the Cinema database [AJO∗14], commonly used for explorative post-hoc visualization, where it could be used to reduce the size of the database, by reducing the need for images generated from a variety of camera viewpoints.
Overall, we believe the methods we have proposed represent a significant advance in the field of view-dependent volume representations, such as the VDI, and their use on large, distributed data.
References
- [AJO∗14] Ahrens J., Jourdain S., O’Leary P., Patchett J., Rogers D. H., Petersen M.: An image-based approach to extreme scale in situ visualization and analysis. In Proceedings of the International Conference for High Performance Computing, Networking, Storage and Analysis (Piscataway, NJ, USA, 2014), SC ’14, IEEE Press, pp. 424–434. URL: https://doi.org/10.1109/SC.2014.40, doi:10.1109/SC.2014.40.
- [BJNN97] Brady M., Jung K., Nguyen H., Nguyen T.: Two-phase perspective ray casting for interactive volume navigation. In Proceedings. Visualization ’97 (Cat. No. 97CB36155) (1997), pp. 183–189. doi:10.1109/VISUAL.1997.663878.
- [BMT∗21] Barron J. T., Mildenhall B., Tancik M., Hedman P., Martin-Brualla R., Srinivasan P. P.: Mip-nerf: A multiscale representation for anti-aliasing neural radiance fields. In 2021 IEEE/CVF International Conference on Computer Vision (ICCV) (2021), pp. 5835–5844. doi:10.1109/ICCV48922.2021.00580.
- [BWHG17] Biedert T., Werner K., Hentschel B., Garth C.: A Task-Based Parallel Rendering Component For Large-Scale Visualization Applications. In Eurographics Symposium on Parallel Graphics and Visualization (2017), Telea A., Bennett J., (Eds.), The Eurographics Association. doi:10.2312/pgv.20171094.
- [CCM04] Cook A. W., Cabot W., Miller P. L.: The mixing transition in Rayleigh-Taylor instability. Journal of Fluid Mechanics 511 (2004), 333–362. doi:10.1017/S0022112004009681.
- [CDD∗02] Cohen R. H., Dannevik W. P., Dimits A. M., Eliason D. E., Mirin A. A., Zhou Y., Porter D. H., Woodward P. R.: Three-dimensional simulation of a richtmyer–meshkov instability with a two-scale initial perturbation. Physics of Fluids 14, 10 (2002), 3692–3709. URL: https://doi.org/10.1063/1.1504452, arXiv:https://doi.org/10.1063/1.1504452, doi:10.1063/1.1504452.
- [CDM06] Childs H., Duchaineau M., Ma K.-L.: A scalable, hybrid scheme for volume rendering massive data sets. In Proceedings of the 6th Eurographics Conference on Parallel Graphics and Visualization (Goslar, DEU, 2006), EGPGV ’06, Eurographics Association, p. 153–161. doi:10.5555/2386124.2386151.
- [CMF05] Cavin X., Mion C., Filbois A.: COTS cluster-based sort-last rendering: performance evaluation and pipelined implementation. In VIS 05. IEEE Visualization, 2005. (2005), pp. 111–118. doi:10.1109/VISUAL.2005.1532785.
- [EHK∗04] Engel K., Hadwiger M., Kniss J. M., Lefohn A. E., Salama C. R., Weiskopf D.: Real-time volume graphics. In ACM SIGGRAPH 2004 Course Notes (New York, NY, USA, 2004), SIGGRAPH ’04, Association for Computing Machinery, p. 29–es. URL: https://doi.org/10.1145/1103900.1103929, doi:10.1145/1103900.1103929.
- [EP07] Eilemann S., Pajarola R.: Direct send compositing for parallel sort-last rendering. In Proceedings of the 7th Eurographics Conference on Parallel Graphics and Visualization (Goslar, DEU, 2007), EGPGV ’07, Eurographics Association, p. 29–36. doi:10.5555/2386154.2386158.
- [FFSE14] Fernandes O., Frey S., Sadlo F., Ertl T.: Space-time volumetric depth images for in-situ visualization. In 2014 IEEE 4th Symposium on Large Data Analysis and Visualization (LDAV) (2014), pp. 59–65. doi:10.1109/LDAV.2014.7013205.
- [FSE13] Frey S., Sadlo F., Ertl T.: Explorable volumetric depth images from raycasting. In 2013 XXVI Conference on Graphics, Patterns and Images (2013), pp. 123–130. doi:10.1109/SIBGRAPI.2013.26.
- [GGI∗22] Gupta A., Günther U., Incardona P., Reina G., Frey S., Gumhold S., Sbalzarini I. F.: Efficient raycasting of view-dependent piecewise constant representations of volumetric data, 2022. URL: https://arxiv.org/abs/2206.08660, doi:10.48550/ARXIV.2206.08660.
- [GPG∗19] Günther U., Pietzsch T., Gupta A., Harrington K. I., Tomancak P., Gumhold S., Sbalzarini I. F.: scenery: Flexible virtual reality visualization on the java vm. In 2019 IEEE Visualization Conference (VIS) (2019), pp. 1–5. doi:10.1109/VISUAL.2019.8933605.
- [HBC12] Howison M., Bethel E. W., Childs H.: Hybrid parallelism for volume rendering on large-, multi-, and many-core systems. IEEE Transactions on Visualization and Computer Graphics 18, 1 (2012), 17–29. doi:10.1109/TVCG.2011.24.
- [ILZ∗19] Incardona P., Leo A., Zaluzhnyi Y., Ramaswamy R., Sbalzarini I. F.: Openfpm: A scalable open framework for particle and particle-mesh codes on parallel computers. Computer Physics Communications 241 (2019), 155–177. URL: https://www.sciencedirect.com/science/article/pii/S0010465519300852, doi:https://doi.org/10.1016/j.cpc.2019.03.007.
- [KM05] Kaufman A., Mueller K.: 7 - overview of volume rendering. In Visualization Handbook, Hansen C. D., Johnson C. R., (Eds.). Butterworth-Heinemann, Burlington, 2005, pp. 127–174. URL: https://www.sciencedirect.com/science/article/pii/B9780123875822500095, doi:https://doi.org/10.1016/B978-012387582-2/50009-5.
- [Lev88] Levoy M.: Display of surfaces from volume data. IEEE Computer Graphics and Applications 8, 3 (1988), 29–37. doi:10.1109/38.511.
- [LMPM21] Lipinksi R., Moreland K., Papka M. E., Marrinan T.: GPU-based image compression for efficient compositing in distributed rendering applications. In 2021 IEEE 11th Symposium on Large Data Analysis and Visualization (LDAV) (2021), pp. 43–52. doi:10.1109/LDAV53230.2021.00012.
- [LRBR16] Lochmann G., Reinert B., Buchacher A., Ritschel T.: Real-time Novel-view Synthesis for Volume Rendering Using a Piecewise-analytic Representation. In Vision, Modeling & Visualization (2016), Hullin M., Stamminger M., Weinkauf T., (Eds.), The Eurographics Association. doi:10.2312/vmv.20161346.
- [MCEF94] Molnar S., Cox M., Ellsworth D., Fuchs H.: A sorting classification of parallel rendering. IEEE Computer Graphics and Applications 14, 4 (1994), 23–32. doi:10.1109/38.291528.
- [MPHK93] Ma K.-L., Painter J., Hansen C., Krogh M.: A data distributed, parallel algorithm for ray-traced volume rendering. In Proceedings of 1993 IEEE Parallel Rendering Symposium (1993), pp. 15–22. doi:10.1109/PRS.1993.586080.
- [MPHK94] Ma K.-L., Painter J., Hansen C., Krogh M.: Parallel volume rendering using binary-swap compositing. IEEE Computer Graphics and Applications 14, 4 (1994), 59–68. doi:10.1109/38.291532.
- [MST∗21] Mildenhall B., Srinivasan P. P., Tancik M., Barron J. T., Ramamoorthi R., Ng R.: Nerf: Representing scenes as neural radiance fields for view synthesis. Commun. ACM 65, 1 (dec 2021), 99–106. URL: https://doi.org/10.1145/3503250, doi:10.1145/3503250.
- [Neu93] Neumann U.: Parallel volume-rendering algorithm performance on mesh-connected multicomputers. In Proceedings of the 1993 Symposium on Parallel Rendering (New York, NY, USA, 1993), PRS ’93, Association for Computing Machinery, p. 97–104. URL: https://doi.org/10.1145/166181.166196, doi:10.1145/166181.166196.
- [PCPMMN21] Pumarola A., Corona E., Pons-Moll G., Moreno-Noguer F.: D-nerf: Neural radiance fields for dynamic scenes. In 2021 IEEE/CVF Conference on Computer Vision and Pattern Recognition (CVPR) (2021), pp. 10313–10322. doi:10.1109/CVPR46437.2021.01018.
- [PD84] Porter T., Duff T.: Compositing digital images. In Proceedings of the 11th Annual Conference on Computer Graphics and Interactive Techniques (New York, NY, USA, 1984), SIGGRAPH ’84, Association for Computing Machinery, p. 253–259. URL: https://doi.org/10.1145/800031.808606, doi:10.1145/800031.808606.
- [PGR∗09] Peterka T., Goodell D., Ross R., Shen H.-W., Thakur R.: A configurable algorithm for parallel image-compositing applications. In Proceedings of the Conference on High Performance Computing Networking, Storage and Analysis (New York, NY, USA, 2009), SC ’09, Association for Computing Machinery. URL: https://doi.org/10.1145/1654059.1654064, doi:10.1145/1654059.1654064.
- [PYR∗09] Peterka T., Yu H., Ross R., Ma K.-L., Latham R.: End-to-end study of parallel volume rendering on the ibm blue gene/p. In 2009 International Conference on Parallel Processing (2009), pp. 566–573. doi:10.1109/ICPP.2009.27.
- [RPD22] Rapp T., Peters C., Dachsbacher C.: Image-based visualization of large volumetric data using moments. IEEE Transactions on Visualization and Computer Graphics 28, 6 (2022), 2314–2325. doi:10.1109/TVCG.2022.3165346.
- [RPMM15] Rosenberg D., Pouquet A., Marino R., Mininni P. D.: Evidence for bolgiano-obukhov scaling in rotating stratified turbulence using high-resolution direct numerical simulations. Physics of Fluids 27, 5 (2015), 055105. URL: https://doi.org/10.1063/1.4921076, arXiv:https://doi.org/10.1063/1.4921076, doi:10.1063/1.4921076.
- [SGHS98] Shade J., Gortler S., He L.-w., Szeliski R.: Layered Depth Images. In Proceedings of the 25th Annual Conference on Computer Graphics and Interactive Techniques (New York, NY, USA, 1998), SIGGRAPH ’98, Association for Computing Machinery, p. 231–242. URL: https://doi.org/10.1145/280814.280882, doi:10.1145/280814.280882.
- [SSP04] Simon A., Smith R., Pawlicki R.: Omnistereo for panoramic virtual environment display systems. In IEEE Virtual Reality 2004 (2004), pp. 67–279. doi:10.1109/VR.2004.1310057.
- [SSS16] Stone J. E., Sherman W. R., Schulten K.: Immersive molecular visualization with omnidirectional stereoscopic ray tracing and remote rendering. In 2016 IEEE International Parallel and Distributed Processing Symposium Workshops (IPDPSW) (2016), pp. 1048–1057. doi:10.1109/IPDPSW.2016.121.
- [TCM10a] Tikhonova A., Correa C. D., Ma K.-L.: Explorable images for visualizing volume data. In 2010 IEEE Pacific Visualization Symposium (PacificVis) (2010), pp. 177–184. doi:10.1109/PACIFICVIS.2010.5429595.
- [TCM10b] Tikhonova A., Correa C. D., Ma K.-L.: An exploratory technique for coherent visualization of time-varying volume data. Computer Graphics Forum 29, 3 (2010), 783–792. URL: https://onlinelibrary.wiley.com/doi/abs/10.1111/j.1467-8659.2009.01690.x, arXiv:https://onlinelibrary.wiley.com/doi/pdf/10.1111/j.1467-8659.2009.01690.x, doi:https://doi.org/10.1111/j.1467-8659.2009.01690.x.
- [WBSS04] Wang Z., Bovik A., Sheikh H., Simoncelli E.: Image quality assessment: from error visibility to structural similarity. IEEE Transactions on Image Processing 13, 4 (2004), 600–612. doi:10.1109/TIP.2003.819861.
- [YDS12] Yeung P. K., Donzis D. A., Sreenivasan K. R.: Dissipation, enstrophy and pressure statistics in turbulence simulations at high reynolds numbers. Journal of Fluid Mechanics 700 (2012), 5–15. doi:10.1017/jfm.2012.5.
- [ZAL12] Zellmann S., Aumüller M., Lang U.: Image-Based Remote Real-Time Volume Rendering: Decoupling Rendering From View Point Updates. In International Design Engineering Technical Conferences and Computers and Information in Engineering Conference (08 2012), pp. 1385–1394. URL: https://doi.org/10.1115/DETC2012-70811, arXiv:https://asmedigitalcollection.asme.org/IDETC-CIE/proceedings-pdf/IDETC-CIE2012/45011/1385/4256953/1385\_1.pdf, doi:10.1115/DETC2012-70811.
- [Zel21] Zellmann S.: Remote Volume Rendering with a Decoupled, Ray-Traced Display Phase. In Smart Tools and Apps for Graphics - Eurographics Italian Chapter Conference (2021), Frosini P., Giorgi D., Melzi S., Rodolà E., (Eds.), The Eurographics Association. doi:10.2312/stag.20211479.