Quantifying the structure of controversial discussions with unsupervised methods: a look into the Twitter climate change conversation
Abstract
Social media provides an essential platform for shaping and sharing opinions and consuming information in a decentralized way. However, users often interact with and are exposed to information mostly aligned with their beliefs, creating a positive feedback mechanism that reinforces those beliefs and excludes contrasting ones. In this paper, we study such mechanisms by analyzing the social network dynamics of controversial Twitter discussions using unsupervised methods that demand little computational power. Specifically, we focus on the retweet networks of the climate change conversation during 2019, when important climate social movements flourished. We find echo chambers of climate believers and climate skeptics that we identify based solely on the retweeting patterns of Twitter users. In particular, we study the information sources, or chambers, consumed by the audience of the leading users of the conversation. Users with similar (contrasting) ideological positions show significantly high (low)-overlapping chambers, resulting in a bimodal overlap distribution. Further, we uncover the ideological position of previously unobserved high-impact users based on how many audience members fall into either echo chamber. We uncover the ideology of more than half of the retweeting population as either climate believers or skeptics and find that the cross-group communication is small. Moreover, we find that, while the echo chamber structures are consistent throughout the year, most users inside the echo chambers change from one week to the next, suggesting that they are a stable emergent property of the Twittersphere. Interestingly, we detect a significant decrease in polarization and a significant increase on the number of climate skeptics that coincides with the main #FridaysForFuture strikes during September, 2019.
1 Introduction
Social media is crucial for information consumption and public opinion formation [14, 23, 22, 7]. It leverages communication channels between one-to-many and many-to-many in a decentralized way by enabling its users to choose whom to follow and interact with, thus democratizing information access and spreading [4, 11]. However, the decentralized nature of social media promotes that users consume information mostly aligned with their beliefs and interact with like-minded individuals and communication channels. Authors have studied these behaviors under the sociological frameworks of confirmation bias [48] and homophily [35]. Additionally, social media platforms are designed to maximize engagement time, with recommendation algorithms trained to show content similar to what users typically consume [20]. To a certain extent, the aforementioned mechanisms explain an empirical observation about controversial topics in social media: public discourse is polarized. Authors have studied polarization for several relevant topics, ranging from climate change [15, 49, 12], to politics [23, 7, 40], to Covid-19 [19, 30].
According to Caves’ Encyclopedia of the City [10], social polarization is the segregation within a society that emerges from several socio-economic factors that differentiate social groups. In the context of public discourse in social networks, echo chambers reflect a parallel mechanism to social polarization. An echo chamber emerges, according to Bruns et al. [9], when a group of actors chooses to preferentially connect with each other, with the exclusion of outsiders. However, over which preferences would such actors choose to connect? Garimella et al. [22] state that opinions or beliefs stay inside communities created by like-minded people who reinforce and endorse each other’s opinions. Therefore, agents prefer to connect to other actors with similar opinions and exclude those with contrasting ones, suggesting that homophily is a driving force in the creation of echo chambers [24, 35]. An actor inside an echo chamber will mostly receive information coherent with her beliefs, so she will reject any new information that does not align with those beliefs, i.e., actors in an echo chamber experience a confirmation bias. This bias creates a positive feedback mechanism that reinforces the echo chambers in the light of new information [43].
Echo chambers inhibit communication across groups with different ideologies. Thus, even when a scientific consensus about a topic is reached, it will hardly permeate all the echo chambers of a social group, as happens with climate change. According to the latest Intergovernmental Panel on Climate Change (IPCC) report [1], the cumulative scientific evidence is unequivocal: Climate change threatens human well-being and planetary health. Despite this, a significant fraction of the population in many countries express some form of doubt or skepticism about whether trends in climate change are human-made, if these trends will bring harmful consequences to society, or both [38, 31]. Such skepticism may be linked with factors such as the spread of misinformation online [45], nationalist and individualist identities [31], or, particularly in the United States, conservatism and conspiratorial beliefs [28]. The issue of climate change is not only polarizing but also a matter with deep social, economic, and ecological impact. Shifts in public opinion might lead to significant behavioral and political changes that could face strong opposition from specific population sectors.
Several authors have studied the climate opinion landscape in social media, finding, in most cases, that a group of climate believers, i.e., actors that support the science about climate change, and a group of climate skeptics coexist and segregate into online echo chambers [49, 46, 29, 12]. Online social media has been a crucial driver of pro-climate movements, such as the “Fridays for Future” movement started by Greta Thunberg [44, 32]. Using Twitter data, Williams et al. [49] constructed several interaction networks from relevant climate-related hashtags and manually labeled the most active users as believers, skeptics, or neutral. They measured high levels of homophily in the followers and retweet networks, suggesting that the conversation is polarized. With a similar approach, Jang and Hart [29] found a polarized Twitter climate change conversation in the United States between Republicans and Democrats. They claim that “climate change” and “global warming” are meaningful query filters to study the climate conversation, with the latter being more common among climate skeptics. Chen et al. [12] studied Finland’s Twitter climate change conversation by creating interaction networks from retweets. They found that the climate conversation was subject to partisan sorting and aligned with the universalist-communitarian dimension of European politics. Xia et al. [50] found that viral climate topics around the 2019 Nobel peace prize spread in different groups, enhancing in-group connections and repulsing out-group engagement, suggesting the presence of echo chambers.
In this paper, we study the structure of the Twitter climate change conversation during 2019, when the “Fridays for Future” and “Extinction Rebellion” social movements flourished. We introduce unsupervised methods to 1) identify the leading users of the conversation throughout the year, 2) measure the ideological similarity between leading users by examining the many-to-many communication channels of the audience of a leading user, 3) determine the ideology of the leading users using their ideological similarities, and 4) present an operational definition of echo chamber based solely on the structure of the Twitter interaction networks for which we classify more than half of the total retweeting population. We construct these methods under the assumptions that retweeting is a good proxy for endorsement [23, 2], and that information flows in the opposite direction of retweets. Moreover, we acknowledge that Twitter conversations are highly heterogeneous in that a tiny number of users explain the majority of the retweets produced by the population in a given dataset [25]. These methods build upon other works that provide an operational definition to detect echo chambers [14] and create a model to infer the ideological position of active users on Twitter [2].
We organize the remainder of this paper as follows: In section 2, we identify the leading users of the climate conversation, introduce the chamber associated with a leading user, and identify two polarized ideological groups based on the similarity of the chambers of the leading users using unsupervised methods. In section 3, we introduce a definition of echo chamber and classify most of the users in the retweet network as either climate believers or climate skeptics. We inspect the properties of the echo chambers and discuss the communication within and across groups. Finally, in section 4, we conclude and suggest future research directions. We code all the methods and analysis of this work in Python, and we make the code freely available at https://github.com/blas-ko/Twitter_chambers.
2 The chambers of the Twitter conversation
Twitter users often consume information from various sources. They typically follow, audit, and interact with broadcasters that represent the one-to-many communication channels of the Twittersphere and with other lower-impact users that represent the many-to-many communication channels [33, 26]. In this paper, we introduce quantitative methods that leverage the impact of the broadcasters, here called leading users, and the set of lower-impact users, here called chambers, of a given audience. Later, we introduce a quantitative definition of echo chamber based solely on the structure of the Twitter interaction networks. We focus in the climate change Twitter conversation during 2019, where, given the previous research [49, 46, 29, 12], we expect to find echo chambers of climate believers and climate skeptics.
Our aim is to construct a set of observables that characterizes the dynamics and structure of the conversation in an unsupervised way. Thus, we avoid missing certain features that could be ignored by our biases. Most importantly, the methods we introduce in this paper are applicable to other datasets where we do not have clear expectation of what the structure is.
In this section, we define a leading user and its associated chamber and derive methods that identify polarized ideological groups in an unsupervised way. We validate a posteriori that such ideological groups correspond to those who believe in anthropogenic climate change and those who are skeptic about it.
2.1 Data
Alongside the company Sinnia111http://www.sinnia.com/en/, we create a dataset with million climate-related tweets from million users spanning 1st March to 1st December 2019, totalling weeks. We collect all the tweets that satisfy any of the following queries: “climate change”, “global warming”, “climatechange” and “globalwarming”. We choose these queries following the results from prior studies [47, 49, 29]. Of the total volume of tweets, corresponds to retweets. We therefore focus on the retweets only, assuming that they provide significant information of what users are looking at or interested in.
2.2 High-impact and leading users
Discussions in Twitter are highly heterogeneous [41]. This means that a huge fraction of the information consumed and spread through Twitter interaction networks is generated by just a handful of users. However, these networks often exhibit community-like structures where the density of interactions is higher for users with similar features. Throughout this paper, we assume that retweets are a good proxy for endorsement [2, 23, 12], so that we may study the retweet interaction network as a social network of endorsements. Thus, we study the dynamics of the retweet network, , which we construct following Beguerisse et al. [3] as
| (1) | ||||
| (2) |
where and denote users from the complete set of retweeting users, , and denotes time, where we choose the week as our temporal resolution.
In this context, we will refer to as the impact of user during week . From a networks perspective, the impact is the same as the weighted in-degree of a given node. Using the impact vector, , we can quantify how unequal the discussion in Twitter is by treating as a measure of the wealth of user and computing ’s Gini index. The Gini index would be if every user received the same number of retweets and if only one user is responsible for every retweet.
The Gini index gives us a global picture of the impact heterogeneity, but we can also use to identify important users in the conversation. We define the set of high-impact users in week as the most retweeted users during that week, i.e.,
| (3) |
Importantly, is a dynamic set, as typically changes weekly for all users. This contrasts with previous works, [25], where they fix the set of high-impact users a priori.
The set may vary significantly throughout the weeks, so, to characterize the most important actors in the conversation, we introduce the persistence, , as the number of weeks where is a high-impact user. The persistence lets us identify the high-impact users that are relevant in longer time windows. We consider users with high impact and high persistence as leading users because they function as one-to-many information channels that are relevant to focused audiences for extended periods [33]. We thus define the set of leading users as
| (4) |
that have an associated vector of impact,
| (5) |
When we apply these definitions to our Twitter dataset on climate change, we observe that almost of the weekly retweets are given to the top users. This corresponds to a massive inequality, as the vast majority of interactions are produced by just a handful of tweets. We observe an average Gini index of ()222Unless otherwise stated, quantities with uncertainty bars represent the standard deviation around the mean across weeks., meaning that we should be able to understand a significant fraction of the Twitter conversation just by looking at its high-impact users.
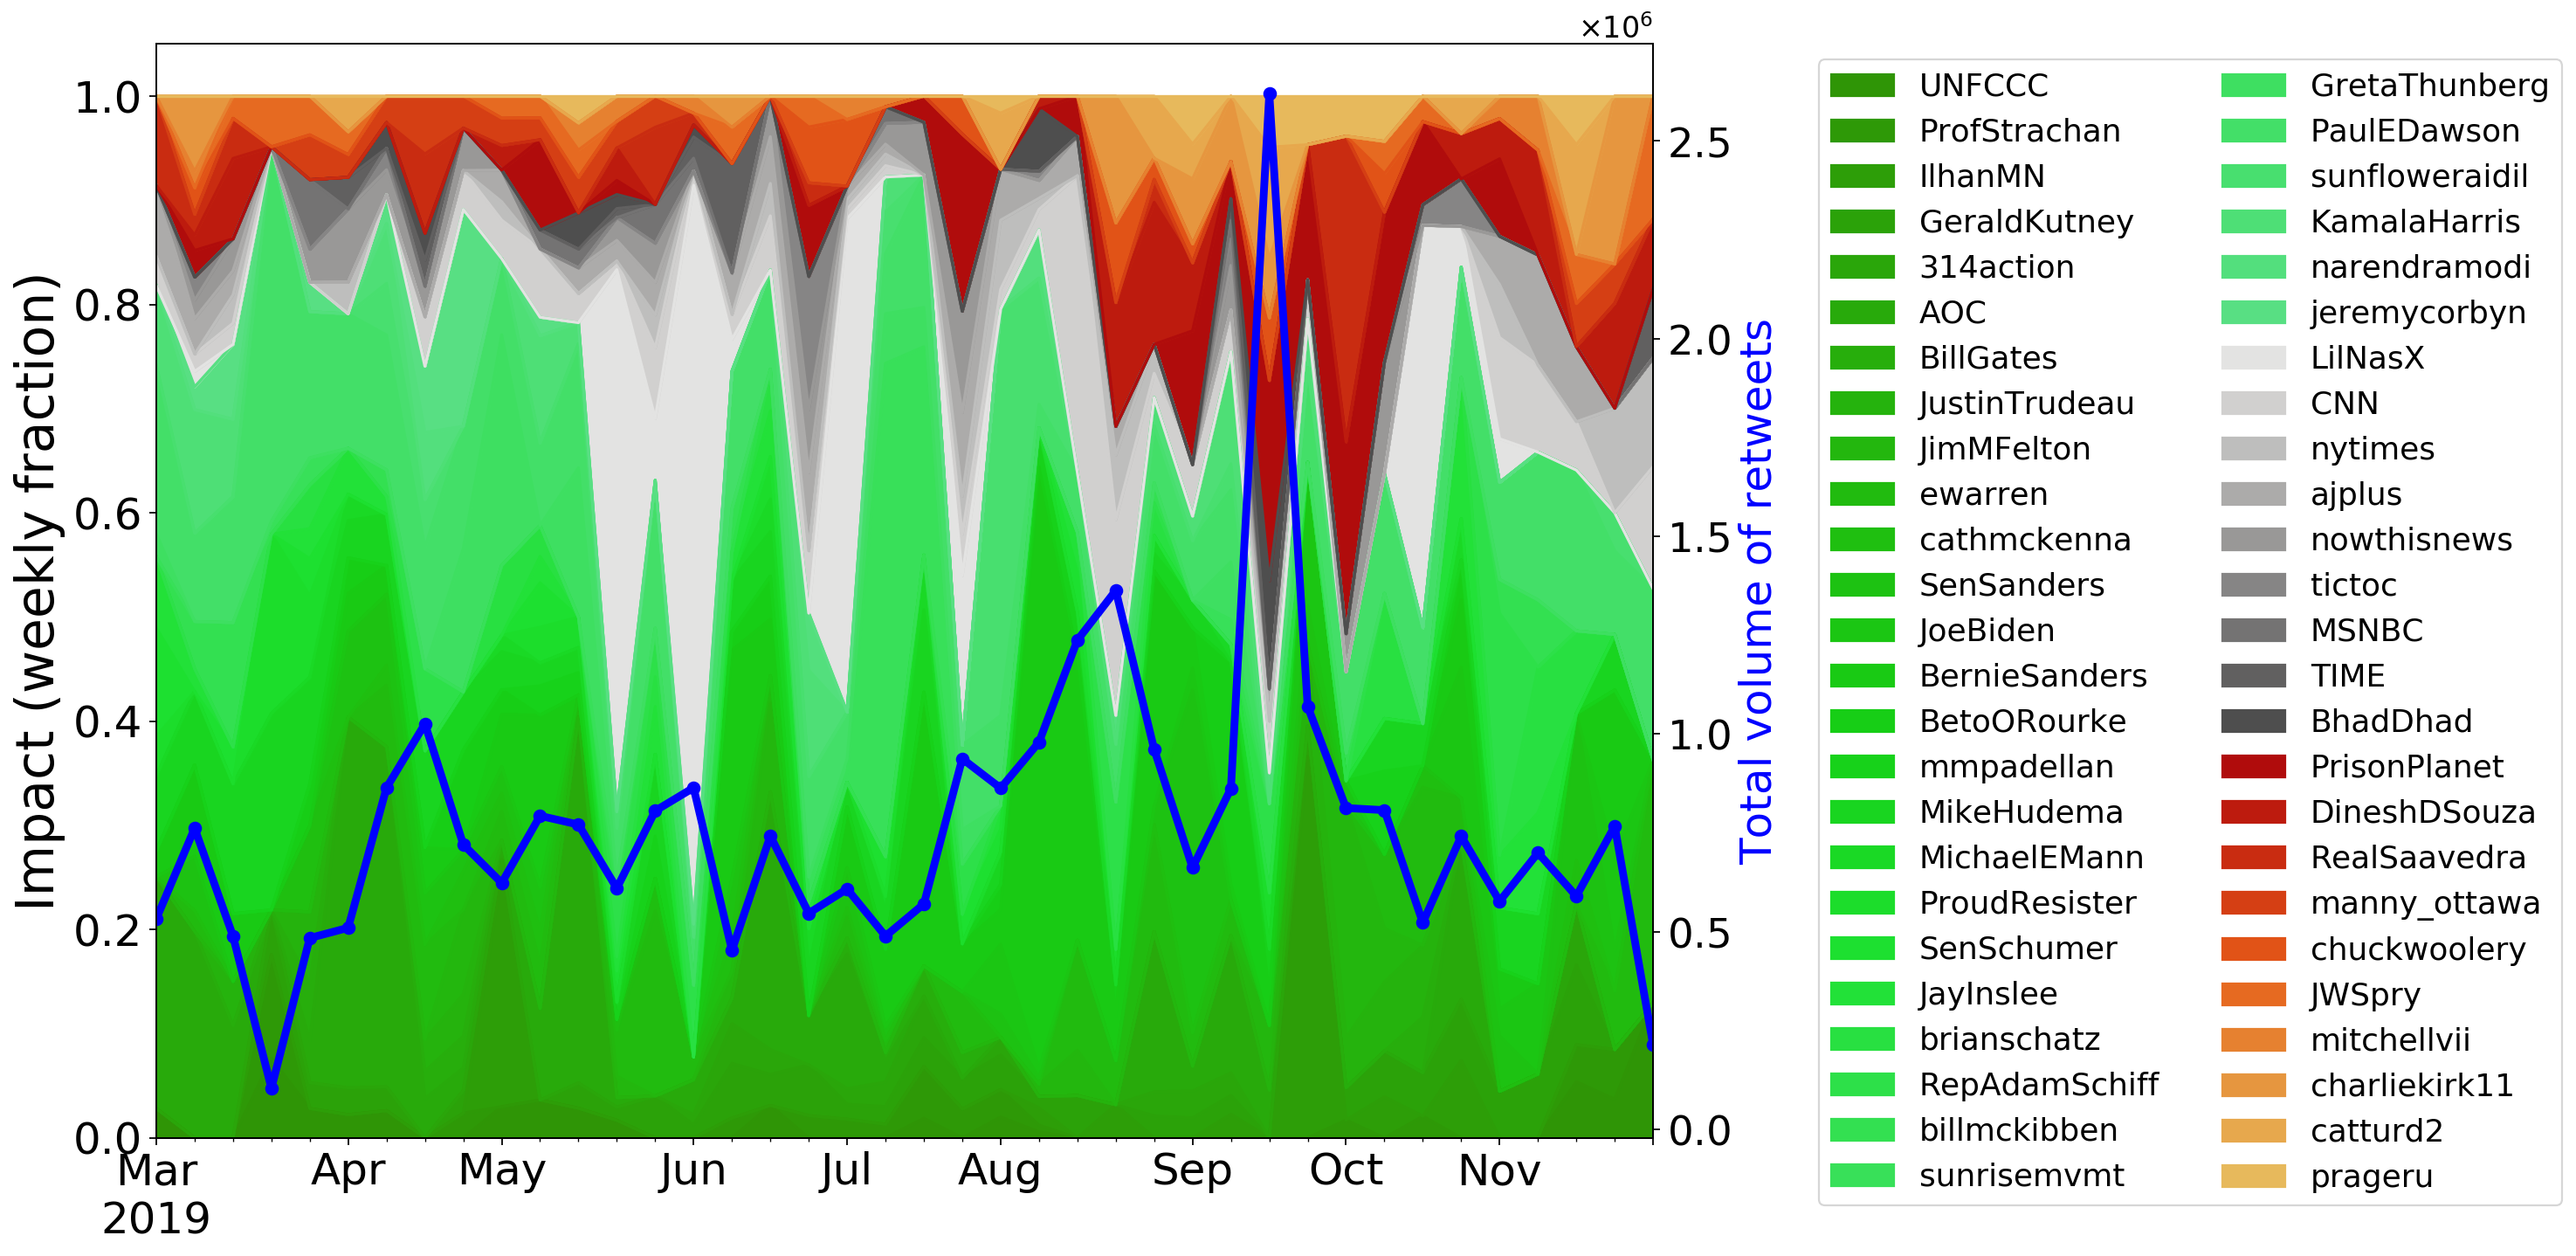
We take the leading users from the high-impact weekly users. While the set of leading users, , is dynamic, in the analyses that follow we focus on the complete set of leading users, where . As a first approach to understanding the set of leading users, we manually assign each of them a category about climate change. We identify three main ideological currents: climate believers that support scientific consensus about anthropogenic climate change, climate skeptics that doubt that the trends in climate are anthropogenic or that such trends will bring harmful consequences to society, and news media channels and entertainers. In Fig. 1, we show the impact dynamics of the leading users per week. Although we observe an overall dominance of the climate believers (green) throughout the year, we observe a clear irruption of the climate skeptics (red) in the second half of the year, with a specially pronounced peak in the third week of September, 2019. Additionally, in Appendix D, we present Table 1 which enlists the leading users and their main features.
2.3 The chamber: quantifying leading users’ similarity
In the previous section, we proposed a way to identify the (small) set of leading users responsible for most of the Twitter discussion. We manually labelled them based on their ideological position about climate change by inspecting their Twitter bios, Wikipedia pages and related news stories. Manual labelling is often time consuming and requires external sources to retrieve information about the users. In this section, we introduce an unsupervised approach for identifying ideological (dis)similarities between leading users. This approach relies on analyzing the many-to-many communication channels of an audience, i.e., the chain of interactions stemming from members of the audience, with a behavior similar to viral spreading [33].
Each leading user has an associated audience who endorses her, where the content posted by the leading user flows in the direction of her audience, creating a one-to-many communication channel, similar to broadcasting [26]. Simultaneously, the audience consumes and endorses posts of other Twitter users, forming a many-to-many communication channel, which we call the chamber of such an audience. The audience and the chamber associated with a leading user are our main objects of study, and we introduce them precisely in what follows.
Definition 2.1 (Audience).
Given a user , her audience at week , , is the set of users that have retweeted during :
| (6) |
The set indicates who endorsed during week . Thus, the ideologies of the members of are coherent to that of ’s. Moreover, the audience might interact with and endorse other lower-impact sources, creating an information flow from these sources to the audience. We call these collection of sources the chamber of the audience associated with the leading user .
Definition 2.2 (Chamber).
Given an audience, , associated with a user , the chamber of during week , , is the set of users retweeted by the audience of excluding other high-impact users:
| (7) |
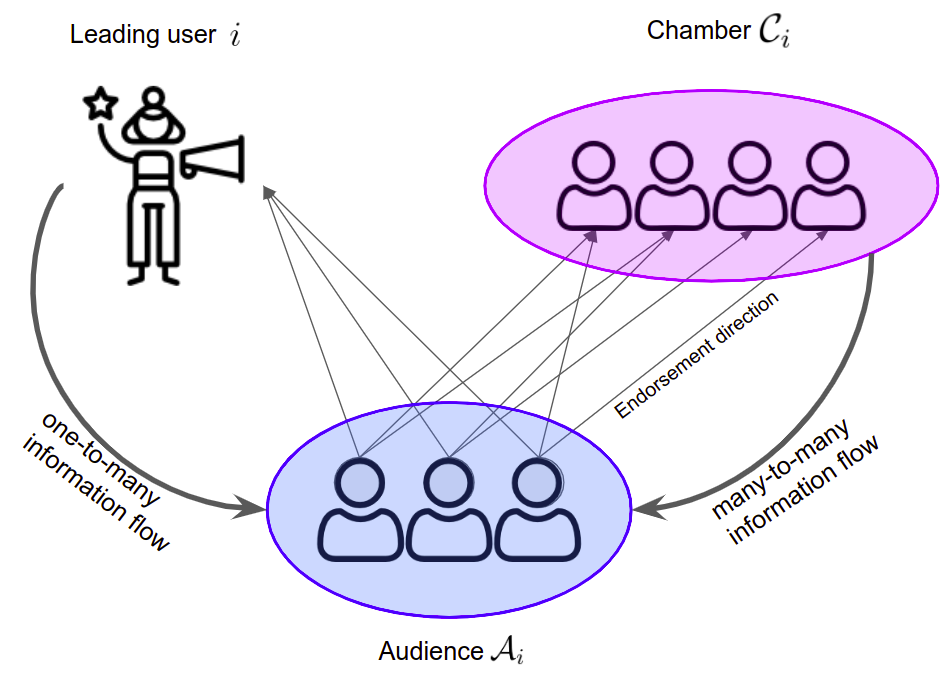
The audience is a collection of information consumers, while the chamber is a collection of sources. See Fig. 2, where we show a schematic representation of the audience and the chamber associated with a leading user. A leading user relates to its chamber through its audience, so we expect that the members of the chamber have a similar ideology to that of the leading user. We consider the (dynamic) audiences and chamber associated with the leading users, , throughout the year.
The chambers transmit information from the sources to the audiences. Thus, we can estimate the information flowing between two audiences associated with the leading users and by comparing how similar their chambers are. Following from our assumption that retweets indicate endorsement, this similarity signals some notion of ideological distance between of and . Thus, we can compare the ideology two leading users by looking at their chamber overlaps, which we introduce in what follows.
Definition 2.3 (Chamber overlap).
Given two leading users and with respective chambers and , the chamber overlap, , during week is the Jaccard similarity between and :
| (8) |
The overlap between the chambers gives us a proxy of the ideological similarity between and without determining their ideological positions explicitly, meaning that is a relative measure between the two users. We could compare the audience overlap using the audiences instead of the chambers in Eq. (8), but we prefer using the chambers instead for mathematical and conceptual considerations (See Appendix C for details).
Following from our analysis from Section 2.2, we expect for the climate change discussion to exhibit a clear separation between climate believers and climate skeptics [49, 15]. We quantify such a separation by looking at the aggregate chamber overlap distribution over the year –i.e., we consider for . If the separation exists, the chamber overlap between pairs of users from the same ideological group should be significantly larger than pairs from different groups.
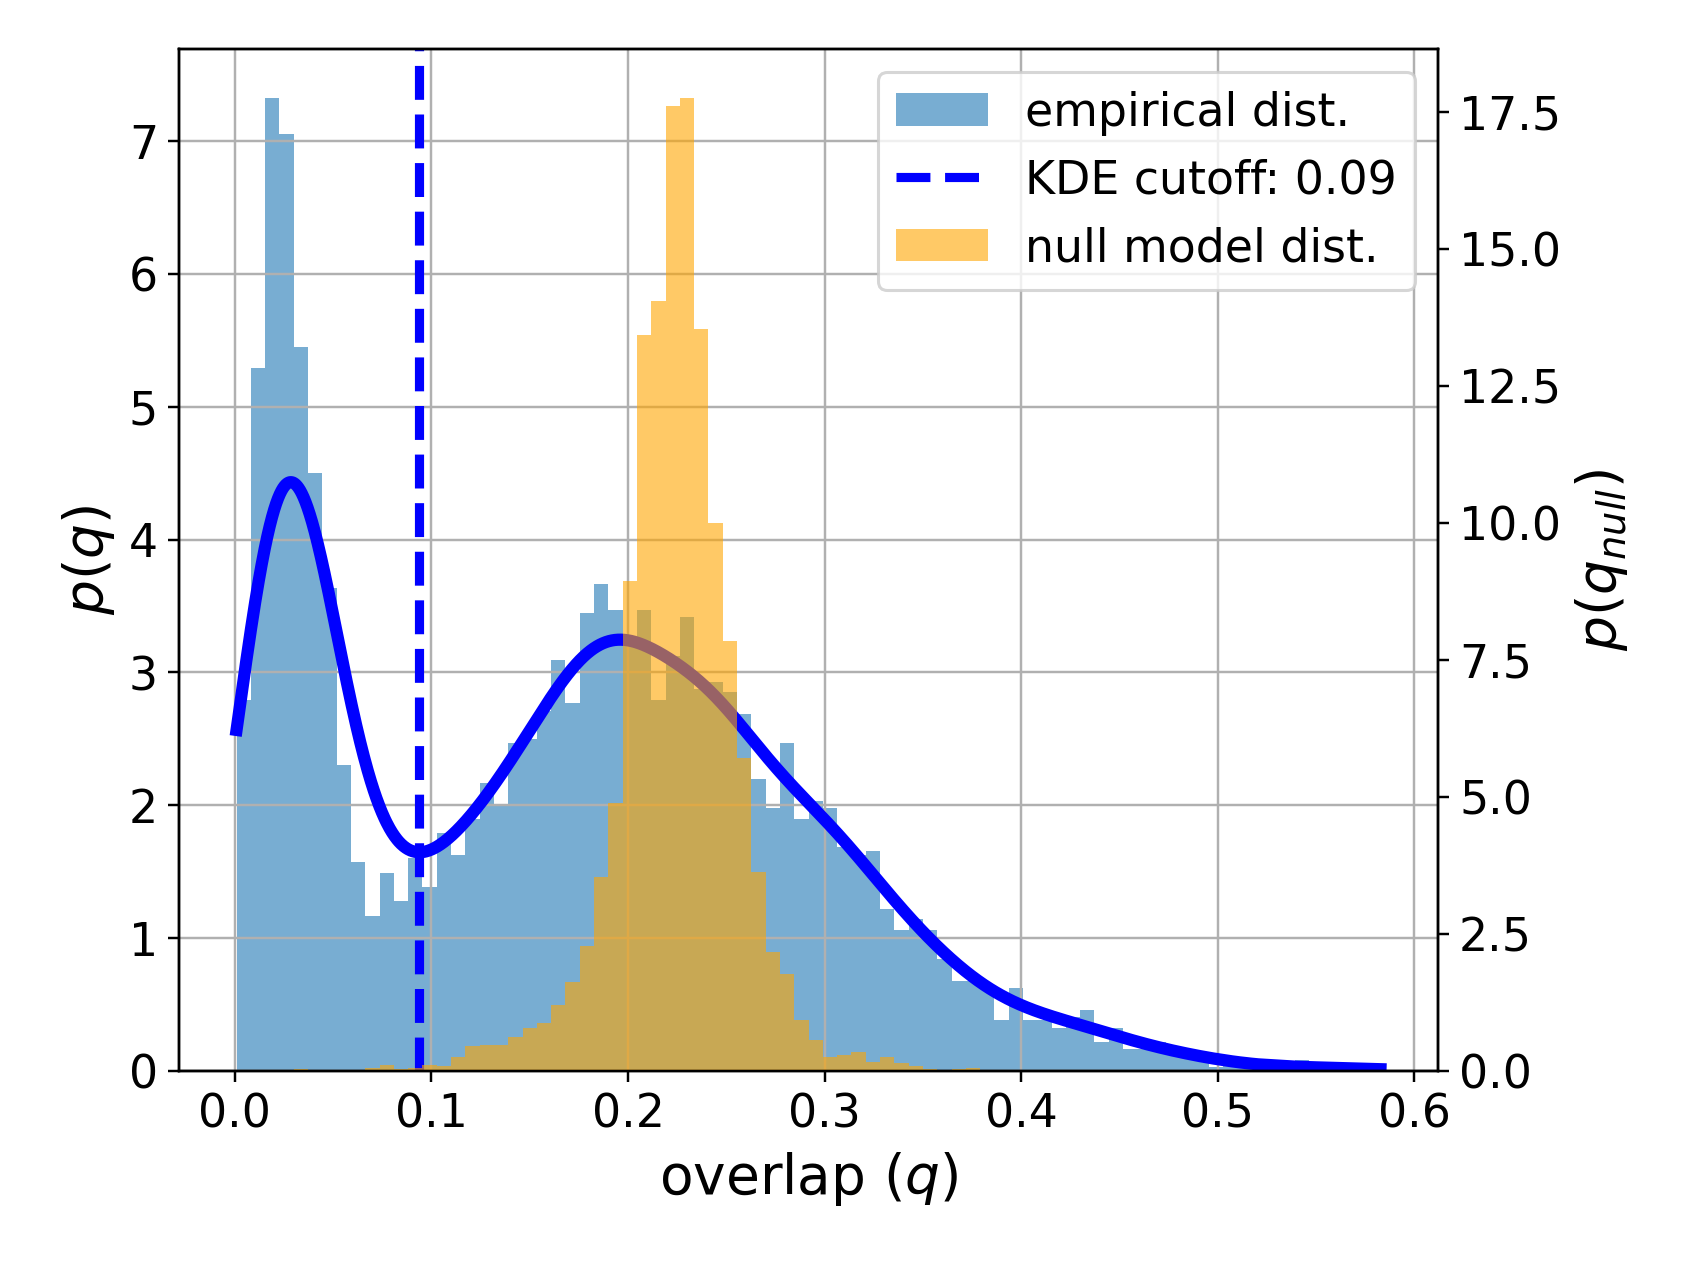
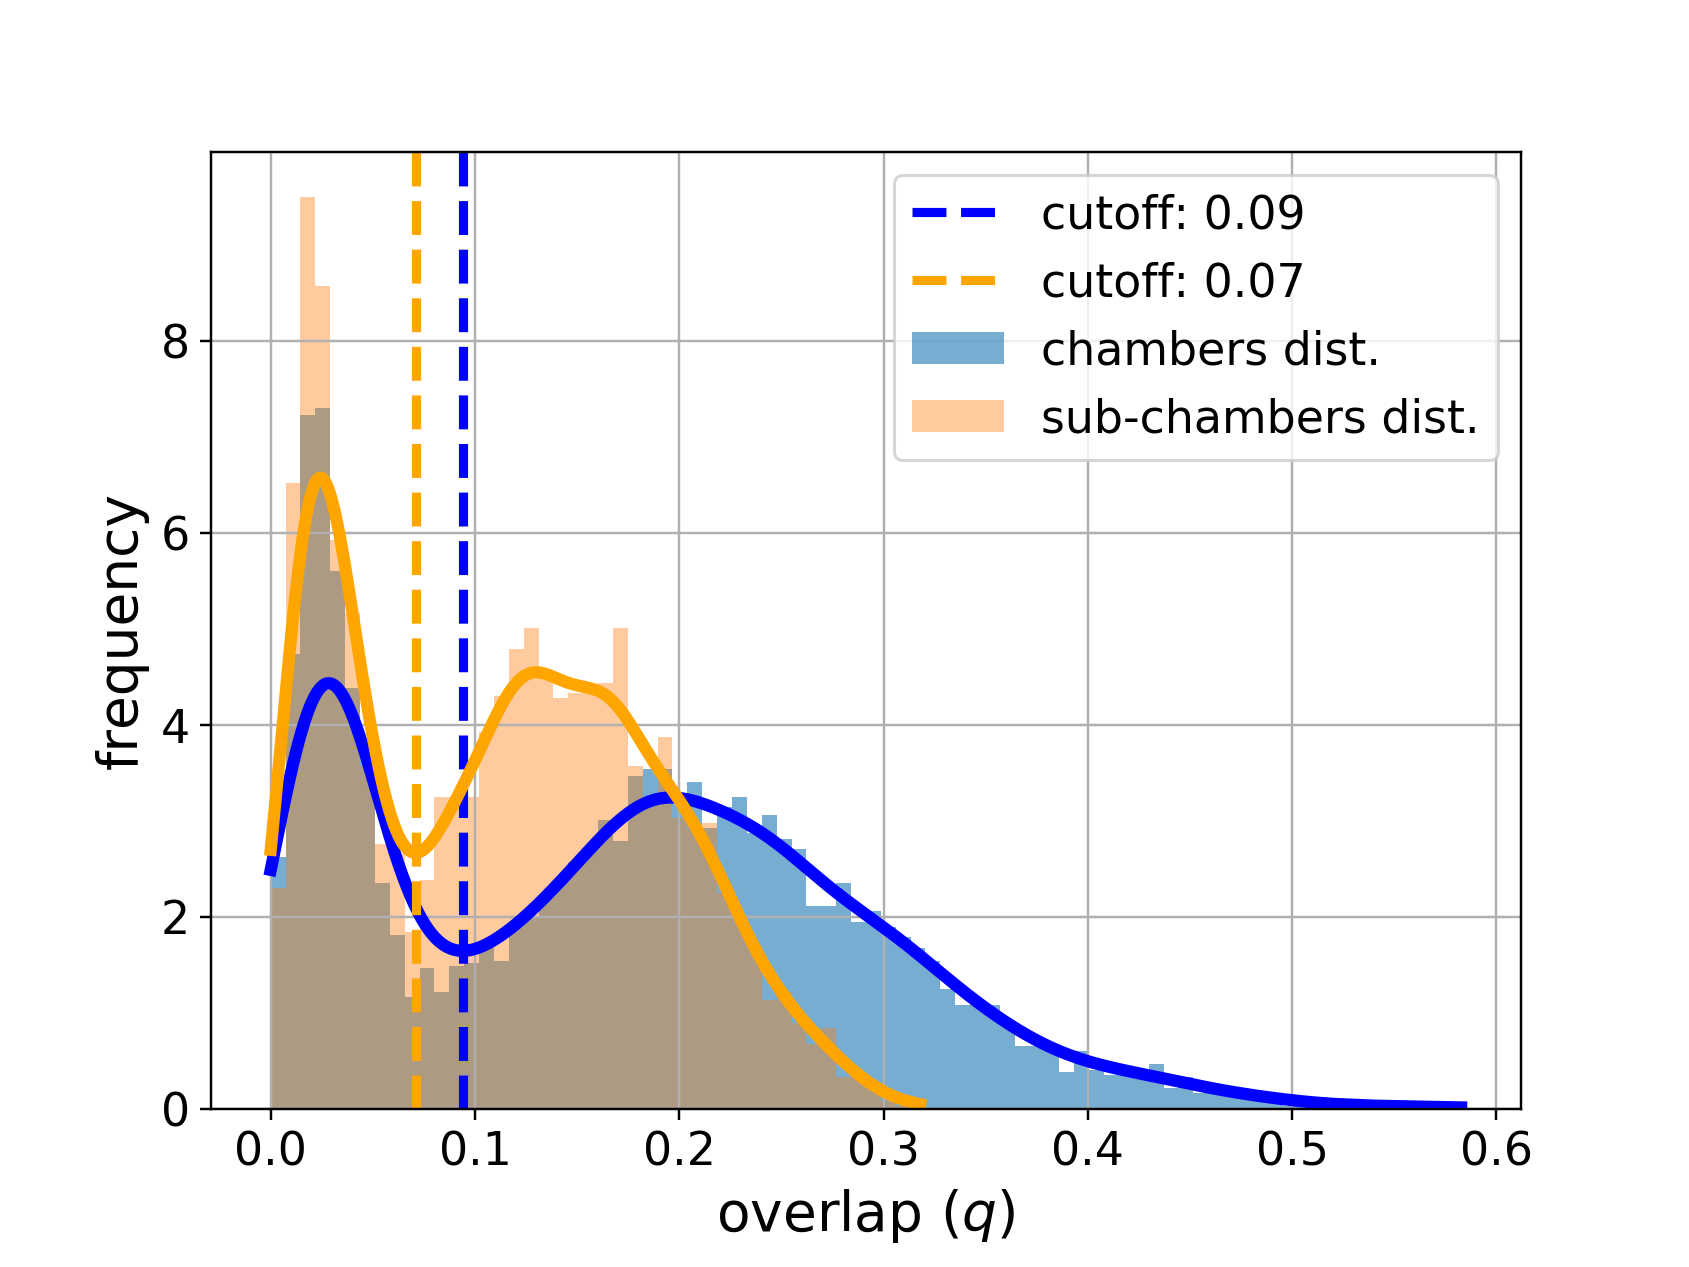
In Fig. 3, we show the overlap distribution, , aggregated over the whole period, where we observe a clear bimodal structure with a sharp peak at and a more spread-out peak at . We approximate the position and spread of the peaks using a Gaussian kernel density estimator with an optimal bandwidth parameter using Scott’s rule [42] and separating the peaks according to the minimum between them. The observed bimodal structure is not trivial. To claim this, we compare the empirical structure with the expected chamber overlap distribution of the configuration null model. The configuration model consists of random graph ensembles where the edges are statistically independent, but the in-degree sequence is, on average, the same than that of the empirical network (see Appendix A for details). For the null model, we find that the expected chamber overlap distribution is unimodal with a well-defined peak. We show the empirical and the expected null-model chamber overlap distributions in Fig. 3. We find that the peak of the null model coincides with the in-block empirical one but has a lower spread (). In Appendix A, we derive an explicit expression for the expected chamber overlap, , between users and for a given degree sequence .
The overlap distribution indicates that the ideologies on the climate conversation are polarized. However, it does not identify which users are from what group nor how many groups are there. In what follows, we describe how to obtain the ideological position of the users based on their chamber overlaps, , and compare it with quantitatively with the manual labelling.
2.4 Classifying leading users by chamber overlap
In this section, we create a partition of the set of all leading users, , based on the chamber overlap distribution, , which exhibits a bimodal structure (See Fig. 3). A partition corresponds to a collection of disjoint subsets of , with and . In general, we could create a partition with an arbitrary number of clusters, but, given that the Twitter climate discussion exhibits a natural ideological division into climate believers and climate skeptics, we expect to find a separation of into two clusters.
In order to create a partition of the leading users, we first consider the (temporal) chamber overlaps matrices between all the pairs of leading users, . By treating as weighted, undirected, adjacency matrices, we can dispose of a plethora of community detection algorithms to detect communities in networks. Thus, we classify the leading users in an unsupervised way by first considering the aggregate chamber overlap matrix , , where denotes average over , and then partitioning into two groups using the spectral clustering algorithm described by Mohar et al. [36] (see Appendix B for details). We choose a spectral clustering algorithm because 1) it naturally partitions the network into two distinct groups, and 2) it ranks the nodes in the network (here, the leading users) according to how well-separated they are from the out-group. In general, we could consider other community detection algorithms [6, 39, 37] if we need to partition the network in more than two groups.
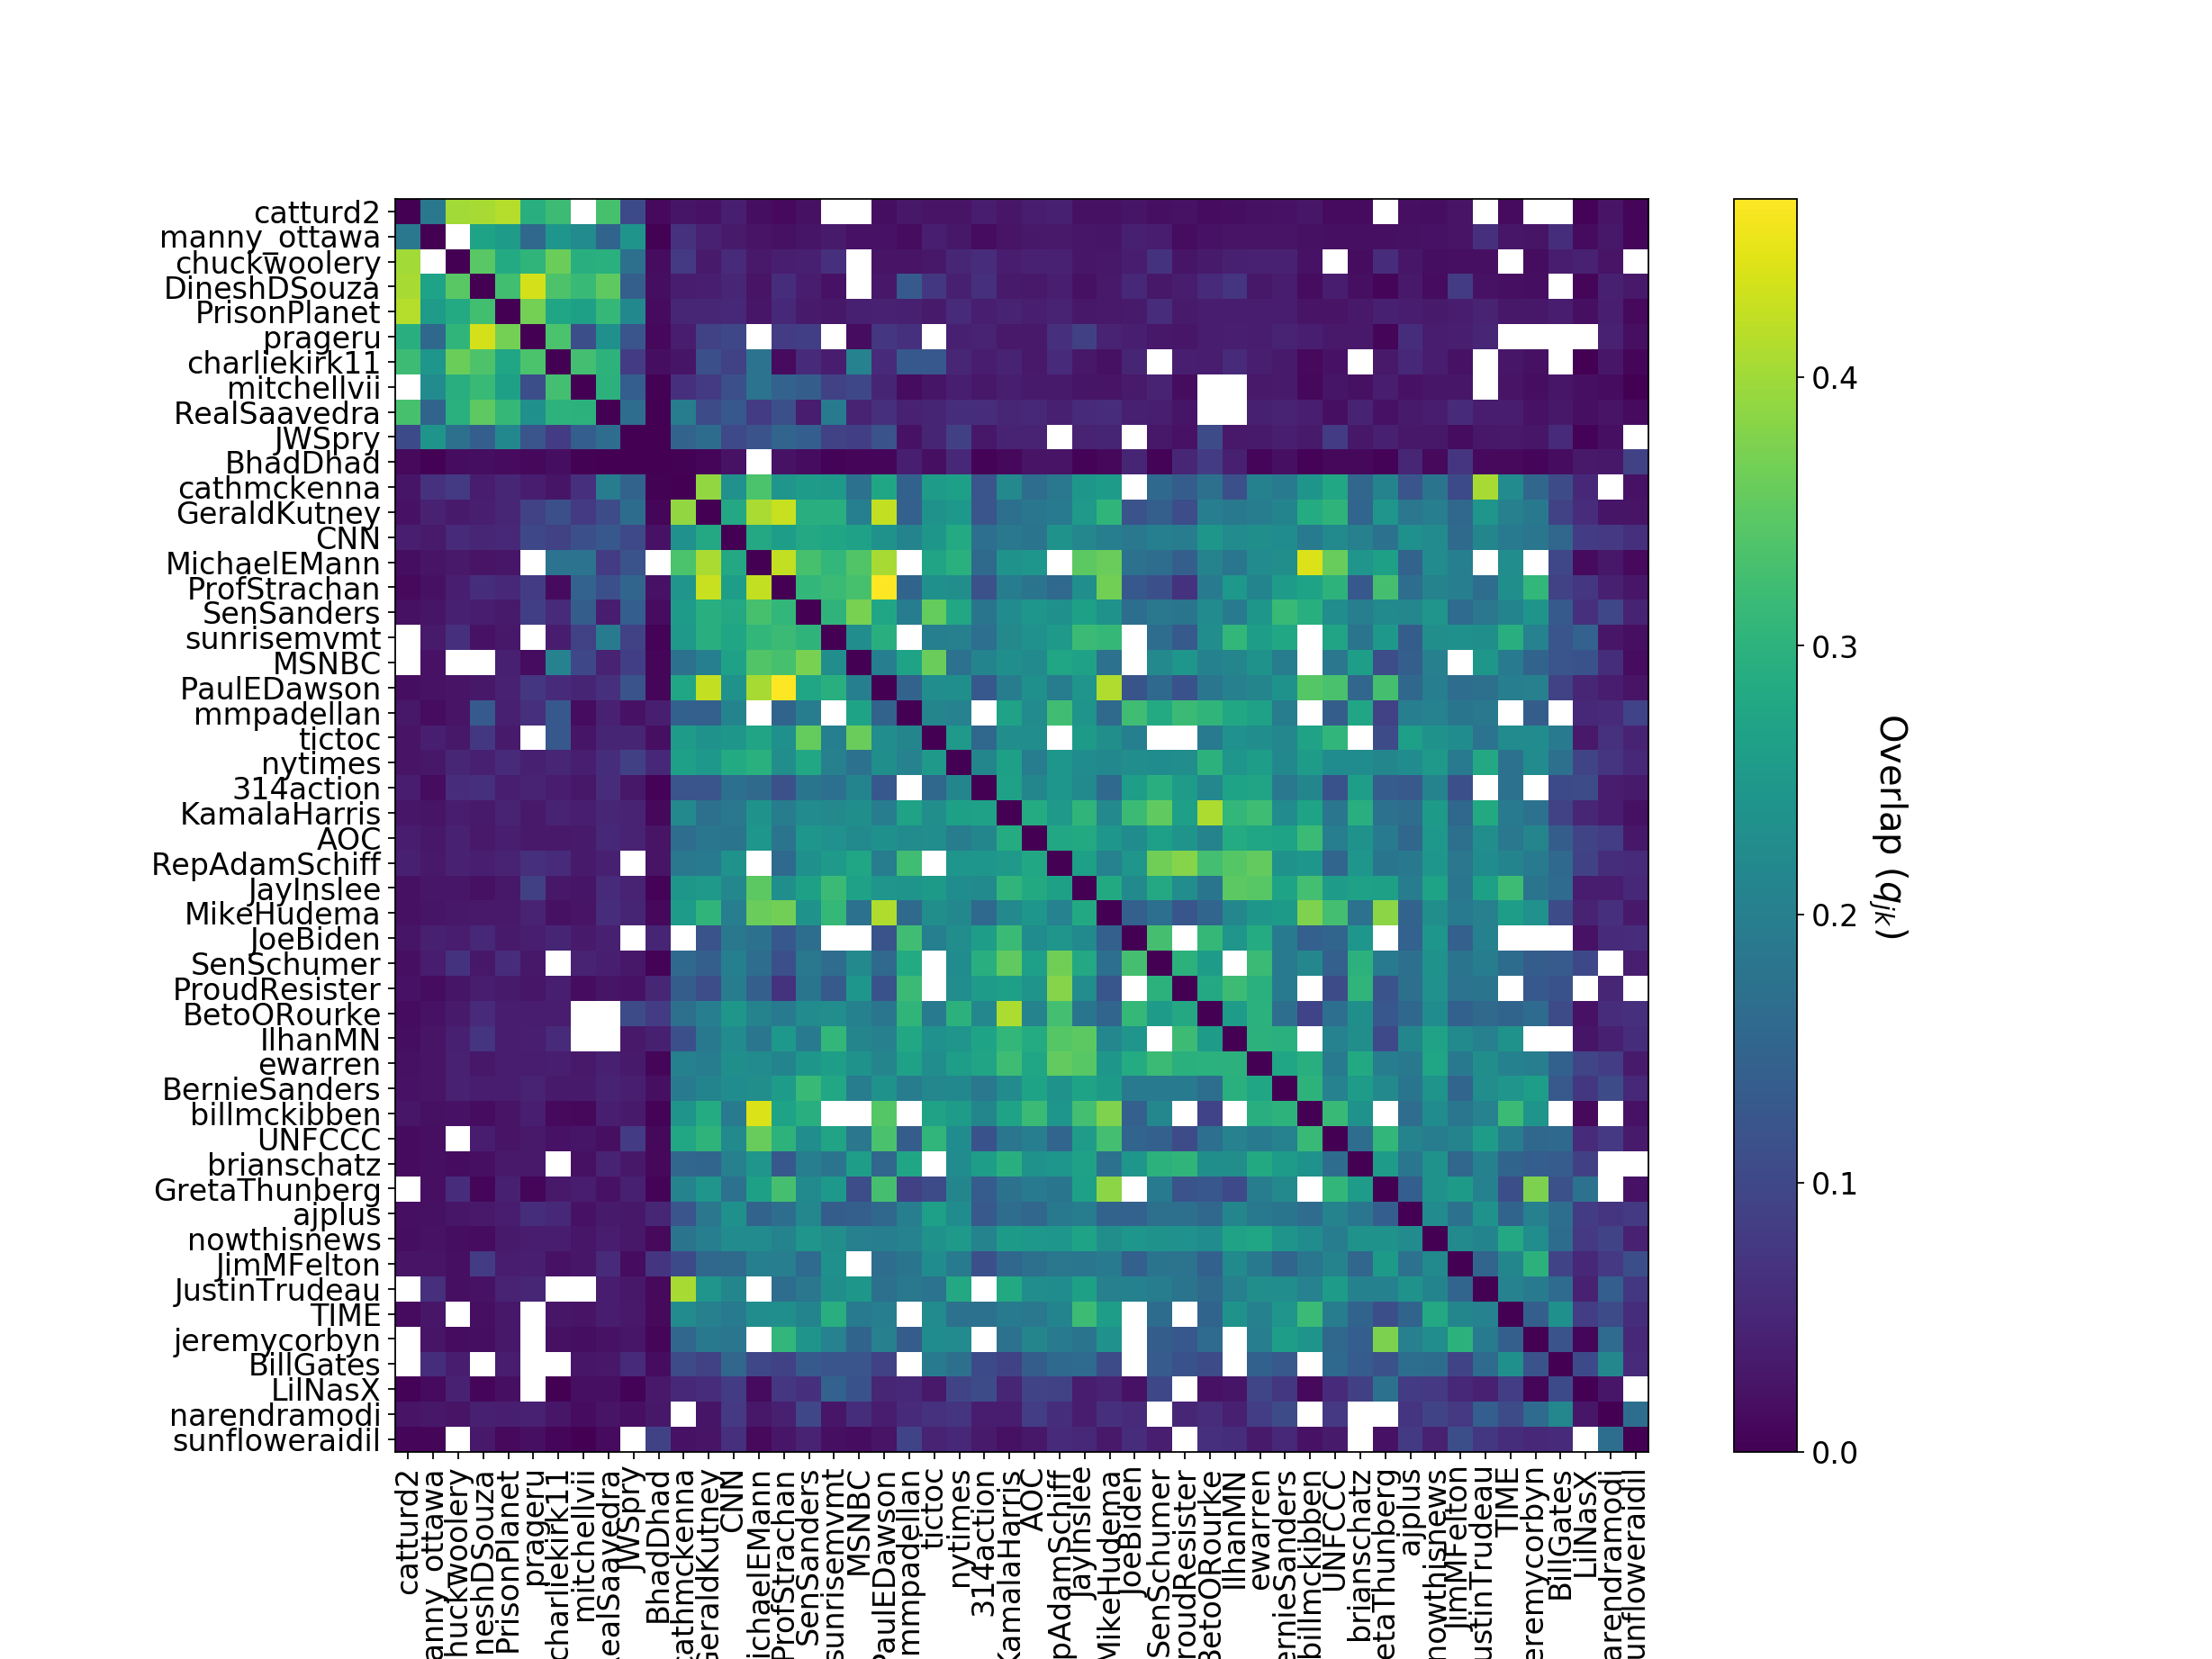
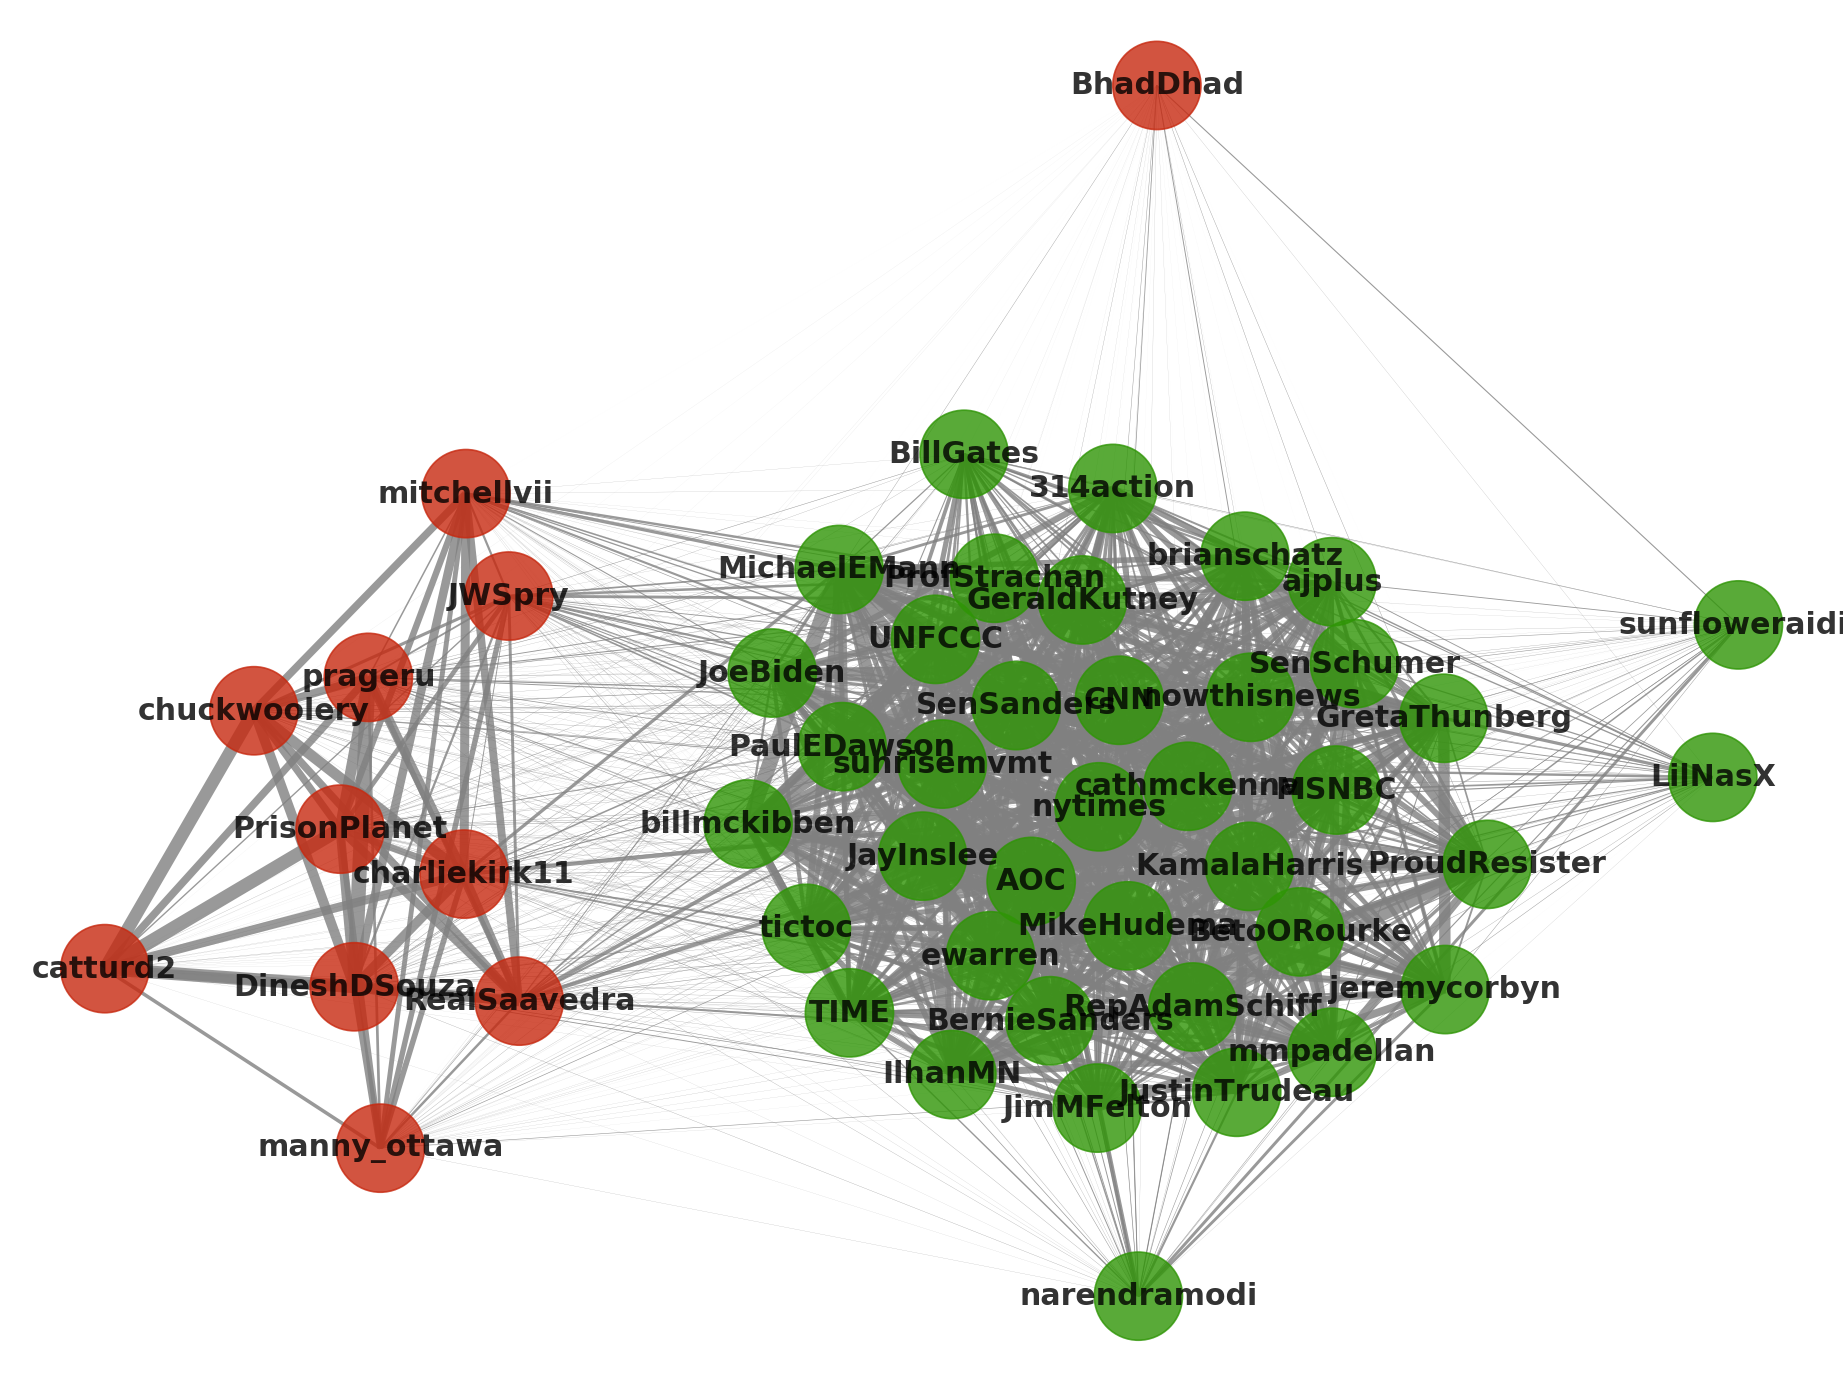
In Fig. 4(a), we present the aggregate chamber overlap matrix, , where we sort the users according to the rank given by the spectral clustering algorithm (see Fig. 9 in Appendix B). We observe a clear block structure that separates the climate skeptics (top left) from the climate believers (bottom right). Notice that the in-block overlaps are often two-digit percentages: a large fraction of the chamber is shared for users in the same community. Moreover, in Fig. 4(b) we show the resulting network constructed with , where the node colors represent the partition found by the spectral clustering algorithm. We observe two well-separated groups that correspond to the climate believers and climate skeptics discussed before. We also observe four satellite nodes, namely, BhadDhad, narendramodi, sunfloweraidi, and LilNasX that have a significantly lower overlap than the rest of the in-group user pairs. In a few cases, there are cross-chamber overlaps that are higher than the average cross-chamber overlap, such as in the pair cathmckenna(believer)-RealSaavedra(skeptic). However, such cross-chamber overlaps are much smaller than the within-chamber overlaps.
2.4.1 Polarization dynamics of the leading users
The previous analysis suggests a big ideological polarization in the climate-related conversation on Twitter, which is a known fact for conversations about climate change [49, 29, 12]. However, our results are valuable in that 1) we detect these groups in an unsupervised way, and 2) we quantify the relative ideological similarity between leading users using the chamber overlaps, where we found significantly high (low) overlaps for pairs of users in the same (other) group. However, we have not yet quantified polarization, and the analysis so far has been static.
We define the polarization between two groups and as the difference between the probability that an edge exists within a group and the probability that an edge exist across groups. To do so, we consider the adaptive E-I index, following Chen et al. [12] and Bruns [9], as
| (9) |
where is the total strength of the edges going from to .
Our measure of polarization is bounded such that , where when all the connections happen within groups (total assortativity), when all connections happen between groups (total disassortativity), and when the connections between groups equal the connection within groups (no assortativity).
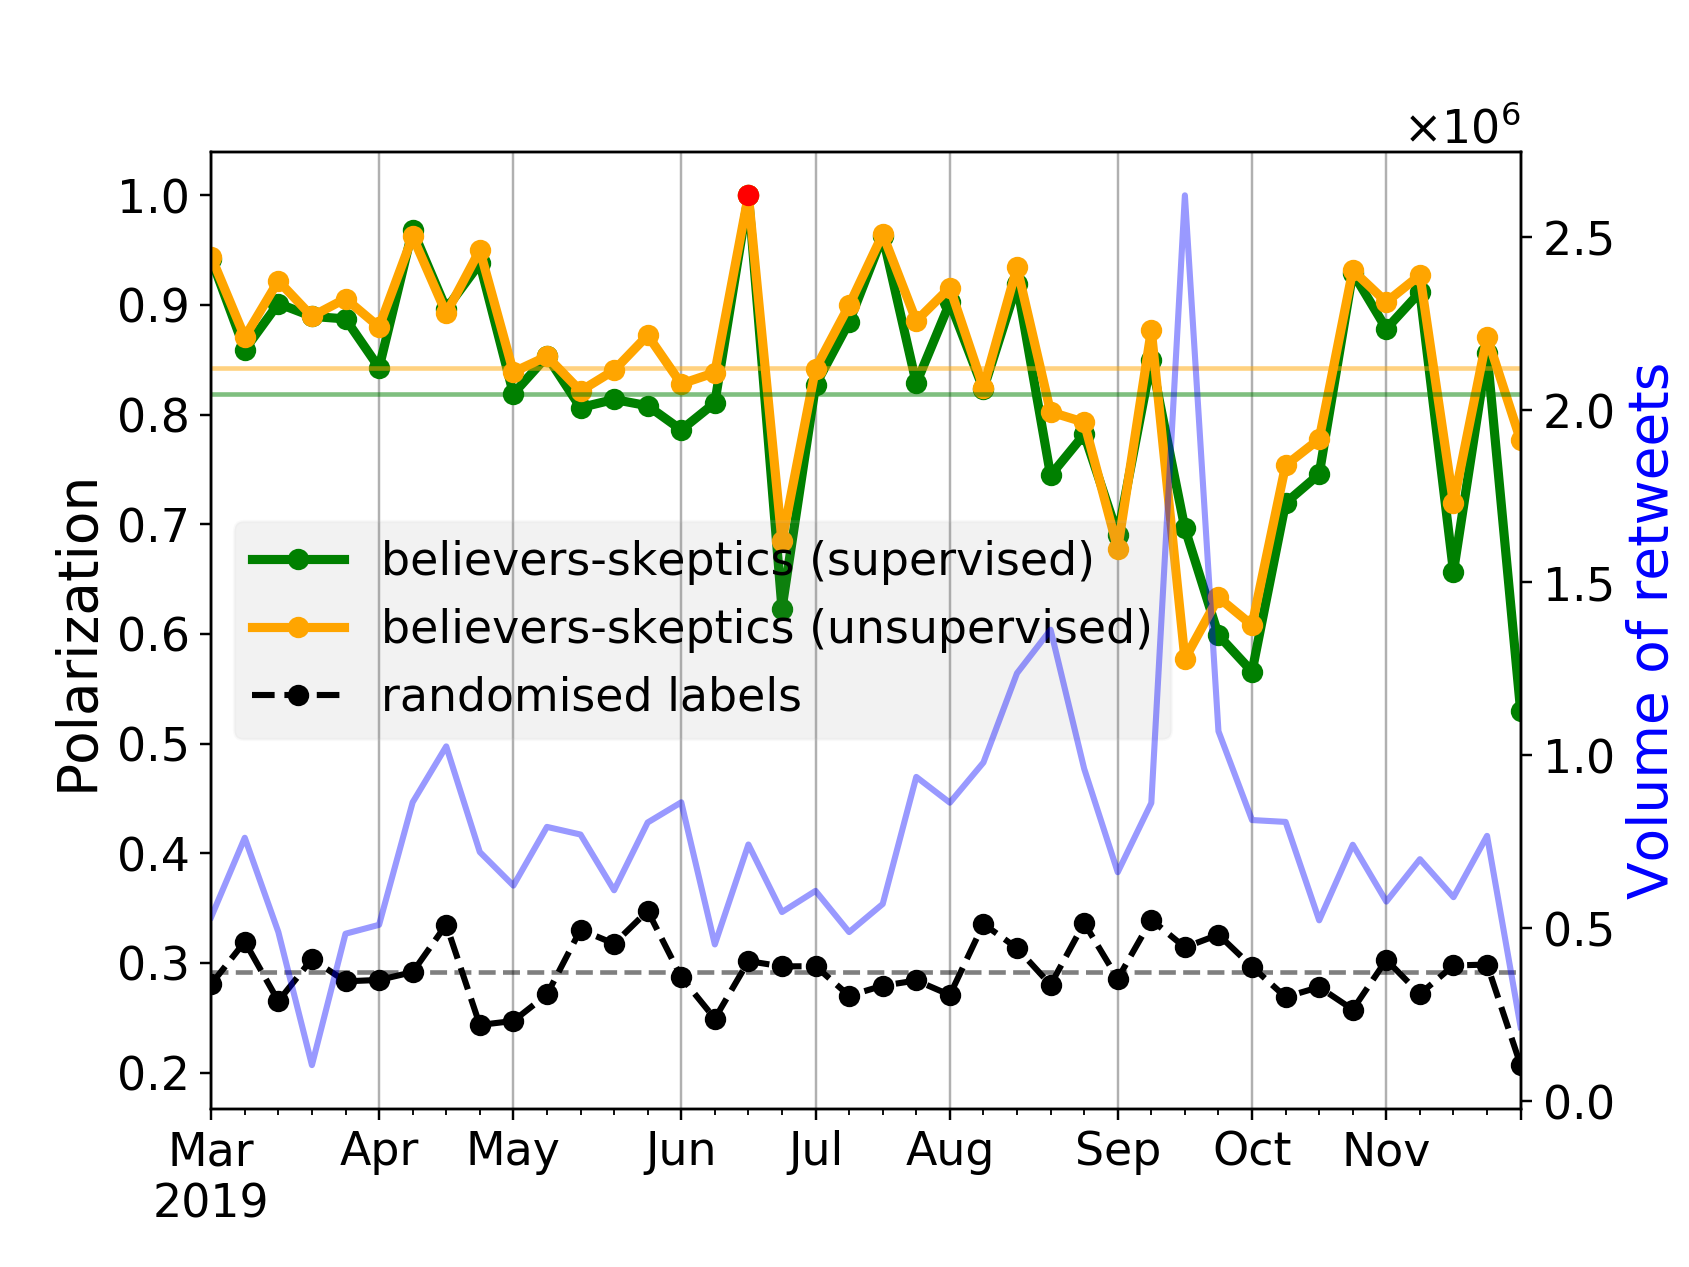
In Fig. 5, we show the polarization dynamics of the leading users for both the supervised and unsupervised partitions of climate believers and skeptics (see Fig. 1). As a null model benchmark, we compute the polarization dynamics of the average over an ensemble of the same networks with randomly reshuffled labels.
We find a high polarization of and for the supervised and unsupervised partitions, respectively, meaning that users with similar ideologies have similar (climate-related) chambers. Moreover, we show that the polarization dynamics between the supervised and unsupervised approaches are almost identical: even when we tried to separate the news media sources from the climate believers, the unsupervised clustering algorithm puts them in the same group. We find an average polarization of for null model realizations of randomly reshuffling the labels. Such a low value indicates that neither the degree sequence nor the size of each ideological group can explain the high polarization of the empirical network. We find no significant temporal trends in the polarization dynamics but observe that polarization decreases during the 3rd and 4th week of September, which coincides with the #FridaysForFuture biggest strikes organized by Greta Thunberg [32, 44]. We provide a deeper discussion about this and other signals that coincide with the strikes later in Section 3.1.
3 From chambers to echo chambers
Previously, we introduced the chamber as the many-to-many information sources of the audience of a leading user. In the case of the climate change retweet network, we found that the overlap distribution between all chamber pairs is bimodal (see Fig. 3), suggesting that such communication channels are divided, polarizing the climate change retweet network. Thus, we classified the chambers –following an unsupervised clustering approach– according to their overlap similarities and found two well-separated groups which we then identified as climate believers and climate skeptics.
While many authors have studied polarization and echo chambers in social networks, there is not yet a consensus of what an echo chamber is. However, some characteristics of echo chambers are transversal to all its definitions: homophilic interactions drive their formation [50, 24, 14], where actors in the system choose to preferentially connect with each other with the exclusion of outsiders [9], and attitudes and beliefs stay inside groups of like-minded people [22]. In particular for interaction networks in social media, we assume that information flows through the edges of the network and that bimodal structures indicate the presence of echo chambers [14].
Under this framework, the leading users associated with an ideological group (e.g. climate skeptics), together with their audiences and their chambers, approximate an echo chamber. Our rationale is that information flows through the opposite direction of retweets, as we schematize in Fig. 2, and such information flows mostly between high-overlapping chambers. The overlap between two chambers indicates the proportion of their common users. Therefore, a multimodal overlap distribution with high-overlap modes and a low-overlap mode (close to 0) suggests that users choose to preferentially connect with each other (high-overlap modes) and exclude outsiders (low-overlap mode). If a network exhibits such characteristics, then the set of leading users should be easily partitioned as described in the previous section, so we thus introduce a definition of an echo chamber.
Definition 3.1 (Echo chamber).
Given a partition of the leading users, , obtained by clustering the chamber overlap matrix, , with the distribution containing a well-defined peak near and other well-defined peak(s) well-separated from , the echo chamber of the group is the union of the leading users, chambers, and audiences associated with . Mathematically,
| (10) |
where is the audience of and her chamber.
An echo chamber is an ill-defined concept, so we remark that Def. 3.1 is an approximation that works well for retweet networks with multimodal overlap distributions, . In this work, we only consider a partition into two groups, but we can generalize this using other clustering algorithms.
Structurally, the climate change retweet network is well-separated, so we claim that we can observe ideological echo chambers. We construct two dynamic echo chambers –per week– based on the leading users, , and our partition of climate believers and skeptics. The believers echo chamber, , contains of the total users per week, while the skeptics echo chamber, , contains . Together, they cover of the whole retweeting population per week. These echo chambers may have some overlapping users by construction, i.e., users that are classified both as believers and skeptics. However, we find that only users are in both echo chambers, indicating that the cross-communication between them is orders of magnitude lower333It might be the case that if we inspected the reply network or the followers network instead of the retweet network, the intensity of cross-communication between echo chambers could be higher..
3.1 Augmented echo chambers
In the last section, we obtained two echo chambers, and , that, combined, cover a small minority () of the whole retweeting population because we only consider the leading users, , instead of the set of high-impact users, . However, we can inspect the audiences of the remaining high-impact users and evaluate if they have a clear ideological position based on and . To do so, we design an ideology score, similar to [18], that determines if the audience of a high-impact user is biased towards being believers, skeptics, or neither of the both. We compute the ideology score, , for each high-impact user as follows
| (11) |
where is the number of users in the audience of user that are also in the echo chamber . The score is bounded between , when all the users in are climate skeptics, and when all of them are climate believers.
If the ideology score of a high-impact user is big in magnitude, we may associate her and her audience to an ideological group based on the sign of . In particular, we recognize as climate believers to those high-impact users whose scores are close to and as climate skeptics to those whose scores are close to . Thus, we can augment the echo chambers to consider the audiences of high-impact users with high-magnitude scores as we describe in the following definition.
Definition 3.2 (Augmented echo chamber).
Given the echo chambers and and the collection of high-impact users for which , with a user-defined threshold, we define their corresponding augmented echo chambers, and , as follows
| (12) | ||||
| (13) |
where is the audience of .
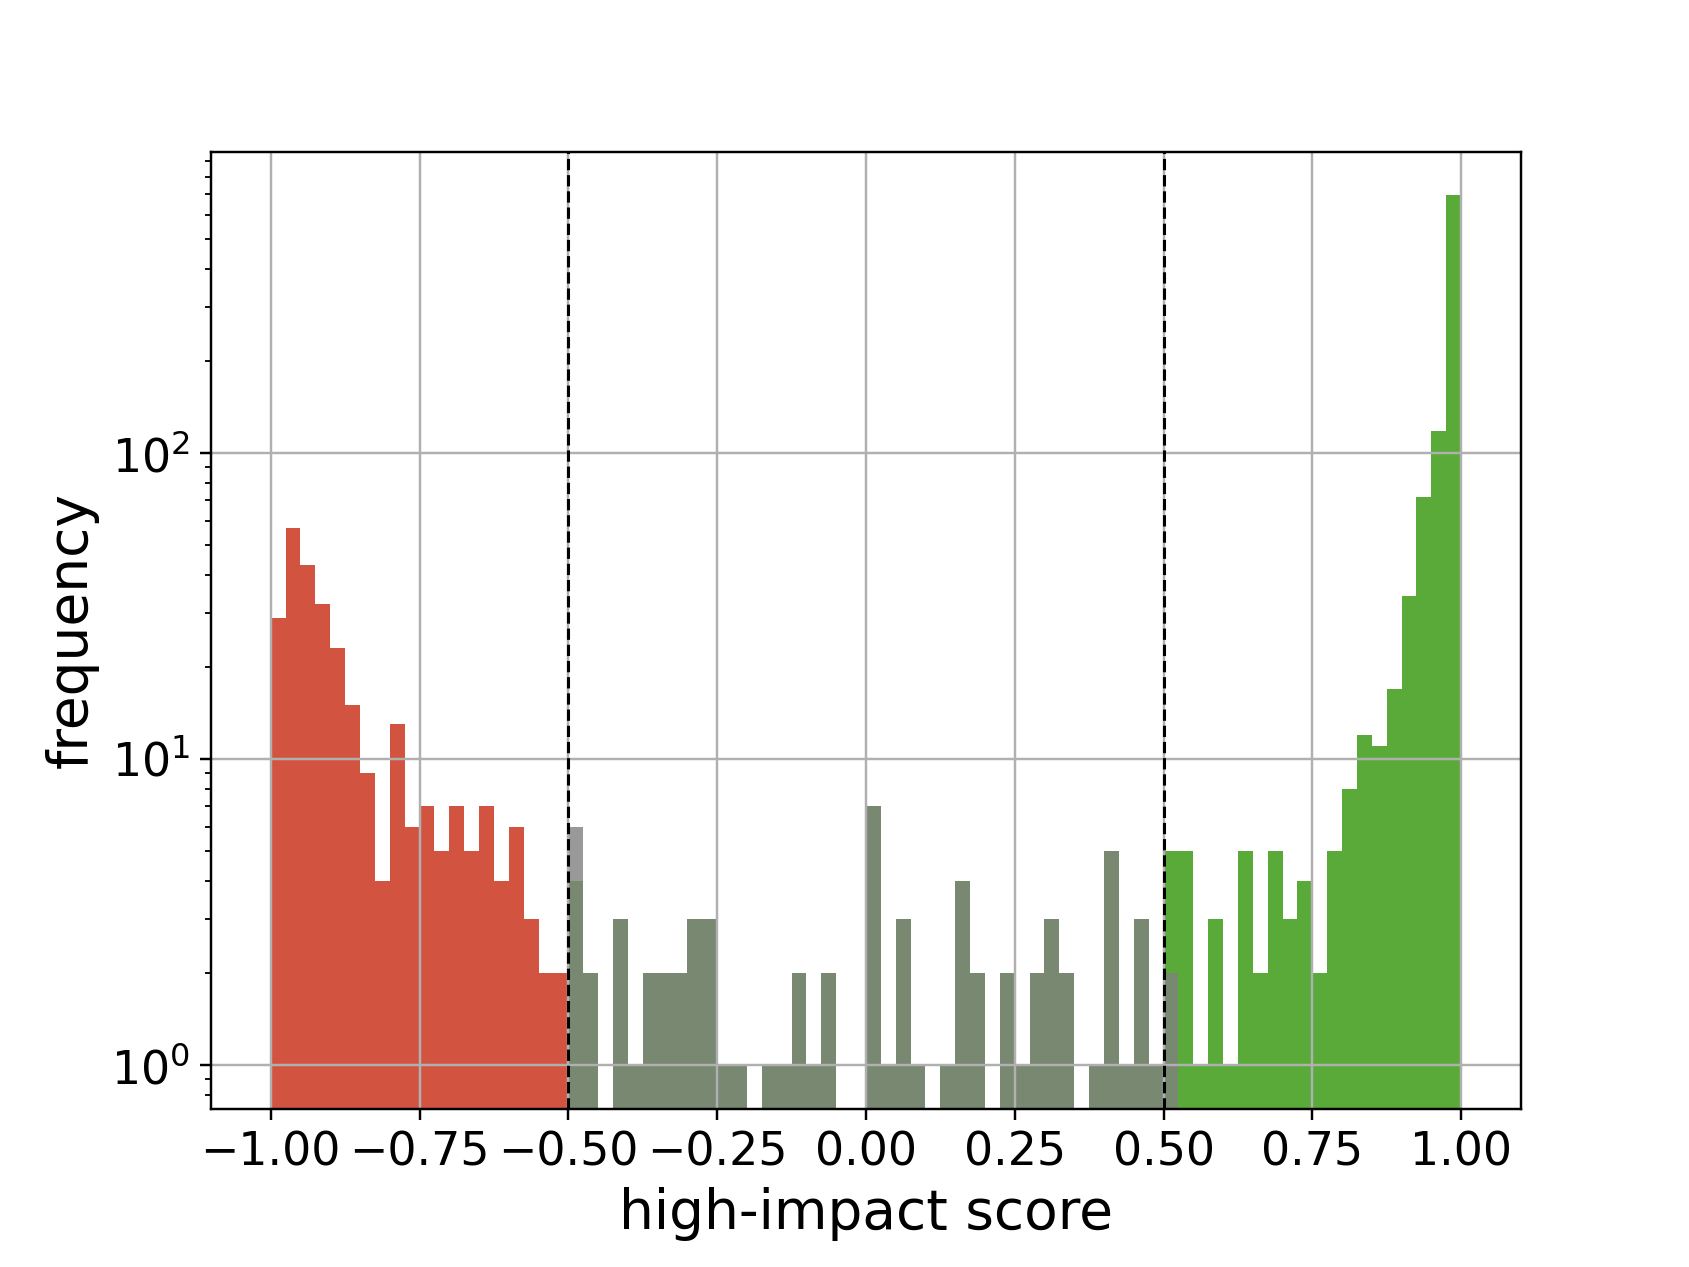
In Fig. 6, we show the ideology score distribution for the remaining high-impact users, i.e., high-impact users who are not leading users. We find that the distribution is clearly bimodal, where the mode corresponding to climate believers (right) is significantly higher than the mode corresponding to climate skeptics (left). We choose as our threshold to decide whether a high-impact user is included in the augmented echo chamber or not. Using this method, of the remaining high-impact users across all weeks, we classified as climate skeptics, as climate believers, while users remain unclassified. In addition to augmenting the number of users in the echo chambers, this method enables us to discover the ideological position of high-impact users in an unsupervised way. For instance, we identify users like @RollingStone () or @Greenpeace () as climate believers while users like @DonaldJTrumpJr () or @GovMikeHuckabee () as climate skeptics solely based on their scores. While we do not analyze users with scores below the threshold thoroughly, we noticed that low-scoring users either stay neutral with respect to climate change, e.g., @SkyNews (), or are not a strong part of their content agenda, e.g., @Imamofpeace ().
The augmented echo chambers contain of the total retweeting population, with the error bars representing the standard deviation across weeks. This result is consistent with our initial observation that the top high-impact users cover near the of the total retweeting population. Moreover, this augmentation increases the sizes of the original echo chambers by a factor of . More specifically, the believers augmented echo chamber is bigger than its original counterpart by a factor of , the skeptics by a factor of , and the users in the intersection only by a factor of .
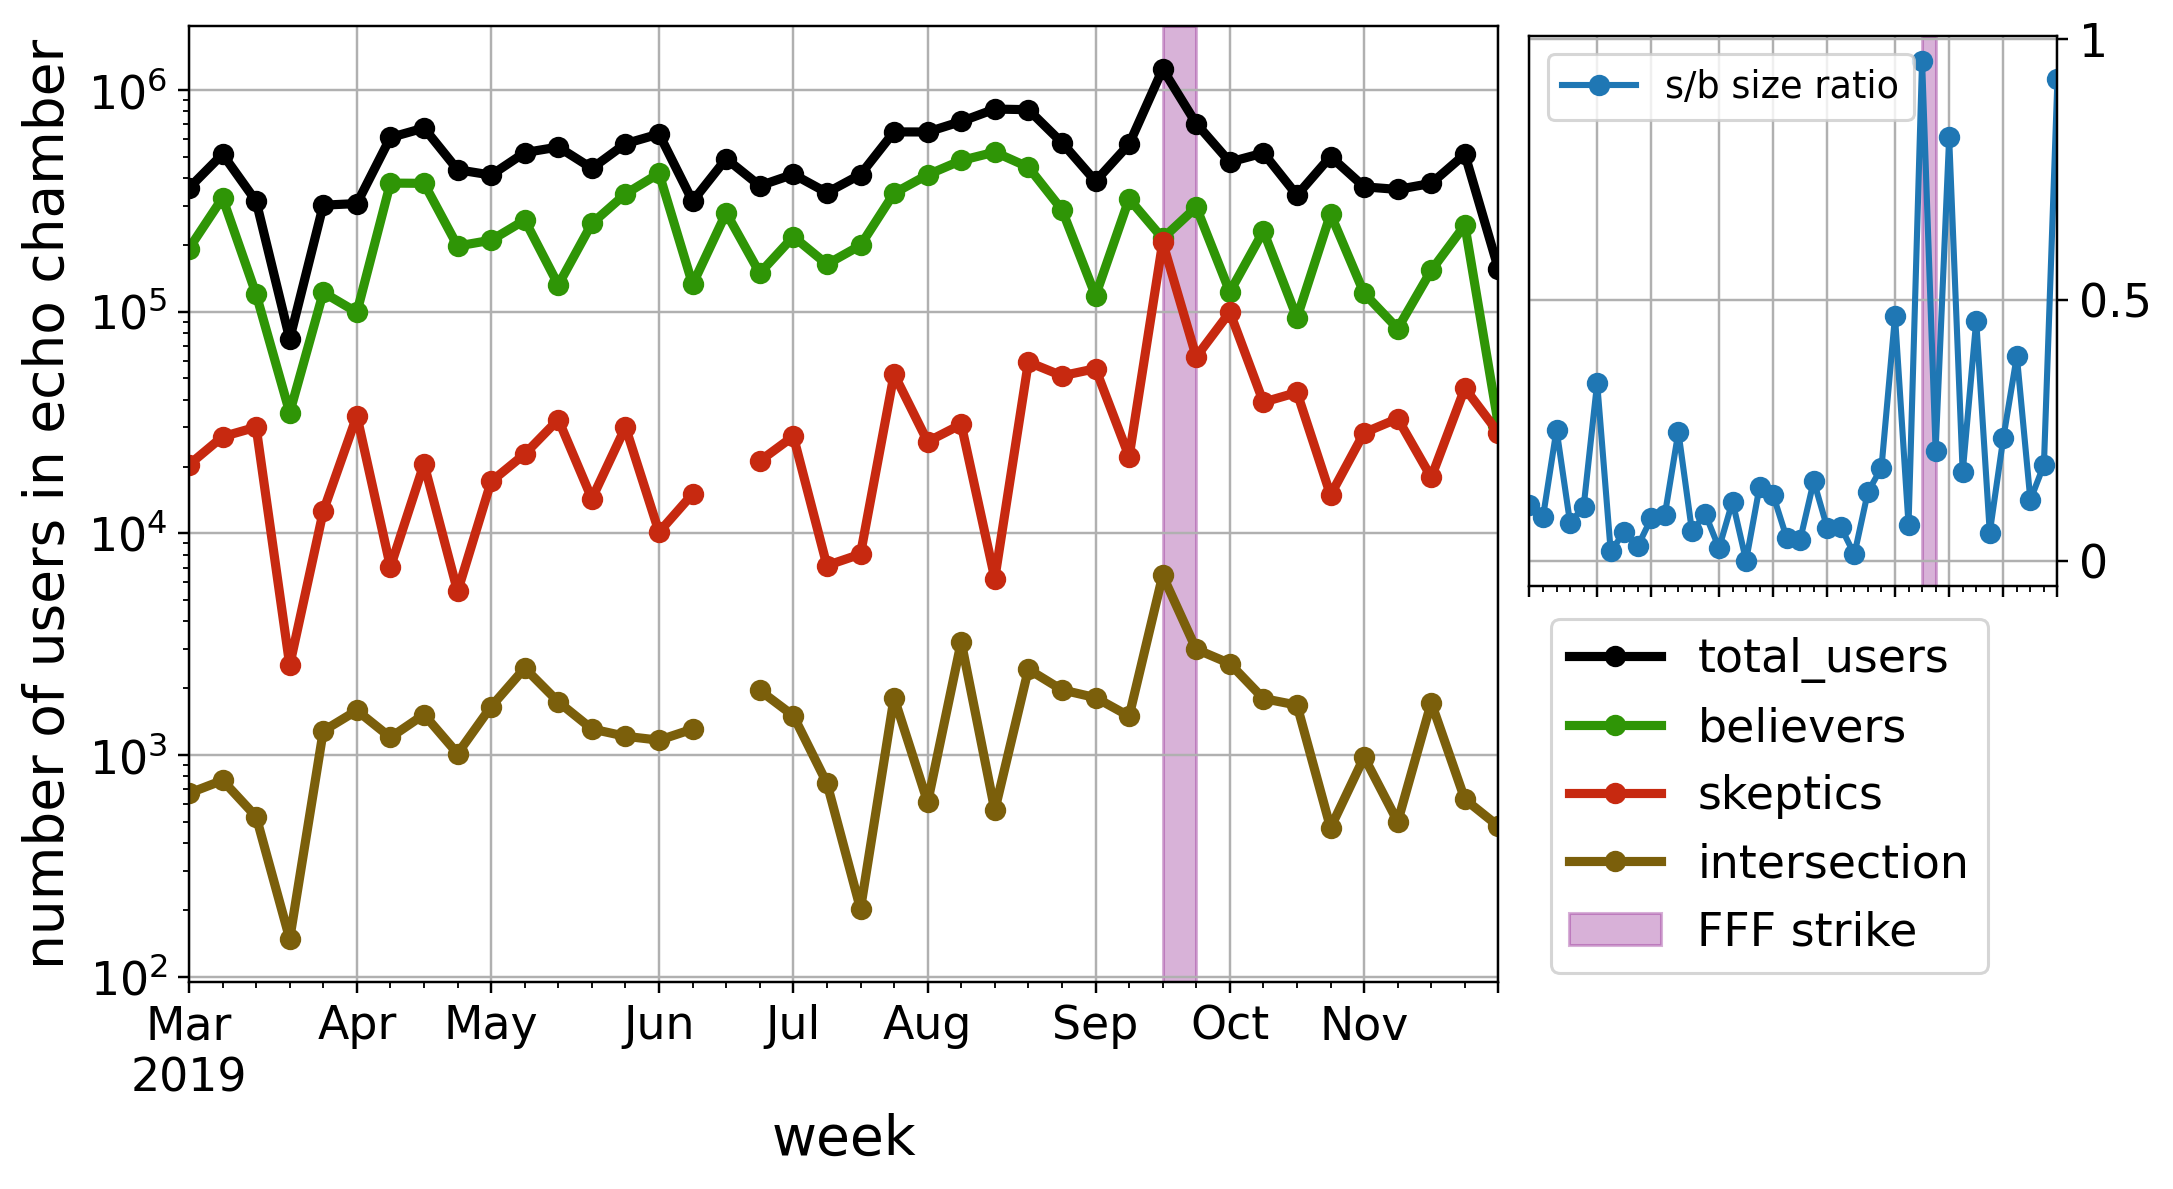
In Fig. 7, we present the sizes of the augmented echo chambers, the number of users in their intersection and the total number of retweeting users each week. For most of the year, these sizes are stable, with the believers oscillating around users and the users in the intersection oscillating around users. In contrast, the number of climate skeptics rises significantly from before the Fridays for Future September strikes [32, 44], oscillating from around users, to oscillating around users after the strikes. In the inset of the figure, we show the ratio between the number of skeptics against the number of believers, where we find a consistently higher ratio after the strikes, which we find counter intuitive in that the strikes were pro-climate events.
We believe that the correlation between the climate strikes and the increase of the skeptics’ impact is not random. Besides such an increase, we already observed in Figure 5 a significant drop in polarization at the dates of the strikes that was not caused by changes in chamber sizes. There are several explanations for such a correlation with size and polarization, ranging from an endogenous social reaction from the climate skeptics to a coordinated response using bots [13], where the bots massively retweeted the skeptic and believers leading users during the dates of the strikes. While we cannot establish its causes with this analysis, we find it remarkable that we can observe such a signal from several angles purely from our unsupervised construction of echo chambers.
3.2 Temporal flow of users within ideological groups
Most of the statistical features in our analysis are stable over time, ranging from the bimodal structure of the overlap distribution, to the number of users per week (with the exception of the peak in September that coincides with the Fridays for Future strikes), to the Gini index of the users’ impact. Yet, Twitter is very dynamic with users entering and leaving the conversation as different topics emerge and decay over time [16], as is the case of the climate change conversation [17].
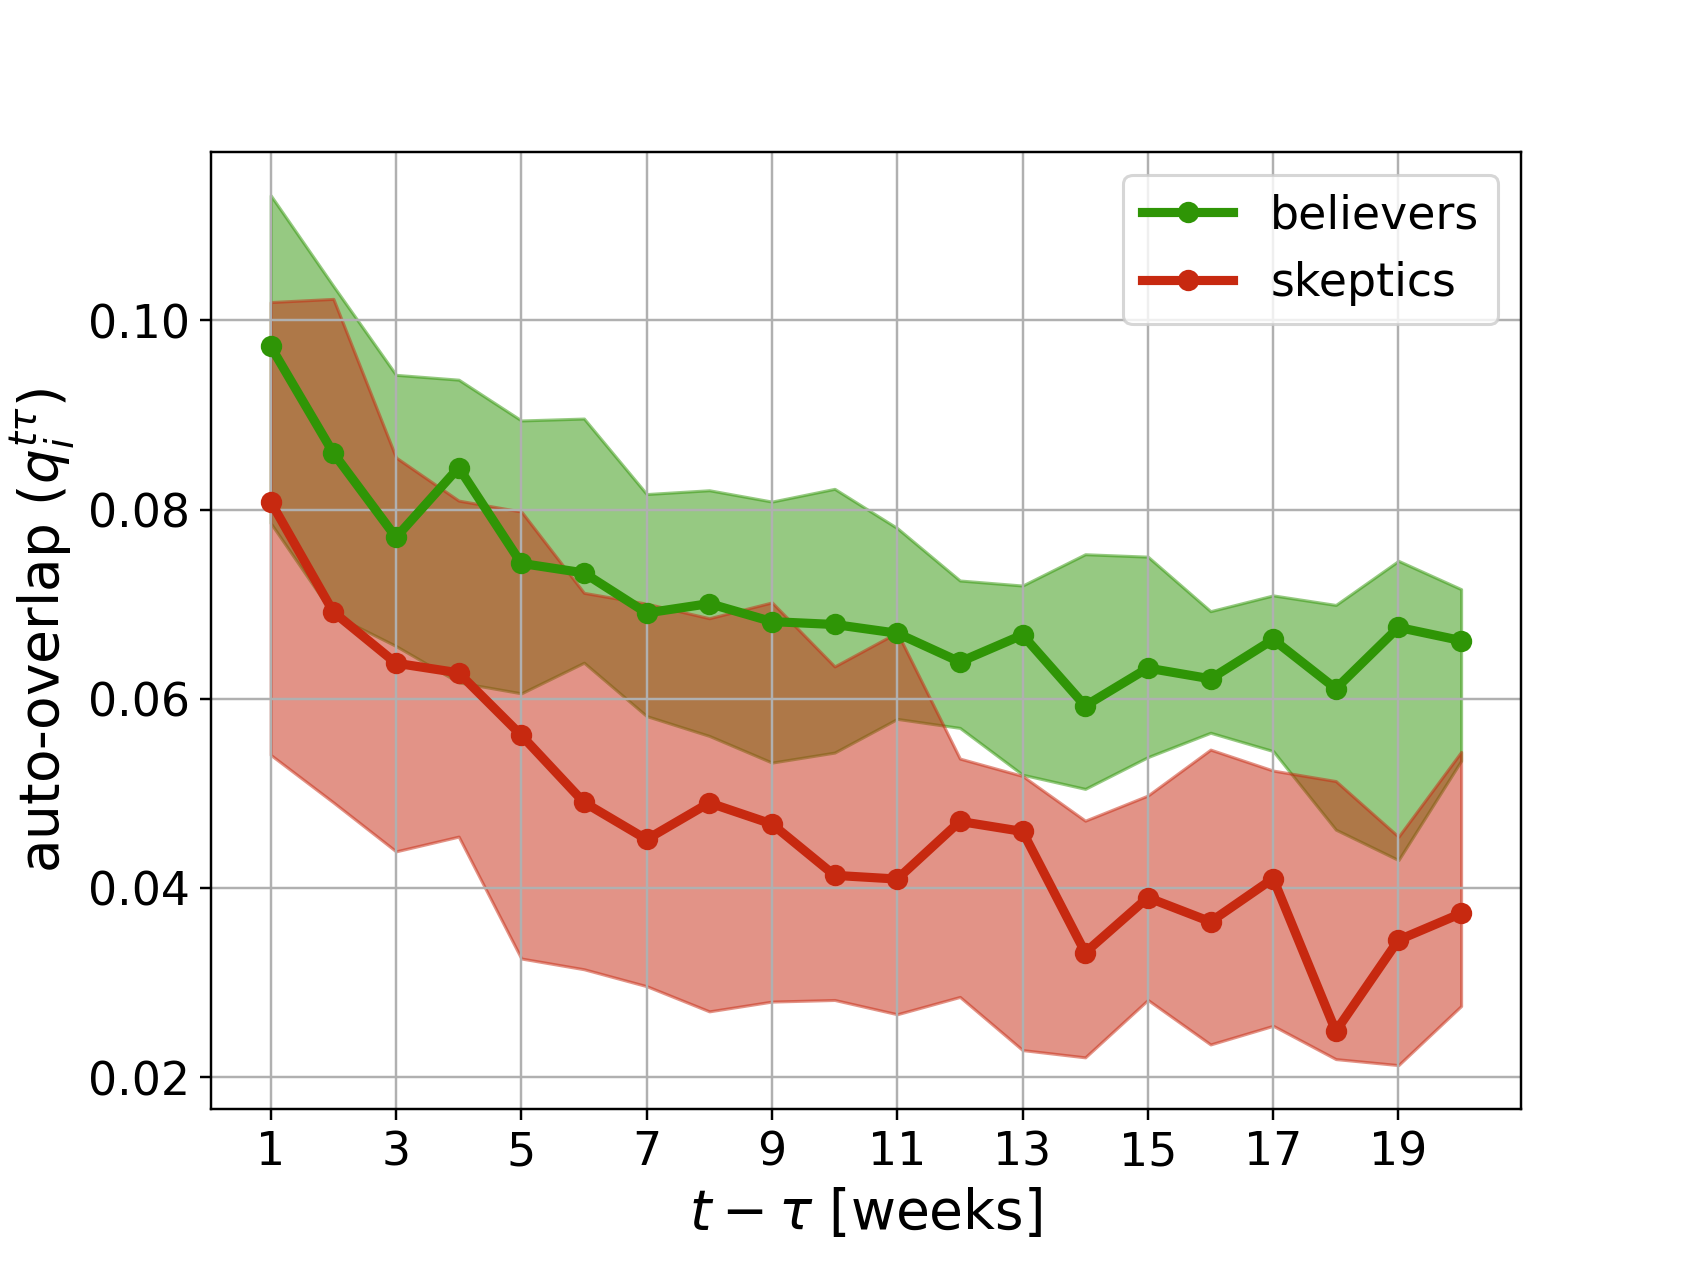
Given these contrasting facts, we test the hypotheses of whether the overall conversation is sustained by the same people over the year or there is a big flux of users at the micro level that behave consistently at the macro level. To discriminate between these two explanations, we measure the flux of users within augmented echo chambers for different time windows. A small flux of users over time would favor the first hypothesis while a significantly high flux would favor the second one. We quantify such a flux by computing the auto-overlap of an augmented echo chamber of ideology group between weeks and as follows
| (14) |
This measure is similar to the chamber overlap of Eq. (8), but instead of comparing the chamber associated with two different leading users, we compare the augmented echo chambers of the same ideological group at different times. A small value of would correspond to a high flux of users and viceversa.
In Fig. 8, we show the auto-overlap of each augmented echo chamber as a function of the number of weeks between them. We present such auto-overlaps for the believers and the skeptics separately, and, in both cases, we find that the number of common users in the chambers decay monotonically with the number of weeks passed. We find that a higher proportion of believers stay in their echo chambers compared to the skeptics. Remarkably, we find that only of the believers and of the skeptics remain in the augmented echo chamber from one week to the next, i.e., at , indicating a massive flow of users in the Twitter conversation within both ideological groups. This result thus supports our second hypothesis: at the micro level, a lot of users enter and leave the conversation from week to week, but, at the macro level, the structural properties of the interaction networks are stable.
4 Conclusion
In this paper, we identified the echo chambers of the Twitter climate change conversation using unsupervised methods. Acknowledging that typically in Twitter most retweets are given to just a handful of users [25], and assuming that retweets are a good proxy for endorsement [2, 23, 12], we analyzed the temporal structure of the climate-related retweet networks and measured the ideological similarities between leading users. We defined a leading user as that who is among the most retweeted users for several weeks throughout the conversation.
We introduced the notion of a leading user’s chamber, which is the set of users retweeted by her audience. The chambers act as the many-to-many information sources associated with a leading user’s audience [33], and we used them to measure the ideological similarities between every pair of leading users by computing their chamber overlap. We found that the chamber overlap distribution is clearly bimodal with a low-overlap peak and a significantly higher-overlap peak. Thus, we classified the leading users into two groups using an unsupervised spectral clustering algorithm [36] and recognized one group as the climate believers and the other as the climate skeptics, validating previous findings [49, 46, 12].
Based on the bimodal structure of the chamber overlap distribution, we defined an echo chamber as the union of the same group’s leading users with their associated audiences and chambers. Such a bimodality implies several features that characterize echo chambers: homophilic interactions drive their formation [50, 24, 14], actors inside them choose to preferentially connect with the exclusion of outsiders [9], and attitudes and beliefs stay inside groups of like-minded people [22]. We identified, on average per week, of the total retweeting population as climate believers, as climate skeptics, and only of users classified as both believers and skeptics, suggesting that the cross-communication between echo chambers is negligible.
Furthermore, we designed an ideology score that uncovers the ideological position of any high-impact user, even when she has not been observed previously. This score depends on the proportion of her audience that belongs to either of the echo chambers, and we found that the ideology score distribution over all the high-impact users is bimodal, with modes at opposite extremes of the ideological spectrum. This finding reinforces our claim that the users inside the echo chambers are mostly like-minded. We validated the ideological positions of some of the high-impact users discovered with the ideology score. For instance, we uncovered the global campaigning network Green Peace (@Greenpeace) as a climate believer, the Republican governor Mike Huckabee (@GovMikeHuckabee) as a climate skeptic, and the British news channel Sky News (@SkyNews) as a neutral user.
Using the uncovered ideologies, we augmented our original echo chambers by combining them with the audiences of the high-impact users that share the same ideological position. Thus, the augmented echo chambers constitute more than half of the weekly retweeting population ( climate believers, climate skeptics, and only of users classified in both ideological groups). We observed that, in most cases, the number of users in each echo chamber is roughly stable throughout the year. However, we found a strong positive correlation between the dates of the main #FridaysForFuture strikes and the skeptics’ echo chamber sizes but not with the believers’. We find it remarkable that we could identify peak activity of certain parts of the population by using completely unsupervised methods. Moreover, we measured the flux of users within echo chambers as a function of time, where we found that most () users leave their echo chambers from one week to the next. This result suggests that the stable properties of the echo chambers are an emergent feature of the system and not imposed by a fixed set of users.
We see several directions for future development of this method. First, we only assessed two ideological positions in our analysis, whereas Twitter discussions may have an arbitrary number of communities. Thus, we could consider more general community detection algorithms, ranging from inference methods able to fix the number of communities [37] to methods that maximize some notion of community and result in optimal partitions with an unsupervised number of clusters [6, 39]. With more than two ideologies, we should generalize our definition ideology score to a multi-class setting by, e.g., measuring the proportion of users in each echo chamber in a higher-dimensional simplex. Second, we do not distinguish between the nature of the Twitter users, so we did not analyze the different effects that validated accounts, non-human accounts, and bots may bring into the conversation. Previous large-scale studies of Twitter data have demonstrated the influence bots can have on the exposure of human accounts to emotional content [5], and how they can coordinate and distort the discussion in controversial conversations [13, 8]. Thus, we could incorporate bot-detection methods and create a taxonomy of users to analyze their effects.
We intentionally focused only on who and not on what the Twitter users consumed to perform our classification. Such approach is limited with respect of supervised approaches. Analyzing the tweets’ content would give us more information about the ideological position of its users and help us reinforce the existence of echo chambers [14] and uncover relevant topics of discussions within and between ideological groups [7]. Nevertheless, we see our results as a proof of concept that the echo chamber structure can be observed clearly even without looking at the content of tweets. While the ideology of individual users posses a non-negligible degree of uncertainty, at the aggregate level, we clearly observed presence of distinct ideologies each with distinct structural features. In addition, we believe it is important to perform an initial analysis before biasing with external information. Such an initial unsupervised approach could also be useful in indicating starting points of subsequent more complicated analyses.
Overall, we believe our work highlights the importance and usefulness of exploiting the structural information present in social media networks, especially when looking at controversial conversations. Our methodology is computationally cheap, readily usable for other Twitter datasets, and does not suffer from the selection bias of supervised approaches. Furthermore, we showed that if the conversation is polarized enough, we can identify echo chambers just by looking at the handful of users that produce the most important tweets, which is easier than deploying clustering algorithms on the whole network. From a social point of view, this condition shows that the climate-related Twitter conversation –and possibly most conversations in Twitter [25]– has very low complexity, meaning that we can identify large scale structures within the conversation just from the activity of the few leading users.
Acknowledgments
BK acknowledges funding from the Conacyt-SENER: Sustentabilidad Energética scholarship. FAL is supported by a grant from the Simons foundation (grant No. 454941, S. Franz). The authors would like to thank Luca Mungo, Santiago Martínez Balvanera, Alexandre Bovet, and Doyne Farmer for proofreading the manuscript and providing very valuable feedback. BK is greateful with the INET Complexity Economics group for stimulating discussions.
Code Availability
All the code for this work is in Python and is freely available at https://github.com/blas-ko/Twitter_chambers.
References
- [1] IPCC 2022 “Summary for Policymakers” In Climate Change 2022: Impacts, Adaptation, and Vulnerability. Contribution of Working Group II to the Sixth Assessment Report of the Intergovernmental Panel on Climate Change Cambridge University Press., In Press
- [2] Pablo Barberá “Birds of the same feather tweet together: Bayesian ideal point estimation using Twitter data” In Political analysis 23.1 Cambridge University Press, 2015, pp. 76–91
- [3] Mariano Beguerisse-Díaz et al. “The ‘who’and ‘what’of# diabetes on Twitter” In Digital health 3 SAGE Publications Sage UK: London, England, 2017, pp. 2055207616688841
- [4] Yochai Benkler “The wealth of networks” In The Wealth of Networks Yale university press, 2008
- [5] Alessandro Bessi and Emilio Ferrara “Social bots distort the 2016 US Presidential election online discussion” In First monday 21.11-7, 2016
- [6] Vincent D Blondel, Jean-Loup Guillaume, Renaud Lambiotte and Etienne Lefebvre “Fast unfolding of communities in large networks” In Journal of statistical mechanics: theory and experiment 2008.10 IOP Publishing, 2008, pp. P10008
- [7] Alexandre Bovet, Flaviano Morone and Hernán A Makse “Validation of Twitter opinion trends with national polling aggregates: Hillary Clinton vs Donald Trump” In Scientific reports 8.1 Nature Publishing Group, 2018, pp. 1–16
- [8] Matteo Bruno, Renaud Lambiotte and Fabio Saracco “Brexit and bots: characterizing the behaviour of automated accounts on Twitter during the UK election” In EPJ Data Science 11.1 Springer Berlin Heidelberg, 2022, pp. 17
- [9] Axel Bruns “Echo chamber? What echo chamber? Reviewing the evidence” In 6th Biennial Future of Journalism Conference (FOJ17), 2017
- [10] Roger W Caves “Encyclopedia of the City” Routledge, 2004
- [11] Andrea Ceron, Luigi Curini and Stefano M Iacus “First-and second-level agenda setting in the Twittersphere: An application to the Italian political debate” In Journal of Information Technology & Politics 13.2 Taylor & Francis, 2016, pp. 159–174
- [12] Ted Hsuan Yun Chen et al. “Polarization of climate politics results from partisan sorting: Evidence from Finnish Twittersphere” In Global Environmental Change 71 Elsevier, 2021, pp. 102348
- [13] Matteo Cinelli et al. “Coordinated inauthentic behavior and information spreading on twitter” In Decision Support Systems Elsevier, 2022, pp. 113819
- [14] Matteo Cinelli et al. “The echo chamber effect on social media” In Proceedings of the National Academy of Sciences 118.9 National Acad Sciences, 2021
- [15] Emily M Cody et al. “Climate change sentiment on Twitter: An unsolicited public opinion poll” In PloS one 10.8 Public Library of Science San Francisco, CA USA, 2015, pp. e0136092
- [16] Carmela Comito, Agostino Forestiero and Clara Pizzuti “Bursty event detection in Twitter streams” In ACM Transactions on Knowledge Discovery from Data (TKDD) 13.4 ACM New York, NY, USA, 2019, pp. 1–28
- [17] Biraj Dahal, Sathish AP Kumar and Zhenlong Li “Topic modeling and sentiment analysis of global climate change tweets” In Social network analysis and mining 9.1 Springer, 2019, pp. 1–20
- [18] Michela Del Vicario et al. “Mapping social dynamics on Facebook: The Brexit debate” In Social Networks 50 Elsevier, 2017, pp. 6–16
- [19] Joel Dyer and Blas Kolic “Public risk perception and emotion on Twitter during the Covid-19 pandemic” In Applied Network Science 5.1 SpringerOpen, 2020, pp. 1–32
- [20] Magdalini Eirinaki, Jerry Gao, Iraklis Varlamis and Konstantinos Tserpes “Recommender systems for large-scale social networks: A review of challenges and solutions” In Future Generation Computer Systems 78 Elsevier, 2018, pp. 413–418
- [21] David Foster, Jacob Foster, Maya Paczuski and Peter Grassberger “Communities, clustering phase transitions, and hysteresis: Pitfalls in constructing network ensembles” In Phys. Rev. E 81 American Physical Society, 2010, pp. 046115 DOI: 10.1103/PhysRevE.81.046115
- [22] Kiran Garimella, Gianmarco De Francisci Morales, Aristides Gionis and Michael Mathioudakis “Quantifying controversy on social media” In ACM Transactions on Social Computing 1.1 ACM New York, NY, USA, 2018, pp. 1–27
- [23] Noé Gaumont, Maziyar Panahi and David Chavalarias “Reconstruction of the socio-semantic dynamics of political activist Twitter networks—Method and application to the 2017 French presidential election” In PloS one 13.9 Public Library of Science San Francisco, CA USA, 2018, pp. e0201879
- [24] Nabeel Gillani et al. “Me, my echo chamber, and I: introspection on social media polarization” In Proceedings of the 2018 World Wide Web Conference, 2018, pp. 823–831
- [25] Maria Glenski, Tim Weninger and Svitlana Volkova “Propagation from deceptive news sources who shares, how much, how evenly, and how quickly?” In IEEE Transactions on Computational Social Systems 5.4 IEEE, 2018, pp. 1071–1082
- [26] Sharad Goel, Ashton Anderson, Jake Hofman and Duncan J Watts “The structural virality of online diffusion” In Management Science 62.1 INFORMS, 2016, pp. 180–196
- [27] Remco van der Hofstad “Random Graphs and Complex Networks”, Cambridge Series in Statistical and Probabilistic Mathematics Cambridge University Press, 2016 DOI: 10.1017/9781316779422
- [28] Matthew J. Hornsey, Emily A. Harris and Kelly S. Fielding “Relationships among conspiratorial beliefs, conservatism and climate scepticism across nations” In Nature Climate Change 8.7 Springer US, 2018, pp. 614–620 DOI: 10.1038/s41558-018-0157-2
- [29] S Mo Jang and P Sol Hart “Polarized frames on “climate change” and “global warming” across countries and states: Evidence from Twitter big data” In Global Environmental Change 32 Elsevier, 2015, pp. 11–17
- [30] Julie Jiang, Xiang Ren and Emilio Ferrara “Social Media Polarization and Echo Chambers in the Context of COVID-19: Case Study” In JMIRx med 2.3 JMIR Publications Inc., Toronto, Canada, 2021, pp. e29570
- [31] Joakim Kulin, Ingemar Johansson Sevä and Riley E Dunlap “Nationalist ideology, rightwing populism, and public views about climate change in Europe” In Environmental politics 30.7 Taylor & Francis, 2021, pp. 1111–1134
- [32] Sandra Laville and Jonathan Watts “Across the globe, millions join biggest climate protest ever” In The Guardian, 2019 URL: https://www.theguardian.com/environment/2019/sep/21/across-the-globe-millions-join-biggest-climate-protest-ever
- [33] Hai Liang et al. “How did Ebola information spread on twitter: broadcasting or viral spreading?” In BMC public health 19.1 BioMed Central, 2019, pp. 1–11
- [34] Fabián Aguirre López and Anthony C C Coolen “Transitions in random graphs of fixed degrees with many short cycles” In Journal of Physics: Complexity 2.3 IOP Publishing, 2021, pp. 035010 DOI: 10.1088/2632-072x/abf316
- [35] Miller McPherson, Lynn Smith-Lovin and James M Cook “Birds of a feather: Homophily in social networks” In Annual review of sociology 27.1 Annual Reviews 4139 El Camino Way, PO Box 10139, Palo Alto, CA 94303-0139, USA, 2001, pp. 415–444
- [36] Bojan Mohar “Some applications of Laplace eigenvalues of graphs” In Graph symmetry Springer, 1997, pp. 225–275
- [37] Tiago P Peixoto “Bayesian stochastic blockmodeling” In Advances in network clustering and blockmodeling Wiley Online Library, 2019, pp. 289–332
- [38] Wouter Poortinga et al. “Climate change perceptions and their individual-level determinants: A cross-European analysis” In Global Environmental Change 55 Elsevier, 2019, pp. 25–35
- [39] Martin Rosvall and Carl T Bergstrom “Maps of random walks on complex networks reveal community structure” In Proceedings of the national academy of sciences 105.4 National Acad Sciences, 2008, pp. 1118–1123
- [40] Camille Roth, Jonathan St-Onge and Katrin Herms “Quoting is not Citing: Disentangling Affiliation and Interaction on Twitter” In International Conference on Complex Networks and Their Applications, 2021, pp. 705–717 Springer
- [41] Arif Mohaimin Sadri, Samiul Hasan, Satish V Ukkusuri and Juan Esteban Suarez Lopez “Analysis of social interaction network properties and growth on Twitter” In Social Network Analysis and Mining 8.1 Springer, 2018, pp. 1–13
- [42] David W Scott “Multivariate density estimation: theory, practice, and visualization” John Wiley & Sons, 2015
- [43] Orowa Sikder, Robert E Smith, Pierpaolo Vivo and Giacomo Livan “A minimalistic model of bias, polarization and misinformation in social networks” In Scientific reports 10.1 Nature Publishing Group, 2020, pp. 1–11
- [44] Matthew Taylor, Jonathan Watts and John Bartlett “Climate crisis: 6 million people join latest wave of global protests” In The Guardian, 2019 URL: https://www.theguardian.com/environment/2019/sep/27/climate-crisis-6-million-people-join-latest-wave-of-worldwide-protests
- [45] Kathie M.d.I. Treen, Hywel T.P. Williams and Saffron J. O’Neill “Online misinformation about climate change” In Wiley Interdisciplinary Reviews: Climate Change 11.5, 2020, pp. 1–20 DOI: 10.1002/wcc.665
- [46] Aman Tyagi, Matthew Babcock, Kathleen M Carley and Douglas C Sicker “Polarizing tweets on climate change” In International Conference on Social Computing, Behavioral-Cultural Modeling and Prediction and Behavior Representation in Modeling and Simulation, 2020, pp. 107–117 Springer
- [47] Giuseppe A Veltri and Dimitrinka Atanasova “Climate change on Twitter: Content, media ecology and information sharing behaviour” In Public Understanding of Science 26.6 SAGE Publications Sage UK: London, England, 2017, pp. 721–737
- [48] Peter C Wason “On the failure to eliminate hypotheses in a conceptual task” In Quarterly journal of experimental psychology 12.3 SAGE Publications Sage UK: London, England, 1960, pp. 129–140
- [49] Hywel TP Williams, James R McMurray, Tim Kurz and F Hugo Lambert “Network analysis reveals open forums and echo chambers in social media discussions of climate change” In Global environmental change 32 Elsevier, 2015, pp. 126–138
- [50] Yan Xia, Ted Hsuan Yun Chen and Mikko Kivelä “Spread of tweets in climate discussions: A case study of the 2019 nobel peace prize announcement” In Nordic Journal of Media Studies 3.1, 2021, pp. 96–117
Appendix A Soft configuration model
In order to estimate the overlap distribution in a random network we analyze the degree sequence of the empirical retweet network (with adjacency matrix ) using the configuration model [[27], Chapter 7] with a soft constraint on the in-degree
| (15) |
This choice of randomness results in networks with a locally tree like structure, more realistic choices can be proposed but they are in general harder to control when trying to match with real networks, [34, 21]. The relevant observables are also harder to compute analytically, we therefore choose to work with the locally tree like structure of the configuration model.
We can then approximate the expected overlap of the configuration model as follows
| (16) |
which is the sum of joint probabilities of a user being in both and , assuming independence. We need to calculate this probability, which for the configuration model it is simply
| (17) |
where is the probability of user retweeting and not or viceversa.
We can do a similar analysis for the overlap similarity between audiences:
| (18) |
where
| (19) |
Appendix B Unsupervised clustering
We take an spectral clustering approach to obtain the communities of the leading users. We consider the similarity Laplacian matrix, , where is the overlap similarity matrix aggregated over all the weeks in the dataset, and is a diagonal matrix with the degree sequence of in the diagonal, i.e., we have that and for .
By the spectral properties of , we know that connected networks have a smallest eigenvalue of followed by positive eigenvalues. The second smallest eigenvalue , also called the algebraic connectivity, reflects how well-connected the network is. Its associated eigenvector, , also called the Fiedler vector, is typically used to partition networks into two non-trivial communities that minimize that cut size, i.e., it minimizes the sum of weights between the groups [36].
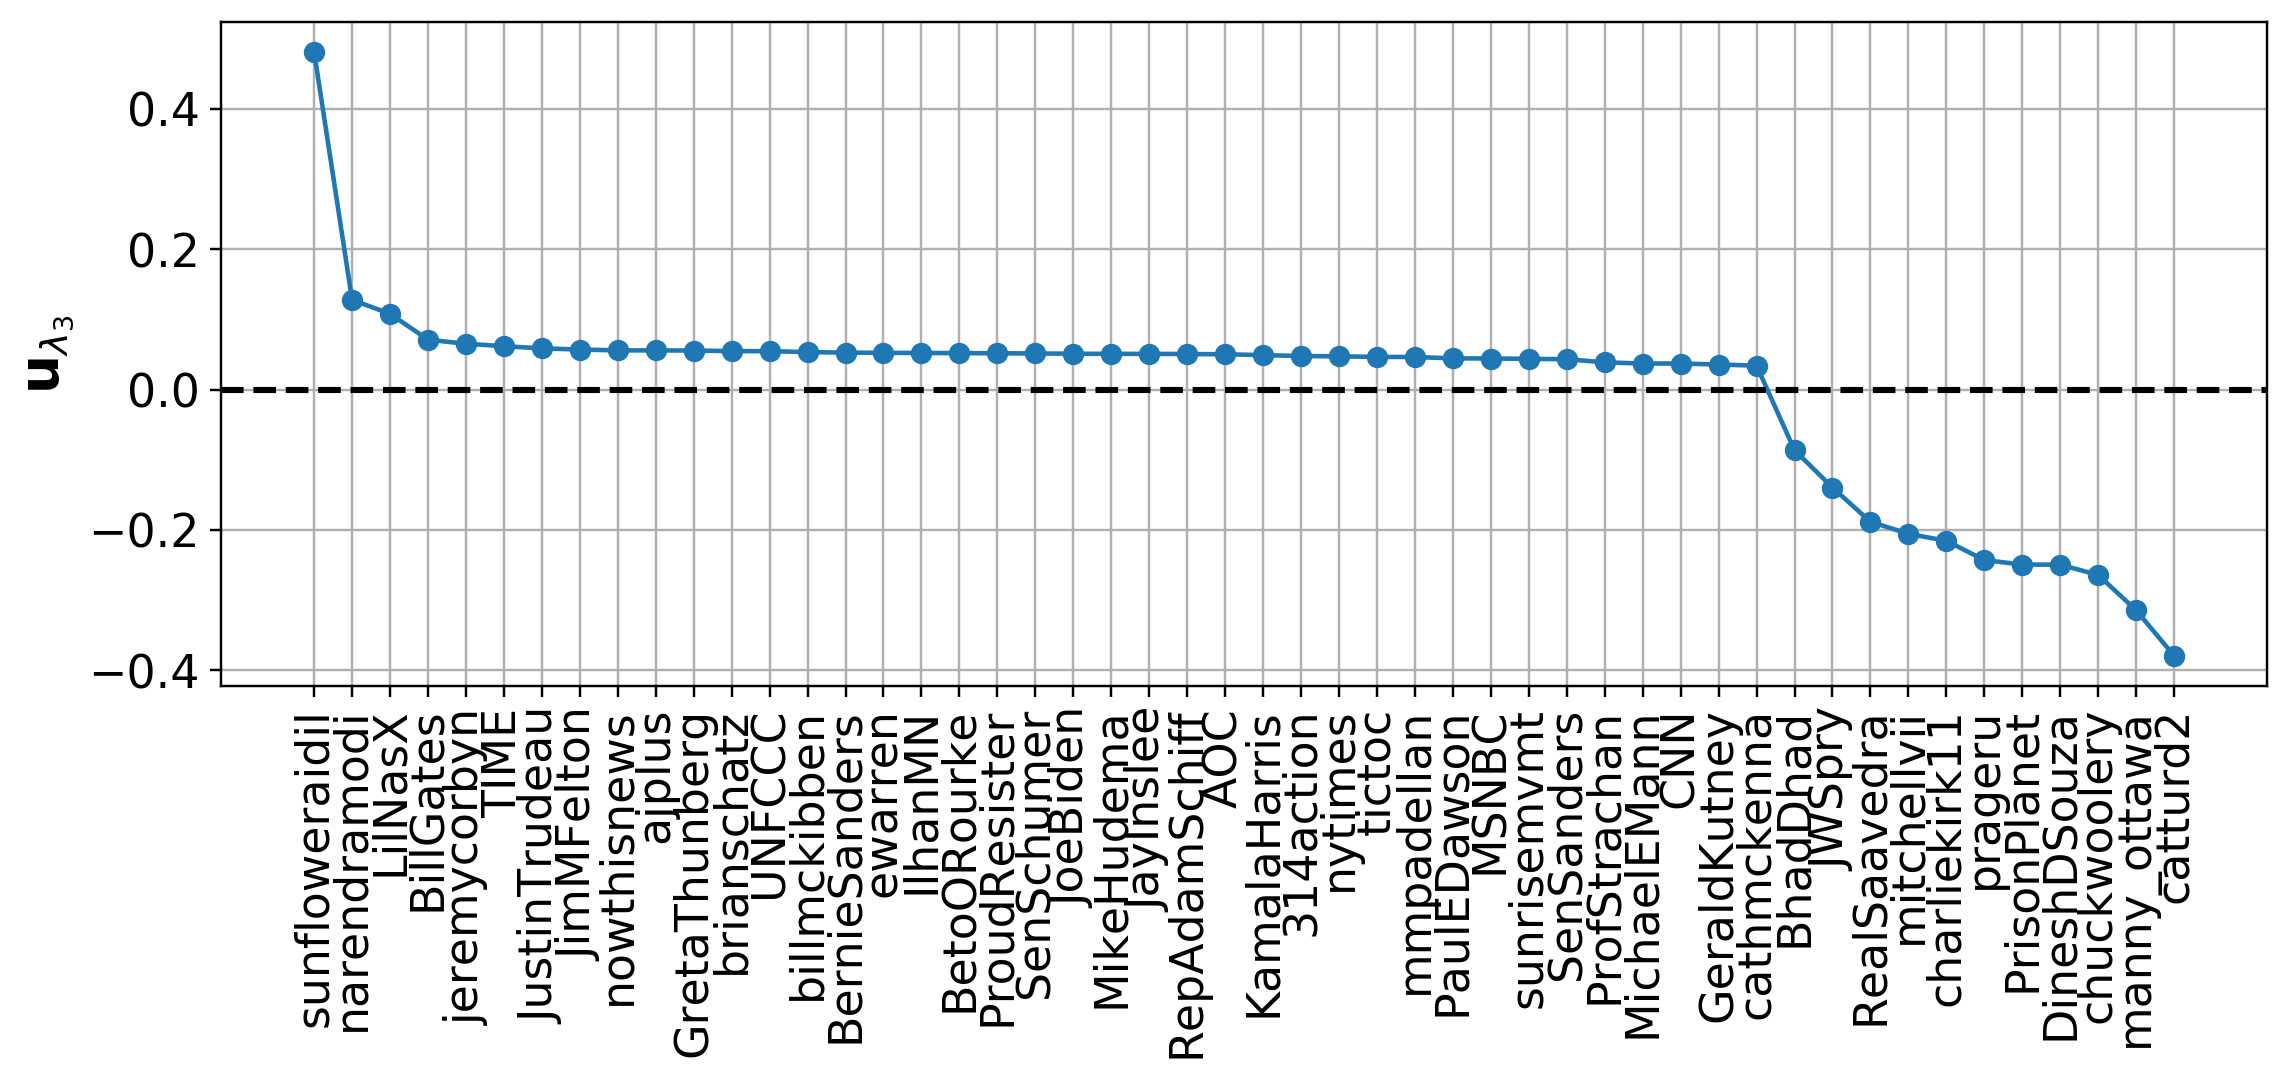
In the case of the Laplacian of the aggregate overlap similarity matrix, the second smallest eigenvector separates the satellite users (namely, BhadDhad, narendramodi, sunfloweraidi and LilNasX) from the rest of the network. While the separation associated the second eigenvalue separates the network in almost independent connected components, it does not capture the groups seuggested by the bimodality of the overlap distribution. Instead, we take the eigenvector associated with the third smallest eigenvalue, , to partition the leading users into two groups. We identify the entries of that are greater than zero as climate believers while the entries smaller than zero as climate skeptics. In Fig. 9, we show the individual entries of , where each entry corresponds to a leading user.
Appendix C Comparing chambers and audiences
Many recent studies about polarization on social media have used a first-neighbors approach to characterize the structure of the interaction networks [14, 30, 12, 49]. In Twitter, retweets have been used extensively as a proxy for endorsement [2, 23], so retweet networks have been used to study the assortative structure of several conversations. In this work’s terminology, these studies have studied the audience of a set of users to quantify polarization, echo chambers, and other nontrivial social structures. We argue that the chamber is, under certain conditions, a more robust tool to quantify such social structures, both conceptually and mathematically. The difference being that looking at the chamber corresponds to looking at the information sources of the audience, a second-neighbors approach.
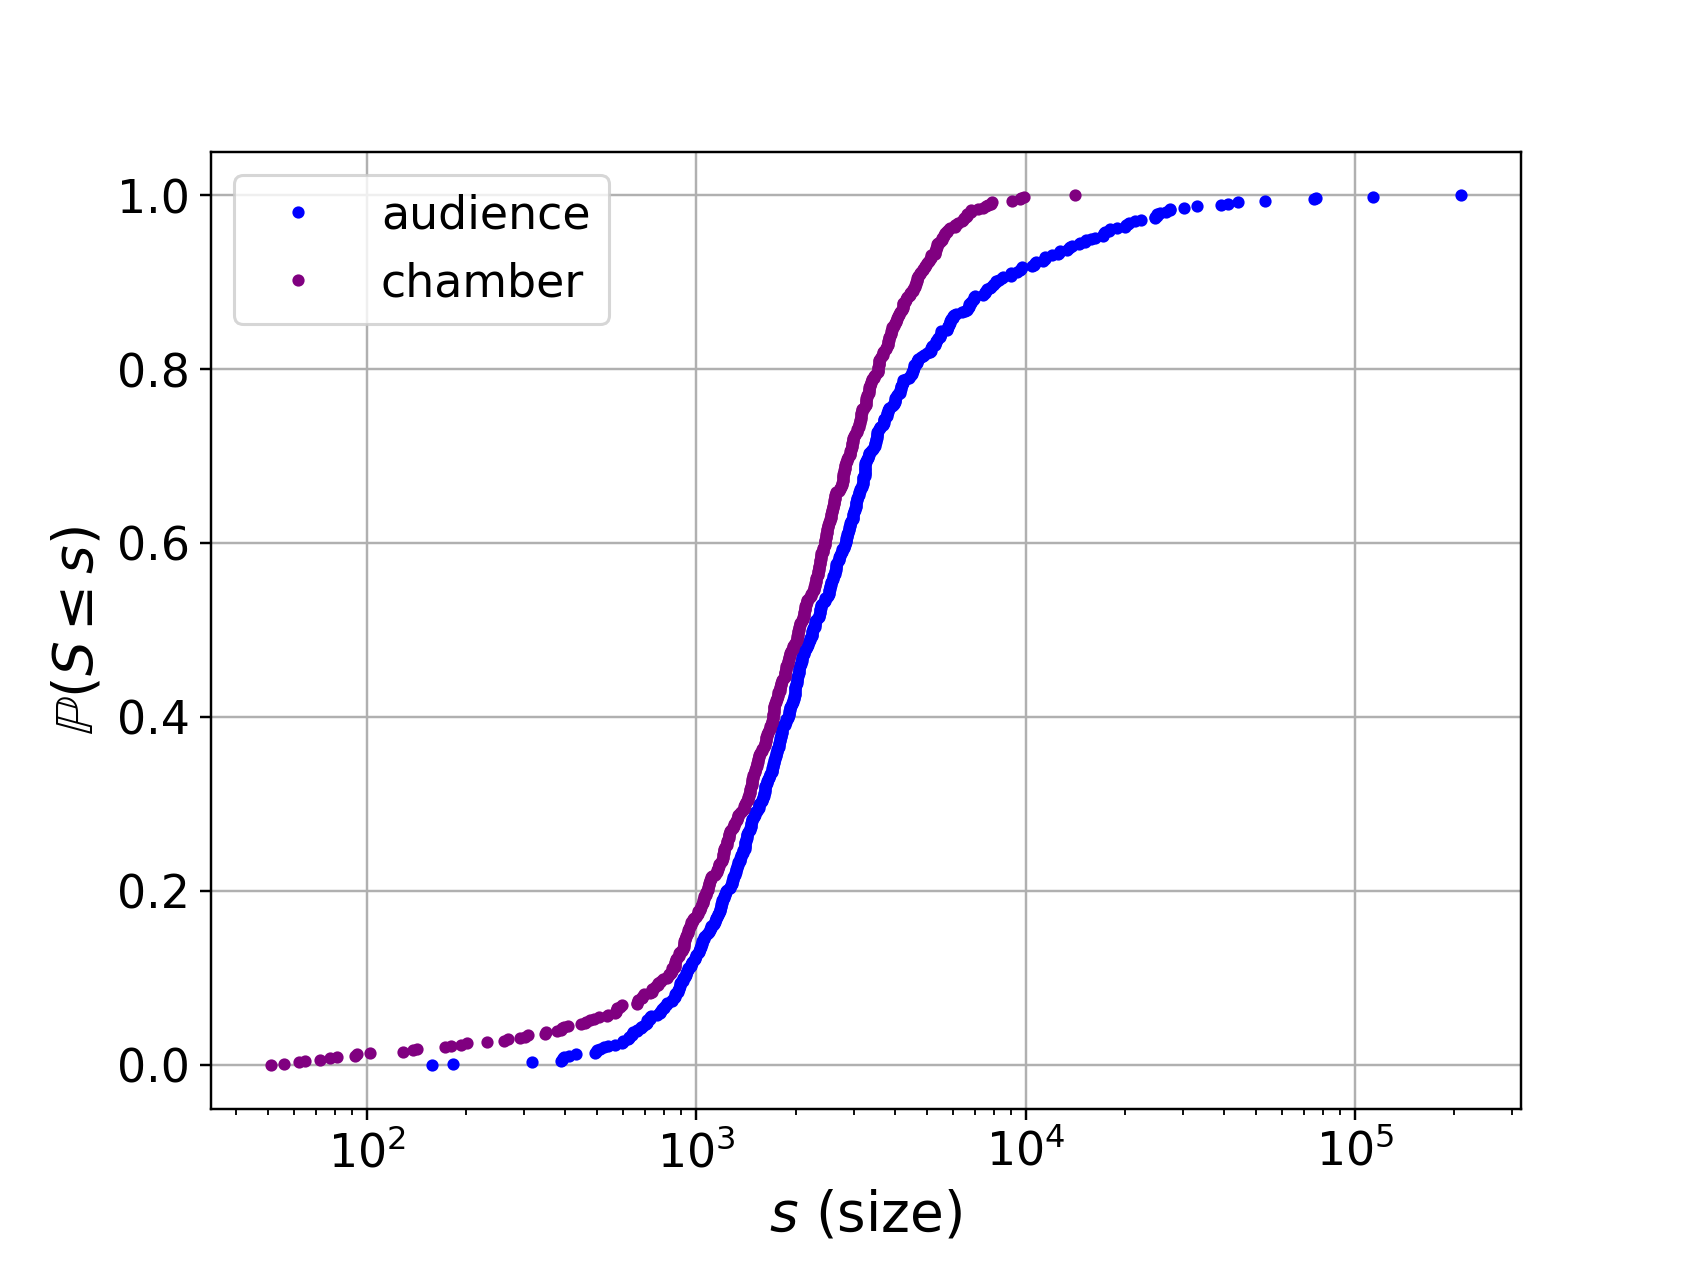
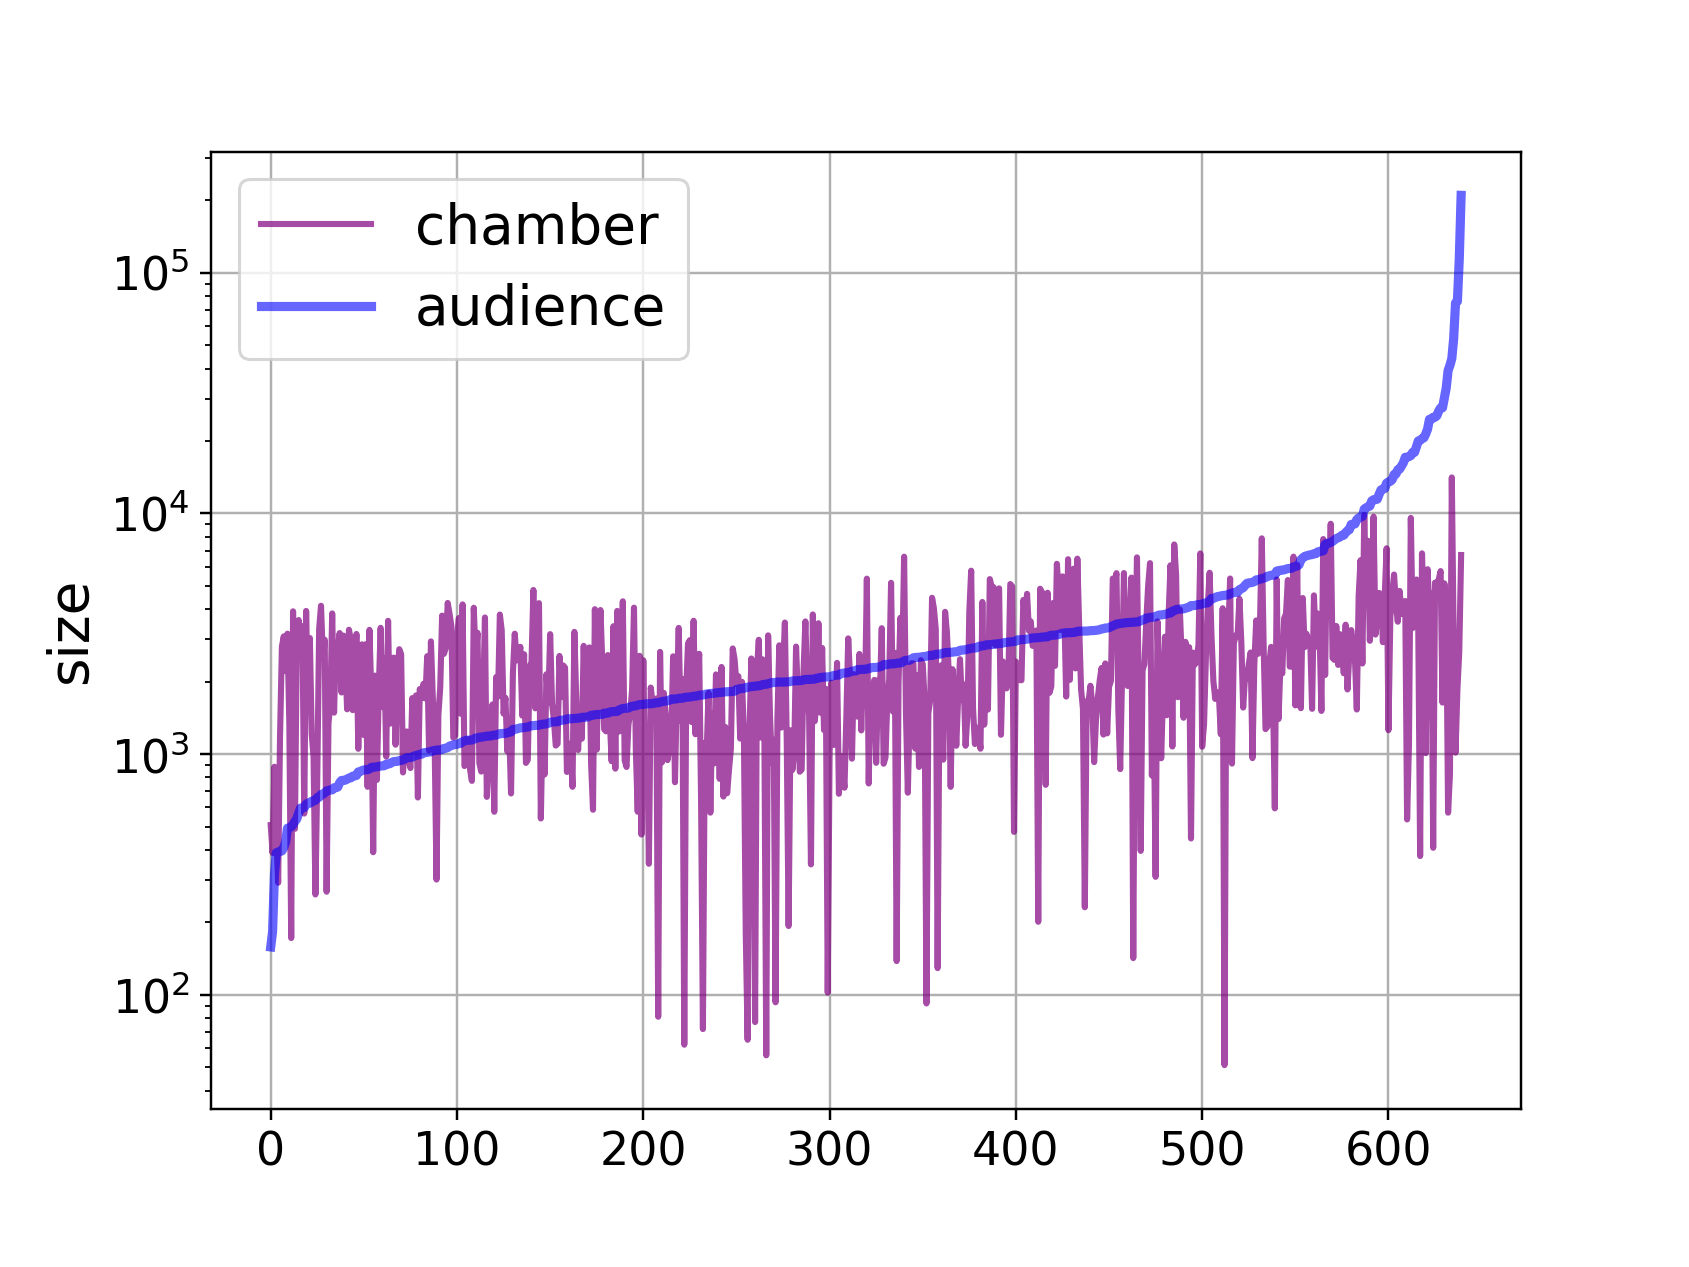
From a mathematical perspective, for the null model the expected overlap between the audiences of two high-impact users is significantly lower than the expected overlap between chambers (see Appendix A for details). Which suggests that typically the chamber overlap should have a higher signal to noise ratio. Moreover, in the case of the climate change retweet network the distribution of chamber sizes has a significantly lower spread than that of the audience, as we show in Fig. 10(a). In other words, many chambers are of roughly the same size while the audiences sizes vary a lot. The overlap similarity is informative whenever the size of the two sets compared are of the same order, so using the chamber gives us more reliable results than the audience. For two arbitrary sets and where , the Jaccard overlap , which indicates the relative size of with respect to and not their overlap.
Besides mathematical arguments, we argue that the audience and the chamber are fundamentally different objects. By construction, one would expect that the chamber is tightly coupled to the audience because the audience determines the chamber. For instance, if a user has a big audience, we expect her to have a big chamber as well. Surprisingly, the correlation correlation between audience and chamber sizes is very low (), suggesting that they are loosely coupled (see Fig. 10(b)).
We further analyze the behavior of the chambers by removing the coupling of their audiences. To do so, when comparing high-impact users and , we remove the common audience members of and and construct their chambers without them. In Fig. 11, we compare the overlap similarity distributions with and without removing the common audience members. Both are bimodal. We observe that the expected overlap of the second peak decreases but is still significantly high. Moreover, both distributions share the same bimodal structure with a similar cutoff, indicating that we only removed redundant information by removing the coupling caused by the audiences. This suggests that the chamber is more robust to missing information.
Finally, we argue that the audience is a collection of information consumers, whereas a chamber is a collection of information sources. On the one hand, every member of the audience consumes information from the leading user in a traditional one-to-many fashion. On the other hand, the audience consumes information from the chamber in a many-to-many fashion, where the ideological coherence comes from considering the chamber as a whole and not its individual members. Thus, the overlap between chambers reflects the similarity between the many-to-many information channels of the audiences, giving us a proxy of the ideological (dis)similarities between leading users/leading users.
Appendix D Leading users description
We show in Table 1 the list of leading users and their main characteristics.
| leading user | Persistence | Total impact | Median impact | Chamber size | Ideology (spectral) | Ideology (manual) |
|---|---|---|---|---|---|---|
| BernieSanders | 24 | 410442 | 5093 | 35811 | believers | believers |
| LilNasX | 10 | 320133 | 10301 | 6583 | believers | other |
| PaulEDawson | 39 | 282040 | 7349 | 88025 | believers | believers |
| AOC | 23 | 243209 | 7481 | 40302 | believers | believers |
| CNN | 30 | 158068 | 3077 | 38677 | believers | other |
| ewarren | 23 | 116018 | 3519 | 29140 | believers | believers |
| MikeHudema | 29 | 112690 | 3345 | 49874 | believers | believers |
| sunfloweraidil | 7 | 102276 | 3951 | 1989 | believers | believers |
| SenSanders | 19 | 94747 | 2936 | 26297 | believers | believers |
| RepAdamSchiff | 8 | 92173 | 9855 | 21765 | believers | believers |
| ajplus | 21 | 78273 | 3179 | 20646 | believers | other |
| sunrisemvmt | 8 | 77320 | 1802 | 11992 | believers | believers |
| GeraldKutney | 31 | 73966 | 2180 | 51325 | believers | believers |
| KamalaHarris | 12 | 69900 | 4365 | 16269 | believers | believers |
| IlhanMN | 7 | 69250 | 4806 | 13716 | believers | believers |
| JimMFelton | 9 | 66397 | 5102 | 12995 | believers | believers |
| GretaThunberg | 9 | 64787 | 5480 | 20537 | believers | believers |
| BetoORourke | 12 | 59042 | 2455 | 16247 | believers | believers |
| nowthisnews | 17 | 58796 | 3094 | 18299 | believers | other |
| nytimes | 15 | 49493 | 2174 | 19417 | believers | other |
| JayInslee | 16 | 44600 | 2594 | 20705 | believers | believers |
| narendramodi | 7 | 43984 | 4203 | 3669 | believers | believers |
| JoeBiden | 9 | 40170 | 3084 | 8333 | believers | believers |
| ProudResister | 9 | 38873 | 3048 | 12921 | believers | believers |
| brianschatz | 10 | 36951 | 2959 | 10740 | believers | believers |
| mmpadellan | 7 | 34335 | 4047 | 13277 | believers | believers |
| jeremycorbyn | 7 | 33573 | 2569 | 11454 | believers | believers |
| UNFCCC | 16 | 32000 | 2047 | 24574 | believers | believers |
| SenSchumer | 9 | 31598 | 3098 | 10875 | believers | believers |
| JustinTrudeau | 8 | 30146 | 3582 | 10281 | believers | believers |
| ProfStrachan | 14 | 28860 | 1786 | 26876 | believers | believers |
| billmckibben | 8 | 26331 | 2398 | 16595 | believers | believers |
| 314action | 11 | 25086 | 2215 | 8853 | believers | believers |
| tictoc | 7 | 22500 | 2588 | 10495 | believers | other |
| cathmckenna | 10 | 22239 | 1762 | 15957 | believers | believers |
| BillGates | 8 | 19071 | 2400 | 4872 | believers | believers |
| MichaelEMann | 9 | 17947 | 1966 | 18596 | believers | believers |
| TIME | 7 | 16815 | 2039 | 7665 | believers | other |
| MSNBC | 7 | 14651 | 1882 | 8401 | believers | other |
| PrisonPlanet | 15 | 154928 | 5180 | 29046 | skeptics | skeptics |
| DineshDSouza | 13 | 75806 | 4515 | 14267 | skeptics | skeptics |
| charliekirk11 | 7 | 65267 | 8427 | 16081 | skeptics | skeptics |
| BhadDhad | 7 | 60552 | 2111 | 2352 | skeptics | other |
| chuckwoolery | 9 | 55050 | 3691 | 13988 | skeptics | skeptics |
| RealSaavedra | 9 | 53977 | 3109 | 11506 | skeptics | skeptics |
| catturd2 | 7 | 53477 | 3783 | 14776 | skeptics | skeptics |
| prageru | 8 | 32300 | 2825 | 14277 | skeptics | skeptics |
| manny_ottawa | 12 | 28981 | 2256 | 8308 | skeptics | skeptics |
| JWSpry | 13 | 21588 | 1690 | 16439 | skeptics | skeptics |
| mitchellvii | 8 | 17876 | 1914 | 5769 | skeptics | skeptics |