Radiative feedback on supermassive star formation:
the massive end of the Population III initial mass function
Abstract
Supermassive stars (SMSs) with masses of – are invoked as possible seeds of high-redshift supermassive black holes, but it remains under debate whether their protostar indeed acquires sufficient mass via gas accretion overcoming radiative feedback. We investigate protostellar growth in dynamically heated atomic-cooling haloes (ACHs) found in recent cosmological simulations, performing three-dimensional radiation hydrodynamical (RHD) simulations that consider stellar evolution under variable mass accretion. We find that one of the ACHs feeds the central protostar at rates exceeding a critical value, above which the star evolves in a cool bloating phase and hardly produces ionizing photons. Consequently, the stellar mass reaches unimpeded by radiative feedback. In the other ACH, where the mass supply rate is lower, the star spends most of its life as a hot main-sequence star, emitting intense ionizing radiation. Then, the stellar mass growth is terminated around by photoevaporation of the circumstellar disk. A series of our RHD simulations provide a formula of the final stellar mass determined either by stellar feedback or their lifetime as a function of the mass supply rate from the parent cloud in the absence of stellar radiation. Combining the results with the statistical properties of SMS-forming clouds in high-redshift quasar progenitor haloes, we construct a top-heavy mass distribution of primordial stars over –, approximately following a power-law spectrum of with a steeper decline at . Their massive BH remnants would be further fed via the dense debris disk, powering “milli-quasars" with a bolometric luminosity of .
keywords:
stars: formation – stars: Population III – quasars: supermassive black holes – radiation:dynamics1 Introduction
The initial mass function (IMF) of the first generation of stars, referred to as Population III (hereafter PopIII) stars, is the most fundamental information that determines the characteristics of the first galaxies and governs the evolution of the early universe. The formation of PopIII stars is thought to take place in mini-haloes with virial masses of – at redshifts of – (e.g., Haiman et al., 1996; Abel et al., 2002; Yoshida et al., 2003), and their embryo protostars grow in mass quickly via accretion from the parent primordial gas clouds (e.g., Omukai & Palla, 2003; Tan & McKee, 2004). The mass of the final product is determined by competition between the mass supply rate onto the protostar and the mass-loss rate from the circumstellar disk owing to photoheating by stellar irradiation (e.g., Omukai & Inutsuka, 2002; McKee & Tan, 2008; Hosokawa et al., 2011; Stacy et al., 2012; Fukushima et al., 2018). According to recent theoretical studies, PopIII stars tend to be born with a typical mass around – (e.g., Susa et al., 2014; Hirano et al., 2014, 2015). However, the PopIII-IMF shape at the high-mass end still remains a crucial question for seeding mechanisms of supermassive black holes (SMBHs) with observed in the brightest quasars (QSOs) at (e.g., Fan et al., 2001; Willott et al., 2010; Mortlock et al., 2011; Wu et al., 2015; Matsuoka et al., 2016; Bañados et al., 2018; Onoue et al., 2019; Wang et al., 2021; Yang et al., 2021, see also Volonteri 2012; Haiman 2013; Inayoshi et al. 2020 for reviews from theoretical aspects).
A possible mechanism of SMBH formation relies on the formation of “heavy seed" formation in massive primordial haloes with , where the gas is heated to , enough to excite line transitions of atomic hydrogen, the so-called atomic cooling haloes (ACHs). When warm and massive gas in an ACH collapses owing to its self-gravity, the protostellar core is fed by the parent cloud at a rate of , where is the sound speed of gas and is the gravitational constant, which is sufficiently high to form supermassive stars (SMSs) with masses of . In the framework of modern galaxy formation, such massive objects are expected to form from primordial but molecular-hydrogen (H2)-free gas clouds in protogalaxies since those compositions lead to efficient radiative cooling and thus induce vigorous cloud fragmentation. As H2 dissociating processes, previous studies have extensively investigated the development of intense Lyman-Werner (LW) background radiation (Omukai, 2001; Oh & Haiman, 2002; Bromm & Loeb, 2003; Dijkstra et al., 2008; Shang et al., 2010; Wolcott-Green et al., 2011; Latif et al., 2013; Regan et al., 2014; Sugimura et al., 2014; Inayoshi et al., 2014; Becerra et al., 2015). In this scenario, ACH haloes forming SMSs are required to be irradiated with nearby star-forming galaxies but not be chemically polluted and tidally disrupted yet by those neighboring galaxies (Visbal et al., 2014; Chon et al., 2016; Regan et al., 2017). However, the stringent requirements are hardly achieved in the early epoch of the universe, so it is unclear whether SMS formation with the aid of external LW irradiation would produce a sufficient number of seed BHs.
In addition to the H2 photo-dissociating process, dynamical disturbance on collapsing clouds associated with successive halo mergers leads to a delay of cloud collapse, and its heating effect counter-balances with H2 cooling, enabling SMS formation (Yoshida et al., 2003; Fernandez et al., 2014). Three-dimensional (3D) cosmological hydrodynamical simulations by Wise et al. (2019) (hereafter W19) found that dynamical heating keeps the interior gas as warm as before the onset of cloud collapse, even though is not fully dissociated by external LW radiation (see also Regan et al., 2020b). Similarly, supersonic baryonic steaming motion relative to dark matter causes a delay in the onset of gas accumulation and star formation in less massive haloes (Tanaka & Li, 2014; Hirano et al., 2017; Schauer et al., 2017; Inayoshi et al., 2018). Recently, Lupi et al. (2021) and Li et al. (2021) explored BH seed formation in highly biased, overdense regions of the universe, conducting semi-analytical studies based on merger trees of DM haloes generated with a cosmological N-body simulation and the extended Press-Schechter formalism, respectively. They found that a combination of dynamical heating and LW irradiation considerably enhances the number of ACHs where SMSs potentially form.
Although gravitational collapse of such massive, H2-free clouds potentially leads to heavy seed BHs through the formation of SMSs, it still remains unclear whether the newly born protostars can be fed from the warm parent cloud at a sufficiently high accretion rate of , overcoming radiative feedback from the growing stars themselves. Unlike ordinary PopIII star formation, the production of ionizing photons from a rapidly accreting protostar at rates constantly exceeding a critical value of is quenched because of expansion of the stellar surface (Omukai & Palla, 2003; Hosokawa et al., 2013; Schleicher et al., 2013; Haemmerlé et al., 2018). In fact, rapid inflows deposit heat onto the stellar envelope and prevent it from contracting via radiative energy loss on a Kelvin-Helmholtz (KH) timescale, –. As a result, the protostar evolves into a supergiant phase with an inflated envelope of the size of and effective temperature of . However, if the accretion rate is highly variable and becomes lower than the critical value in a time duration longer than the KH timescale, the star begins to contract and increase the surface temperature of , which is the level of that in the zero-age main sequence (ZAMS) star that produces intense ionizing radiation (Sakurai et al., 2015). For instance, the central collapsing region in a dynamically heated ACH found in W19 yields a modest accretion rate since the gas cools down to via -line cooling at the center, where external LW radiation is attenuated. By the end of their simulations, the mass inflow rate is found to decrease toward the center and fall down to at the innermost region (see the bottom right panel of their Figure 4). It requires long-term and high-resolution simulations of the protostellar growth phase via disk accretion to draw a robust conclusion for the fate of the central star and the remnant.
Recently, Sakurai, Haiman & Inayoshi (2020, hereafter SHI20) has explored the late phase of mass accretion onto a protostar in a dynamically heated ACH simulated by W19, using one-dimensional (1D) radiation hydrodynamical (RHD) simulations that self-consistently take into account the stellar expansion and contraction depending on the accretion history. According to their simulations, while the ionizing radiation flux from the protostar heats the ambient gas and suppresses mass accretion through the parent cloud, the ionized regions shortly collapse owing to ram pressure exerted by the inflowing neutral gas. As a result of failed radiative feedback, the central star reaches within the lifetime even though the time-averaged mass accretion rate is lower than the critical value and thus the star grows following its ZAMS-like evolutionary track. However, we claim that the spherically-symmetric assumption is no longer valid once an accretion disk forms around the protostar and the effect of stellar radiative feedback begins to operate. In fact, while the protostar is fed via a dense circumstellar disk due to the shielding effect of stellar radiation, photoheated gas on the disk surface produces outflows toward the bipolar directions and escapes from the gravitational influence radius of the star. The mass-loss process from the disk decelerates the growth of the star and reduces the final stellar mass (e.g., Hosokawa et al., 2011, 2012). Additionally, the accretion history of the protostar shows a great diversity when the circumstellar disk fragments into smaller clumps via gravitational instability, and such non-axisymmetric structures play an essential role in transporting mass and angular momentum in the disk (e.g., Stacy et al., 2010; Clark et al., 2011; Greif et al., 2011, 2012; Sugimura et al., 2020). For instance, the mass accretion rate becomes highly variable in the clumpy disk, showing short bursts followed by relatively long quiescent phases (e.g., Smith et al., 2012; Vorobyov et al., 2013; Sakurai et al., 2016; Matsukoba et al., 2021). This effect would promote suppression of mass accretion onto a rapidly growing protostar when the star contracts and emits intense ionizing radiation in an interval of clump migration causing an accretion burst at .
In this paper, we reexamined SMS formation in the two ACHs of W19, extending the 1D RHD simulations done by SHI20 into 3D RHD simulations that explicitly include the effects of photoevaporation and disk fragmentation. Our 3D RHD simulations successfully track the stellar mass growth for , generally long enough to cover the entire life of an isolated massive star. Moreover, we explore several cases with different initial conditions of self-gravitating parent clouds, rescaling the density structure of the gas in one of the ACHs studied by W19. This enables us to extend the parameter space and understand the final product in those primordial halos under various circumstances. Combining our simulation results with the statistical properties of SMS-forming clouds in high- QSO progenitor haloes, we predict the IMF of massive primordial stars extending to the high-mass end of . Those SMSs are expected to leave BHs with similar masses after exhaustion of nuclear fuel (e.g., Heger et al., 2003; Belczynski et al., 2010; Spera et al., 2015) or the onset of general relativistic instability (e.g., Shibata & Shapiro, 2002; Umeda et al., 2016; Woods et al., 2017; Woods et al., 2020).
The rest of the paper is organized as follows. In § 2, we first describe the numerical method and setup of our 3D RHD simulations. We show our main results based on the numerical simulations in § 3, and provide an analytical argument to derive the relation between the mass accretion rate and the final stellar mass in § 4. In § 5, we discuss the mass distribution function of massive primordial stars with masses between , the subsequent mass growth of their remnant BHs, and some caveats of our simulations. Finally, our conclusions are summarized in § 6.
2 Simulation Method
2.1 Radiation hydrodynamical simulations
We perform three-dimensional radiation hydrodynamical simulations to explore gas inflows around a protostar embedded in a self-gravitating gas cloud. Our simulations are conducted with the hydrodynamical simulation code PLUTO 4.1 (Mignone et al., 2007), which has been extensively applied to study massive star formation, the evolution of protoplanetary disks, and gas accretion onto intermediate-mass BHs (e.g., Kuiper et al., 2010; Hosokawa et al., 2016; Sugimura et al., 2017, 2018; Fukushima et al., 2018; Nakatani et al., 2018a, b; Toyouchi et al., 2019, 2020, 2021; Inayoshi et al., 2022b).
In this study, we adopt spherical coordinates (, , ) where a protostar is located at the origin. The basic equations of hydrodynamics that we solve are the following: the equation of continuity,
| (1) |
and the equations of motion,
| (2) |
| (3) |
| (4) |
where is the gas density, is the velocity vector, is the gas pressure, and is the total external force that includes the gravity of the central protostar () and the underlying dark matter (DM) halo (), the self-gravity of gas (), and the outward radiative force exerted on the gas through absorption and electron scattering of photons. The gravitational potential of the gaseous mass is calculated by solving the Poisson equation
| (5) |
We also solve the energy equation of
| (6) |
where is the total (internal and kinetic) energy density, is the enthalpy per unit volume, and and the specific heating and cooling rates in units of erg s-1 g-1. Star formation in the circumstellar region and irradiation from those stars are not considered in this study, but their potential effect on the mass growth of the central protostar is discussed in Section 5. Additionally, we turn gas cooling off when the (local) Jeans length becomes unresolved with the largest size of each grid cell, as implemented in the 3D RHD simulation of PopIII star formation (Hosokawa et al., 2016).
The heating and cooling rates are estimated by solving a chemical reaction network of metal-free gas that is composed of the following nine species: , , , , , , , , and . The number density of the -th species is calculated with the non-equilibrium rate equation of
| (7) |
where is the sum of the reaction rate coefficients related to the -th species and is the number density of hydrogen nuclei. We here consider the chemical reactions introduced as Nos. 1–32 in Table A1 of Glover & Abel (2008), adopting the case B recombination rates for , and . We also take into account photoionization of , , and , photo-detachment, and photodissociation, of which the absorption cross sections are summarized in Table 1 of SHI20. With the updated chemical abundances, we compute and , including line-cooling by , , and , recombination cooling of , and , free-free emission, collisional ionization cooling of , , and dissociation cooling, formation heating, photoionization heating of , , and , photo-detachment heating, photodissociation heating, and include self-shielding (Abel et al., 1997; Omukai, 2000; Glover & Jappsen, 2007; Glover & Abel, 2008).
2.2 Radiative feedback
Our simulation adopts a subgrid model to incorporate radiative feedback on the accretion flow. We regard the interior of the innermost radius as a sink region, in which the central protostar and its circumstellar disk are contained. The mass growth rate of the central protostar during each timestep, , is simply evaluated from , where is the inward mass flux measured at the inner boundary. Then, we consider radial propagation of photons emitted from the growing protostar and the unresolved accretion disk. The stellar radiation flux at a photon frequency at the innermost radius is given by
| (8) |
where is the stellar radius, is the effective temperature, and is the Planck function. The stellar radius and effective temperature are estimated with a stellar evolution model described in § 2.3. We describe the disk radiation flux with a standard disk model, where the radiation spectrum is well approximated as
| (9) |
where is the lowest frequency we consider and the cutoff frequency is given by
| (10) | |||||
(e.g., Shakura & Sunyaev, 1973; Kato et al., 2008). We note that the cutoff frequency is as low as throughout our simulations, where is the Planck constant. Therefore, the emergent disk radiation plays only a minor role in photoionization and heating of the surrounding gas. The total flux injected from the innermost radius is set to .
We solve the multi-frequency radiative transfer equations, considering a frequency range of . The number of frequency bins is . We designed an non-uniform frequency grid layout: the frequency bin size is finer near the ionization threshold energy of H (13.6 eV), He (24.6 eV), and He+ (54.4 eV). In the frequency ranges of and , the radiation flux density can analytically be expressed as
| (11) |
where and are the absorption cross section of the -th species and its column density evaluated from the innermost radius to a radius . We ignore electron scattering in the radiative transfer calculation since the cross section of electron scattering, , is much smaller than that of absorption by neutral hydrogen even at , . We note that the component of diffusive EUV radiation () produced by radiative recombination of gas is not considered because diffusive photons are typically negligible compared to direct ones emitted from the central protostar. The radiation flux absorbed by each component is used for calculating the photoionization rates, photodetachment rates owing to lower energy photons, and photoheating rate (), respectively.
In the LW frequency band of –, we consider a representative frequency of H2 dissociating photons ( eV) instead of solving multifrequency radiative transfer. The radiation flux is calculated by
| (12) |
where characterizes the effect of H2 self-shielding and H shielding, and the approximated function form is given by
| (13) | |||||
| (14) | |||||
| (15) |
where , , , is the Boltzmann constant, and is the proton mass (Wolcott-Green & Haiman, 2019). The H2 photodissociation and heating rates through the two-step Solomon process are calculated by
| (16) |
and
| (17) |
(Abel et al., 1997).
The outward radiation pressure force along the radial direction is given by,
| (18) |
The tangential components of the radiative force are neglected in this study.
2.3 Stellar evolution
| 2 | 10 | 30 | 50 | 100 | 300 | 1000 | ||||
|---|---|---|---|---|---|---|---|---|---|---|
| 0.139 | 0.323 | 0.451 | 0.627 | 0.959 | 1.20 | 1.66 | 2.13 | 2.59 | ||
| 4.14 | 4.65 | 4.87 | 4.93 | 4.98 | 5.05 | 5.07 | 5.11 | 5.15 | 5.19 |
| 2 | 10 | 20 | 27 | 100 | ||||
|---|---|---|---|---|---|---|---|---|
| 2.30 | 2.26 | 2.37 | 2.78 | 3.32 | 4.34 | 4.69 | 5.15 | |
| 3.65 | 3.69 | 3.70 | 3.68 | 3.68 | 3.80 | 3.84 | 3.90 |
| Models | ||||
|---|---|---|---|---|
| MMH | ||||
| LWH | ||||
| LWH-0.1 | ||||
| LWH-0.5 | ||||
| LWH-2 | ||||
| LWH-10 |
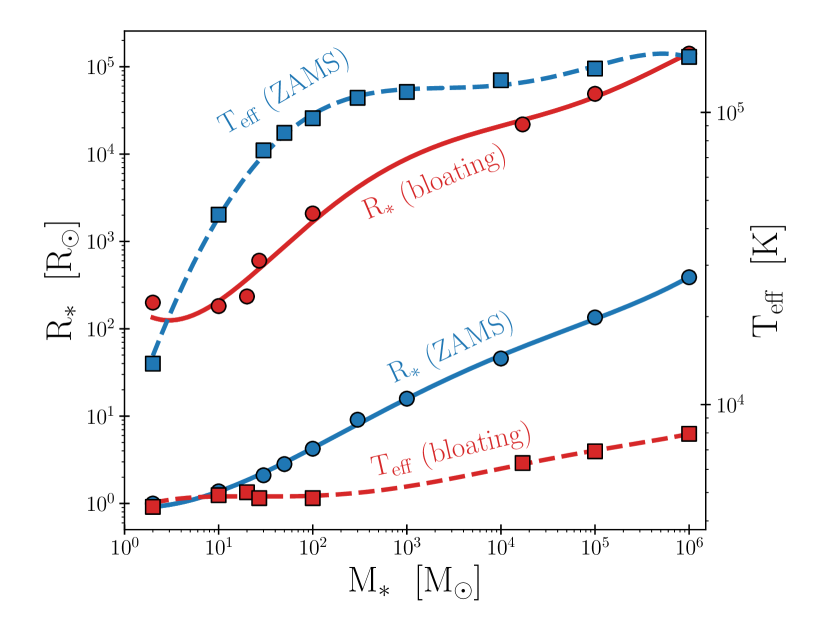
The protostellar radius and effective temperature are updated at each timestep, depending on the mass accretion history. When the accretion rate is lower than , the stellar structure is thermally relaxed and their properties are assumed to be those in a zero-age main sequence (ZAMS) phase. On the other hand, when the accretion rate is higher than the critical value, the stellar surface is bloated owing to rapid entropy injection through the accreting matter, and thus the surface temperature becomes as low as (Hosokawa et al., 2013). In Tables 1 and 2, we summarize the data of and for various masses for the ZAMS phase and the bloating supergiant phase accreting at , respectively. Throughout this paper, the protostellar evolution in each phase is described by fitting the data with fourth-degree polynomial functions as shown in Figure 1.
In our study, we adopt either of the two radii for a given stellar mass, depending on whether the accretion rate exceeds . For instance, when the accretion rate onto a protostar abruptly rises due to clump migration through a disk, we assume that the star expands instantaneously and its size reaches that in the super-giant phase. This assumption is reasonable because stellar expansion occurs on the accretion timescale in the surface layer, – (e.g., Hosokawa et al., 2013; Sakurai et al., 2015), which is as short as the dynamical timescale at the innermost radius in our simulations. On the other hand, when the accretion rate drops below and a super-giant star evolves its ZAMS phase, we take into account the KH contraction phase on a finite timescale as
| (19) |
where and are the stellar radius and mass in the super-giant phase before the contraction and is the typical KH timescale in that phase (Sakurai et al., 2015). The minimum stellar radius is set to that in the ZAMS phase with the corresponding mass. Note that the stellar mass is almost constant during quiescent phases and thus is imposed to derive Eq. (19). Following the size evolution, the surface temperature is calculated by logarithmic interpolation (i.e., ) between the two phases.
Based on hydrodynamical simulations, a hydrostatic protostar with is first formed at the center of a massive atomically-cooling gas cloud but the protostar grows to in a few years (Inayoshi et al., 2014; Becerra et al., 2015). We assume that the initial stellar mass is and the stellar structure follows that in its ZAMS phase.
2.4 Grid configuration and Initial conditions
We set a computational domain of , , and . In the radial direction and polar direction, we set up logarithmically spaced grids to achieve a high resolution near the center and equator. In the azimuthal direction, we adopt uniformly spaced grids. The number of grid cells in each direction is set to , enabling us to resolve the disk thickness with at least three grid cells. As our fiducial case, we set and . We have checked the convergence of our simulation results, varying the number of the grid cells and the size of the innermost radius (see Appendix A). We adopt the innermost radius so that the stellar Bondi radius for cold gas with a temperature of K is sufficiently resolved in the initial stage ();
| (20) |
where we assume isothermal gas with a polytropic index and the mean molecular weight of , yielding the sound speed .
We adopt outflow boundary conditions at the innermost and outermost cells, where zero gradients across the boundaries are imposed on physical quantities to allow gas to flow out from the computational domain. On the other hand, gas inflows through the boundaries are prohibited by imposing and at the inner and outer boundaries, respectively. On the pole and equator, i.e., and , we impose reflective conditions. We also adopt periodic boundary conditions for the azimuthal direction at and .
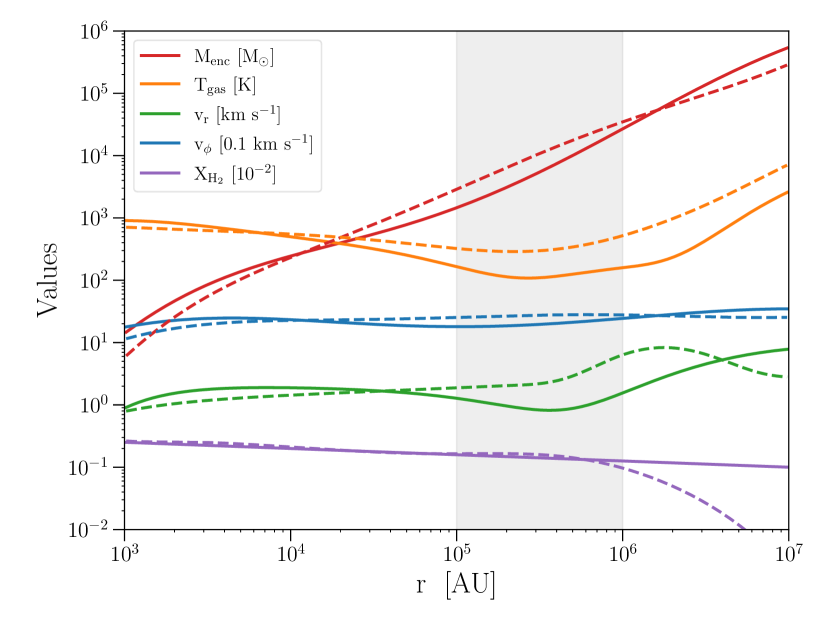
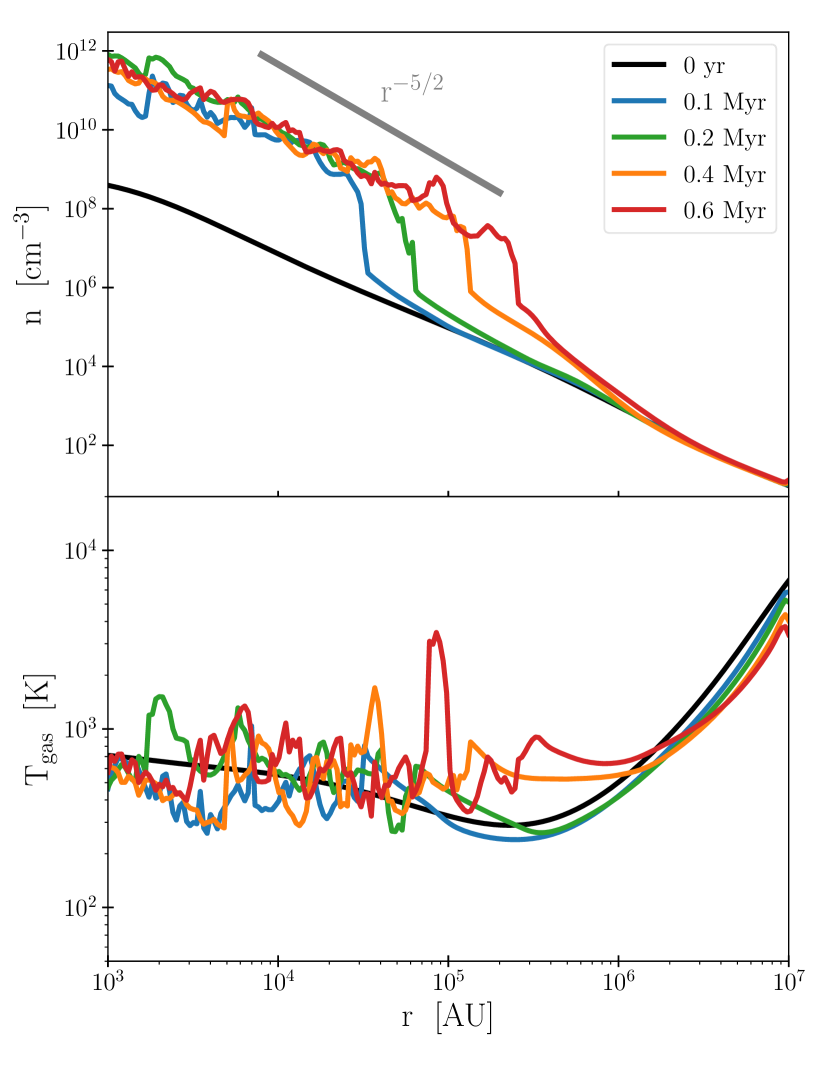
We mainly explore protostellar evolution in two primordial haloes, the more irradiated halo (LWH) and the more massive halo (MMH), originally identified in W19. The initial conditions for our 3D RHD simulations are taken from the spherically-averaged gas cloud profiles of the LWH and MMH model, as shown in Figure 4 of W19. We fit the profiles of the enclosed gas mass ( - ), radial velocity ( - ), temperature ( - ), and fraction ( - ) with seventh-degree polynomial functions. We assume that the initial ionization degree is approximated as in a collapsing cloud (Inayoshi & Omukai, 2011), where is the recombination rate coefficient, and is the free-fall time of the cloud. Since the density distribution follows a self-similar profile of (and thus ), we set the initial profile of the ionization degree to and impose because of charge neutrality. The initial number density relative to hydrogen nuclei is set to 0.0833, and helium is assumed to be initially all neutral.
For rotational motion of the clouds, we do not refer to that shown in W19, since our spherically-averaged initial condition cannot take into account the rotationally supported disk already appearing within at the last snapshot of the original simulation. Instead, we suppose a cylindrical rotation of the clouds, of which the angular momentum vector is aligned with the -axis at the initial condition. The rotational velocity at any is set to half of the Keplerian velocity evaluated on the equatorial plane (), i.e., , which is universally realised in gravitational gas collapse in primordial haloes (Abel et al., 2002; Yoshida et al., 2008). The initial profile of each physical quantity assumed in LWH and MMH is shown in Figure 2.
The two target haloes experience several episodes of rapid mass assembly, and thus the onset of gravitational collapse is delayed until , when the virial mass reaches for the LWH (MMH) halo. In this paper, we incorporate the gravity of the DM halo with a Navarro-Frenk-White (NFW) potential (Navarro et al., 1997; Mo et al., 1998),
| (21) |
where and are the virial temperature and radius of the halo, is the characteristic radius of the NFW density profile, is the concentration parameter, and . We model the dependence of the mean concentration parameter on virial mass and redshift : (Bullock et al., 2001). We note that for both target haloes, the gaseous self-gravity dominates the gravity of the DM halo within and the free-fall time scale at the exterior is longer than our computational time of . Therefore, the external gravitational force cased by the DM halo plays a minor role in determining gas dynamics.
We do not consider an external LW radiation background in our simulation, though the LWH and MMH haloes are exposed to modest LW irradiation of . The level of LW intensity is not high enough to impact the chemo-dynamics of the collapsing cloud in the halo. We also neglect turbulent motion in the cloud at the initial condition, though gas motion is highly turbulent in the original simulations by W19. In fact, a recent study by Regan et al. (2020a) explored protostar formation in the LWH and MMH haloes and found that turbulent motion in the collapsing cloud affects its long-term evolution at . Therefore, our simulations focus on the early evolutionary stage of .
2.5 Model cases
In order to study stellar mass growth mechanisms under various environments, in addition to the LWH and MMH haloes, we also explore four other cases, where the initial conditions are generated by altering that of the LWH halo. The models named LWH-0.1, LWH-0.5, LWH-2, and LWH-10 employ the enclosed gas and DM mass at any radii scaled up or down by a factor of 0.1, 0.5, 2, and 10, respectively, from the original values. In these synthesized models, rotational velocities are also altered according to the modified Keplerian velocity profiles while we adopt the same conditions as in the original LWH model for other quantities.
In addition to the 3D RHD simulations, we also perform 1D HD simulations to highlight the coupling effects of feedback from stellar radiation and disk formation due to angular momentum of accreting gas. The initial conditions for those 1D calculations are identical to their 3D counterparts, except for neglecting rotational motion in the collapsing clouds. For both the LWH and MMH haloes, we have tracked the evolution of the central star up to , corresponding to the typical lifetime of massive stars, while the other calculations have been terminated earlier to save computational cost. Table 3 shows the time-averaged mass accretion rate onto and the mass of the central star obtained in our 1D HD and 3D RHD simulations for each model. The values tabulated here are evaluated at , except for the LWH-10 model, which has been terminated at since the numerical time step becomes too short due to the strong gravity of the density-enhanced cloud. For this model, we present the stellar mass at , estimated by assuming a constant mass growth in the time-averaged accretion rate evaluated at the the termination time, i.e., .
Here, we briefly comment the results of the 1D HD simulations for the LWH and MMH haloes. For both target haloes, the central star grows to by . Note here that the MMH halo gives potentially more rapid mass accretion onto the central protostar than the LWH halo. This is because the MMH gas cloud has relatively high enclosed gas mass, radial infall velocity, and thus high inward mass flux at –, where the free-fall time is – (see Figure 2). The hydrodynamics at the radial scale governs the mass supply to the cloud center on the corresponding time scale. As a result, the time-averaged accretion rates for the LWH and MMH haloes are and , being below and above , respectively. The difference in the potential mass supply rates from the parent clouds can render the fates of the central protostars much different between the two target haloes. In the next section, we thoroughly investigate the accretion dynamics around the central star and its mass growth history in the LWH and MMH haloes with our 3D RHD simulations.
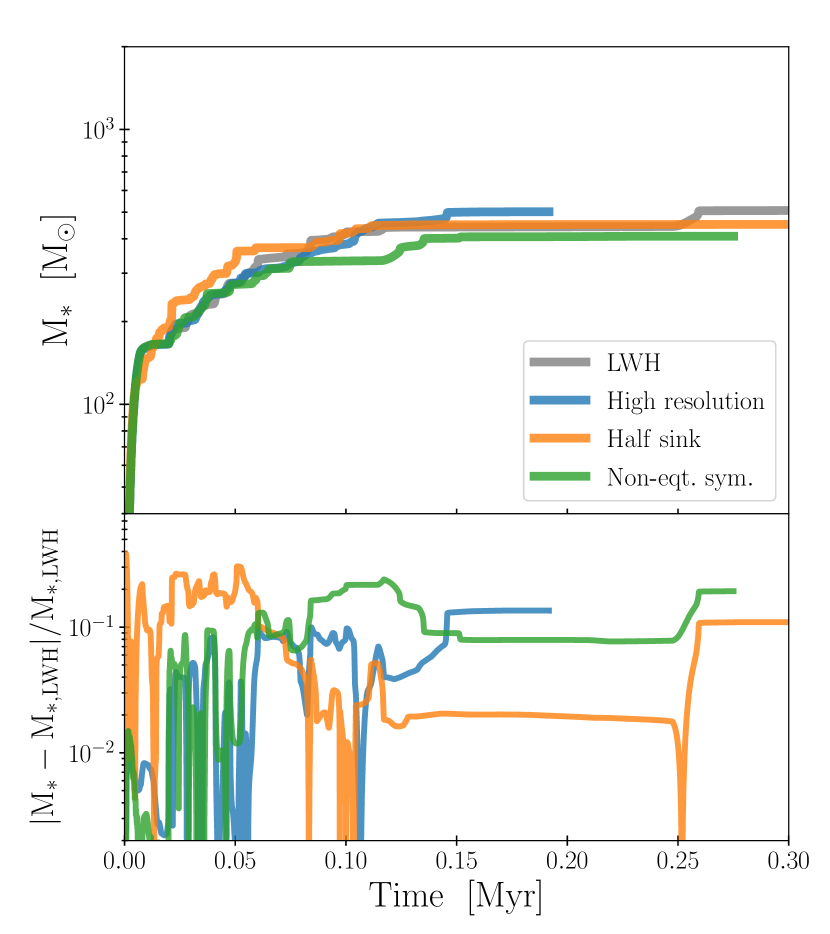
Finally, we also perform three runs with the same numerical setup as the LWH halo but adopting different grid configurations to check the numerical convergence of our simulations. These numerical experiments show that our simulation results are sufficiently converged with less than 20 % difference in the central star’s mass at least until (see Appendix A).
3 Results
3.1 LWH halo
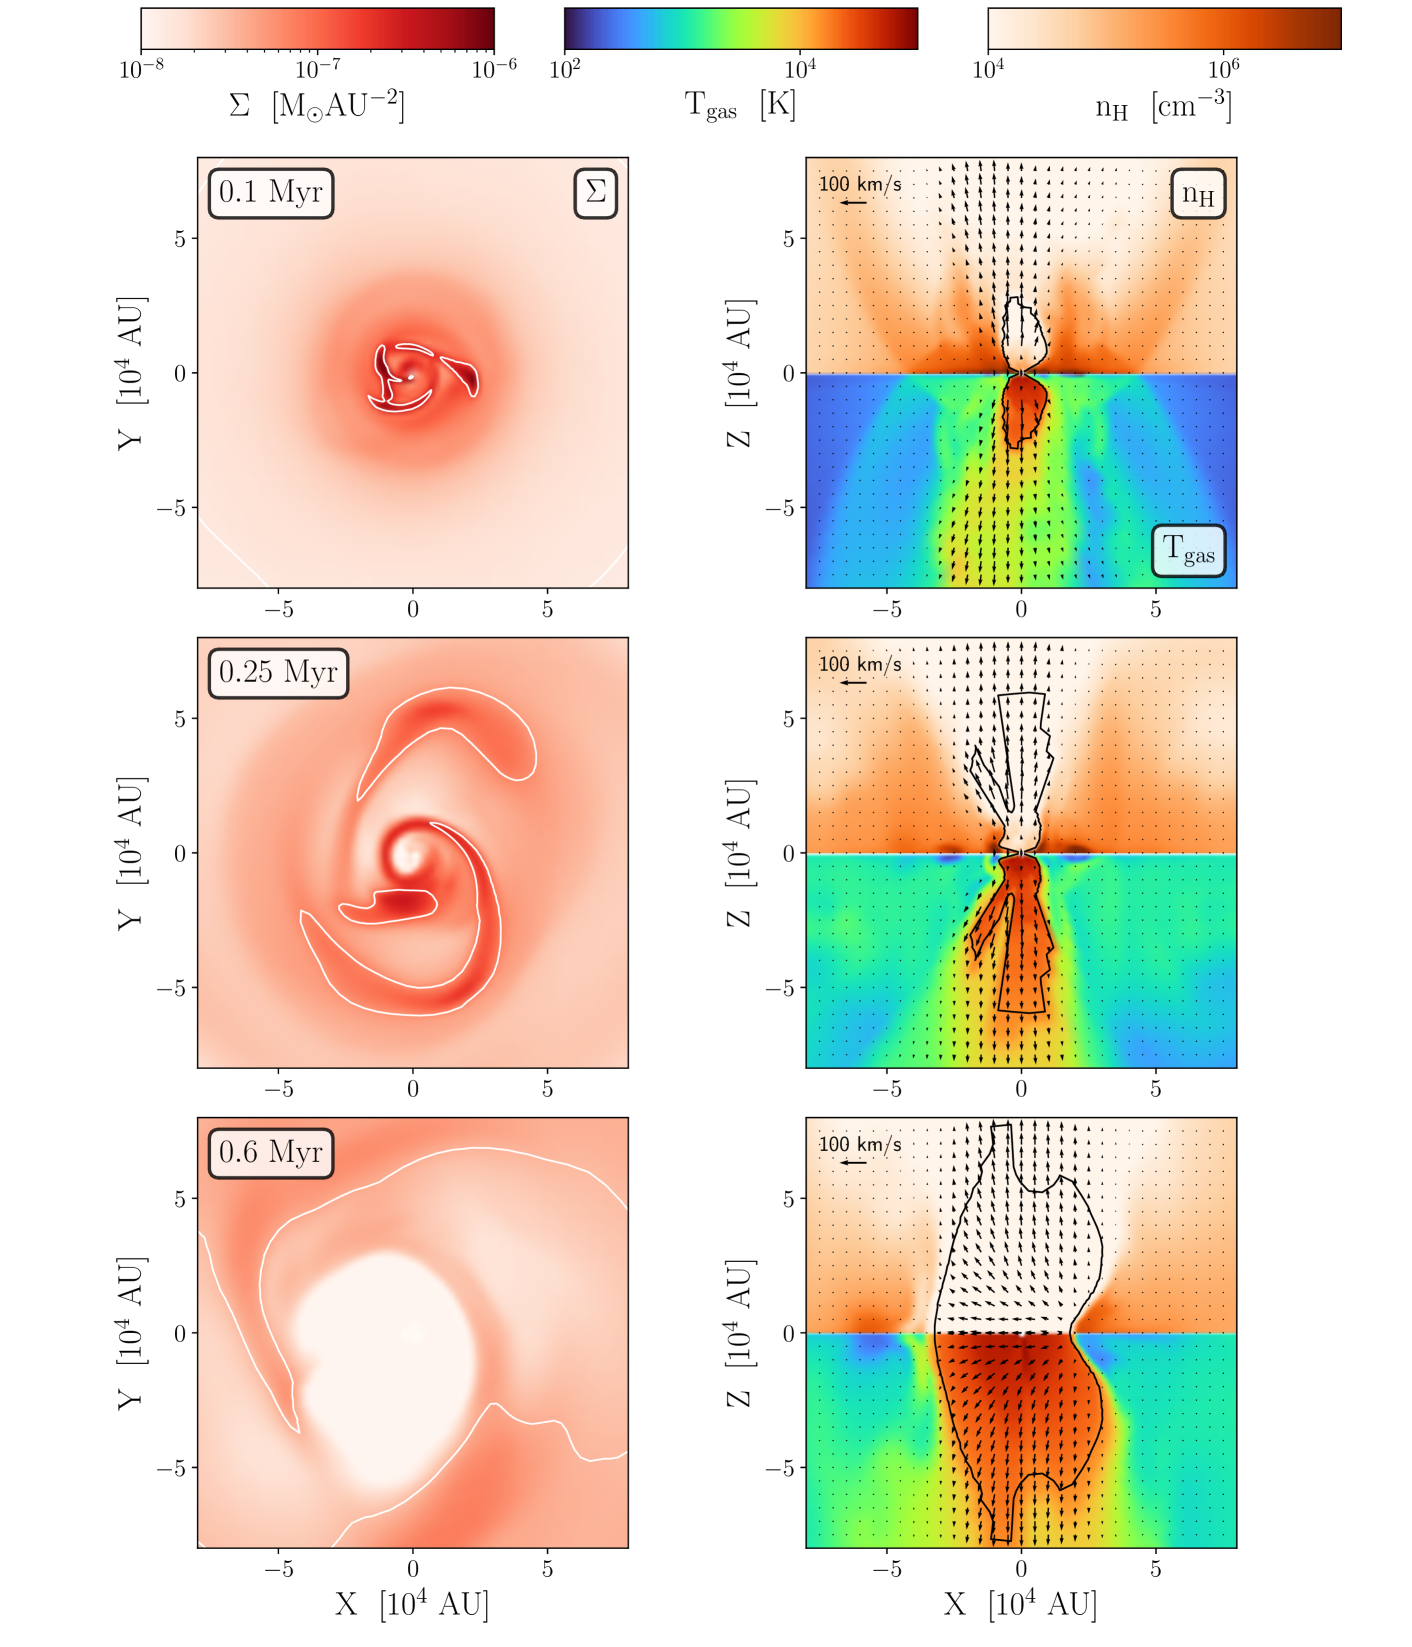
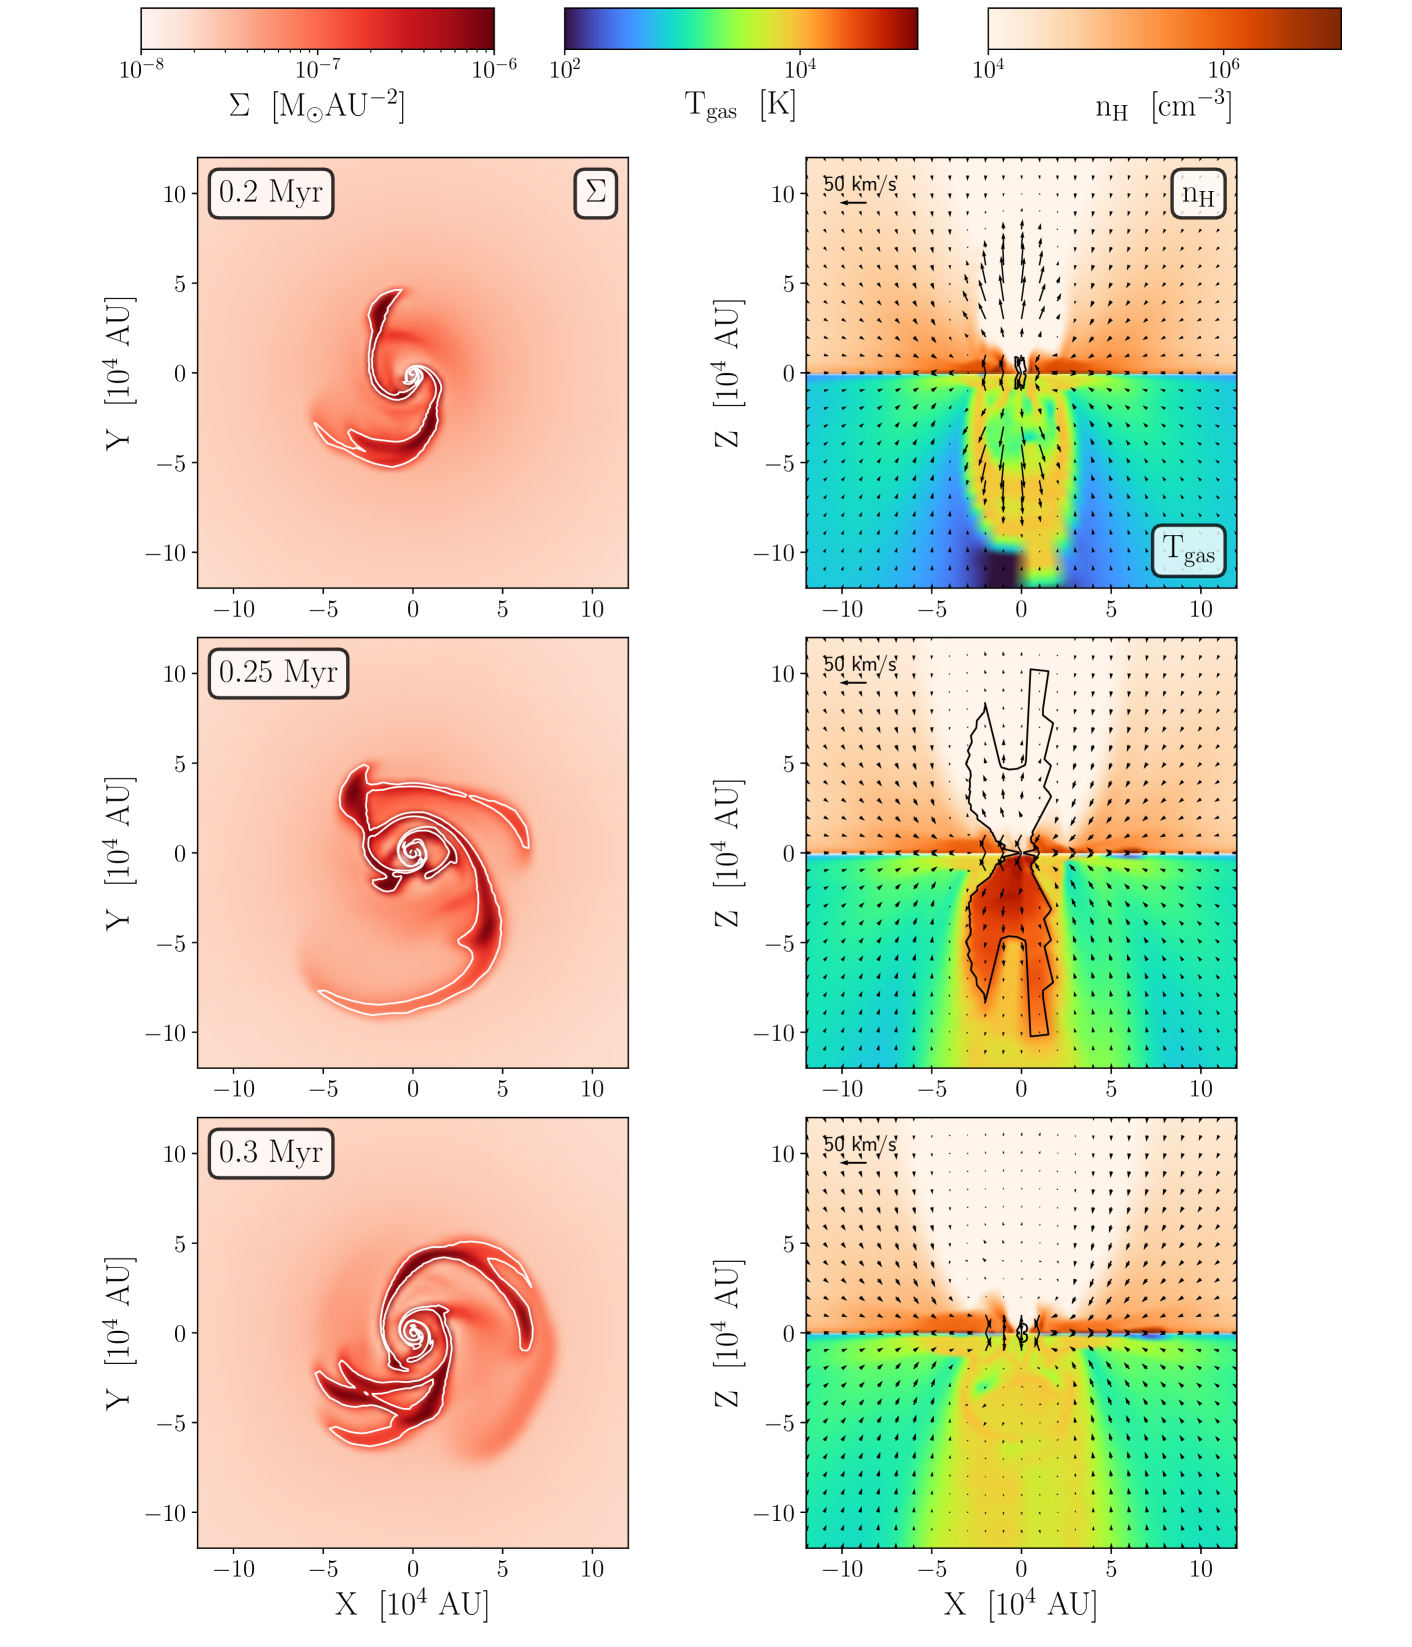
Figure 3 shows the density and temperature distribution of the accretion flows in the central region of the LWH halo at three elapsed times, of which the face-on and edge-on views are exhibited in the left and right columns, respectively. The angular momentum of the collapsing cloud leads to the formation of an accretion disk around the central protostar. In the early stage (; top panels), the circumstellar disk becomes dense enough to be gravitationally unstable and thus gravitational torque caused by forming spiral waves with a spatial extent of drives mass transport toward the central star. As the protostar grows, the emergent ionizing radiation heats the surrounding matter and produces bipolar outflows of hot gas. At (middle panels), the ionized bubbles further expand toward the polar directions and reach . Once the ionization front breaks the stellar gravitational influence radius of for ionized gas, the heated gas begins to evaporate from the disk surface and the disk mass decreases. As shown in the face-on view, a low density cavity forms around the star owning to mass loss caused by the strong pressure-gradient force of ionized gas. By the late stage (; bottom panels), the inner-most edge of the accretion disk gradually moves outward and the central region within is fully evacuated. Note that the ionized gas shows a coherent flow pattern along the X-axis near the equator. This is caused by the pressure gradient owing to density contrast at the edges of the ionized cavity (see the bottom panels).
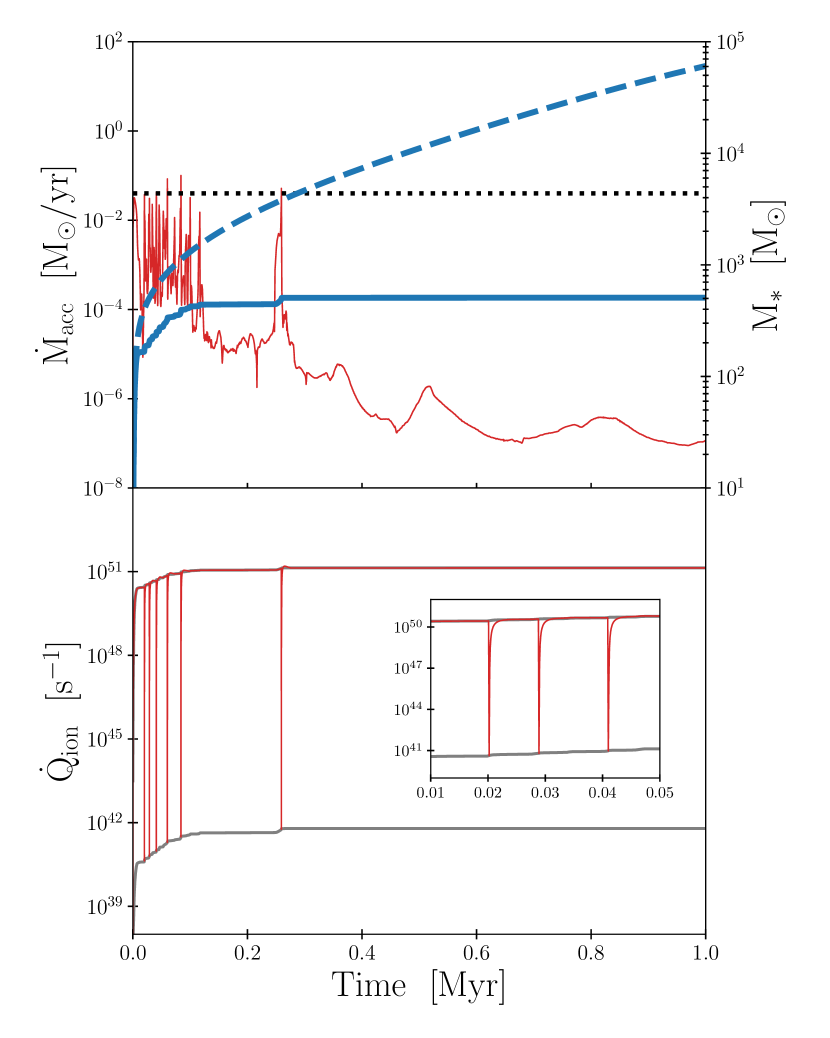
The upper panel of Figure 4 shows the time evolution of the mass accretion rate onto the central star (red solid) and its mass (blue solid) obtained in the 3D RHD simulation. For comparison, we overlay (black dotted) and the stellar mass growth in the 1D HD simulation (blue dashed). In the early stage, the central star undergoes efficient mass growth since dense accretion flows reach the vicinity of the central star (see the top panels of Figure 3). The accretion rate intermittently increases with a typical interval of , which corresponds to the dynamical timescale at where spiral waves form, and occasionally exceed the critical accretion rate of to alter the stellar evolution. By , the star grows to be as massive as . However, in the later phase, stellar mass growth is essentially quenched by stellar radiative feedback. In fact, after the last accretion burst associated with the migration of a massive fragment at , the accretion rate slumps below and never revives. By the end of the simulation, the stellar mass reaches .
The lower panel of Figure 4 shows the production rate of ionizing photons by the central star. During most of the epochs, the production rate of ionizing photons is as high as , corresponding to that for a massive ZAMS star with . This high value reflects that the central accreting star is thermally relaxed and contracts to its ZAMS radius. In contrast, when the mass accretion rate abruptly rises and exceeds the critical value of in a short time, the stellar radius is inflated so that the stellar effective temperature is as low as and thus the ionizing photon production rate sharply declines. However, the ionizing photon production rate recovers to the ZAMS value in a KH time of (see the inserted panel in Figure 4), which is typically shorter than the time interval between accretion bursts owing to disk fragmentation. Therefore, in the LWH halo case, nearly constant production of ionizing photons from the massive protostar hinders its growth via accretion through the disk.
It is worth noting that the 1D simulation without stellar radiation produces an extremely massive star with . This result clearly shows that stellar mass growth is strongly suppressed by radiative feedback when the time-averaged mass accretion rate in the early stage is lower than the critical rate for stellar evolution. Moreover, even with stellar radiation in the 1D spherically symmetric simulation, the dynamics of the inflowing gas in the halo is hardly affected by radiative feedback because the photoionized gas is completely confined within the stellar Bondi radius and collapses to the center owing to ram pressure of the incoming neutral gas (SHI20).
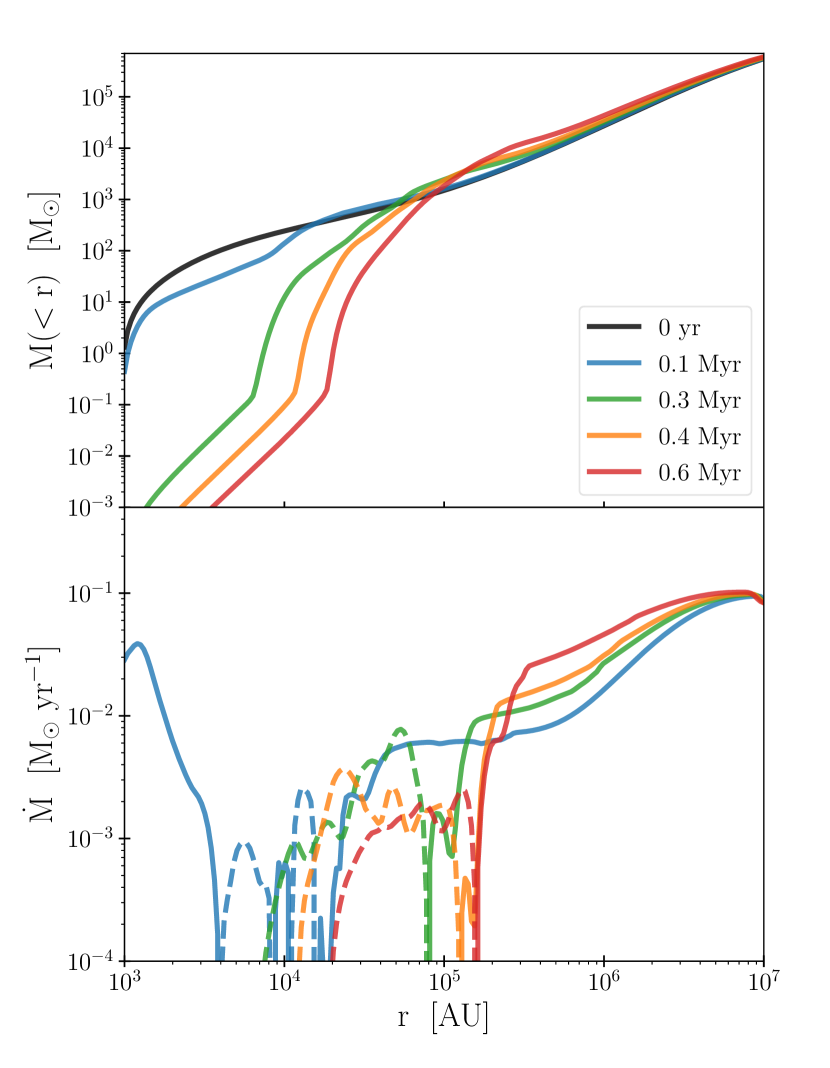
While the bipolar outflows driven by photoionization evacuate the central region, the ionization front does not reach the virial radius of the halo. To show the entire structure of the surrounding gas, Figure 5 presents the radial profiles of the spherically-averaged enclosed mass (top) and mass flux (bottom) at five different elapsed times. The ionized bubble propagates outward quickly in the earlier stage and its expansion ceases at . By the end of the simulation, the bubble size nearly converges to , which is times larger than the gravitational influence radius of the central star for ionized gas but is sufficiently smaller than the size of the collapsing parent cloud. Outside the ionized bubble, an overdense shell-like structure forms owing to deceleration of the outflow (dashed) and continuous inflowing gas (solid). We find that the shell structure stably exists within (i.e., during the stellar lifetime) but its mass increases due to inflow of neutral gas from the exterior of the ionized bubble. When the mass shell becomes sufficiently massive or the properties of incident radiation from the central star change (e.g., due to stellar collapse to a BH), runaway collapse of the massive gas cloud is triggered and thus the central object is fed at a high rate, as reported in previous RHD simulations that study BH accretion under extremely dense environments (e.g., Inayoshi et al., 2016; Inayoshi et al., 2022b; Toyouchi et al., 2019, 2020). Based on this idea, we briefly discuss the subsequent growth of a BH left after the end of the central star’s life in § 5.2.
3.2 MMH halo
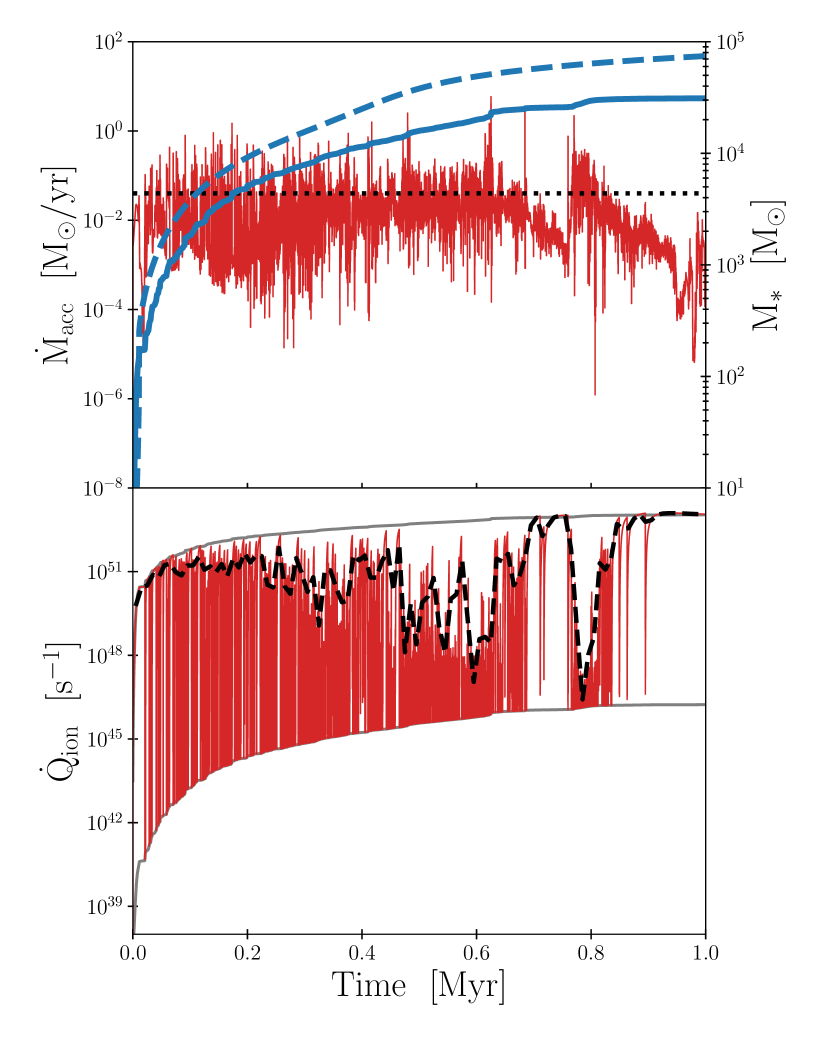
Next, we move on to the case in the MMH halo, where the mass inflow rate at larger radii is higher than in the LWH halo. Figure 6 presents the density and temperature distribution of the accretion flows in the MMH halo. The surface density distribution (left panel) shows that prominent spiral waves form in a dense disk owing to gravitational instability even down to the inner region of . The non-axisymmetric structure transports angular momentum of the gas outward and thus brings the mass to the vicinity of the central protostar. As the protostar grows in mass, low-density cavities are created in the polar directions and the maximum velocity of the outflow barely exceeds the sound speed. However, ionized bubbles do not expand continuously but appear in an episodic manner, unlike in the LWH case. Therefore, mass loss due to photoevaporation plays a minor role in the mass budget of the circumstellar disk.
Figure 7 shows the time evolution of stellar mass growth (top) and stellar ionizing flux (bottom) in the MMH halo. An episodic behavior of the accretion rate is found in the early stage as in the LWH case. In the MMH halo, however, owing to continuous mass supply through the dense disk and weak mass loss, the burst-like accretion proceeds without being suppressed. As a result, the time-averaged accretion rate becomes as high as , and the central star eventually grows to by the end of the simulation at . The final mass is comparable to that obtained from the 1D simulation without stellar radiation (; dashed curve), suggesting that the effect of gas angular momentum (and partially radiative feedback) reduces the mass by a factor of . This result is a natural outcome of the long-term accretion bursts with a high frequency where the peak rates exceed the critical rate for stellar evolution. As shown in the bottom panel of Figure 7, the ionizing photon production rate varies between the values for the ZAMS () and the bloating super-giant phases (). Due to the episodic behavior, the value of averaged in a time interval of (black dashed) is comparable or lower than most of the time except in the last stage. We note that this time interval is times longer than the KH timescale in super-giant phases, so that the ionizing photon flux reaches the value for the ZAMS unless multiple accretion bursts at rates of occur in shorter time durations of . For instance, the average value of drops significantly from that for the ZAMS phase at and due to successive burst accretion. Therefore, suppression of radiative feedback from the accreting protostar with a bloated and low-temperature surface enables the formation of an SMS in the MMH halo.
Owing to weak radiative feedback, continuous mass accretion develops a distinct disk structure in the MMH case. To see the properties of the disk in a quasi-steady state, Figure 8 presents the radial profiles of the density (top) and temperature (middle) along the equator (i.e., ) at five different epochs. Starting at the beginning of the simulation, the infalling gas with angular momentum accumulates around the central star and the outer edge of the disk moves outward because gas with higher angular momentum accretes onto the disk in a later phase. The density structure can be well approximated by within the disk (grey line) and is a characteristic profile for a gravitationally unstable disk (see more details below). In the quasi-steady state, the gas temperature is kept as cold as within the disk, where the gas becomes fully molecular () in spiral structures; otherwise the molecular fraction is as low as .
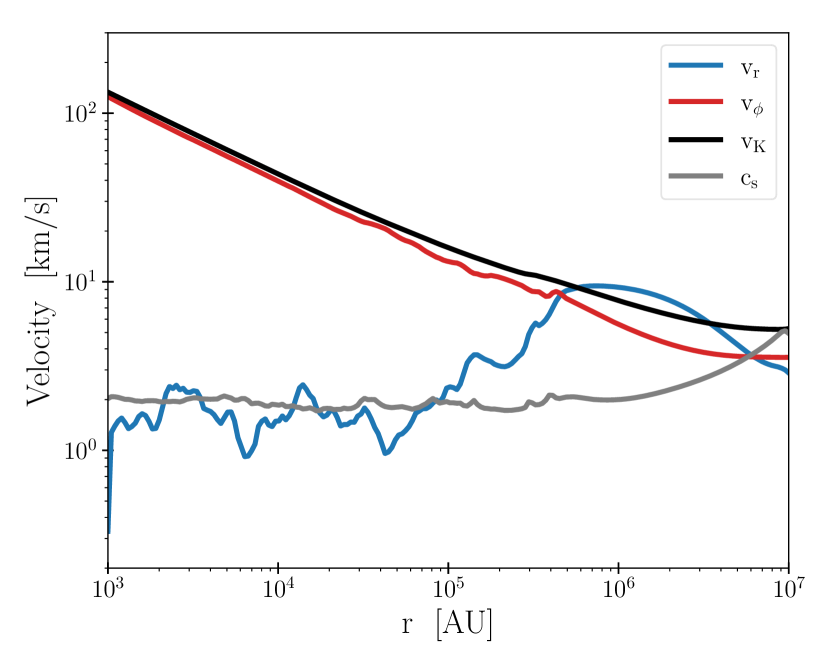
Figure 9 presents the time-averaged radial profiles of the rotational (red) and radial (blue) velocities along the equator. For comparison, we overlay the Keplerian velocity (black) and the sound speed (grey). Within the disk, the rotational velocity asymptotically approaches the Keplerian value, which indicates that the accretion disk is rotationally supported. Note that the Kepler velocity follows in the inner region of the disk, where the gravity is dominated by the central star. The time-averaged radial velocity has only the inflowing component (i.e. ) and has a nearly constant value comparable to the sound speed at . Fast inflows with are generally found in self-gravitating disks. Based on the balance between the gravitational torque driven by bar/spirals and the advection of angular momenta along the accretion disk, the inward mass transport occurs at a few of the sound speed in the disk (Goodman, 2003).
The distribution of the density and inflow velocity within the disk can be explained as follows. Let us suppose that the density follows a single power-law profile of and the sound speed of gas is nearly constant in the disk, yielding . In a quasi-steady state, mass conservation requires , which self-consistently explains the density slope of and the constant radial velocity in the simulation. Furthermore, it is worth mentioning that the disk following the density slope would be most gravitationally unstable to perturbations with a characteristic wavenumber of . Then, if the angular momentum transfer along the disk is governed by turbulent motions associated with gravitational instability, the effective kinematic viscosity is expressed as , leading to a constant radial velocity as . Thus, the nature of the circumstellar disk in the MMH halo can be characterized with transport of mass and angular momentum owing to gravitational instability.
4 Mass growth of PopIII stars under various accretion histories
In addition to the two cases discussed in § 3.1 and 3.2, we explore four more variants in the LWH halo, where the initial density distribution is rescaled. The simulation results for these cases are summarized in the last four lines of Table 3. In the LWH-2 and LWH-10 models (i.e., high density), the central star grows in mass efficiently and thus grow to be and , respectively. Those values are just a few times lower than those in 1D HD simulations, suggesting that stellar radiative feedback plays a minor role in determining the final stellar mass. In contrast, in the LWH-0.1 and LWH-0.5 models (i.e., low density), further mass growth is prevented by radiative feedback above and , respectively, while the protostar could increase its mass by a factor of without radiative feedback.
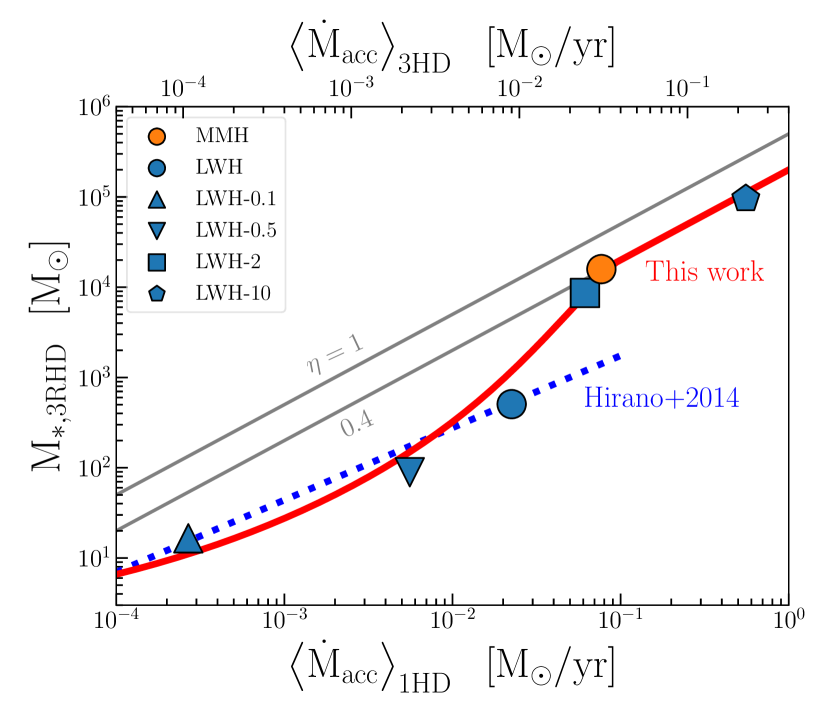
Figure 10 presents the relation between the time-averaged mass accretion rate found in the 1D HD simulation and the final mass of the central accreting star calculated in the full 3D RHD simulation (see also Table 3). For reference, we define the accretion efficiency as . The value of characterizes the suppression level of mass accretion owing to angular momentum of the inflowing gas and stellar radiative feedback. For the low density cases with , the resultant mass is substantially reduced by a factor of 20 (i.e., ) from that in the 1D non-radiation case. The suppression is mainly caused by radiative feedback from the contracting protostar with a high surface temperature of . The simulation results (LWH-0.1, LWH-0.5, and LWH) are in good agreement with the fitting result (blue dashed) obtained by previous simulations of PopIII star formation in mini-haloes, where the mass inflow rate tends to be lower than (Hirano et al., 2014). On the other hand, in the high density cases with , the final mass increases with the inflow rate and approaches a constant efficiency with . The jump of the efficiency occurs because such a rapidly accreting protostar evolves with a bloated envelope with and thus hardly emits ionizing radiation. Note that represents suppression of stellar mass growth by the finite angular momentum of the accretion flows (see also the upper grey line for to highlight the effect of angular momentum). In the following, we refer to as a mass accretion rate reduced from the spherical 1D case owing to disk formation but not to stellar radiative feedback, shown in the upper horizontal axis of Figure 10.
Here, we interpret our simulation results with an analytical estimate of the mass loss rate from a circumstellar disk owing to photoevaporation (Tanaka et al., 2013);
| (22) |
where is the physical scale within which the disk suffers from photoevaporation. The value of depends on the size of the ionized region surrounding the star, disk size, and their geometrical configuration (McKee & Tan, 2008; Hosokawa et al., 2011). We here adopt as a fiducial value, which is broadly consistent with the spatial extent of the photoevaporating region seen in the LWH, LWH-0.5, and LWH-0.1 models. The production rates of ionizing photons, , from a ZAMS star depend on stellar mass, as shown in Table 1. Equating with , we obtain the equilibrium mass, above which the stellar mass growth ceases because the circumstellar disk is evacuated by mass loss owing to photoevaporation. For the high accretion-rate regime (), the value of sharply drops and thus the mass loss process shuts off. Therefore, the final stellar mass is not limited by radiative feedback but by the mass budget in the circumstellar disk or a short lifetime of the central massive star (for comparison to 1D cases, see Omukai & Palla, 2003; Johnson et al., 2012). We find that the analytic model for disk photoevaporation (red curve) nicely explains the overall trend of our simulation results.
5 Discussion
5.1 Implication for the IMF of primordial stars
In this section, we discuss the initial mass function for primordial stars, applying the – relation (the red curve in Figure 10) to star formation episodes in high- QSO host galaxies. Recently, Li et al. (2021) have conducted a semi-analytic study of chemo-thermal dynamics of collapsing gas clouds, using merger trees to trace the halo growth in overdense regions of the universe with overdensity. They find that high- QSO progenitor haloes are likely irradiated by intense H2-photodissociating radiation from nearby star-forming galaxies and heat the interior gas by successive halo mergers. As a result, the mass accretion rates of collapsing parent clouds show a great diversity, depending on their evolutionary history and external environments (see Figure 8 in Li et al. 2021). Note that this accretion rate can be approximated as since their calculation does not take into account either ther angular momentum of the collapsing cloud or stellar radiative feedback.
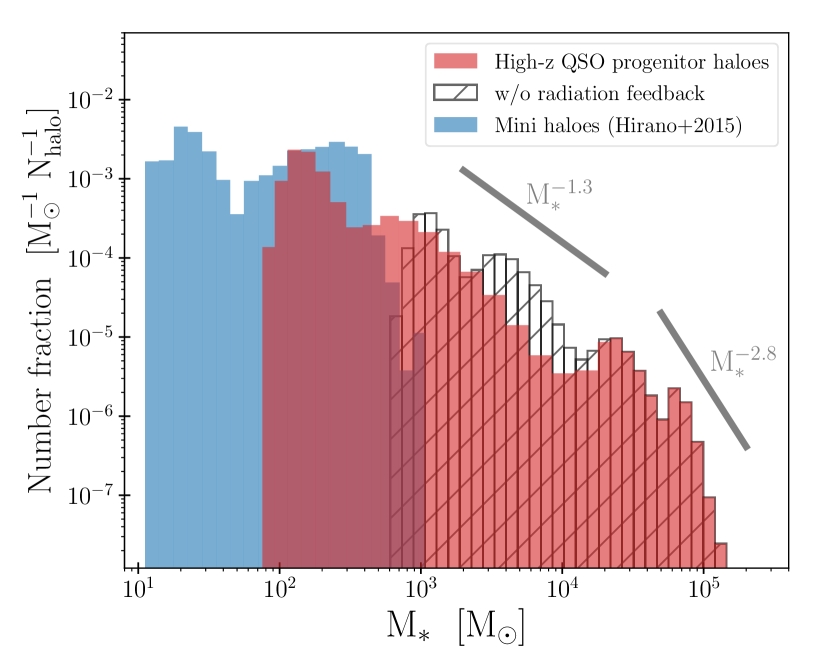
Figure 11 shows the mass function of primordial stars formed in high- QSO host galaxies (red histogram). The mass is widely distributed over , reflecting the diversity in the mass accretion rate. The shape of the mass distribution is approximated with a double power law function; at (significantly flatter than a Salpeter IMF of for metal-enriched stellar populations) and in the higher mass range. We also present the mass function without including radiative feedback, but assuming a constant efficiency of (white hatched histogram). This clearly demonstrates that radiative feedback creates the low-mass population below . Note that the number fraction of SMSs heavier than is , independent of the feedback process. Since the total number density of DM haloes of interest in a comoving volume is estimated as (Li et al., 2021), the number density of SMSs (presumably, heavy BH seeds) is given by . Therefore, if of the SMSs collapse to BHs and grow in mass subsequently (see also § 5.2), the number density of high- QSOs () can be explained.
For comparison, we also show the mass function of typical PopIII stars that form in DM haloes in less-biased regions of the universe, where the external environmental effects (e.g., LW radiation and halo mergers) are modest (blue histogram taken from Hirano et al. 2015). This mass function occupies a relatively low-mass range with a mean value of , exhibiting a sharp cutoff at the high-mass end around . This suggests the importance of external effects suppressing cloud collapse to extend the high-mass end of the mass distribution.
We emphasize that normal PopIII stars are the representative population of primordial stars, while the heavier population in rarer regions would play a more important role in the formation of SMBHs. Numerical simulation studies of PopIII star formation provide a possible mass budget of PopIII stars, , above which the emergent UV radiation would complete cosmic reionization earlier and yield a high optical depth of the universe to electron scattering inconsistent with the Planck measurement (Visbal et al., 2020; Inayoshi et al., 2021). With the mean mass of PopIII stars in Hirano et al. (2015), the number density of PopIII stars in a cosmic volume is as high as . Therefore, the formation efficiency of SMSs is limited to of that of normal PopIII stars.
5.2 Subsequent mass growth of remnant BHs
Massive stars with are expected to leave BHs behind after the end of their lifetime, except in the mass range of , where pair-instability supernovae take place (see Nomoto et al., 2013, for a review). For metal-free primordial stars, which avoid significant mass loss by stellar winds, a large fraction of their initial mass ends up in the remnant BHs, i.e., – (e.g., Heger et al., 2003; Belczynski et al., 2010; Spera et al., 2015). Therefore, both central stars formed in the LWH and MMH haloes will eventually leave remnant BHs with approximately the original stellar mass.
We here briefly discuss the subsequent gas accretion onto the stellar remnants in our simulated haloes. In the LWH halo, a BH with would form at the center of the ionized cavity seen in Figure 3. After the BH formation, since the central BH does not radiate by itself unlike a star, the hot ionized bubble cools down and collapses to the center without being impeded by radiative feedback. In this case, the BH is fed by large-scale inflowing gas from at rates of as seen in Figure 5. Such rapid mass inflows would reach the central BH after a few free-fall timescales, i.e., . Although, in general, mass accretion rates are limited to the Eddington rate, , our previous simulations in Toyouchi et al. (2021) have demonstrated that a BH accretes gas at super-Eddington rates overcoming radiative feedback associated with its accretion, when the mass supply rate from the circum-BH disk exceeds the critical value described as
| (23) |
where is the sound speed in the disk. We thus predict that after the central star turns into a BH in the LWH halo, the ionized cavity in the accretion disk is filled, and the remnant BH efficiently grows by rapid mass accretion.
In the case of the MMH halo, where an IMBH with would form, the mass accretion rate at is slightly lower than . Similar to the LWH halo, however, the mass supply rate onto the circum-BH disk would increase with time owing to mass inflows from larger radii. Once the conditions for super-Eddington mass accretion are satisfied, the central BH becomes a milli-QSO radiating with . While the IMBH in the MMH halo located at would be too faint to be observed, more luminous milli-QSOs with , resulting from higher BH mass and/or extremely high-Eddington ratios reach the detection limit for upcoming observations by the James Webb Space Telescope (Inayoshi et al., 2022a). A future discovery of such milli-QSOs at will be strong evidence of IMBH formation in the primordial universe and its rapid mass growth to establish SMBH populations found at .
5.3 Effects of disk fragmentation and off-center star formation
We here discuss the effects of disk fragmentation on the mass distribution of primordial stars. While our grid configuration is adopted to resolve the gas dynamics at the vicinity of the central star (namely, the innermost radius), disk fragmentation owing to gravitational instability potentially yields multiple stars surrounding the central star. Such off-center star formation depletes gas in the circumstellar disk and makes the central star less massive than our prediction in Figure 10 (e.g., Inayoshi & Haiman, 2014; Chon et al., 2018). Sugimura et al. (2020) conducted 3D RHD simulations with an adaptive mesh refinement technique and found that formation of a twin binary (i.e., nearly equal mass) would likely take place under circumstances of ordinary PopIII star formation. They reported that the total mass of the binary is reduced by a factor of from the central stellar mass found in other 3D RHD simulations by Hosokawa et al. (2016) that adopt the same simulation setup and initial conditions except using spherical coordinates111 This result does not mean that disk fragmentation and off-center star formation cannot be calculated properly in a spherical coordinate grid. Indeed, Oliva & Kuiper (2020) performed spherical coordinate based 3D RHD simulations with an extremely high spatial resolution and successfully demonstrated the formation of gravitationally collapsing cores in off-center regions of the accretion disk.. Therefore, this result implies that disk fragmentation would lead to a less top-heavy IMF, which is weighted towards compared to that shown in Figure 11.
However, in a massive cloud collapsing at a high rate of onto the cloud center, the circumstellar disk is so dense that gas clumps formed by disk fragmentation can quickly migrate inward via gaseous dynamical friction. Since the migration timescale is generally shorter than the KH timescale of the forming clumps, most clumps can plunge into the central protostar before forming massive companions (Inayoshi & Haiman, 2014). Indeed, recent simulations also demonstrate that the most massive star located at the center is preferentially fed by clump migration and mergers with low-mass companions, resulting in the formation of a single SMS (e.g., Suazo et al., 2019; Chon & Omukai, 2020). Furthermore, Regan et al. (2020a) post-processed the impact of stellar radiation in their cosmological hydrodynamical simulations and found that ionizing radiation from survived companion stars is too weak to suppress the growth of the primary SMS. Thus, we expect that our prediction of the PopIII IMF at – is not substantially affected by formation of low-mass companion stars associated with disk fragmentation. To confirm this expectation, we will perform more sophisticated simulations that includes off-center star formation in the numerical domain in a future study.
6 Summary
This paper presents a series of three-dimensional radiation hydrodynamical (3D RHD) simulations that study the formation processes of primordial supermassive stars (SMSs). In particular, our simulations focus on the two pristine haloes (the LWH and MMH model), which were originally identified and studied by recent cosmological simulations of protogalaxy formation ( W19, ). These haloes are expected to be possible sites forming SMSs with masses of since gravitational collapse of their gas clouds is suppressed by dynamical heating via rapid successive halo mergers until their virial masses reach . Unlike previous multi-dimensional simulations of SMS formation, our simulations successfully investigate the long-term stellar evolution up to , almost the lifetime of a massive star, following stellar evolution under variable mass accretion and radiative transfer of ionizing photons emitted from the growing star self-consistently.
For the LWH halo, we find that in the early phase (), the central protostar is efficiently fed by dense accretion flows via spiral waves in the circumstellar disk and grows to . However, the mass accretion rate subsequently drops far below the critical value of , below which the star contracts by losing its energy and evolves to a main sequence phase with a high effective temperature of . As a result, the massive central star continuously emits intense ionizing radiation and shuts down further mass growth, evacuating the circumstellar disk via photoevaporation. Thus, the LWH halo fails to produce an SMS, in contrast to expectations from previous simulations (e.g., \al@Wise2019Nature, Sakurai2020MNRAS; \al@Wise2019Nature, Sakurai2020MNRAS, ).
On the other hand, the central star in the MMH halo accretes gas efficiently over the entire lifetime, eventually growing to an SMS with . In this case, since short accretion bursts exceeding successively take place with intervals shorter than the Kelvin-Helmholtz timescale, the star can evolve in a cool bloating phase with without contraction. As the bloated star hardly emits ionizing radiation, the impact of radiative feedback in the MMH halo is substantially weaker than in the LWH halo even though the central star becomes much heavier.
To cover a wide parameter space and understand the formation of massive primordial stars under various circumstances, we also examine four additional cases named LWH-0.1, -0.5, -2, and -10, for which the gas density in the LWH halo is rescaled by a factor of 0.1, 0.5, 2, and 10, respectively. Compiling all the cases, we derive the relation between the final stellar mass in the 3D RHD simulations and the time-averaged mass supply rate for the corresponding 1D cases in the absence of radiative feedback (see Figure 10). This relation clearly highlight the suppression in stellar mass growth by radiative feedback and finite angular momentum of the accretion flows. We find that the final stellar mass monotonically rises from to with increasing mass supply rates from to . In the LWH-0.1, LWH-0.5, and LWH models, where , photoevaporation of the circumstellar disk effectively reduces the final stellar mass by a factor of a few tens compared to the mass expected in the absence of radiative feedback (Figure 10). On the other hand, in the MMH, LWH-2, and LWH-10 models, where , the final stellar mass is not determined by ionizing radiation feedback, but by the mass budget in the circumstellar disk or the short stellar lifetime. It is also worth noting that for the more rapid accretion cases, the stellar mass obtained in the 3D simulations is reduced by a factor of 0.4 compared to that in the 1D ones, which represents suppression of stellar mass growth by centrifugal forces exerted on the accretion flows.
Finally, we discuss the initial mass function of primordial stars formed in massive haloes associated with rare density peaks that end up in quasar host galaxies at . Combining our simulation results with the statistical properties of parent clouds predicted by a semi-analytical model (Li et al., 2021), we find that the stellar mass is widely distributed over – and the function shape is approximately given by a double power law with two slopes of and across a characteristic mass of . The global average number density of SMSs expected from this mass function is estimated as . This implies that if as few as of those SMSs collapse to intermediate-mass BHs and grow via efficient gas accretion, the observed number of SMBHs at can be explained. Based on the final state of the MMH model, the remnant BH is expected to be fed via the dense debris disk at super-Eddington accretion rates.
Acknowledgements
We thank K. Omukai and T. Hosokawa for fruitful discussions, and K. Sugimura, R. Nakatani, and Y. Sakurai for their contribution to developing the numerical code. The numerical simulations were performed with the Cray XC50 at the Center for Computational Astrophysics (CfCA) of the National Astronomical Observatory of Japan. This work is supported in part by JSPS KAKENHI Grant Numbers 21K20378, the National Natural Science Foundation of China (12073003, 12003003, 11721303, 11991052, 11950410493, and 1215041030), the China Manned Space Project Nos. CMS-CSST-2021-A04 and CMS-CSST-2021-A06, NSF grant AST-2006176, the Heisenberg Research Grant funded No. KU 2849/9, and the JSPS Invitational Fellowship for Research in Japan ID S20156.
Data availability
The data underlying this article will be shared on reasonable request to the corresponding author.
References
- Abel et al. (1997) Abel T., Anninos P., Zhang Y., Norman M. L., 1997, New Astron., 2, 181
- Abel et al. (2002) Abel T., Bryan G. L., Norman M. L., 2002, Science, 295, 93
- Bañados et al. (2018) Bañados E., et al., 2018, Nature, 553, 473
- Becerra et al. (2015) Becerra F., Greif T. H., Springel V., Hernquist L. E., 2015, MNRAS, 446, 2380
- Belczynski et al. (2010) Belczynski K., Bulik T., Fryer C. L., Ruiter A., Valsecchi F., Vink J. S., Hurley J. R., 2010, ApJ, 714, 1217
- Bromm & Loeb (2003) Bromm V., Loeb A., 2003, ApJ, 596, 34
- Bromm et al. (2001) Bromm V., Kudritzki R. P., Loeb A., 2001, ApJ, 552, 464
- Bullock et al. (2001) Bullock J. S., Kolatt T. S., Sigad Y., Somerville R. S., Kravtsov A. V., Klypin A. A., Primack J. R., Dekel A., 2001, MNRAS, 321, 559
- Chon & Omukai (2020) Chon S., Omukai K., 2020, MNRAS, 494, 2851
- Chon et al. (2016) Chon S., Hirano S., Hosokawa T., Yoshida N., 2016, ApJ, 832, 134
- Chon et al. (2018) Chon S., Hosokawa T., Yoshida N., 2018, MNRAS, 475, 4104
- Clark et al. (2011) Clark P. C., Glover S. C. O., Smith R. J., Greif T. H., Klessen R. S., Bromm V., 2011, Science, 331, 1040
- Dijkstra et al. (2008) Dijkstra M., Haiman Z., Mesinger A., Wyithe J. S. B., 2008, MNRAS, 391, 1961
- Fan et al. (2001) Fan X., et al., 2001, AJ, 122, 2833
- Federrath et al. (2011) Federrath C., Sur S., Schleicher D. R. G., Banerjee R., Klessen R. S., 2011, ApJ, 731, 62
- Fernandez et al. (2014) Fernandez R., Bryan G. L., Haiman Z., Li M., 2014, MNRAS, 439, 3798
- Fukushima et al. (2018) Fukushima H., Omukai K., Hosokawa T., 2018, MNRAS, 473, 4754
- Glover & Abel (2008) Glover S. C. O., Abel T., 2008, MNRAS, 388, 1627
- Glover & Jappsen (2007) Glover S. C. O., Jappsen A. K., 2007, ApJ, 666, 1
- Goodman (2003) Goodman J., 2003, MNRAS, 339, 937
- Greif et al. (2011) Greif T. H., Springel V., White S. D. M., Glover S. C. O., Clark P. C., Smith R. J., Klessen R. S., Bromm V., 2011, ApJ, 737, 75
- Greif et al. (2012) Greif T. H., Bromm V., Clark P. C., Glover S. C. O., Smith R. J., Klessen R. S., Yoshida N., Springel V., 2012, MNRAS, 424, 399
- Haemmerlé et al. (2018) Haemmerlé L., Woods T. E., Klessen R. S., Heger A., Whalen D. J., 2018, MNRAS, 474, 2757
- Haiman (2013) Haiman Z., 2013, in Wiklind T., Mobasher B., Bromm V., eds, Astrophysics and Space Science Library Vol. 396, The First Galaxies. p. 293 (arXiv:1203.6075), doi:10.1007/978-3-642-32362-1_6
- Haiman et al. (1996) Haiman Z., Thoul A. A., Loeb A., 1996, ApJ, 464, 523
- Heger et al. (2003) Heger A., Fryer C. L., Woosley S. E., Langer N., Hartmann D. H., 2003, ApJ, 591, 288
- Hirano et al. (2014) Hirano S., Hosokawa T., Yoshida N., Umeda H., Omukai K., Chiaki G., Yorke H. W., 2014, ApJ, 781, 60
- Hirano et al. (2015) Hirano S., Hosokawa T., Yoshida N., Omukai K., Yorke H. W., 2015, MNRAS, 448, 568
- Hirano et al. (2017) Hirano S., Hosokawa T., Yoshida N., Kuiper R., 2017, Science, 357, 1375
- Hosokawa et al. (2011) Hosokawa T., Omukai K., Yoshida N., Yorke H. W., 2011, Science, 334, 1250
- Hosokawa et al. (2012) Hosokawa T., Yoshida N., Omukai K., Yorke H. W., 2012, ApJ, 760, L37
- Hosokawa et al. (2013) Hosokawa T., Yorke H. W., Inayoshi K., Omukai K., Yoshida N., 2013, ApJ, 778, 178
- Hosokawa et al. (2016) Hosokawa T., Hirano S., Kuiper R., Yorke H. W., Omukai K., Yoshida N., 2016, ApJ, 824, 119
- Inayoshi & Haiman (2014) Inayoshi K., Haiman Z., 2014, MNRAS, 445, 1549
- Inayoshi & Omukai (2011) Inayoshi K., Omukai K., 2011, MNRAS, 416, 2748
- Inayoshi et al. (2014) Inayoshi K., Omukai K., Tasker E., 2014, MNRAS, 445, L109
- Inayoshi et al. (2016) Inayoshi K., Haiman Z., Ostriker J. P., 2016, MNRAS, 459, 3738
- Inayoshi et al. (2018) Inayoshi K., Li M., Haiman Z., 2018, MNRAS, 479, 4017
- Inayoshi et al. (2020) Inayoshi K., Visbal E., Haiman Z., 2020, ARA&A, 58, 27
- Inayoshi et al. (2021) Inayoshi K., Kashiyama K., Visbal E., Haiman Z., 2021, ApJ, 919, 41
- Inayoshi et al. (2022a) Inayoshi K., Onoue M., Sugahara Y., Inoue A. K., Ho L. C., 2022a, arXiv e-prints, p. arXiv:2204.09692
- Inayoshi et al. (2022b) Inayoshi K., Nakatani R., Toyouchi D., Hosokawa T., Kuiper R., Onoue M., 2022b, ApJ, 927, 237
- Jaura et al. (2022) Jaura O., Glover S. C. O., Wollenberg K. M. J., Klessen R. S., Geen S., Haemmerlé L., 2022, MNRAS, 512, 116
- Johnson et al. (2012) Johnson J. L., Whalen D. J., Fryer C. L., Li H., 2012, ApJ, 750, 66
- Kato et al. (2008) Kato S., Fukue J., Mineshige S., 2008, Black-Hole Accretion Disks — Towards a New Paradigm —
- Kuiper et al. (2010) Kuiper R., Klahr H., Beuther H., Henning T., 2010, ApJ, 722, 1556
- Latif et al. (2013) Latif M. A., Schleicher D. R. G., Schmidt W., Niemeyer J., 2013, MNRAS, 433, 1607
- Li et al. (2021) Li W., Inayoshi K., Qiu Y., 2021, ApJ, 917, 60
- Lupi et al. (2021) Lupi A., Haiman Z., Volonteri M., 2021, MNRAS, 503, 5046
- Marigo et al. (2001) Marigo P., Girardi L., Chiosi C., Wood P. R., 2001, A&A, 371, 152
- Matsukoba et al. (2021) Matsukoba R., Vorobyov E. I., Sugimura K., Chon S., Hosokawa T., Omukai K., 2021, MNRAS, 500, 4126
- Matsuoka et al. (2016) Matsuoka Y., et al., 2016, ApJ, 828, 26
- McKee & Tan (2008) McKee C. F., Tan J. C., 2008, ApJ, 681, 771
- Meece et al. (2014) Meece G. R., Smith B. D., O’Shea B. W., 2014, ApJ, 783, 75
- Mignone et al. (2007) Mignone A., Bodo G., Massaglia S., Matsakos T., Tesileanu O., Zanni C., Ferrari A., 2007, ApJS, 170, 228
- Mignone et al. (2012) Mignone A., Zanni C., Tzeferacos P., van Straalen B., Colella P., Bodo G., 2012, ApJS, 198, 7
- Mo et al. (1998) Mo H. J., Mao S., White S. D. M., 1998, MNRAS, 295, 319
- Mortlock et al. (2011) Mortlock D. J., et al., 2011, Nature, 474, 616
- Nakatani et al. (2018a) Nakatani R., Hosokawa T., Yoshida N., Nomura H., Kuiper R., 2018a, ApJ, 857, 57
- Nakatani et al. (2018b) Nakatani R., Hosokawa T., Yoshida N., Nomura H., Kuiper R., 2018b, ApJ, 865, 75
- Navarro et al. (1997) Navarro J. F., Frenk C. S., White S. D. M., 1997, ApJ, 490, 493
- Nomoto et al. (2013) Nomoto K., Kobayashi C., Tominaga N., 2013, ARA&A, 51, 457
- Oh & Haiman (2002) Oh S. P., Haiman Z., 2002, ApJ, 569, 558
- Oliva & Kuiper (2020) Oliva G. A., Kuiper R., 2020, A&A, 644, A41
- Omukai (2000) Omukai K., 2000, ApJ, 534, 809
- Omukai (2001) Omukai K., 2001, ApJ, 546, 635
- Omukai & Inutsuka (2002) Omukai K., Inutsuka S.-i., 2002, MNRAS, 332, 59
- Omukai & Palla (2003) Omukai K., Palla F., 2003, ApJ, 589, 677
- Onoue et al. (2019) Onoue M., et al., 2019, ApJ, 880, 77
- Regan et al. (2014) Regan J. A., Johansson P. H., Wise J. H., 2014, ApJ, 795, 137
- Regan et al. (2017) Regan J. A., Visbal E., Wise J. H., Haiman Z., Johansson P. H., Bryan G. L., 2017, Nature Astronomy, 1, 0075
- Regan et al. (2020a) Regan J. A., Wise J. H., Woods T. E., Downes T. P., O’Shea B. W., Norman M. L., 2020a, The Open Journal of Astrophysics, 3, 15
- Regan et al. (2020b) Regan J. A., Wise J. H., O’Shea B. W., Norman M. L., 2020b, MNRAS, 492, 3021
- Sakurai et al. (2015) Sakurai Y., Hosokawa T., Yoshida N., Yorke H. W., 2015, MNRAS, 452, 755
- Sakurai et al. (2016) Sakurai Y., Vorobyov E. I., Hosokawa T., Yoshida N., Omukai K., Yorke H. W., 2016, MNRAS, 459, 1137
- Sakurai et al. (2020) Sakurai Y., Haiman Z., Inayoshi K., 2020, MNRAS, 499, 5960
- Schauer et al. (2017) Schauer A. T. P., Regan J., Glover S. C. O., Klessen R. S., 2017, MNRAS, 471, 4878
- Schleicher et al. (2013) Schleicher D. R. G., Palla F., Ferrara A., Galli D., Latif M., 2013, A&A, 558, A59
- Shakura & Sunyaev (1973) Shakura N. I., Sunyaev R. A., 1973, A&A, 24, 337
- Shang et al. (2010) Shang C., Bryan G. L., Haiman Z., 2010, MNRAS, 402, 1249
- Shibata & Shapiro (2002) Shibata M., Shapiro S. L., 2002, ApJ, 572, L39
- Smith et al. (2012) Smith R. J., Hosokawa T., Omukai K., Glover S. C. O., Klessen R. S., 2012, MNRAS, 424, 457
- Spera et al. (2015) Spera M., Mapelli M., Bressan A., 2015, MNRAS, 451, 4086
- Stacy et al. (2010) Stacy A., Greif T. H., Bromm V., 2010, MNRAS, 403, 45
- Stacy et al. (2012) Stacy A., Greif T. H., Bromm V., 2012, MNRAS, 422, 290
- Suazo et al. (2019) Suazo M., Prieto J., Escala A., Schleicher D. R. G., 2019, ApJ, 885, 127
- Sugimura et al. (2014) Sugimura K., Omukai K., Inoue A. K., 2014, MNRAS, 445, 544
- Sugimura et al. (2017) Sugimura K., Hosokawa T., Yajima H., Omukai K., 2017, MNRAS, 469, 62
- Sugimura et al. (2018) Sugimura K., Hosokawa T., Yajima H., Inayoshi K., Omukai K., 2018, MNRAS, 478, 3961
- Sugimura et al. (2020) Sugimura K., Matsumoto T., Hosokawa T., Hirano S., Omukai K., 2020, ApJ, 892, L14
- Susa et al. (2014) Susa H., Hasegawa K., Tominaga N., 2014, ApJ, 792, 32
- Tan & McKee (2004) Tan J. C., McKee C. F., 2004, ApJ, 603, 383
- Tanaka & Li (2014) Tanaka T. L., Li M., 2014, MNRAS, 439, 1092
- Tanaka et al. (2013) Tanaka K. E. I., Nakamoto T., Omukai K., 2013, ApJ, 773, 155
- Toyouchi et al. (2019) Toyouchi D., Hosokawa T., Sugimura K., Nakatani R., Kuiper R., 2019, MNRAS, 483, 2031
- Toyouchi et al. (2020) Toyouchi D., Hosokawa T., Sugimura K., Kuiper R., 2020, MNRAS, 496, 1909
- Toyouchi et al. (2021) Toyouchi D., Inayoshi K., Hosokawa T., Kuiper R., 2021, ApJ, 907, 74
- Turk et al. (2012) Turk M. J., Oishi J. S., Abel T., Bryan G. L., 2012, ApJ, 745, 154
- Umeda et al. (2016) Umeda H., Hosokawa T., Omukai K., Yoshida N., 2016, ApJ, 830, L34
- Visbal et al. (2014) Visbal E., Haiman Z., Bryan G. L., 2014, MNRAS, 445, 1056
- Visbal et al. (2020) Visbal E., Bryan G. L., Haiman Z., 2020, ApJ, 897, 95
- Volonteri (2012) Volonteri M., 2012, Science, 337, 544
- Vorobyov et al. (2013) Vorobyov E. I., DeSouza A. L., Basu S., 2013, ApJ, 768, 131
- Wang et al. (2021) Wang F., et al., 2021, ApJ, 907, L1
- Willott et al. (2010) Willott C. J., et al., 2010, AJ, 139, 906
- Wise et al. (2019) Wise J. H., Regan J. A., O’Shea B. W., Norman M. L., Downes T. P., Xu H., 2019, Nature, 566, 85
- Wolcott-Green & Haiman (2019) Wolcott-Green J., Haiman Z., 2019, MNRAS, 484, 2467
- Wolcott-Green et al. (2011) Wolcott-Green J., Haiman Z., Bryan G. L., 2011, MNRAS, 418, 838
- Woods et al. (2017) Woods T. E., Heger A., Whalen D. J., Haemmerlé L., Klessen R. S., 2017, ApJ, 842, L6
- Woods et al. (2020) Woods T. E., Heger A., Haemmerlé L., 2020, MNRAS, 494, 2236
- Wu et al. (2015) Wu X.-B., et al., 2015, Nature, 518, 512
- Yang et al. (2021) Yang J., et al., 2021, ApJ, 923, 262
- Yoshida et al. (2003) Yoshida N., Abel T., Hernquist L., Sugiyama N., 2003, ApJ, 592, 645
- Yoshida et al. (2008) Yoshida N., Omukai K., Hernquist L., 2008, Science, 321, 669
Appendix A Numerical checks
We present the results of three additional runs with the same initial condition as the LWH halo but different grid configurations. In the LWH-HR run, we double the number of grid cells in the polar and azimuthal directions, i.e., (, , ) = (200, 72, 144) to better capture the nature of disk fragmentation (e.g., Federrath et al., 2011; Turk et al., 2012; Meece et al., 2014). In the LWH-HS run, we set a smaller sink cell with a size of to see the effect of dense clouds that might form at the innermost radius and attenuate the incident stellar radiation, resulting in suppression of disk photoevaporation (e.g., Jaura et al., 2022). Finally, in the LWH-NE run, we relax the assumption of equatorial symmetry since asymmetric vertical flows passing through the equator perturb the circumstellar disk and regulate the mass accretion onto the central star (e.g., Toyouchi et al., 2021).
In Figure 12, we present the time evolution of the stellar mass for the three models as well as the original LWH model. In all of these cases, the stellar mass increases up to in the early stage, but the mass growth halts around . The overall trend is almost identical to the original result in the LWH model. Thus, our simulation result in the LWH case is not sensitive to the numerical treatments discussed above.
It is worth speculating whether the stellar mass growth history changes with further increasing spatial resolution and reducing sink radii. According to 3D RHD simulations by Oliva & Kuiper (2020) that studied disk fragmentation and star formation with an extensive convergence test varying the grid resolution by , the evolution of the central stellar mass and the number of fragments quantitatively converge above their intermediate resolution level with , which is slightly coarser than that adopted in our LWH-HR model. Thus, we conclude that our result is converged sufficiently. On the other hand, with a minimal sink radius nearly reaching the surface of the central star, the outer disk regions might be shielded from stellar radiation by dense clumps that could form at the inner disk, resulting in reduction of mass loss owing to photoevaporation. This issue is left for future investigation.