First light of the Integral Field Unit of GRIS on the GREGOR solar telescope
Abstract
An Integral Field Unit (IFU) based on image-slicers has been added to the GREGOR Infrared Spectrograph (GRIS). This upgrade to the instrument makes possible 2D spectropolarimetry in the near-infrared by simultaneously recording the full Stokes profiles of spectral lines (in a given spectral interval) at all the points in the field of view. It provides high-cadence spectropolarimetric observations at the instrument’s high spatial resolution and high polarization sensitivity at the GREGOR solar telescope. The IFU is ideal for observing the polarized spectrum of fast-evolving solar features at high spatial and spectral resolutions. The high observing cadence opens the possibility of time-series observations. The analysis of observations to this level of accuracy is essential for understanding the complex dynamics and interactions of solar plasma and magnetic fields. The image slicer of the IFU has eight slices of width 100 m, covering a total field of view of 6′′ 3′′. It was designed and built within the framework of the European projects SOLARNET and GREST, as a prototype for future instruments of the European Solar Telescope (EST) and was integrated into GRIS. After two commissioning campaigns in 2017 and 2018, the IFU was finally installed at the end of September 2018 and offered to all observers who use the telescope.
keywords:
Integral Field Unit; IFU; GREGOR; GRIS; spectropolarimetry; solar.∗Corresponding author.
; ; ;
1 Introduction
Integral field units (IFUs) based on image-slicers are commonly used in astrophysical night-time slit-spectroscopy. They were initially proposed by Bowen (1938) and have been developed since the work of Weitzel96 and Content (1997). The working principle of image slicers is to slice a region of the focal-plane image into a series of small rectangles and rearrange them in the form of a long slit. This slit is composed of a given number of mini-slits (equal to the number of slicer mirrors). The width of the individual slicer mirrors determines the slit width that feeds the spectrograph, into which the IFU is integrated.
In solar physics, IFUs based on this technology can be used to record fast-evolving solar features at high spatial and spectral resolution, even at near-infrared (NIR) wavelengths. As described in a review of instrumentation for solar spectropolarimetry by Iglesias & Feller (2019), there are few instruments currently in operation (see Socas-Navarro et al., 2006; Jaeggli et al., 2010; Cao et al., 2012; Collados et al., 2012; Jaeggli, 2022) that can perform solar spectropolarimetry in the NIR (i.e., up to 1.7 m).
In the case of GRIS (GREGOR Infrared Spectrograph, see Collados et al., 2012), adding an IFU to the instrument makes possible to obtain spectra at all the points in a 2D field of view (FOV) and get the full Stokes profiles of the spectral lines in a given spectral interval. This makes possible to observe, at high spatial and spectral resolutions, the polarized spectrum of fast-evolving solar features at a cadence of a few seconds. The IFU added to GRIS was designed at the Instituto de Astrofísica de Canarias (IAC) as a first approach to the conceptual instrument called “MUSICA” Calcines et al. (2013b), for EST instrumentation Calcines et al. (2013a). The IFU was built in collaboration with Winlight Systems (formerly Winlight Optics) within the framework of the SOLARNET and Getting Ready for EST (GREST) European projects. The IFU was taken to the GREGOR solar telescope Schmidt et al. (2012) and integrated into GRIS in 2017. From the first tests, it was clear that some work still needed to be done, and a second commissioning campaign was carried out in 2018 Dominguez-Tagle et al. (2018). During the scientific validation’ procedure, a number of spectropolarimetric measurements at the solar disk center were recorded. After these campaigns, the IFU in GRIS was made available to the entire GREGOR observing community.
Between 2018 and 2019, more than 15 scientific teams observed with the IFU. It was in use for more than 70% of the telescope’s observing time. More than 100 days of scientific data have been archived (i.e., selecting those obtained in good observing conditions). In 2020 and the first semester of 2021, the IFU was not offered because of the pandemic and changes in the telescope optics. Four scientific articles with results based on IFU observations have already been published Kaithakkal et al. (2020); Campbell et al. (2021); Anan et al. (2021); Nelson et al. (2021).
2 Instrument description
2.1 GRIS
GRIS Collados et al. (2012) is a spectropolarimeter consisting of a 6 m focal-length Czerny–Turner spectrograph and a polarimeter built from the heritage of TIP-II Collados et al. (2007). GRIS works in the wavelength range 1.0–2.3 m. Its 1k 1k NIR detector can be read at up to 36 fps. The polarimeter has two sets of Ferroelectric Liquid Crystals, one optimized to work at 1.0–1.3 m and the other at 1.5–1.8 m. GRIS has two observing modes, spectroscopy and spectropolarimetry, both with a long slit (0.26′′ width 60′′ length). It has a Slit Scan Unit (SSU) to do scans perpendicular to the slit. The SSU allows the scanning of a FOV up to 60′′ 64′′ to be covered. The polarimeter is placed immediately after the SSU. As described in Collados et al. (2012), the slit mask in the SSU is inclined with respect to the entrance beam in order to reflect the light that arrives out of the slit towards a slit-jaw imaging system. This inclination does not alter the operation of the spectrograph and allows a field context image to be generated. Table 2.1 shows the specifications of the slit mode in the first column. The IFU mode is discussed in the next section.
[ht] GRIS slit and IFU specifications \topruleSlit mode IFU mode \colruleNumber of slits: 1 Number of slices: 8 Slit length: 60′′ Slice length: 6′′ Slit width: 0.26′′ Slice width: 0.375′′ (100 m) Slit Scan (SSU) 2D Scan (FOVSS) Moves in 1 direction Moves in 2 directions Max. FOV: Max. FOV: Double sampling mode: half slit width (see Section 3) same Spectral wavelength ranges: 18 Å at 10830 Å same 40 Å at 15650 Å same Pixel scale: 0.135′′ same Simultaneous slit-jaw images acquisition same Detector: 1k 1k same Well depth: 16384 ADUs (14 bits) Gain: 19 e-/ADU same \botrule
2.2 IFU
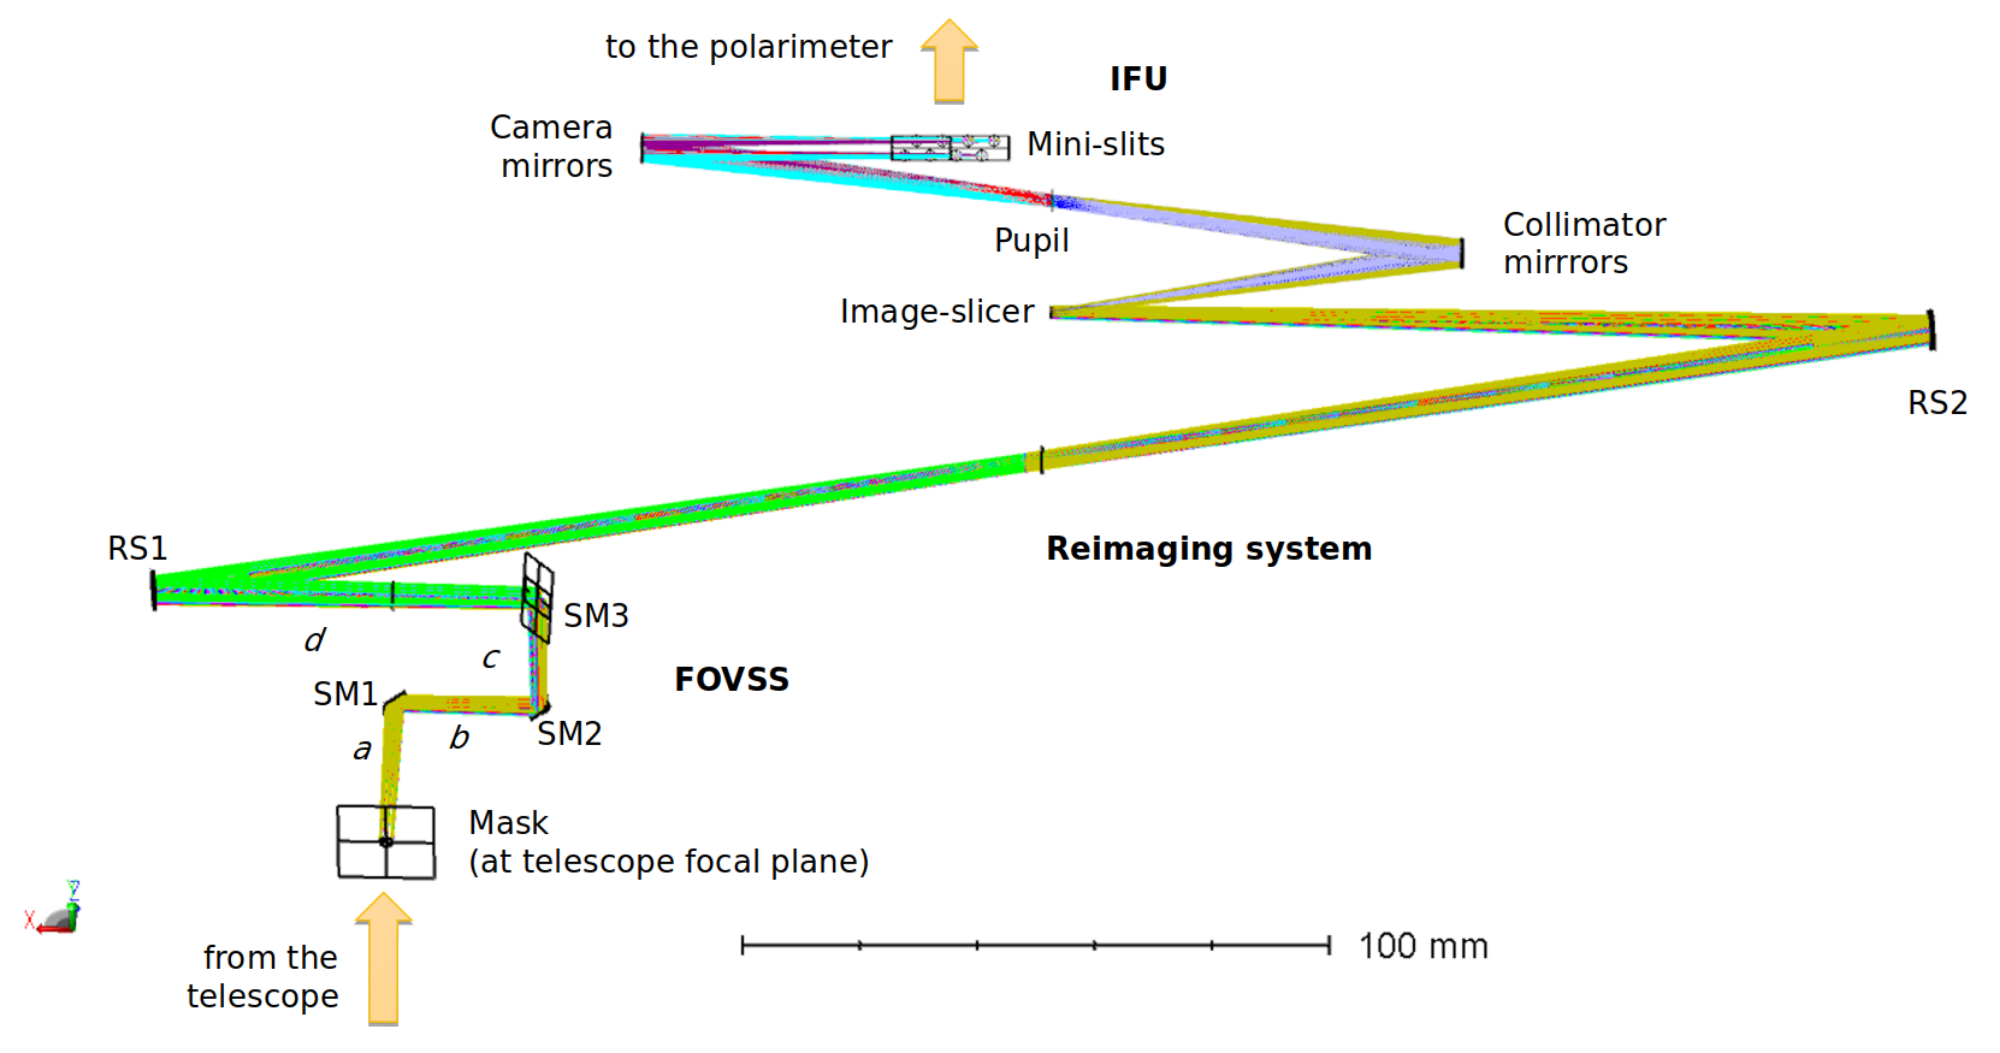
The IFU has been coupled to GRIS to add an additional observing mode. Currently, it is possible to exchange the slit and IFU modes in a single day Vega-Reyes et al. (2016). In the slit mode, the slit is placed at the focal plane of the telescope and is part of the SSU. The light path exits the SSU and goes through the polarimeter to the rest of the spectrograph. In IFU mode, the arrangement is different because of the available space and the size of the optical components of the polarimeter. Figure 1 shows the layout of the IFU mode. An entrance mask is placed at the telescope’s focal plane to limit the FOV to the size of the image slicer. The mask is the first element of the Field of View Scan System (FOVSS). This new scanning system is described in Section 2.3. A reimaging system is incorporated in order to place the IFU in a new focal plane. The reimaging system is based on a classic collimator-camera design and includes two mirrors (RS1 and RS2). The image slicer of the IFU (shown at the top of Figure 1) is at the focal plane generated by the RS2 mirror.
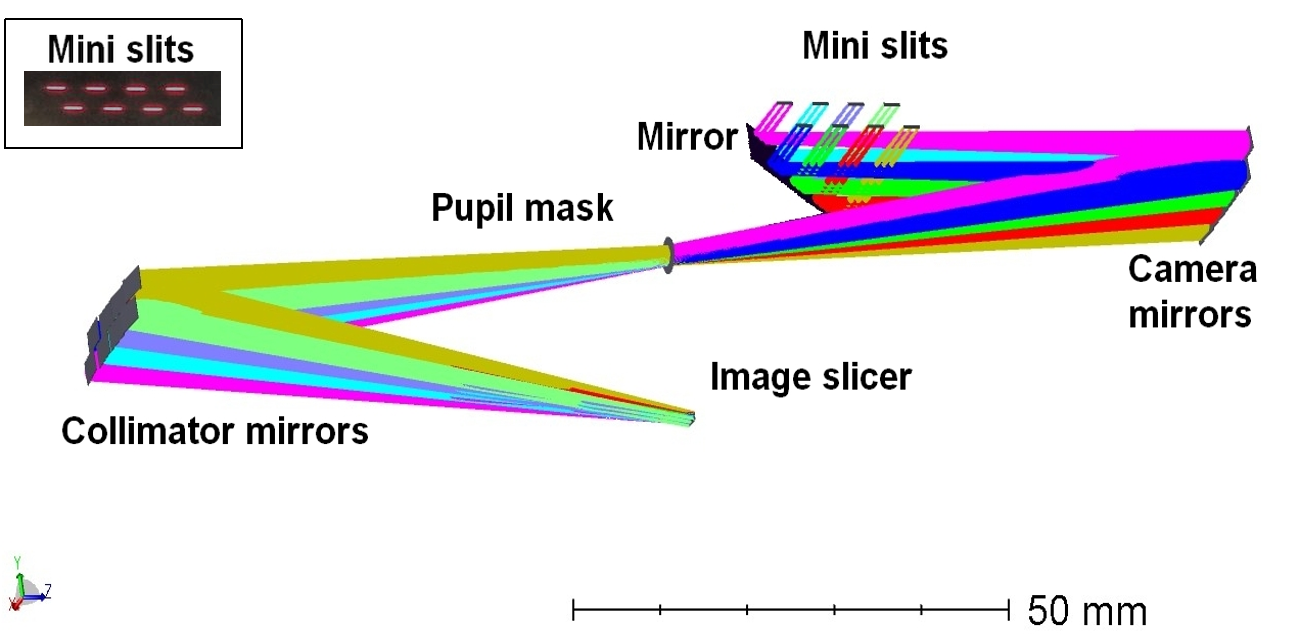
The IFU covers a FOV of in a single exposure. It is based on image-slicer technology with eight slicer mirrors of size 1.8 mm 0.1 mm, each. These mirrors cut a rectangular region of the image at the focal plane and reorganize it into a long slit formed by eight mini-slits. The whole IFU body is fabricated in Zerodur to reduce thermal sensitivity because the instrument works at room temperature. The reorganization of the image from the image slicer towards the output slit is accomplished by a reimaging system, which has a classic collimator-camera design. There is a pair of collimator and camera mirrors for each slice. The optical design evolved from the U-path described in Calcines et al. (2014) to a Z-path, using spherical mirrors for the collimator and camera. The system is designed to be telecentric and includes a mask at the pupil plane to reduce straylight. The eight beams have the pupil in the same position so that one pupil mask works for all of them. The output slit is arranged in two rows of mini-slits in order to minimize geometrical distortion and optical aberrations. The optical design is shown in Figure 2. The insert shows the output mini-slits illuminated with sunlight. There is red light at the mini-slits because the IFU is fed by wavelengths over 650 nm.
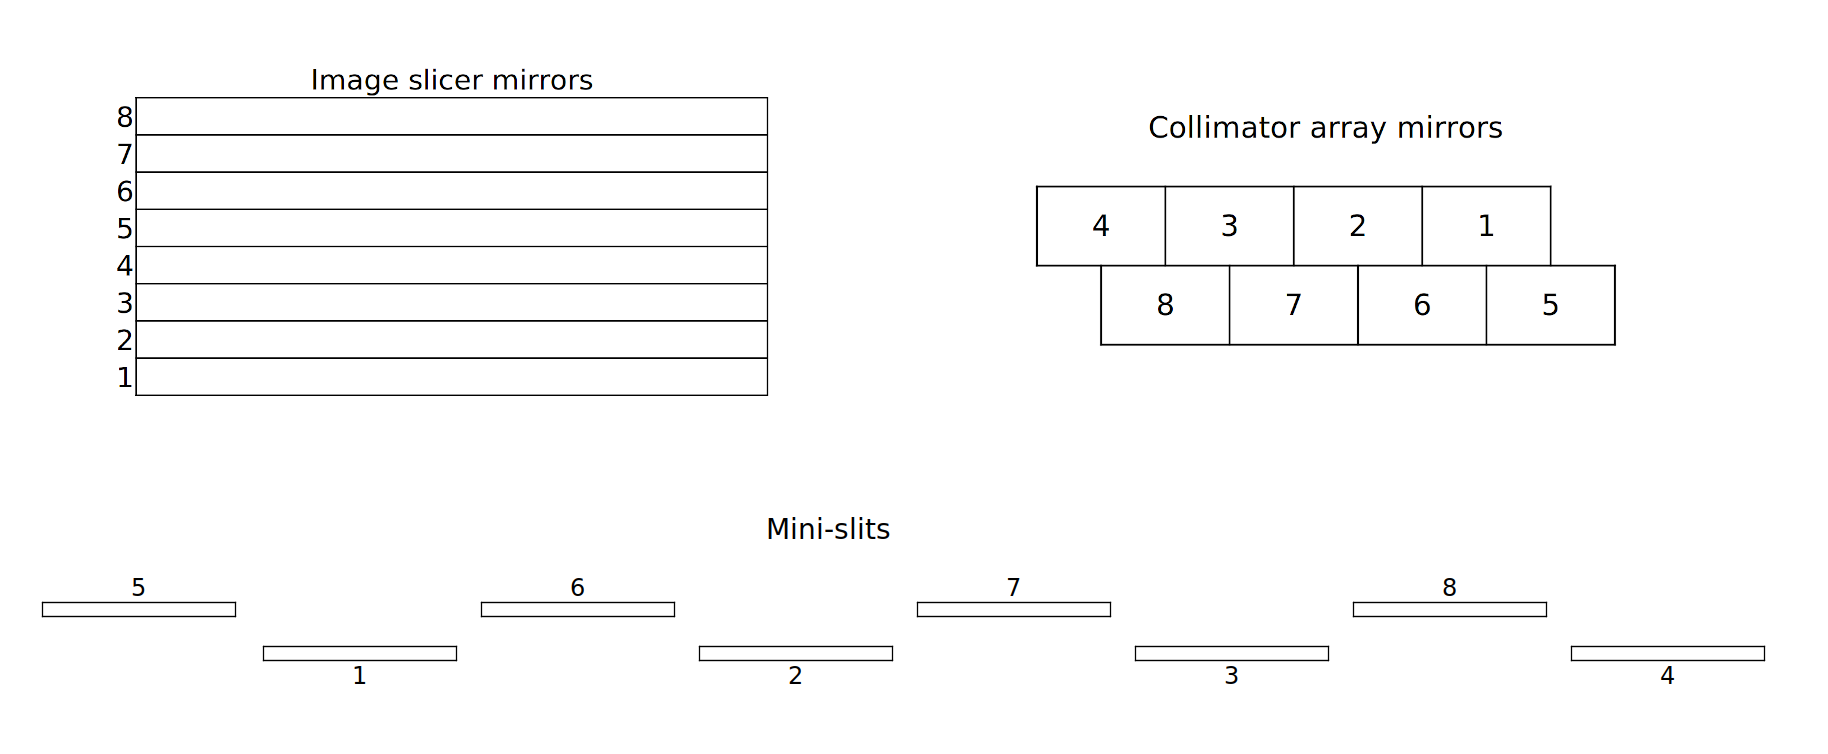
The collimator and camera mirrors are grouped into arrays and their numbering is shown in Figure 3. It can be seen that the central mirrors in the image slicer correspond to the edges of the collimator and mini-slit arrays. After the mini-slits, the light path continues to the polarimeter and the rest of the spectrograph. Two flat mirrors are inserted in the path after the polarimeter in order to take the beam back to the spectrograph optical axis and to compensate for the difference in the path length with respect to the slit mode.
From an operational point of view, observations in IFU mode are conducted in a similar way to those in slit mode, with the exception that the IFU provides the opportunity to observe a 2D region in one shot. In addition, it has scanning capabilities with the FOVSS to record a larger solar area. Both the SSU and the FOVSS can cover roughly the same area, although the IFU is most useful for fast small-area scans. The second column of Table 2.1 shows the specifications of the IFU mode.


As described before, the entrance mask defines the FOV with precision in order to illuminate only the useful part of the image slicer. The mask is placed at the entrance of the FOVSS (see Figure 4) and has the same inclination as the slit mask (). During the first campaigns it was a rectangle cut on the aluminum coating over an SiO2 window. However the small particles of dust present over the inclined glass contaminated the spectra. Regular cleaning of the mask was required. It was replaced in 2019 by a true-hole mask fabricated in a Si wafer coated with protected aluminum. The wafers are as good as any optical mirror since they have an intrinsic flatness better than 2 m over 150 mm and the rectangle, machined using etching, has errors of the order of a few microns. This new mask improved the quality of the spectra.
2.3 FOVSS
The FOVSS was designed to do 2D scans covering the total FOV up to Esteves et al. (2018). The scan size is configurable by the user. The FOVSS keeps the optical path length constant, regardless of the scanning position over the FOV. This condition is satisfied by means of three Scanning Mirrors (SM), which change their positions using three motors. Figure 1 includes the layout of the FOVSS configuration and its components. The entire assembly, with the exception of RS1, is mounted on a common translation stage (TS) which moves the system along the X-axis. The mask, plus the SM1 and SM2 set are mechanically connected to a second TS, which moves this set along the Y-axis. Finally, the SM2 and SM3 set is mechanically connected to a third TS which allows movement along the X-axis independently of the first TS. TS1 and TS2 allow the movement of the mask along the X and Y axes, respectively, to enable 2D scanning. TS3 uses the SM2 and SM3 set to compensate for the optical path length as a function of the system movement while scanning. The total optical path length, determined by the sum of segments (shown in Figure 1), is always constant.
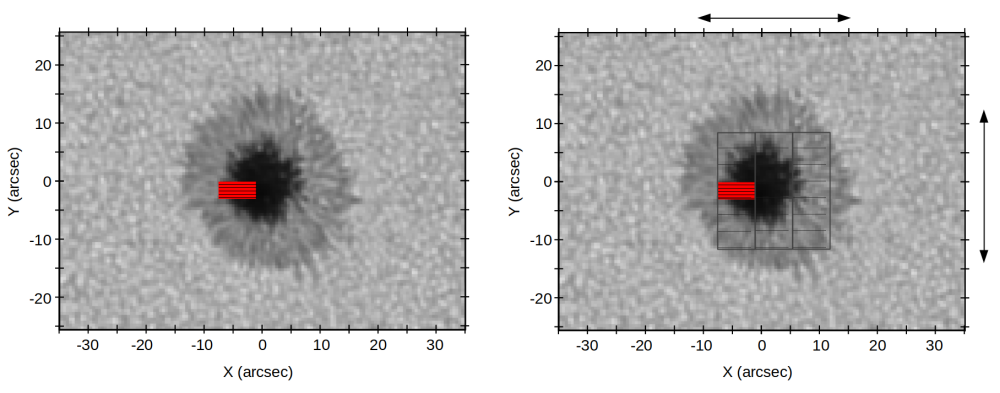
Figure 5 shows a representation of the image slicer and some possible scan positions over the FOV, which is illustrated by a real-scale image from the Sun (SDO/HMI continuum). The image slicer is represented by a red rectangle, including the eight slicer mirrors. The left frame represents a single exposure over an area of 6′′ 3′′. The black rectangles in the right frame represent an example of a 3 7 scan. The available scan movements are represented by the arrows.
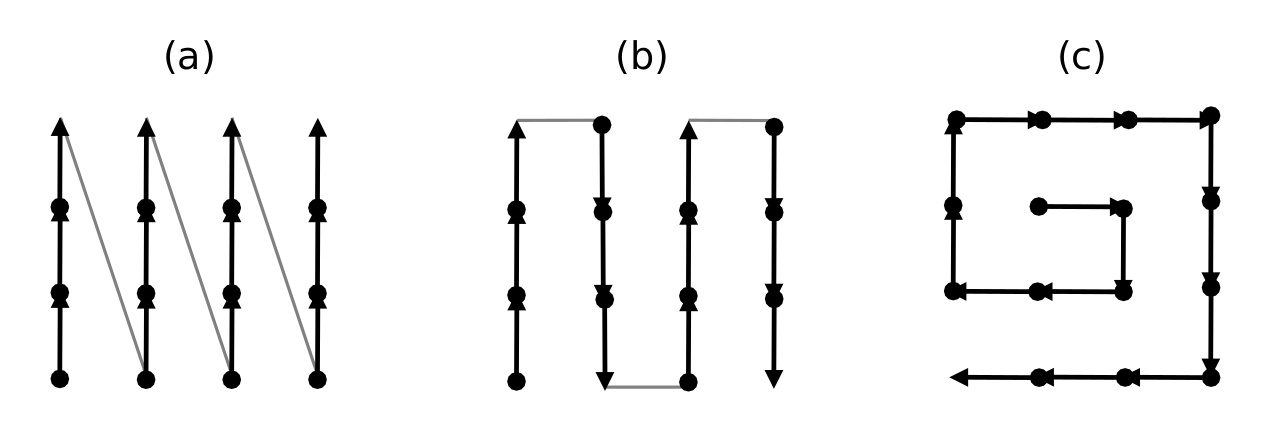
The FOVSS allows scans to be made following different patterns, such as those shown in Figure 6. The patterns called “-vertical” are also available horizontally, to give transposed scanning patterns. The initial scan position can be chosen between the geometrical center or one corner of the full scan pattern. Observers can choose the pattern that better fits the solar-feature dynamics they are studying.
2.4 Performance of the IFU
As described in Section 2.2, the IFU has a set of collimator and camera mirrors to arrange the FOV into a slit. The mirror arrangement and numbering (illustrated in Figure 3) show that the central mirrors in the image slicer correspond to the edges of the collimator and mini-slit arrays. This layout produces some light contamination on the adjacent mirrors. Figure 7 shows the IFU in operation and gives an idea of the small dimensions of its components. The size of each collimator and camera mirror is 4.2 mm 4.5 mm. One possible source of that contamination has been evaluated by studying the diffraction effects seen on the collimator mirrors due to the thin dimensions of the slicer mirror (100 m). The tests were done at a wavelength of 15650 Å, by illuminating only one slicer mirror at a time and measuring the light from all the output mini-slits. Table 7 shows the result of the tests. The measurements are represented as percentages, normalized to the self-illumination of each slice (diagonal values). The background level at the detector is subtracted. The maximum value of the slice-to-slice contamination is 6.3% for the neighbors of slice number 7, and the median value is 3.5%. The pupil mask reduces this value significantly. The same tests done without the mask give a median value of 4.8%. Another effect, specific to the geometry of the mini-slits and collimator arrays (seen in Figure 2), is “intra-row” light contamination, resulting from the layout of the collimator array in two rows. The values that are affected for each row are underlined (see Table 7). The maximum value of the intra-row contamination is 1.5% from slice number 4 to number 8 and the median value is 1.2%. These measured values are compared with the modeled behavior (Regalado et al., in prep.), which estimates that at least 80% of the energy (from the first diffraction ring) is contained within a single slicer mirror. This value is lower than that obtained in the study by Calcines et al. (2014), because that work was done at a wavelength of 10000 Å, which is a case with less diffraction. An additional mask at the mini-slit plane could help to reduce some straylight in the direction perpendicular to the slits. The inclusion of this mask has been considered; the manufacturing and fixing, however, are difficult owing to the discontinued form of mini-slits and the limited availability of space. It is planned for the future prototypes.


[ht] Light contamination measurements represented as percentages. Rows (I) denote the illuminated slicer mirror number and columns (M) the measured mirror number. The values that are affected for each row are underlined. The numbering is shown in Figure 3. \topruleMirrors 4 3 2 1 5 6 7 8 (I M) \colrule4 100 3.0 0.8 0.3 0.1 0.1 0.4 1.5 3 3.5 100 3.3 1.0 0.5 0.5 1.1 1.2 2 0.5 3.4 100 3.3 0.9 1.5 1.2 0.3 1 0.1 0.8 3.4 100 4.2 1.6 0.5 0.3 5 0.0 0.2 0.8 3.5 100 4.7 0.8 0.5 6 0.1 0.4 1.6 1.5 3.3 100 5.2 0.8 7 0.2 1.2 1.2 0.5 0.6 3.7 100 6.3 8 1.1 1.1 0.4 0.1 0.5 0.6 2.8 100 \botrule
3 Science observations
Typical observations in IFU mode are similar to those carried out in slit mode: the observer has to choose the exposure time and the number of accumulations. The scan option provides the possibility of covering a bigger FOV by controlling the number of scan steps. The only difference is that in IFU mode there are two dimensions for the movements, as explained previously. The scan can be automatically repeated in time to obtain temporal series. In order to calibrate the observations, flat-field images have to be taken every 1.5 h (maximum) and a series of polarimetric calibration images has to be recorded at least once per day. The latter is performed using the Polarimetric Calibration Unit Hofmann et al. (2012).
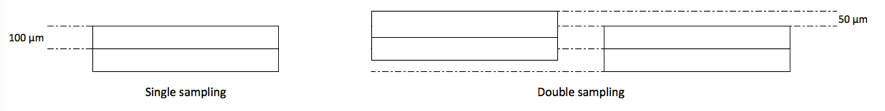
The spatial sampling can be done in single- or double-mode. Single sampling is equivalent to taking a single exposure at every position in the FOV. In double sampling mode, two exposures are taken at every position, one displaced half-slice-width with respect to the other. With it, the spatial resolution due to the sampling is doubled. The two spectral images are adequately interlaced by the reduction pipeline.
Figure 8 illustrates how the double-sampling step size is 50 m for the slice width of 100 m ().
| (1) |
The scan time can be estimated using Eq. 1, where:
= number of accumulations
= integration time
= 30 ms
= 1.3 s approx.
= 1 for single, 2 for double sampling (see the text)
= number of vertical steps (running perpendicular to the slices)
= number of horizontal steps (running parallel to the slices)
3.1 Reduction pipeline
The reduction pipeline Collados (2003) was updated to recognize the IFU mode and to calibrate the data in any observing mode. It is based on the procedures described in Collados (1999). The current version, GRIS_V8 is used for the data reduction process with both slit and IFU modes. The pipeline does the dark current and flat corrections, as well as the wavelength and polarimetric calibrations. The pipeline also reorganizes the image of the spectra, from what is seen in the detector (see Figure 9) into a 3D data cube containing two spatial directions plus the spectral direction. The resulting file contains two additional dimensions, one for the Stokes parameters (, , , and ) and one for time, in the case of temporal series. The data has a spatial sampling of , where the first number is the pixel scale and the second is, in double sampling mode, the slice width divided by 2. In single sampling mode it is .
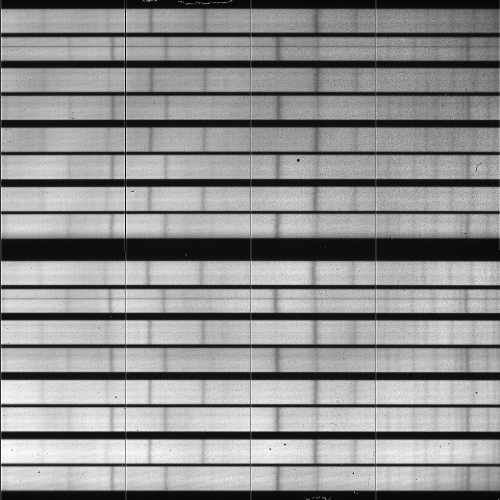
Figure 9 shows an example of the raw image of IFU spectra seen at the detector. It was taken in spectropolarimetric mode, so there are two groups of eight spectra, corresponding to two orthogonal states of polarization. The central wavelength is 15650 Å and the range is 40 Å. There is an apparent shift in wavelength between two consecutive spectra. This effect is actually an optical shift due to the arrangement of the mini-slits in two rows (as seen in the insert of Figure 2). Some bad pixels and the readout structure (vertical lines) of the detector are also present in this raw image. The pipeline removes all these artifacts and corrects the optical shift. Five spectral absorption lines are visible, Fe i 15662.0 Å being the most intense one. The wavelengths of the other Fe i absorption lines are: 15645.0 Å, 15648.5 Å, 15652.9 Å and 15665.2 Å.
3.2 Examples of observations
Some examples of the data obtained with the IFU are described below in order to show the instrument capabilities, versatility and performance.
3.2.1 1 2 scan of solar granulation
A small region at the center of the solar disk was observed after the commissioning on September 2018. Figure 10 shows an example of the time-series observations with a 1 2 scan (). This series shows the reconstructed images of the continuum intensity near 15650 Å, observed with a cadence of 18 s. The total duration of the series is about 90 minutes. The evolution of the granulation is clearly seen over the selected time range for the figure. The number at the top of each image is the elapsed time relative to the start of this temporal series. The formation of one exploding granule is distinguishable at the lower-left corner of the image at 273 s, and its evolution can be followed over the subsequent images. The analysis of the evolving magnetic fields is in progress (Dominguez-Tagle et al., in prep.).


3.2.2 3 3 scan of solar active region
Active region 12665 (located at solar coordinates S06E24) was observed on July 2017, with a 3 3 scan (). It was observed over 24 minutes in a temporal series with a cadence of 40 s. This FOV covers a region with a small umbra with a spiral-shaped penumbra. Figure 11 shows the continuum intensity map and the Q, U, V monochromatic images extracted from the polarized spectrum at 0.5 Å to the blue from the center of the Fe i 15648.52 Å spectral line. This spectral line is specially suited for magnetic studies, because of its large magnetic sensitivity (Landé factor ). The data sets have been obtained with three modulation cycles. In each of these, a set of four images is recorded, from which the four Stokes parameters I, Q, U, and V can be retrieved. All images corresponding to the same modulation step are summed up in real time. The signal to noise ratio achieved a value of 700 in the Q, U, and V continua (, where is the continuum intensity and is the Q, U, V continuum noise level -one standard deviation-).

Figure 12 shows the I, Q, U, V profiles at the point indicated by the blue cross in Figure 11. Only a spectral range of 4 Å around the Fe i 15648.52 Å spectral line is shown, whereas the recorded spectral range is 40 Å. The Zeeman splitting in these selected points corresponds to about 2300 G. The amplitudes of the linearly polarized profiles indicate a non-negligible inclination of the magnetic field. The red dashed lines in Figure 11 are used to display equivalent horizontal long-slit I, Q, U and V spectral images (see Figure 13). The spatial variations of the field strength, polarity and orientation are clearly detected, as indicated by the separation and sign of the Zeeman components in the Q, U and V images.

3.2.3 Published results based on IFU observations
Quiet-Sun magnetic flux cancellations were studied by Kaithakkal et al. (2020), from observations of quiet-Sun granulation performed on November 2018. The 40-minute time-series observations have a cadence of 26.4 s, for a 1 2 scan (). The spectral range was centered on the Si i 10827.108 Å spectral line, which is magnetically sensitive with a Landé factor .
A plage region in active region 12723 was observed on October 2018, and the analysis of the magnetic field structures, published by Anan et al. (2021) is partially based on observations with GRIS/IFU. Three temporal series of 1 2 scan () with a cadence of 26 s were performed by the IFU. The observations were centered on a spectral region containing the He i triplet at 10830 Å and Si i 10827.108 Å spectral line.
Magnetic fields in photospheric small-scale network regions were studied by Campbell et al. (2021), from observations performed on May 2019. A 3 3 scan () of quiet Sun inter-network regions, very close to the disk center, was used for the observations. Their analysis is based on five spectral absorption lines, including Fe i 15648.52 Å and Fe i 15652.87 Å.
On September 2019, a 3 3 scan () over the lead pore of active region 12748, was conducted by Nelson et al. (2021) to study the line-of-sight magnetic field strength in pores. Their research is mostly based on a GRIS/IFU time-series observations of Fe i 15648.52 Å and Fe i 15652.87 Å spectral lines, with a cadence of 67 s.
4 Conclusions
An IFU was designed and successfully commissioned on the GRIS spectrograph installed at the GREGOR solar telescope of the Observatorio del Teide (Tenerife). The IFU, based on image slicers, opens up new possibilities for NIR observations of fast-evolving features in the Sun. It has very good optical quality with low straylight, and gives unique performance, allowing faster small-area scans than a traditional slit spectropolarimeter.
Based on the success of the first campaigns, the IFU has been offered to all observers who can be granted telescope observing time. So far, more than two years of operations have been completed and more than 15 teams of scientists have observed with this instrument. The response of observers has been very positive in terms of both feedback comments and the high demand for the instrument. The first scientific results of observations with the IFU are beginning to be published.
Acknowledgments
This work was carried out with the funding of the Projects SOLARNET (FP7; funded by the European Commission’s 7th Framework Program under grant agreement no. 312495), GREST (funded by the European Commission’s H2020 Program under grant agreement no. 653982) and SOLARNET (H2020; funded by the European Commission’s H2020 Program under grant agreement no. 824135). SDO data are provided by the Joint Science Operations Center-Science Data Processing.
The 1.5 m GREGOR solar telescope was built by a German consortium under the leadership of the Leibniz-Institut für Sonnenphysik in Freiburg with the Leibniz-Institut für Astrophysik Potsdam, the Institut für Astrophysik Göttingen, and the Max-Planck-Institut für Sonnensystemforschung in Göttingen as partners, and with contributions by the Instituto de Astrofísica de Canarias and the Astronomical Institute of the Academy of Sciences of the Czech Republic.
Preprint of an article submitted for consideration in Journal of Astronomical Instrumentation © 2022 [copyright World Scientific Publishing Company] https://doi.org/10.1142/S2251171722500143
References
- Anan et al. (2021) Anan, T., Schad, T. A., Kitai, R., Dima, G. I., Jaeggli, S. A., Tarr, L. A., Collados, M., Dominguez-Tagle, C. & Kleint, L. [2021] Astrophysical Journal 921, 39, 10.3847/1538-4357/ac1b9c.
- Bowen (1938) Bowen, I. S. [1938] Astrophysical Journal 88, 113, 10.1086/143964.
- Calcines et al. (2013a) Calcines, A., Lopez, R. L. & Collados, M. [2013a] Journal of Astronomical Instrumentation 2, 1350007, 10.1142/S2251171713500074.
- Calcines et al. (2013b) Calcines, A., Lopez, R. L. & Collados, M. [2013b] Journal of Astronomical Instrumentation 2, 1350009, 10.1142/S2251171713500098.
- Calcines et al. (2014) Calcines, A., Lopez, R. L., Collados, M. & Vega Reyes, N. [2014] “MuSICa image slicer prototype at 1.5-m GREGOR solar telescope,” Ground-based and Airborne Instrumentation for Astronomy V, eds. Ramsay, S. K., McLean, I. S. & Takami, H., p. 91473I, 10.1117/12.2053577.
- Campbell et al. (2021) Campbell, R. J., Mathioudakis, M., Collados, M., Keys, P. H., Asensio Ramos, A., Nelson, C. J., Kuridze, D. & Reid, A. [2021] Astronomy and Astrophysics 647, A182, 10.1051/0004-6361/202040028.
- Cao et al. (2012) Cao, W., Goode, P. R., Ahn, K., Gorceix, N., Schmidt, W. & Lin, H. [2012] “NIRIS: The Second Generation Near-Infrared Imaging Spectro-polarimeter for the 1.6 Meter New Solar Telescope,” Second ATST-EAST Meeting: Magnetic Fields from the Photosphere to the Corona., eds. Rimmele, T. R., Tritschler, A., Wöger, F., Collados Vera, M., Socas-Navarro, H., Schlichenmaier, R., Carlsson, M., Berger, T., Cadavid, A., Gilbert, P. R., Goode, P. R. & Knölker, M., p. 291.
- Collados (1999) Collados, M. [1999] “High Resolution Spectropolarimetry and Magnetography,” Third Advances in Solar Physics Euroconference: Magnetic Fields and Oscillations, eds. Schmieder, B., Hofmann, A. & Staude, J., p. 3.
- Collados (2003) Collados, M. [2003] “Stokes polarimeters in the near-infrared,” Polarimetry in Astronomy, ed. Fineschi, S., p. 55, 10.1117/12.459370.
- Collados et al. (2007) Collados, M., Lagg, A., Diaz Garcia, J. J., Hernandez Suarez, E., Lopez Lopez, R., Paez, E. & Solanki, S. K. [2007] “Tenerife Infrared Polarimeter II,” The Physics of Chromospheric Plasmas, eds. Heinzel, P., Dorotovič, I. & Rutten, R. J., p. 611.
- Collados et al. (2012) Collados, M., Lopez, R., Paez, E., Hernandez, E., Reyes, M., Calcines, A., Ballesteros, E., Diaz, J. J., Denker, C., Lagg, A., Schlichenmaier, R., Schmidt, W., Solanki, S. K., Strassmeier, K. G., von der Luhe, O. & Volkmer, R. [2012] Astronomische Nachrichten 333, 872, 10.1002/asna.201211738.
- Content (1997) Content, R. [1997] “New design for integral field spectroscopy with 8-m telescopes,” Optical Telescopes of Today and Tomorrow, ed. Ardeberg, A. L., p. 1295, 10.1117/12.269020.
- Dominguez-Tagle et al. (2018) Dominguez-Tagle, C., Collados, M., Esteves, M. A., Vega Reyes, N., Vaz Cedillo, J. J., Lopez, R. L., Paez, E., Grassin, O. & Gracia, F. [2018] “Commissioning tests of an Integral Field Unit (IFU) at GREGOR solar telescope,” Ground-based and Airborne Instrumentation for Astronomy VII, eds. Evans, C. J., Simard, L. & Takami, H., p. 107022I, 10.1117/12.2312525.
- Esteves et al. (2018) Esteves, M. A., Dominguez-Tagle, C., Vaz Cedillo, J. J., Grassin, O., Vega Reyes, N., Gracia Temich, F. & Collados Vera, M. [2018] “Development of a field-of-view scanning system (FoV-SS): test results and lessons learned,” Advances in Optical and Mechanical Technologies for Telescopes and Instrumentation III, eds. Navarro, R. & Geyl, R., p. 107066I, 10.1117/12.2313385.
- Hofmann et al. (2012) Hofmann, A., Arlt, K., Balthasar, H., Bauer, S. M., Bittner, W., Paschke, J., Popow, E., Rendtel, J., Soltau, D. & Waldmann, T. [2012] Astronomische Nachrichten 333, 854, 10.1002/asna.201211733.
- Iglesias & Feller (2019) Iglesias, F. A. & Feller, A. [2019] Optical Engineering 58, 082417, 10.1117/1.OE.58.8.082417.
- Jaeggli (2022) Jaeggli, S. A. [2022] “The DKIST diffraction-limited near-infrared spectro polarimeter,” In preparation.
- Jaeggli et al. (2010) Jaeggli, S. A., Lin, H., Mickey, D. L., Kuhn, J. R., Hegwer, S. L., Rimmele, T. R. & Penn, M. J. [2010] Memorie della Societa Astronomica Italiana 81, 763.
- Kaithakkal et al. (2020) Kaithakkal, A. J., Borrero, J. M., Fischer, C. E., Dominguez-Tagle, C. & Collados, M. [2020] Astronomy and Astrophysics 634, A131, 10.1051/0004-6361/201936941.
- Löfdahl (2002) Löfdahl, M. G. [2002] “Multi-frame blind deconvolution with linear equality constraints,” Image Reconstruction from Incomplete Data, eds. Bones, P. J., Fiddy, M. A. & Millane, R. P., p. 146, 10.1117/12.451791.
- Nelson et al. (2021) Nelson, C. J., Campbell, R. J. & Mathioudakis, M. [2021] Astronomy and Astrophysics 654, A50, 10.1051/0004-6361/202141368.
- Schmidt et al. (2012) Schmidt, W., von der Lühe, O., Volkmer, R., Denker, C., Solanki, S. K., Balthasar, H., Bello Gonzalez, N., Berkefeld, T., Collados, M., Fischer, A., Halbgewachs, C., Heidecke, F., Hofmann, A., Kneer, F., Lagg, A., Nicklas, H., Popow, E., Puschmann, K. G., Schmidt, D., Sigwarth, M., Sobotka, M., Soltau, D., Staude, J., Strassmeier, K. G. & Waldmann , T. A. [2012] Astronomische Nachrichten 333, 796, 10.1002/asna.201211725.
- Socas-Navarro et al. (2006) Socas-Navarro, H., Elmore, D., Pietarila, A., Darnell, A., Lites, B. W., Tomczyk, S. & Hegwer, S. [2006] Solar Physics 235, 55, 10.1007/s11207-006-0020-x.
- Vega-Reyes et al. (2016) Vega-Reyes, N., Esteves, M. A., Sanchez-Capuchino, J., Salaun, Y., Lopez, R. L., Gracia, F., Herrera, P. E., Grivel, C., Cedillo, J. J. V. & Collados, M. [2016] “Opto-mechanical design of an image slicer for the GRIS spectrograph at GREGOR,” Advances in Optical and Mechanical Technologies for Telescopes and Instrumentation II, eds. Navarro, R. & Burge, J. H., International Society for Optics and Photonics (SPIE), p. 1702 , 10.1117/12.2232615, URL https://doi.org/10.1117/12.2232615.