The hadronic nucleus-nucleus cross section and the nucleon size
Abstract
Even though the total hadronic nucleus-nucleus cross section is among the most fundamental observables, it has only recently been measured precisely for lead-lead collisions at the LHC. This measurement implies the nucleon width should be below 0.7 fm, which is in contradiction with all known state-of-the-art Bayesian estimates. We study the implications of the smaller nucleon width on quark-gluon plasma properties such as the bulk viscosity. The smaller nucleon width dramatically improves the description of several triple-differential observables.
Introduction - The understanding of the creation quark-gluon plasma (QGP) as created at colliders such as the Large Hadron Collider (LHC) in Geneva requires the understanding of several stages of the collision of heavy ions Heinz and Snellings (2013); Busza et al. (2018). The first stage is far-from-equilibrium and involves an initial condition together with an understanding how this evolves towards a hydrodynamic QGP Berges et al. (2021). Secondly, there is a hydrodynamic stage, which involves understanding the temperature-dependent transport coefficients such as the shear viscosity Romatschke and Romatschke (2019). Lastly, the QGP undergoes particlization into a gas of interacting hadrons which can then be detected experimentally.
Relatively little is known about the initial stage and many analyses use a phenomenological parameterization called the TRENTo model Moreland et al. (2015). Here a heavy ion is composed of a superposition of nucleons with Gaussian distributions of energy of width , while fixing the interaction rate to fit the hadronic nucleon-nucleon cross section determined from collisions. Hence, interactions of nucleons with smaller depend strongly on the impact parameter, while large nucleons do not always interact even if they collide at zero impact parameter. Interestingly, all recent state-of-the-art global analyses of a wide variety of experimental data have preferred a large nucleon width in fm of Moreland et al. (2020), Bernhard et al. (2019), Nijs et al. (2021a), Everett et al. (2021) or Nijs and van der Schee (2021). Since equals the Gaussian width this implies that the resulting energy profile is then much larger than the proton charge radius of fm Pohl et al. (2010), or the radius implied by mb in the black disk approximation (fm).
In this Letter we show that the recent ALICE measurement of the PbPb total hadronic cross section of b at TeV ALICE (2022) implies a nucleon width smaller than approximately fm, which is smaller than the width from all quoted Bayesian estimates. This measurement hence raises two important questions. First, why did the Bayesian probability estimates not result in the correct nucleon width? Second, what are the implications of this smaller nucleon width? Part of the answer to the first question must be an inaccurate estimate of the systematic uncertainty covariance matrix. Here we note that the covariance matrix does not only include the systematic and statistical experimental and theoretical uncertainties, but it is essential to also include correlations or anti-correlations between observables. For the second question, the smaller nucleon width implies a larger bulk viscosity. Finally, we will show the improved analysis implies a better description of statistically difficult triple-differential observables.
The initial condition and the cross section - All computations of start with the Monte Carlo Glauber model Alver et al. (2008); Loizides et al. (2015, 2018); d’Enterria and Loizides (2021). In this model nucleons are placed randomly according to a Woods-Saxon distribution, , specified by the half-density radius and the diffusivity with potentially the requirement of a minimum nucleon-nucleon distance . In the current implementation the parameters and follow the point density distributions that are determined separately for protons and neutrons using electron-ion scattering experiments Klos et al. (2007); Tarbert et al. (2014); Loizides et al. (2018). is then determined by the condition that at least a single nucleon-nucleon interaction occurs.
In the black disk approximation nucleons interact if their distance satisfies , with the nucleon-nucleon cross section as determined from collisions at the same collision energy. In Pythia 8 a normalized overlap function is specified as a function of the impact parameter as with the nucleon width and for the Monash tune Skands et al. (2014); d’Enterria and Loizides (2021). In this work we will use the TRENTo model Moreland et al. (2015), which uses a Gaussian overlap function () and the nucleon width as a parameter. Nucleons then interact with probability , whereby is determined by . In this work we use nucleons that are composed of smaller constituents (as in Moreland et al. (2020)); we verified that this does not affect .
It is no surprise that the (traditionally used) black-disk approximation produces the smallest . Indeed, all models by construction have an equal nucleon-nucleon cross section, but wider overlap functions allow a nucleon-nucleon interaction to occur more easily for a nucleus-nucleus collision at relatively large impact parameter.
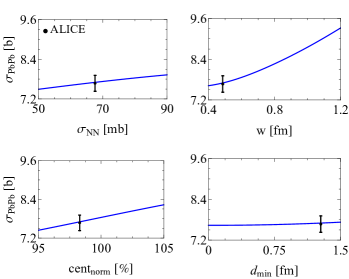
In Fig. 1 we see that can increase up to 23% for as large as fm. Perhaps surprisingly, the dependence on is fairly mild, and in this work we will keep the measured value of and mb for 2.76 and 5.02 TeV collisions respectively Loizides et al. (2018). We also observe an almost negligible dependence on . The cross section depends linearly on the centrality normalization Nijs and van der Schee (2021), e.g. on which events to count as a collision (as in the models above), or experimentally on how many collisions are recorded. Both theoretically and experimentally this contains an uncertainty, which we include as a separate parameter in Fig. 1 (bottom-left). Motivated by ALICE (2022) we give this parameter a prior probability distribution for our Bayesian analysis of a Gaussian with unit width. We note that this parameter propagates into a significant uncertainty mainly for peripheral spectra and multiplicities, but also for more central elliptic flow coefficients.
Crucially, only depends sensitively on , and the centrality normalization, whereby the latter two are well constrained experimentally. A measurement of hence provides robust constraints on with only weak theoretical modelling uncertainties. The recently measured value of b implies fm (see Fig. 1), which as noted in the introduction is in direct contradiction with all state-of-the-art global analyses of heavy ion collisions so far.
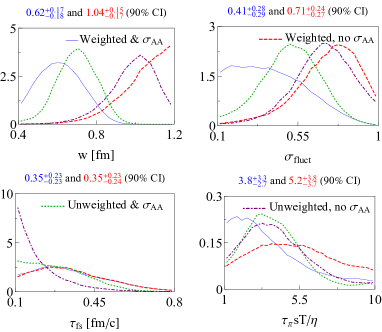
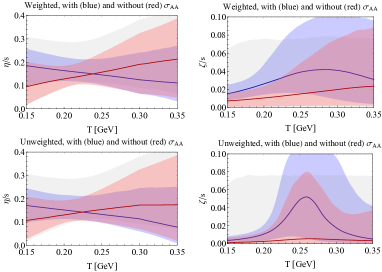
Implications for QGP properties - Fig. 2 shows the posterior parameter analysis for the width , the TRENTo fluctuation parameter , the free streaming time and the second order hydro relaxation time when including (green dotted) or excluding (purple dot-dashed) . This is the result of a global analysis of 653 experimental data points Aamodt et al. (2011); Adam et al. (2016a, b); Acharya et al. (2019, 2020); Abelev et al. (2013, 2014a); Acharya et al. (2018a); Adam et al. (2016c); Acharya et al. (2018b); ALICE (2022); Khachatryan et al. (2016) (see also the Supplemental Material) with a 21-dimensional parameter space within the publicly available Trajectum 1.3 framework tra similar to Nijs et al. (2021a, b); Nijs and van der Schee (2021), but full details will be presented elsewhere Nijs and van der Schee . The analysis with also includes the proton-lead cross section collisions at TeV of b as measured earlier by CMS Khachatryan et al. (2016). It is striking that adding two experimental observations ( for PbPb ALICE (2022) and Pb at 5.02 TeV Abelev et al. (2014b); Khachatryan et al. (2016)) has such a strong effect on these parameters.
Nevertheless, we see that the nucleon width is still not quite compatible with the value required from the measurement (the green dotted is peaked around fm). This is consistent with the previous Bayesian analyses that strongly prefer larger widths and hence a Bayesian updated estimate now reduces the width, but not all the way to be compatible. Given the theoretical robustness of the comparison this remaining discrepancy has to be taken seriously. A crude way would be to fix fm by hand or to use a prior distribution close to this value. A more quantitative approach is to give higher weights to observables we have a higher trust in on physical grounds, which is what we will attempt in this work.
| [b] | [b] | |
|---|---|---|
| & weights | ||
| weights | ||
| neither | ||
| ALICE/CMS |
Alternatively, we could say that the inconsistency of the nucleon width before and after implies that we underestimated the systematic uncertainties. By far the best way would be to update those uncertainties, importantly including all (anti-)correlations between all observables. In the current analysis data points from nearby bins are treated as correlated (see also Bernhard (2018)), although even here there is a certain level of arbitrariness. Moreover, there are theoretical uncertainties from e.g. particlization that are even in principle hard to quantify. Inaccurate estimates of correlations can cause the affected class of observables to be given too much or too little relative importance in the Bayesian analysis. The weighting is a way to modify the relative importance of observable classes and hence correct for this effect. This interpretation of extra uncertainty is more applicable to the theoretical uncertainty (where model uncertainties are hard to estimate), but we stress that even experimentally it is often not clear how all systematic uncertainties are correlated among observables.
As mentioned we highly trust on grounds that it is relatively model independent theoretically and in fact only strongly depends on the nucleon width. Weaker but similar arguments can be made for integrated unidentified observables, such as integrated multiplicities, mean transverse momentum and integrated ansiotropic flow coefficients . Particle identified observables are theoretically more difficult to model and here we assign a weight . We define the weight to mean that we multiply the difference in an observable between theory and experiment by . Note that this preserves the correlation matrix. Also transverse momentum () differential observables are more model-dependent, especially at larger , and similar arguments can be made for observables in peripheral centrality classes. We hence chose to weight -differential observables by an extra factor 1/2 and as well as an extra factor of if GeV. We also multiply the weight for any observable by if the centrality class is beyond 50%.
The posteriors including the weights are shown in Fig. 2 as blue solid (with ) and red dashed (without ) curves. Indeed by using lower weights for more model-dependent observables, we see the nucleon width is in agreement with the estimate from . Also clear is that as expected the lower weights decrease the precision of the posterior parameter determination, which is especially clear for and . As shown in Table 1 both including and including weights improves the theoretical postdiction of so that the agreement is within 1.1 (weighted) or 1.7 (unweighted) standard deviations from the ALICE result for PbPb and 1.5 and 1.9 standard deviations from the CMS result for Pb.
In Fig. 3 we show the temperature dependent specific shear and bulk viscosities, and including (blue) and without (red). Given the smaller nucleon width we expect a larger bulk and shear viscosity to reduce the average radial and elliptic flow that is induced by the larger radial gradient. This is indeed what is observed.
The nucleon width and observables - After showing the updated QGP properties an important question remains. Why do analyses without favor a large nucleon width, and is there an inconsistency given that the nucleon width is small? To answer this question Table 2 shows per class of observables the average discrepancy with the experimental result. Naturally, including the dramatically improves the agreement with the postdiction. What is however perhaps surprising is that the fit of the other observable classes only worsens mildly, on average worsening from 0.83 to 0.89 standard deviations for the weighted case. Virtually all observables get slightly worse, with the notable exception of the mean fluctuations. Naturally, in the weighted case the observables with a lower weight have a worse agreement, which was precisely the motivation for introducing the weights. We note that these deviations do not trivially translate into a value, since many observables are highly correlated (see also Bernhard (2018)). A more complete overview of the match of all observables is presented in the Supplemental Material, where indeed by eye it is difficult to see the difference between the fit with and without .
| & | neither | ||||
|---|---|---|---|---|---|
| 0.55 | 0.60 | 1.23 | 1.22 | 1.00 | |
| 0.76 | 0.70 | 0.60 | 0.57 | 0.48 | |
| 1.59 | 1.51 | 0.82 | 0.77 | 0.48 | |
| 0.66 | 0.60 | 0.88 | 0.72 | 0.46 | |
| 0.56 | 0.62 | 0.51 | 0.58 | 0.49 | |
| 0.58 | 0.51 | 0.54 | 0.49 | 1.00 | |
| 1.19 | 1.07 | 0.86 | 0.92 | 0.20 | |
| 1.41 | 1.27 | 0.79 | 0.73 | 0.20 | |
| 1.35 | 1.21 | 0.73 | 0.67 | 0.25 | |
| 0.81 | 0.74 | 0.46 | 0.44 | 0.19 | |
| 0.92 | 0.89 | 0.55 | 0.55 | 0.19 | |
| 0.49 | 0.47 | 0.34 | 0.35 | 0.25 | |
| 0.65 | 0.57 | 0.69 | 0.57 | 0.24 | |
| average | 0.89 | 0.83 | 0.69 | 0.66 | |
| 1.13 | 3.80 | 1.53 | 3.40 | 1.00 |
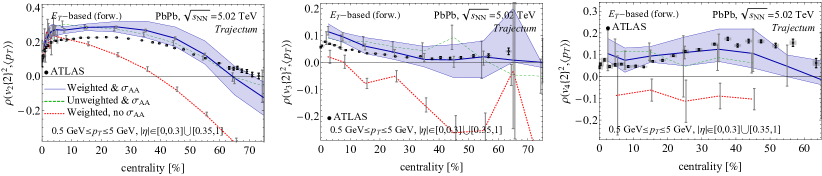
An excellent test of our model is provided by the triple-differential observable , which measures the correlation between anisotropic flow and the mean Bozek (2016); Bozek and Mehrabpour (2020); Giacalone et al. (2021). This observable is statistically expensive to compute (we simulate 625k hydro events for 20 parameter settings from the posterior) and hence cannot be included in the Bayesian fit. It moreover sensitively depends on the precise experimental procedure, including cuts on pseudorapidity, cuts on transverse momentum and the method to select centrality bins ATLAS (2022). Nevertheless, the observable is conjectured to be sensitive only to the hydrodynamic initial conditions, and in particular the nucleon width Giacalone et al. (2022).
Fig. 4 presents as compared with ATLAS data ATLAS (2022). Due to the expensive nature of this analysis we only include systematic uncertainty from the posterior for the weighted case including and show Maximum a Posteriori (MAP) results for the unweighted with and weighed without cases. Clearly including dramatically improves the description of this observable, which can at least in part be attributed to the smaller nucleon width Giacalone et al. (2022). A comparison with ALICE data Acharya et al. (2021) is included in the Supplemental Material. Curiously the systematic uncertainty for XeXe collisions is significantly larger than for PbPb collisions (see also Supplemental Material).
Discussion - A question deserving further study is in what way our weighting procedure realistically captures the theoretical and experimental uncertainty. Indeed, systematic off-sets on average observables are within one standard deviation from the experimental results and a naive would say that the uncertainties are accurate (see also Table 2 and the Supplemental Material). This, however, ignores the fact that the 653 data points are highly correlated, which is difficult to fully take into account. Also, while observables are on average one standard deviation away from the experimental results, the deviations are not Gaussian. Instead most observables are well within one standard deviation, while a small number deviates significantly. This is a further indication that a naive should not be trusted. We hence believe the weighting leads to more physically realistic results, in particular giving a physically realistic , nucleon width and bulk viscosity.
On a superficial level the results in this Letter show that the newly measured improves estimates on the nucleon width, and subsequently the transport coefficients. We wish to caution here, however, that this fact should make us rethink the growing popularity of Bayesian analyses. Indeed, prior to this Letter all such analyses ruled out nucleon widths smaller than about 0.8 fm, which in light of this new analysis was not warranted. The question we should ask is if the data really convincingly implied such large nucleon widths? Small changes in many data points (often as small as 0.1 standard deviation) quickly add up to large Bayes factors that can artificially constrain posterior distributions.
In principle, given accurate estimates of the correlated uncertainties of the data and theoretical model the Bayes posterior is accurate. Note, however, that even underestimating uncertainties by 10% is enough to cause an otherwise good fit to now be off by about 0.1 standard deviation, which, if this occurs for many data points, will add up, and the Bayesian analysis will try to compensate for this elsewhere. In a sense this means that the robustness of the Bayesian posterior depends sensitively on the accuracy of the uncertainty. We stress that the hardest part is to accurately estimate the theoretical model uncertainty. Currently this only includes emulation uncertainty, which can be sizeable but is not a physical uncertainty. Instead, many modelling choices such as our viscous particlization scheme (see Bernhard (2018)) or the particulars of the hadronic afterburner have uncertainties that are not included in the analysis. In fact, the full modeling uncertainty is difficult to quantify, though we note that the versatility of our 21-dimensional model attempts to include a wide scope of theoretical uncertainties.
It is perhaps curious that an early Bayesian study found a smaller width of Bernhard et al. (2016). As noted in Bernhard (2018), however, this is mostly due to having a simplistic initial stage where no radial flow is created during the first fm and due to ignoring bulk viscous corrections during particlization. This earlier value is hence mostly a feature of the model being simplified, albeit in hindsight it got a reasonable nucleon width estimate (but for the wrong reason).
Another relevant comment not included in this study can be that the nucleon width could depend on their position within the nucleus. It is not so unreasonable that nucleons in the skin of the nucleus could be smaller than nucleons in the center. The size of nucleons in the center would not significantly affect the nucleus-nucleus cross section.
A smaller nucleon width is consistent with other analyses, in particular including the IP-Glasma model Schenke et al. (2012); Mäntysaari and Schenke (2016a, b). Indeed, the IP-Glasma model is based on HERA data, which extracts a transverse two-gluon radius from scattering of fm Caldwell and Kowalski (2010). Ref. Giacalone et al. (2022) argues that the characteristic nucleon length scale should be of order fm or smaller, although this can refer to the nucleon width or the constituent width. Since is uniquely sensitive to the nucleon width the combination of these measurements leads to a unique characterization of the nucleon spatial profile.
Acknowledgements - We thank Somadutta Bhatta, Andrea Dainese, Giuliano Giacalone, Constantin Loizides, Aleksas Mazeliauskas, Rosi Reed, Mike Sas, Urs Wiedemann and You Zhou for interesting discussions.
References
- Heinz and Snellings (2013) U. Heinz and R. Snellings, Ann. Rev. Nucl. Part. Sci. 63, 123 (2013), arXiv:1301.2826 [nucl-th] .
- Busza et al. (2018) W. Busza, K. Rajagopal, and W. van der Schee, Ann. Rev. Nucl. Part. Sci. 68, 339 (2018), arXiv:1802.04801 [hep-ph] .
- Berges et al. (2021) J. Berges, M. P. Heller, A. Mazeliauskas, and R. Venugopalan, Rev. Mod. Phys. 93, 035003 (2021), arXiv:2005.12299 [hep-th] .
- Romatschke and Romatschke (2019) P. Romatschke and U. Romatschke, Relativistic Fluid Dynamics In and Out of Equilibrium, Cambridge Monographs on Mathematical Physics (Cambridge University Press, 2019) arXiv:1712.05815 [nucl-th] .
- Moreland et al. (2015) J. S. Moreland, J. E. Bernhard, and S. A. Bass, Phys. Rev. C 92, 011901 (2015), arXiv:1412.4708 [nucl-th] .
- Moreland et al. (2020) J. S. Moreland, J. E. Bernhard, and S. A. Bass, Phys. Rev. C 101, 024911 (2020), arXiv:1808.02106 [nucl-th] .
- Bernhard et al. (2019) J. E. Bernhard, J. S. Moreland, and S. A. Bass, Nature Phys. 15, 1113 (2019).
- Nijs et al. (2021a) G. Nijs, W. van der Schee, U. Gürsoy, and R. Snellings, Phys. Rev. Lett. 126, 202301 (2021a), arXiv:2010.15130 [nucl-th] .
- Everett et al. (2021) D. Everett et al. (JETSCAPE), Phys. Rev. C 103, 054904 (2021), arXiv:2011.01430 [hep-ph] .
- Nijs and van der Schee (2021) G. Nijs and W. van der Schee, (2021), arXiv:2110.13153 [nucl-th] .
- Pohl et al. (2010) R. Pohl et al., Nature 466, 213 (2010).
- ALICE (2022) ALICE, (2022), arXiv:2204.10148 [nucl-ex] .
- Alver et al. (2008) B. Alver, M. Baker, C. Loizides, and P. Steinberg, (2008), arXiv:0805.4411 [nucl-ex] .
- Loizides et al. (2015) C. Loizides, J. Nagle, and P. Steinberg, SoftwareX 1-2, 13 (2015), arXiv:1408.2549 [nucl-ex] .
- Loizides et al. (2018) C. Loizides, J. Kamin, and D. d’Enterria, Phys. Rev. C 97, 054910 (2018), [Erratum: Phys.Rev.C 99, 019901 (2019)], arXiv:1710.07098 [nucl-ex] .
- d’Enterria and Loizides (2021) D. d’Enterria and C. Loizides, Ann. Rev. Nucl. Part. Sci. 71, 315 (2021), arXiv:2011.14909 [hep-ph] .
- Klos et al. (2007) B. Klos et al., Phys. Rev. C 76, 014311 (2007), arXiv:nucl-ex/0702016 .
- Tarbert et al. (2014) C. M. Tarbert et al., Phys. Rev. Lett. 112, 242502 (2014), arXiv:1311.0168 [nucl-ex] .
- Skands et al. (2014) P. Skands, S. Carrazza, and J. Rojo, Eur. Phys. J. C 74, 3024 (2014), arXiv:1404.5630 [hep-ph] .
- Aamodt et al. (2011) K. Aamodt et al. (ALICE), Phys. Rev. Lett. 106, 032301 (2011), arXiv:1012.1657 [nucl-ex] .
- Adam et al. (2016a) J. Adam et al. (ALICE), Phys. Rev. Lett. 116, 222302 (2016a), arXiv:1512.06104 [nucl-ex] .
- Adam et al. (2016b) J. Adam et al. (ALICE), Phys. Rev. C 94, 034903 (2016b), arXiv:1603.04775 [nucl-ex] .
- Acharya et al. (2019) S. Acharya et al. (ALICE), Phys. Lett. B 793, 420 (2019), arXiv:1805.05212 [nucl-ex] .
- Acharya et al. (2020) S. Acharya et al. (ALICE), Phys. Rev. C 101, 044907 (2020), arXiv:1910.07678 [nucl-ex] .
- Abelev et al. (2013) B. Abelev et al. (ALICE), Phys. Rev. C 88, 044910 (2013), arXiv:1303.0737 [hep-ex] .
- Abelev et al. (2014a) B. B. Abelev et al. (ALICE), Eur. Phys. J. C 74, 3077 (2014a), arXiv:1407.5530 [nucl-ex] .
- Acharya et al. (2018a) S. Acharya et al. (ALICE), JHEP 07, 103 (2018a), arXiv:1804.02944 [nucl-ex] .
- Adam et al. (2016c) J. Adam et al. (ALICE), JHEP 09, 164 (2016c), arXiv:1606.06057 [nucl-ex] .
- Acharya et al. (2018b) S. Acharya et al. (ALICE), JHEP 09, 006 (2018b), arXiv:1805.04390 [nucl-ex] .
- Khachatryan et al. (2016) V. Khachatryan et al. (CMS), Phys. Lett. B 759, 641 (2016), arXiv:1509.03893 [hep-ex] .
- (31) https://sites.google.com/view/govertnijs/trajectum.
- Nijs et al. (2021b) G. Nijs, W. van der Schee, U. Gürsoy, and R. Snellings, Phys. Rev. C 103, 054909 (2021b), arXiv:2010.15134 [nucl-th] .
- (33) G. Nijs and W. van der Schee, arXiv:220x.xxxxx [nucl-th] .
- Abelev et al. (2014b) B. B. Abelev et al. (ALICE), JINST 9, P11003 (2014b), arXiv:1405.1849 [nucl-ex] .
- ATLAS (2022) ATLAS, (2022), arXiv:2205.00039 [nucl-ex] .
- Bernhard (2018) J. E. Bernhard, Bayesian parameter estimation for relativistic heavy-ion collisions, Ph.D. thesis, Duke U. (2018), arXiv:1804.06469 [nucl-th] .
- Bozek (2016) P. Bozek, Phys. Rev. C 93, 044908 (2016), arXiv:1601.04513 [nucl-th] .
- Bozek and Mehrabpour (2020) P. Bozek and H. Mehrabpour, Phys. Rev. C 101, 064902 (2020), arXiv:2002.08832 [nucl-th] .
- Giacalone et al. (2021) G. Giacalone, F. G. Gardim, J. Noronha-Hostler, and J.-Y. Ollitrault, Phys. Rev. C 103, 024909 (2021), arXiv:2004.01765 [nucl-th] .
- Giacalone et al. (2022) G. Giacalone, B. Schenke, and C. Shen, Phys. Rev. Lett. 128, 042301 (2022), arXiv:2111.02908 [nucl-th] .
- Acharya et al. (2021) S. Acharya et al. (ALICE), (2021), arXiv:2111.06106 [nucl-ex] .
- Bernhard et al. (2016) J. E. Bernhard, J. S. Moreland, S. A. Bass, J. Liu, and U. Heinz, Phys. Rev. C 94, 024907 (2016), arXiv:1605.03954 [nucl-th] .
- Schenke et al. (2012) B. Schenke, P. Tribedy, and R. Venugopalan, Phys. Rev. C 86, 034908 (2012), arXiv:1206.6805 [hep-ph] .
- Mäntysaari and Schenke (2016a) H. Mäntysaari and B. Schenke, Phys. Rev. Lett. 117, 052301 (2016a), arXiv:1603.04349 [hep-ph] .
- Mäntysaari and Schenke (2016b) H. Mäntysaari and B. Schenke, Phys. Rev. D 94, 034042 (2016b), arXiv:1607.01711 [hep-ph] .
- Caldwell and Kowalski (2010) A. Caldwell and H. Kowalski, Phys. Rev. C 81, 025203 (2010).
- Aaboud et al. (2020) M. Aaboud et al. (ATLAS), JHEP 01, 051 (2020), arXiv:1904.04808 [nucl-ex] .
I Supplemental Material
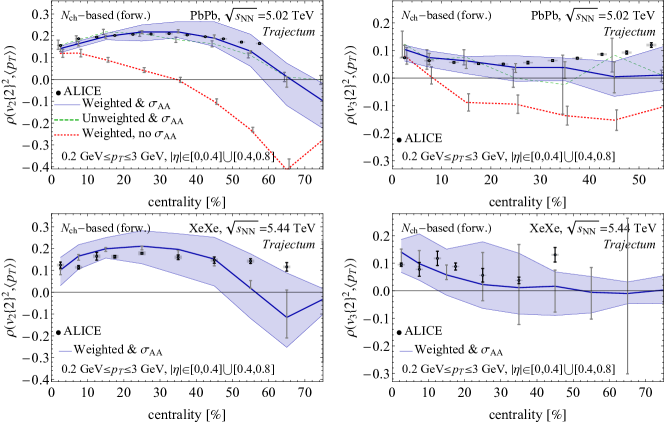
The observables depend sensitively on details such as kinematic cuts on the particles used to compute itself, and in addition to this also on which particles are used for the determination of centrality (offline tracks), and whether these offline tracks are weighted by their transverse energy or not. To illustrate this, in Fig. 5 (top) we show the results from our analysis for PbPb compared to ALICE data Acharya et al. (2021), which uses different kinematic cuts compared to ATLAS ATLAS (2022). ALICE also uses the forward V0 detectors which measure particle multiplicity, whereas ATLAS uses the forward FCal that measures the total transverse energy . One can see that the results from both of our fits which include the cross section are in good agreement with the ALICE data, while they are in slight tension with the ATLAS data, especially in the semi-central region (10–30%). Here we note that the ALICE and ATLAS data points are largely consistent despite their different experimental cuts (both give in the range 0.19–0.23 in this centrality region), whereas for Trajectum we find a significantly larger for the ATLAS experimental cuts.
Indeed, in Fig. 4 we find for a value in the 10–20% centrality class of 0.263, whereas for the ALICE comparison we compute only 0.197. In Trajectum this difference can be explained by the lower cut (lowering by 14%) and by the versus centrality selection (lowering by another 21%). We note that ATLAS also compared an versus comparison within its own dataset (Fig. 5 in ATLAS (2022)), but here it is essential that is at mid-rapidity and furthermore provides an inferior centrality selector than selecting on Aaboud et al. (2020). This complicates the comparison, as within Trajectum we find that a mid-rapidity centrality selection increases by 13%, which competes with the decrease due to versus selection such that in the end is about 7% lower for the mid-rapidity centrality selector (somewhat in tension with Fig. 5 of ATLAS (2022), but see also Aaboud et al. (2020)). Finally, on the other hand, the ATLAS measurement depends sensitively on the cut (Fig. 4 in ATLAS (2022)), by approximately the tension we find in Fig. 4, whereas in Trajectum we do not find any -cut dependence in (we however present the calculation in Fig. 4 for , since this is much cheaper to compute when simulating all 20 parameter settings).
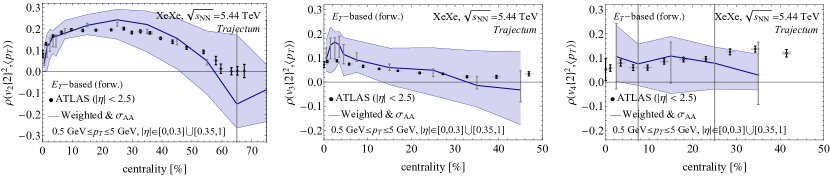
In Fig. 5 (bottom) and 6, we also show for XeXe collisions at TeV. The normalization of the profile at TeV is determined by assuming a power-law extrapoliation from the fits at 2.76 and TeV. We compare results with respectively ALICE Acharya et al. (2021) and ATLAS data ATLAS (2022). The comparison shows good agreement, even though in Trajectum for numerical convenience we use a smaller rapidity cut than ATLAS uses. We verified, however, for a single parameter setting that our boost invariant model does not depend on the rapidity cut. The ATLAS results depend significantly on the rapidity cut and since our MCMC fit is done using mid-rapidity experimental data from ALICE it is preferable to compare with mid-rapidity ATLAS data. For XeXe collisions these are however unfortunately not available and hence the comparison as shown. In the XeXe simulations we use a deformed Woods-Saxon distribution, where the radius is multiplied by , with spherical harmonics, , and . Comparing to the PbPb results, the systematic errors are considerably larger for XeXe, indicating that XeXe is more sensitive to the remaining uncertainty in the posterior parameters.
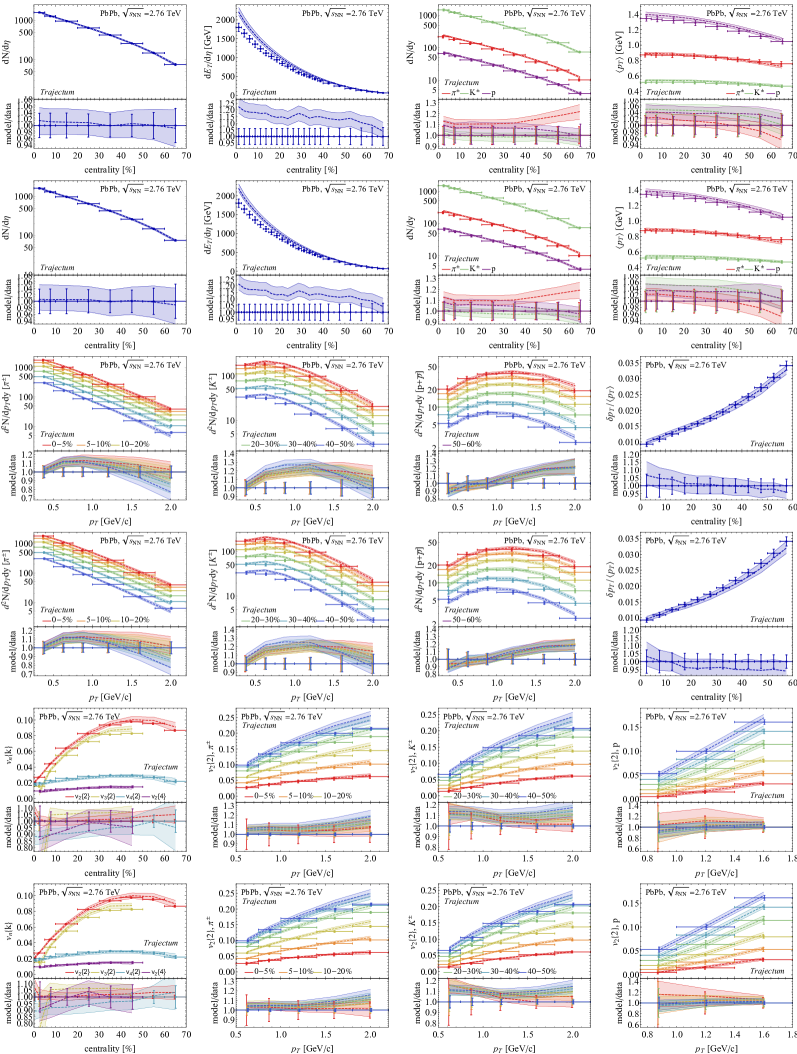
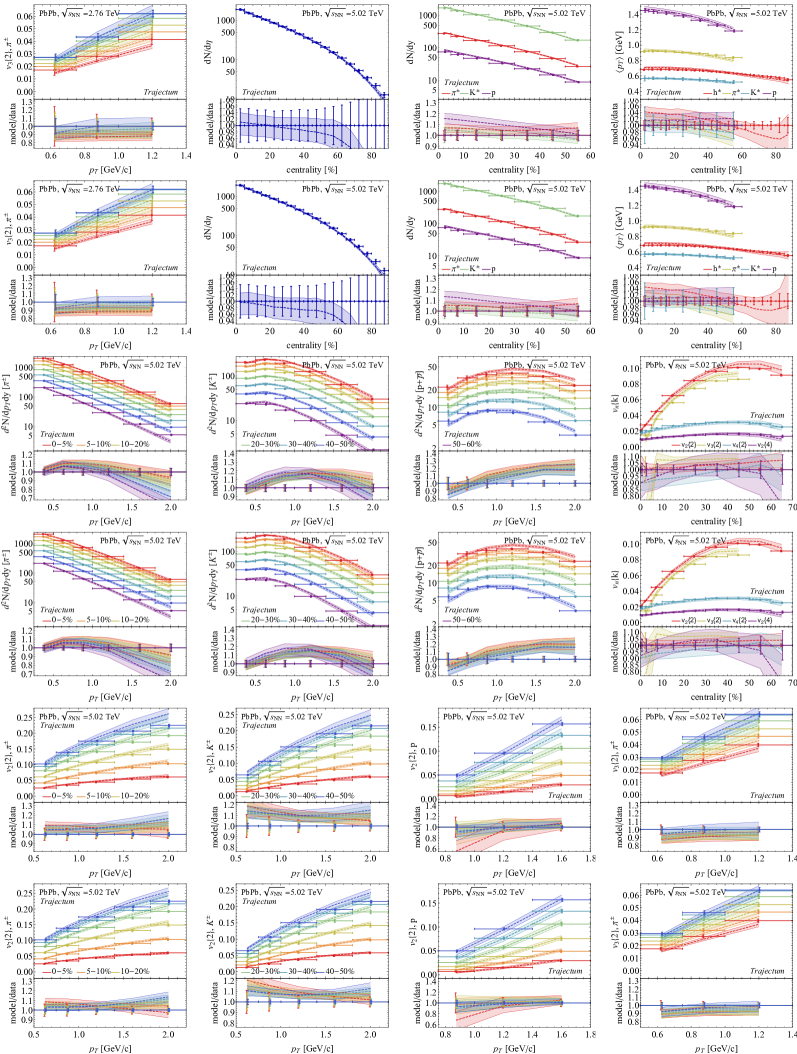
In Fig. 7 and 8 we show the experimental data points used together with the posterior distributions from the weighted fit including the new (odd rows) and without the mesaurement (even rows). In order of appearance (though 2.76 TeV always appears before 5.02 TeV collisions) we include charged particle multiplicity at 2.76 Aamodt et al. (2011) and 5.02 TeV Adam et al. (2016a) and transverse energy at 2.76 TeV Adam et al. (2016b). We also include identified yields and mean for pions, kaons and protons at 2.76 TeV Abelev et al. (2013) and 5.02 TeV Acharya et al. (2019, 2020). We then include identified transverse momentum spectra for pions, kaons and protons at 2.76 TeV Abelev et al. (2013) and 5.02 TeV Acharya et al. (2020) in seven coarse grained -bins with bin boundaries at . Next we show fluctuations, which are only available at 2.76 TeV Abelev et al. (2014a). Finally we show integrated charged particle anisotropic flow at 2.76 and 5.02 TeV Acharya et al. (2018a), as well as the -differential identified anisotropic flow coefficient for pions, kaons and protons, and for pions at 2.76 TeV Adam et al. (2016c) and 5.02 TeV Acharya et al. (2018b).