Jansky Very Large Array detections of CO(1–0) emission in Hi-absorption-selected galaxies at
Abstract
We report a Karl G. Jansky Very Large Array search for redshifted CO(1–0) emission from three Hi-absorption-selected galaxies at , identified earlier in their CO(3–2) or CO(4–3) emission. We detect CO(1–0) emission from DLA B1228-113 at and DLA J0918+1636 at ; these are the first detections of CO(1–0) emission in high- Hi-selected galaxies. We obtain high molecular gas masses, , for the two objects with CO(1–0) detections, which are a factor of lower than earlier estimates. We determine the excitation of the mid CO rotational levels relative to the level, rJ1, in Hi-selected galaxies for the first time, obtaining r and r for DLA J0918+1636, and r for DLA B1228-113. These values are consistent with thermal excitation of the levels. The excitation of the level in the Hi-selected galaxies is similar to that seen in massive main-sequence and sub-mm galaxies at , but higher than that in main-sequence galaxies at ; the higher excitation of the galaxies at is likely to be due to their higher star-formation rate (SFR) surface density. We use Hubble Space Telescope Wide Field Camera 3 imaging to detect the rest-frame near-ultraviolet emission of DLA B1228-113, obtaining an NUV SFR of yr-1, significantly lower than that obtained from the total infrared luminosity, indicating significant dust extinction in the galaxy.
1 Introduction
The highest Hi column density absorption systems in QSO spectra, the damped Lyman- absorbers (DLAs), arise from gas associated with high-redshift galaxies (e.g. Wolfe et al., 2005). Such absorbers provide a route to identifying high- galaxies without the luminosity bias that afflicts galaxy samples selected directly via their emission. Understanding the nature of these Hi-absorption-selected galaxies is critical for an unbiased understanding of galaxy evolution. Unfortunately, the proximity of the faint foreground galaxy to the bright background QSO has meant that, despite many studies, it has been difficult to even identify, let alone characterize, the high-, Hi-selected galaxies via optical imaging and spectroscopy (e.g. Fumagalli et al., 2015; Krogager et al., 2017).
Recently, the Atacama Large Millimeter/submillimeter Array (ALMA) and the NOrthern Extended Millimeter Array (NOEMA) has opened new windows on Hi-selected galaxies via their redshifted [Cii] 158m and CO emission. Besides the characterization of Hi-selected galaxies at intermediate redshifts, (e.g. Møller et al., 2018; Kanekar et al., 2018; Péroux et al., 2019; Klitsch et al., 2019), this has resulted in the identification of more than a dozen such galaxies at (Neeleman et al., 2018; Fynbo et al., 2018; Kanekar et al., 2020; Kaur et al., 2022) and (Neeleman et al., 2017, 2019). Perhaps the most remarkable results from these studies are the large impact parameters to the QSO sightline of the galaxies at (Neeleman et al., 2017, 2019), the high molecular gas masses of the galaxies at (Kanekar et al., 2020), and the identification of a cold, dusty, rotating disk at (Neeleman et al., 2020). Multi-wavelength observations are now under way to obtain a detailed understanding of these galaxies, by characterizing their stellar and gas properties, star-formation activity, etc (e.g. Prochaska et al., 2019; Kaur et al., 2021; Klitsch et al., 2022).
For the Hi-selected galaxies, the high inferred molecular gas masses, (Kanekar et al., 2020), were obtained from the CO(3–2) or CO(4–3) mid- rotational transitions. These estimates are based on two critical assumptions, sub-thermal excitation of the CO or level relative to the level, and the value of the CO-to-H2 conversion factor, (e.g. Tacconi et al., 2020). Direct observations of the CO(1–0) line are critical to remove the first of these assumptions, and obtain more accurate molecular gas mass estimates. Combining the CO(1–0) line luminosity with the luminosity in the higher- CO lines also allows one to determine the CO excitation and thus probe physical conditions in the molecular gas (e.g. Carilli & Walter, 2013). Indeed, studies in the local Universe have shown that the CO excitation is related to the value of : high-excitation galaxies like ultra-luminous infrared galaxies (ULIRGs) and QSO hosts have lower values [ (K km s-1 pc2)-1] than low-excitation objects like the Milky Way and nearby disk galaxies [ (K km s-1 pc2)-1; e.g. Bolatto et al., 2013].
At high redshifts, CO(1–0) studies have so far only been carried out in bright, emission-selected galaxies, mostly QSO hosts, sub-mm galaxies, lensed galaxies, and massive main-sequence galaxies (e.g. Aravena et al., 2014; Bolatto et al., 2015; Sharon et al., 2016; Riechers et al., 2020). In this Letter, we report the first detections of redshifted CO(1–0) emission from Hi-selected galaxies at , obtained with the Karl G. Jansky Very Large Array (JVLA)111We assume a flat -cold dark matter cosmology, with , , and H km s-1 Mpc-1 (Planck Collaboration, 2020).. We also report Hubble Space Telescope (HST) Wide Field Camera 3 (WFC3) imaging of the rest-frame near-ultraviolet continuum emission for one of the Hi-selected galaxies, which shows that the object is a dusty galaxy.
| DLA | Beam | ||||||||
|---|---|---|---|---|---|---|---|---|---|
| GHz | Jy/Beam | Jy km s-1 | K km s-1 pc2 | ||||||
| B0551-366 | 2.317 | 1.9622 | 1.9615 | 38.92 | 99 | ||||
| B1228-113 | 3.528 | 2.1929 | 2.1933 | 36.10 | 94 | ||||
| J0918+1636 | 3.096 | 2.5832 | 2.5848 | 32.15 | 57 |
2 Observations, Data Analysis, and Results
2.1 JVLA observations and data analysis
We used the JVLA Ka-band receivers in the D-array to search for redshifted CO(1–0) emission from the Hi-selected galaxies at towards QSO B0551-366, towards PKS B1228-113, and towards QSO J0918+1636 in 2019 November and December (Proposal ID: VLA/19B-271, PI: N. Kanekar). The three galaxies (hereafter, DLA B0551-366, DLA B1228-113 and DLA J0918+1636) had been earlier detected with ALMA in their CO(4–3) or CO(3–2) emission (Neeleman et al., 2018; Fynbo et al., 2018; Kanekar et al., 2020).
The JVLA observations used the WIDAR correlator in 8-bit mode, with two 1-GHz intermediate frequency (IF) bands, one covering the redshifted CO line frequency for the target galaxy, and two polarizations. Each IF band was divided into eight 128-MHz digital sub-bands, with each sub-band further divided into 512 and 128 channels, for line and off-line sub-bands, respectively. This yielded a velocity coverage of km s-1 for the sub-band covering the redshifted CO line frequency, albeit with lower sensitivity at the sub-band edges, and a raw velocity resolution of km s-1. Observations of the targets were interleaved with runs on nearby phase calibrators every 5 minutes; in addition, a standard flux calibrator was observed once in each session. The on-source times were hrs for the three galaxies.
All data were analysed in the Astronomical Image Processing System package (“classic” aips; Greisen, 2003), using standard procedures. After identifying and editing out malfunctioning antennas and any data affected by systematic errors, we used the calibrator data to determine the antenna-based complex gains and bandpass shapes. The gains and bandpasses were applied to the data for each target, and the calibrated target visibilities then split out into a new data set. For each target, the central channels of each sub-band of this data set were averaged together, and the resulting data sets were imaged to search for any continuum emission in each field. Although continuum emission was detected from two QSOs, only PKS B1228-113 was found to have a sufficient flux density for self-calibration. The self-calibration for PKS B1228-113 followed a standard iterative procedure, with multiple rounds of imaging and phase-only self-calibration, followed by amplitude-and-phase self-calibration and data editing, until neither the image nor the residual visibilities showed any improvement on further self-calibration. The improved complex gains for DLA B1228-113 were applied to the multi-channel data to produce the final calibrated data set for this field.
Next, for each target, the task uvsub was used to subtract out all continuum emission from the calibrated visibilities. The residual multi-channel visibility data sets were then imaged in the Common Astronomy Software Applications package (casa version 5.6; McMullin et al., 2007), using natural weighting in the barycentric frame, to produce spectral cubes at velocity resolutions of km s-1. The full-width-at-half-maximum (FWHM) of the JVLA synthesized beams is for the three targets, larger than the size of the ALMA CO emission (Kanekar et al., 2020); we hence do not expect any of the CO(1–0) emission to be resolved out in the JVLA images. For each galaxy, a CO(1–0) emission spectrum was extracted by taking a cut through its cube at the location of the ALMA CO emission. Finally, in the case of DLA B1228-113 and DLA J0918+1636, which showed detections of CO(1–0) emission at significance, we also made images of the CO emission, at velocity resolutions matched to the line FWHMs. The observational details and results are summarized in Table 1.
2.2 HST observations and data analysis
The HST WFC3 observations of DLA B1228-113 were carried out in late 2019 (PID: 15882; PI: Kanekar), using the F105W filter to cover the rest-frame NUV stellar continuum from the galaxy. A single orbit was obtained, using a WIDE-7 dither pattern increased by a factor of 3 over the pattern described in the Instrument Science Report (ISR 2016-14; Anderson, 2016), in order to obtain cleaner images by dithering over the size of the IR blobs.
The data were calibrated using the new IR filter-dependent sky flats (WFC3 ISR 2021-01; Mack et al., 2021). Image mosaics were made using AstroDrizzle (Hack et al., 2020), drizzling to a scale of pixel-1. TweakReg was used to astrometrically align the image to the GAIA DR2 catalog (Gaia Collaboration et al., 2018), yielding an absolute astrometric uncertainty of . The effective angular resolution of the HST WFC3 image is , based on a Gaussian fit to the point spread function (PSF) of the quasar.
2.3 Results
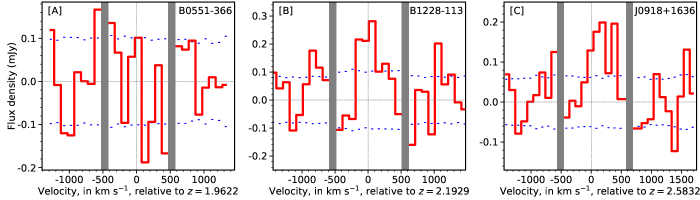
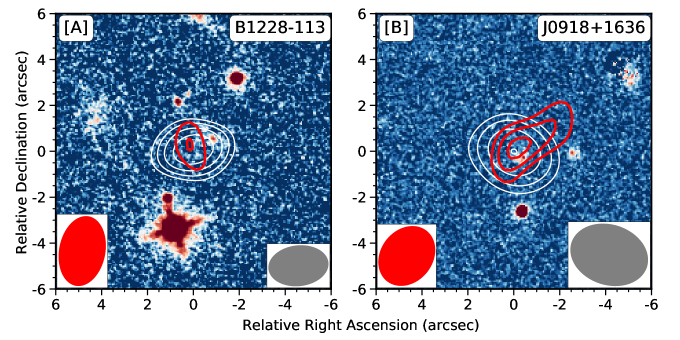
Our JVLA observations yielded detections of CO(1–0) emission at significance from the Hi-selected galaxies at towards PKS B1228-113 and towards QSO J0918+1636. We also obtained an upper limit to the CO(1–0) line luminosity for the galaxy towards QSO B0551-366. Fig. 1 shows the JVLA CO(1–0) spectra of the three Hi-selected galaxies, while Fig. 2 shows the CO(1–0) images of DLA B1228-113 and DLA J0918+1636 (in red contours), overlaid on the ALMA CO(3–2) images (white contours), and the HST WFC3 images (in colour; Fynbo et al., 2018, this work) of the two fields. For DLA B1228-113 and DLA J0918+1636, the detected CO(1–0) emission agrees in both position and velocity with the ALMA CO(3–2) emission. The measured velocity-integrated CO(1–0) line flux densities and inferred CO line luminosities for the three galaxies are listed in Table 1. Here, the upper limits for DLA B0551-366 assume that the CO(1–0) emission has an FWHM of 300 km s-1, equal to that of the CO(4–3) emission (Kanekar et al., 2020). The CO(1–0) line luminosities yield molecular gas masses of (DLA B1228-113), (DLA J0918+1636) and ( limit; DLA B0551-366), where we have assumed (K km s-1 pc (Bolatto et al., 2013; Tacconi et al., 2020).
Both DLA J0918+1636 and DLA B1228-113 are detected in HST rest-frame NUV imaging. The HST images of DLA J0918+1636 are presented and described in Fynbo et al. (2018), and yield a half-light radius of (Fynbo, private communication). In the case of DLA B1228-113, the rest-frame NUV emission is detected in our HST WFC3 F105W image (see Fig. 2[A]), at RA=12h30m55.44s, Dec.=-11∘3905.87, at an offset of 9 ( kpc) from the CO(3–2) emission. We emphasize that no rest-frame NUV emission is detected at the center of the CO emission (see the discussion in Section 3).
We obtained photometry of DLA B1228-113 using Source Extractor v.2.19.5 (Bertin & Arnouts, 1996), measuring the total flux using fluxauto, which gives the flux within an elliptical aperture with the Kron radius (Kron, 1980). This yielded an AB magnitude of , a half-light radius of , and a Kron radius of . To infer the SFR of the galaxy, we assume that it has a Chabrier initial mass function (Chabrier, 2003) and a flat spectrum in between rest-frame wavelengths of Å and Å (Kennicutt, 1998). Applying the local relation between rest-frame NUV Å luminosity and SFR (Kennicutt & Evans, 2012) then yields an SFR of yr-1.
Finally, we combined the rest-frame NUV half-light radii of DLA B1228-113 (r) and DLA J0918+1636 (r) with the galaxy SFRs (87 and 229 , obtained from SED fits; Klitsch et al., 2022), to obtain SFR surface densities of 1.8 (DLA B1228-113) and 6.2 (DLA J0918+1636).
3 Discussion
3.1 Molecular gas masses
We have obtained the first detections of CO(1–0) emission in high-redshift Hi-selected galaxies. The measured CO(1–0) line luminosities yield direct estimates of the molecular gas mass, without the need for assumptions regarding the CO excitation. We continue to obtain high molecular gas masses in DLA B1228-113 and DLA J0918+1636, albeit a factor of lower than the estimates from the CO(3–2) line (Neeleman et al., 2018; Fynbo et al., 2018; Kanekar et al., 2020). For DLA B0551-366, we have placed an upper limit on its CO(1–0) line luminosity, and thus, on its molecular gas mass, . This upper limit is again slightly lower than (but, given the uncertainties, consistent with) the estimate , obtained by Kanekar et al. (2020) from the CO(4–3) line.
Our molecular gas masses, inferred from the CO(1–0) line, are thus systematically lower, by a factor of , than the values obtained from the mid- rotational lines (Kanekar et al., 2020). This indicates that the three Hi-selected galaxies do not have substantial amounts of cold, low-excitation molecular gas (e.g. Papadopoulos et al., 2001). The lower gas mass estimates obtained here are because the earlier studies assumed sub-thermal excitation of the mid- CO rotational levels to estimate the CO(1–0) line luminosity, and thence the molecular gas mass.
The main remaining uncertainty in the molecular gas mass estimates for our Hi-selected galaxies is the value of the CO-to-H2 conversion factor, . Estimates of the stellar mass and SFR from fits to the broad-band spectral energy distribution (SED; Klitsch et al., 2022) find that both DLA B1228-113 and DLA J0918+1636 lie slightly ( dex) above the galaxy main sequence at their redshifts, but within the spread of the main sequence (e.g. Whitaker et al., 2012; Schreiber et al., 2015), especially given the large errors in the current SFR estimates. Thus, at present, there is no significant evidence that DLA B1228-113 or DLA J0918+1636 are starburst galaxies, that might have (K km s-1 pc (e.g. Magdis et al., 2012). Further, the galaxy metallicities inferred from the stellar mass – metallicity relation at are consistent with solar metallicity (Klitsch et al., 2022). We will hence assume (K km s-1 pc for these systems (e.g. Bolatto et al., 2013; Tacconi et al., 2020), applicable to high- main-sequence galaxies with solar metallicity.
Combining the SFR estimates of Klitsch et al. (2022) with our molecular gas mass estimates, we obtain a molecular gas depletion timescale of Gyr (DLA B1228-113) and Gyr (DLA J0918+1636). These are factors of higher than the expected depletion times ( Gyr) from the scaling relation of Tacconi et al. (2020).
3.2 The CO spectral line energy distribution (SLED) in Hi-selected galaxies
Our JVLA CO(1–0) measurements allow us, for the first time, to determine the excitation of the mid- rotational levels relative to the level in Hi-selected galaxies. Table 2 lists the values of , for , combining our measured CO(1–0) line luminosities with the luminosities of the higher- lines (Kanekar et al., 2020; Klitsch et al., 2022).
Studies of high-redshift galaxies typically assume sub-thermal excitation of the mid- rotational levels, with r and r (e.g. Tacconi et al., 2020). Remarkably, we find that DLA J0918+1636 has values of r and r, consistent with thermal excitation of the levels. We note that Klitsch et al. (2022) had earlier measured r in DLA J0918+1636, suggesting that the and levels are likely to show thermal excitation. Similarly, the value of r in DLA B1228-113 is consistent with thermal excitation, while the CO(1–0) non-detection in DLA B0551-366 yields the lower limit r, higher than the canonical value of 0.42 (Tacconi et al., 2020). We thus find direct evidence that the mid- rotational levels of massive Hi-selected galaxies at show relatively high excitation (see also Klitsch et al., 2022).
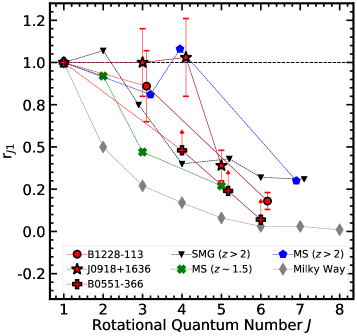
Fig. 3 plots the rJ1 values of the three Hi-selected galaxies (red symbols) against the upper rotational level quantum number, . The dashed horizontal line at r indicates thermal excitation of the rotational levels. The figure also includes data for the inner disk of the Milky Way (grey diamonds; Fixsen et al., 1999), three main-sequence (BzK) galaxies at (green crosses; Aravena et al., 2014; Daddi et al., 2015), five main-sequence galaxies at (blue pentagons; Riechers et al., 2010; Bolatto et al., 2015; Brisbin et al., 2019; Boogaard et al., 2020; Riechers et al., 2020; Henríquez-Brocal et al., 2021), and a large sample of sub-mm galaxies (SMGs) at (inverted black triangles; Birkin et al., 2021). For the high- main-sequence galaxies and SMGs, the figure shows the median values of rJ1 of objects with measurements of both the CO(1–0) line and higher- CO lines. In the case of the SMGs, we have used the median CO SLED of the large SMG sample of Birkin et al. (2021), who assumed r due to the paucity of CO(1–0) measurements in their sample. We bypass this assumption by normalizing their rJ1 values to r, the median measured r31 value obtained for 18 SMGs at (Sharon et al., 2016; Calistro Rivera et al., 2018).
Fig. 3 shows that the three Hi-selected galaxies have CO SLEDs consistent with those of massive main-sequence galaxies at . The excitation of the mid- rotational levels of the Hi-selected galaxies is clearly higher than that of both the inner disk of the Milky Way and main-sequence galaxies at . Further, the roughly thermal excitation of the levels in DLA J0918+1636 (and of the level in DLA B1228-113) is consistent with the excitation of the same levels in the main-sequence galaxy BX610 (Bolatto et al., 2015; Brisbin et al., 2019). It is interesting that the excitation in DLA J0918+1636 drops sharply in the rotational level, with r, well below thermal.
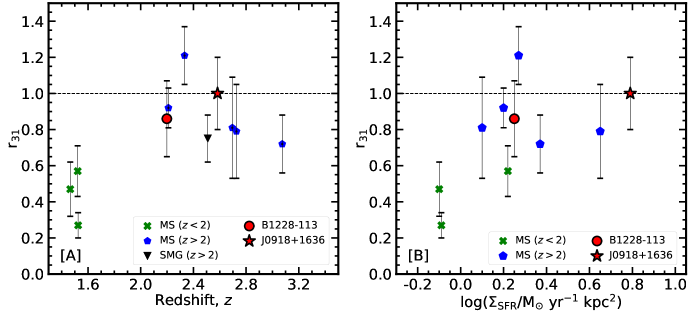
Fig. 4[A] plots r31 versus redshift for DLA B1228-113, DLA J0918+1636, and the above samples of SMGs at , and main-sequence galaxies at and . Here, the individual r31 values are plotted for the main-sequence galaxies (e.g. Riechers et al., 2010; Daddi et al., 2015; Bolatto et al., 2015; Brisbin et al., 2019; Henríquez-Brocal et al., 2021; Boogaard et al., 2020) and the median value for the SMGs (Sharon et al., 2016). Interestingly, we find evidence that all galaxies at show higher excitation of the level than main-sequence galaxies at , by a factor of . This is consistent with the result from the ALMA Spectroscopic Survey in the Hubble Ultra Deep Field (ASPECS), that galaxies at have an intrinsically higher CO excitation than those at (Boogaard et al., 2020). As noted by the latter authors, the likely cause of the higher CO excitation is the higher SFR surface density in higher- galaxies (e.g. Shibuya et al., 2015): simulations have found that the CO excitation is closely linked to the SFR surface density, with a higher excitation obtained for higher values of (Narayanan & Krumholz, 2014; Bournaud et al., 2015). Fig. 4[B] plots r31 versus SFR surface density for our Hi-selected galaxies and the main-sequence galaxies222The values for the main-sequence galaxies are from Tacconi et al. (2013) and Boogaard et al. (2020). of the left panel. It is clear that the SFR surface densities of the Hi-selected galaxies and the main-sequence galaxies are higher by factors of than those of the main-sequence galaxies at , consistent with the higher CO excitation of the higher- sample.
3.3 Stellar properties of DLA B1228-113
Finally, our SFR estimate of yr-1 for the Hi-selected galaxy DLA B1228-113 from its rest-frame NUV continuum is consistent with the estimate of yr-1 from the H line (Neeleman et al., 2018). The total SFR, estimated from both the total infrared luminosity and fits to the broadband SED, is far higher than the above estimates, yr-1 (Neeleman et al., 2018; Klitsch et al., 2022), implying a high dust extinction. Fig. 2[A] shows that the rest-frame NUV emission detected in the HST WFC3 image is offset from the peak of the ALMA CO(3–2) emission, by kpc. Combined with the very large CO(3–2) line FWHM ( km s-1; Neeleman et al., 2018), this suggests that the CO emission may arise from two merging galaxies, one of which has a high extinction and is hence not visible in the HST WFC3 image. High angular resolution CO mapping studies would be of much interest to directly probe this issue. Finally, we cannot formally rule out the possibility that the detected NUV emission arises from an interloper at a different redshift; if so, this would imply an even higher dust extinction for the Hi-selected galaxy.
4 Summary
We report JVLA detections of CO(1–0) emission in two Hi-selected galaxies at and , and an upper limit to the CO(1–0) line luminosity in a third Hi-selected galaxy at . These are the first detections of CO(1–0) emission in Hi-selected galaxies at high redshifts, , allowing us to directly estimate the molecular gas mass of the galaxies without assumptions about their CO excitation. We obtain molecular gas masses times lower than earlier estimates based on the mid- CO lines. We find thermal excitation of the rotational levels in the galaxy DLA J0918+1636, and near-thermal excitation of the level in the galaxy DLA B1228-113. In both cases, the CO excitation of the mid- rotational levels is higher than that typically assumed for main-sequence galaxies at . We also find evidence for higher excitation of the level in Hi-selected galaxies, main-sequence galaxies, and SMGs at , than in main-sequence galaxies at . This appears to arise due to a higher SFR surface density in the former types of galaxies. Finally, we used HST WFC3 imaging to detect rest-frame NUV emission from the galaxy DLA B1228-113, obtaining an NUV SFR of yr-1. This is a factor of lower than the SFR estimated from the total infrared luminosity or from SED fitting, confirming that the object is a highly dusty galaxy. The stellar NUV emission appears slightly offset from the ALMA CO(3–2) emission, suggesting that the CO and NUV emission may arise from a pair of merging galaxies, one of which is highly obscured and hence not detected in its stellar emission.
References
- Anderson (2016) Anderson, J. 2016, Supplemental Dither Patterns for WFC3/IR, Space Telescope WFC Instrument Science Report
- Aravena et al. (2014) Aravena, M., Hodge, J. A., Wagg, J., et al. 2014, MNRAS, 442, 558, doi: 10.1093/mnras/stu838
- Astropy Collaboration et al. (2013) Astropy Collaboration, Robitaille, T. P., Tollerud, E. J., et al. 2013, A&A, 558, A33, doi: 10.1051/0004-6361/201322068
- Bertin & Arnouts (1996) Bertin, E., & Arnouts, S. 1996, A&AS, 117, 393, doi: 10.1051/aas:1996164
- Birkin et al. (2021) Birkin, J. E., Weiss, A., Wardlow, J. L., et al. 2021, MNRAS, 501, 3926, doi: 10.1093/mnras/staa3862
- Bolatto et al. (2013) Bolatto, A. D., Wolfire, M., & Leroy, A. K. 2013, ARA&A, 51, 207, doi: 10.1146/annurev-astro-082812-140944
- Bolatto et al. (2015) Bolatto, A. D., Warren, S. R., Leroy, A. K., et al. 2015, ApJ, 809, 175, doi: 10.1088/0004-637X/809/2/175
- Boogaard et al. (2020) Boogaard, L. A., van der Werf, P., Weiss, A., et al. 2020, ApJ, 902, 109, doi: 10.3847/1538-4357/abb82f
- Bournaud et al. (2015) Bournaud, F., Daddi, E., Weiß, A., et al. 2015, A&A, 575, A56, doi: 10.1051/0004-6361/201425078
- Brisbin et al. (2019) Brisbin, D., Aravena, M., Daddi, E., et al. 2019, A&A, 628, A104, doi: 10.1051/0004-6361/201935148
- Calistro Rivera et al. (2018) Calistro Rivera, G., Hodge, J. A., Smail, I., et al. 2018, ApJ, 863, 56, doi: 10.3847/1538-4357/aacffa
- Carilli & Walter (2013) Carilli, C. L., & Walter, F. 2013, ARA&A, 51, 105, doi: 10.1146/annurev-astro-082812-140953
- Chabrier (2003) Chabrier, G. 2003, ApJ, 586, L133, doi: 10.1086/374879
- Daddi et al. (2015) Daddi, E., Dannerbauer, H., Liu, D., et al. 2015, A&A, 577, A46, doi: 10.1051/0004-6361/201425043
- Fixsen et al. (1999) Fixsen, D. J., Bennett, C. L., & Mather, J. C. 1999, ApJ, 526, 207, doi: 10.1086/307962
- Fumagalli et al. (2015) Fumagalli, M., O’Meara, J. M., Prochaska, J. X., Rafelski, M., & Kanekar, N. 2015, MNRAS, 446, 3178, doi: 10.1093/mnras/stu2325
- Fynbo et al. (2018) Fynbo, J. P. U., Heintz, K. E., Neeleman, M., et al. 2018, MNRAS, 479, 2126, doi: 10.1093/mnras/sty1520
- Gaia Collaboration et al. (2018) Gaia Collaboration, Brown, A. G. A., Vallenari, A., et al. 2018, A&A, 616, A1, doi: 10.1051/0004-6361/201833051
- Greisen (2003) Greisen, E. W. 2003, in Astrophysics and Space Science Library, Vol. 285, Information Handling in Astronomy - Historical Vistas, ed. A. Heck (Kluwer, Dordrecht), 109, doi: 10.1007/0-306-48080-8_7
- Hack et al. (2020) Hack, W. J., Cara, M., Sosey, M., et al. 2020, doi: 10.5281/zenodo.3743274
- Henríquez-Brocal et al. (2021) Henríquez-Brocal, K., Herrera-Camus, R., Tacconi, L., et al. 2021, arXiv e-prints, arXiv:2109.01684. https://arxiv.org/abs/2109.01684
- Kanekar et al. (2020) Kanekar, N., Prochaska, J., Neeleman, M., et al. 2020, ApJL, 901, L5. https://arxiv.org/abs/2009.04001
- Kanekar et al. (2018) Kanekar, N., Prochaska, J. X., Christensen, L., et al. 2018, ApJ, 856, L23, doi: 10.3847/2041-8213/aab6ab
- Kaur et al. (2021) Kaur, B., Kanekar, N., Rafelski, M., et al. 2021, ApJ, 921, 68, doi: 10.3847/1538-4357/ac12d2
- Kaur et al. (2022) Kaur, B., Kanekar, N., Revalski, M., et al. 2022, arXiv e-prints, arXiv:2206.10623. https://arxiv.org/abs/2206.10623
- Kennicutt (1998) Kennicutt, Robert C., J. 1998, ARA&A, 36, 189, doi: 10.1146/annurev.astro.36.1.189
- Kennicutt & Evans (2012) Kennicutt, R. C., & Evans, N. J. 2012, ARA&A, 50, 531, doi: 10.1146/annurev-astro-081811-125610
- Klitsch et al. (2019) Klitsch, A., Zwaan, M. A., Péroux, C., et al. 2019, MNRAS, 482, L65, doi: 10.1093/mnrasl/sly187
- Klitsch et al. (2022) Klitsch, A., Christensen, L., Valentino, F., et al. 2022, MNRAS, 514, 2346, doi: 10.1093/mnras/stac1190
- Krogager et al. (2017) Krogager, J. K., Møller, P., Fynbo, J. P. U., & Noterdaeme, P. 2017, MNRAS, 469, 2959, doi: 10.1093/mnras/stx1011
- Kron (1980) Kron, R. G. 1980, ApJS, 43, 305, doi: 10.1086/190669
- Mack et al. (2021) Mack, J., Olszewksi, H., & Pirzkal, N. 2021, WFC3/IR Filter-Dependent Sky Flats, Space Telescope WFC Instrument Science Report
- Magdis et al. (2012) Magdis, G. E., Daddi, E., Béthermin, M., et al. 2012, ApJ, 760, 6, doi: 10.1088/0004-637X/760/1/6
- McMullin et al. (2007) McMullin, J. P., Waters, B., Schiebel, D., Young, W., & Golap, K. 2007, in Astronomical Society of the Pacific Conference Series, Vol. 376, Astronomical Data Analysis Software and Systems XVI, ed. R. A. Shaw, F. Hill, & D. J. Bell, 127
- Møller et al. (2018) Møller, P., Christensen, L., Zwaan, M. A., et al. 2018, MNRAS, 474, 4039, doi: 10.1093/mnras/stx2845
- Narayanan & Krumholz (2014) Narayanan, D., & Krumholz, M. R. 2014, MNRAS, 442, 1411, doi: 10.1093/mnras/stu834
- Neeleman et al. (2018) Neeleman, M., Kanekar, N., Prochaska, J. X., et al. 2018, ApJ, 856, L12, doi: 10.3847/2041-8213/aab5b1
- Neeleman et al. (2017) —. 2017, Science, 355, 1285, doi: 10.1126/science.aal1737
- Neeleman et al. (2019) Neeleman, M., Kanekar, N., Prochaska, J. X., Rafelski, M. A., & Carilli, C. L. 2019, ApJ, 870, L19, doi: 10.3847/2041-8213/aaf871
- Neeleman et al. (2020) Neeleman, M., Prochaska, J. X., Nissim, K., & Rafelski, M. 2020, Nature, 581, 269, doi: 10.1038/s41586-020-2276-y
- Papadopoulos et al. (2001) Papadopoulos, P., Ivison, R., Carilli, C., & Lewis, G. 2001, Nature, 409, 58, doi: 10.1038/35051029
- Péroux et al. (2019) Péroux, C., Zwaan, M. A., Klitsch, A., et al. 2019, MNRAS, 485, 1595, doi: 10.1093/mnras/stz202
- Planck Collaboration (2020) Planck Collaboration. 2020, A&A, 641, A6, doi: 10.1051/0004-6361/201833910
- Prochaska et al. (2019) Prochaska, J. X., Neeleman, M., Kanekar, N., & Rafelski, M. 2019, ApJ, 886, L35, doi: 10.3847/2041-8213/ab55eb
- Riechers et al. (2010) Riechers, D. A., Carilli, C. L., Walter, F., & Momjian, E. 2010, ApJ, 724, L153, doi: 10.1088/2041-8205/724/2/L153
- Riechers et al. (2020) Riechers, D. A., Boogaard, L. A., Decarli, R., et al. 2020, ApJ, 896, L21, doi: 10.3847/2041-8213/ab9595
- Schreiber et al. (2015) Schreiber, C., Pannella, M., Elbaz, D., et al. 2015, A&A, 575, A74, doi: 10.1051/0004-6361/201425017
- Sharon et al. (2016) Sharon, C. E., Riechers, D. A., Hodge, J., et al. 2016, ApJ, 827, 18, doi: 10.3847/0004-637X/827/1/18
- Shibuya et al. (2015) Shibuya, T., Ouchi, M., & Harikane, Y. 2015, ApJS, 219, 15, doi: 10.1088/0067-0049/219/2/15
- Tacconi et al. (2020) Tacconi, L. J., Genzel, R., & Sternberg, A. 2020, ARA&A, 58, 157, doi: 10.1146/annurev-astro-082812-141034
- Tacconi et al. (2013) Tacconi, L. J., Neri, R., Genzel, R., et al. 2013, ApJ, 768, 74, doi: 10.1088/0004-637X/768/1/74
- Whitaker et al. (2012) Whitaker, K. E., van Dokkum, P. G., Brammer, G., & Franx, M. 2012, ApJ, 754, L29, doi: 10.1088/2041-8205/754/2/L29
- Wolfe et al. (2005) Wolfe, A. M., Gawiser, E., & Prochaska, J. X. 2005, ARA&A, 43, 861, doi: 10.1146/annurev.astro.42.053102.133950