Frequency-dependent impedance of nanocapacitors from electrode charge fluctuations as a probe of electrolyte dynamics
Abstract
The frequency-dependent impedance is a fundamental property of electrical components. We show that it can be determined from the equilibrium dynamical fluctuations of the electrode charge in constant-potential molecular simulations, extending in particular a fluctuation-dissipation for the capacitance recovered in the low-frequency limit and provide an illustration on water/gold nanocapacitors. This work opens the way to the interpretation of electrochemical impedance measurements in terms of microscopic mechanisms, directly from the dynamics of the electrolyte, or indirectly via equivalent circuit models as in experiments.
The electrical impedance, which quantifies the current induced by a small oscillatory applied voltage, is a fundamental property of the components of an electric circuit. Electrochemical impedance spectroscopy techniques Mei et al. (2018); Wang et al. (2021) are routinely used to characterize batteries Gaberšček (2021) and capacitors Segalini et al. (2010). Electrodes in nanofluidic devices also open new avenues for energy conversion from salinity gradients Siria et al. (2013, 2017) or from light Xiao et al. (2019), for catalysis Levin et al. (2019) or sensing charged species and measuring ultra-low flow rates with electrochemical correlation spectroscopy Zevenbergen et al. (2009); Mathwig et al. (2012). Measurements are usually interpreted in terms of equivalent circuits (EC) Taberna et al. (2003) combining elements with impedance , , or , with the frequency, for capacitors, resistors or inductors, respectively, or more complex ones such as constant phase elements. The frequency-dependent response highlights the relevant time scales in the dynamics of the polarization of the liquid and the transport of charge carriers within such electrochemical devices. The diffusion and migration of ions can be modeled analytically at the mean-field level Bazant et al. (2004); Barbero et al. (2008); Janssen and Bier (2018) and their coupling with hydrodynamic flows with mesoscopic simulations methods Asta et al. (2019), to predict the charging dynamics of a capacacitor. The effect of steric and other correlations on the dynamics can be introduced in such descriptions Kilic et al. (2007) or in classical Density Functional Theory Jiang et al. (2014); Lian et al. (2016). Charge transport within porous electrodes, which are used in many devices, can be modeled using such liquid state theories or simpler constitutive equations, in order to make the link with EC such as the transmission line model (TLM) Biesheuvel and Bazant (2010); Lian et al. (2020); Lin et al. (2022).
Molecular simulations have greatly contributed to tecent progress in the description of electrode/electrolyte interfaces, taking into account the polarization of the electrodes by the ions and solvent molecules of the electrolyte Scalfi et al. (2021). Several methods have been developed to impose the potential of the metal both in ab initio and classical molecular dynamics (MD) simulations Siepmann and Sprik (1995); Reed et al. (2007); Bonnet et al. (2012); Dufils et al. (2019); Deißenbeck et al. (2021), which enabled the molecular-scale study of simple and complex electrochemical systems, including supercapacitors Merlet et al. (2012); Salanne et al. (2016); Simoncelli et al. (2018); Jeanmairet et al. (2022). In such constant-potential simulations, the charge of the electrodes fluctuates in response to the dynamical evolution of the electrolyte. The local and global responses of the charge of porous electrodes to an applied voltage step can be monitored to build EC models such as the TLM in order to extrapolate to larger system sizes and longer time scales and bridge the gap with the electrochemical impedance measurements Péan et al. (2014); Pean et al. (2016), or to design optimal charging protocols Breitsprecher et al. (2018, 2020). The capacitance and so-called equivalent series resistance of the system can also be obtained using a recently proposed nonequilibrium “computational amperometry” approach Dufils et al. (2021).
An alternative strategy to compute the capacitance from MD simulations and to extract information on the interfacial electrolyte is to study the equilibrium fluctuations of the electrode charge Limmer et al. (2013a); Scalfi et al. (2020a). The differential capacitance, i.e. the response of the electrode charge to a change in voltage between the electrodes, is related to the variance of the charge distribution via a fluctuation-dissipation relation , where brakets denote an ensemble average, and with the Boltzmann constant and the temperature. The link between the thermal fluctuations of charge carriers and electrical response, already observed almost a century ago by Nyquist and Johnson who considered the thermal noise in electronic conductors Nyquist (1928); Johnson (1928), allowed to correlate using molecular simulations the voltage-dependence of the differential capacitance with changes in the interfacial structure of an ionic liquid or a water-in-salt-electrolyte between graphite electrodes Merlet et al. (2014); Rotenberg and Salanne (2015); Li et al. (2018). More recently the charge fluctuations within electrodes were also linked to the electrode-electrolyte interfacial free energy Scalfi and Rotenberg (2021).
Here, we show that the frequency-dependent impedance can be extracted from the equilibrium dynamical fluctuations of the electrode charge in constant-potential simulations, the above fluctuation-dissipation relation for the capacitance being recovered in the low-frequency limit. This opens the possibility to investigate with MD simulations the link between the impedance and the dynamics of the liquid between the electrodes. We then illustrate this on water/gold nanocapacitors. Both experiments and simulations recently highlighted some peculiarities of nanoconfined water, such as the decrease of dielectric constant Fumagalli et al. (2018); Olivieri et al. (2021) and its anisotropy close to interfaces Loche et al. (2018), as well as its unusual dynamical behavior Gekle and Netz (2012); Mondal and Bagchi (2021). In addition, the dynamics of water on metals proceeds by local reorientation jumps or by rare collective fluctuations, depending on the metal Zhang et al. (2020); Limmer et al. (2013b, 2015). Finally, the coupling between the interfacial fluctuations of water and the electronic response of carbon plays an important role in the water-graphite friction Kavokine et al. (2022). The present approach offers a way to probe the dynamics of the liquid encoded in the electrical impedance measured with electrodes.
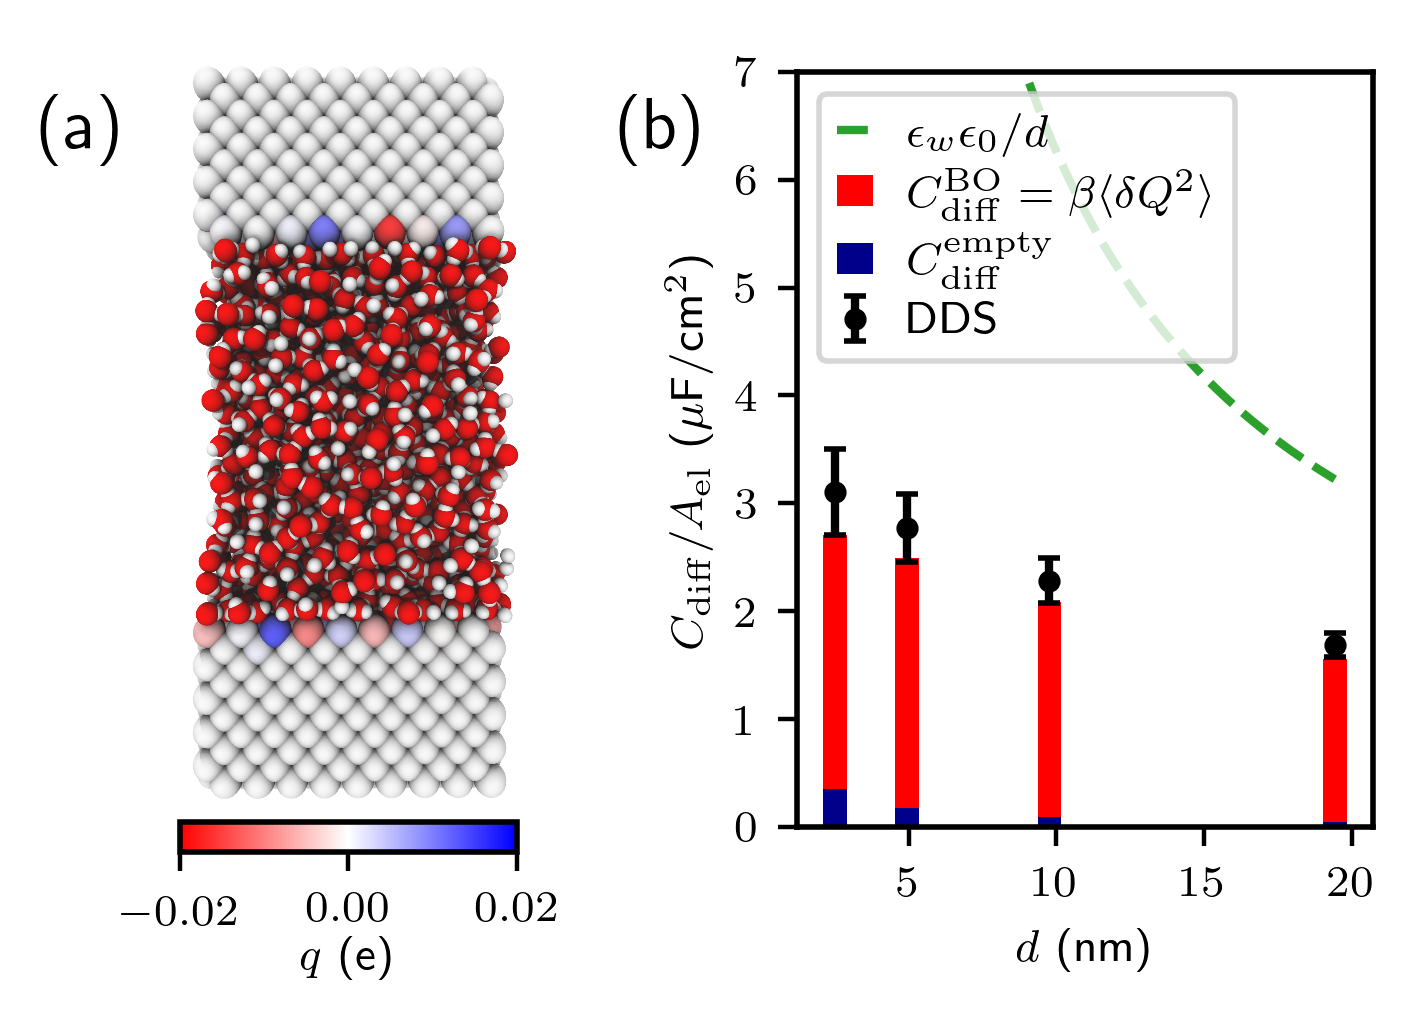
We consider systems such as illustrated in Fig. 1a, with two rigid electrodes maintained at a fixed potential difference and separated by a liquid with fixed number of particles and temperature . The charge of each electrode atom fluctuates in order to satisfy the constant-potential constraint, so that the total charge of the oppositely charged electrodes (due to global electroneutrality), which is the thermodynamic variable conjugate to , also fluctuates in response to the thermal fluctuations of the liquid. The complex admittance , with the impedance, quantifies the linear response of the induced electric current, , to a small oscillatory voltage, , in addition to the voltage defining the thermodynamic ensemble, from the change in current . Using linear response theory, we show in Supplemental Material (SM) sup that the admittance can be expressed using the Laplace transform of the current or charge auto-correlation functions (ACF), as:
| (1) |
This fundamental result explicitly links the dynamics of the electrode charge, which reflect the thermal fluctuations of the liquid, with the impedance of the system. It generalizes the above fluctuation-dissipation relation for the capacitance, which is recovered in the low frequency limit since the leading term of Eq. Frequency-dependent impedance of nanocapacitors from electrode charge fluctuations as a probe of electrolyte dynamics is , the admittance of a capacitor with capacitance . Importantly, Eq. Frequency-dependent impedance of nanocapacitors from electrode charge fluctuations as a probe of electrolyte dynamics also offers a practical tool to compute the full impedance spectrum from the dynamics of the charge fluctuations in constant-potential MD simulations, as shown below.
The fluctuating charges introduced in Ref. Siepmann and Sprik (1995) as additional degrees of freedom to simulate constant-potential conditions followed an equation of motion with a fictitious mass. Ref. Reed et al. (2007) then suggested to determine the set of charges that self-consistently satisfy the constant-potential constraints at each step of the simulation, so that the electrode atom charges are enslaved to the microscopic configurations of the liquid. Such a Born-Oppenheimer (BO) sampling allows to use larger time steps, but also suppresses some charge fluctuations that may contribute to some observables. For example, the suppressed fluctuations lead to a missing term in the capacitance corresponding to that of an empty capacitor, Scalfi et al. (2020a). Separating the instantaneous charge as into the BO and non-BO terms and expanding and in Eq. Frequency-dependent impedance of nanocapacitors from electrode charge fluctuations as a probe of electrolyte dynamics yields
| (2) |
where the first term is obtained by replacing by in Eq. Frequency-dependent impedance of nanocapacitors from electrode charge fluctuations as a probe of electrolyte dynamics and the second is the remainder. The latter depends on the choice of dynamics for the additional degrees of freedom, which should only manifest themselves at high frequencies since they mimick the electronic response, except for the “static” contribution for where . In practice, the non-BO contribution to the capacitance is small compared to the BO one arising from the thermal fluctuations of the liquid Scalfi et al. (2020a) (see also below). In the following, we drop the BO superscript and refer to the BO charges as simply .
As an illustration of the possibilities offered by the analysis of the equilibrium dynamical fluctuations of the electrode charge in constant-potential simulations, we investigate gold/water nanocapacitors (see Fig. 1a). Simulations are performed under periodic boundary conditions in the and directions only, with fixed number of molecules and corresponding inter-electrode distance. The latter is determined by prior equilibration at a constant pressure of 1 atm in the direction perpendicular to the electrode surfaces, resulting in 2.51, 4.94, 9.76, and 19.42 nm between the first atomic planes of the electrodes. Details on the systems and molecular models can be found in the SM sup . All simulations are performed using the MD code Metalwalls Marin-Laflèche et al. (2020), with a potential difference V between the electrodes except for the response to a voltage step. Unless otherwise stated, the uncertainty is expressed as standard error computed from 10 blocks of the trajectory.
Fig. 1b shows the BO and non-BO contributions to the differential capacitance as a function of the inter-electrode distance . As indicated above, the former contribution, , is much larger than the latter, , computed from the properties of the electrodes as described in Ref. 38. The figure also shows that the prediction from continuum electrostatics, , with the vacuum permittivity, the relative permittivity of bulk water, and the lateral area of the electrodes, only qualitatively reproduces the decrease of the capacitance with increasing inter-electrode distance. This is due to the failure to capture the potential drop across the interfacial water layers, as previously reported on other surfaces Jeanmairet et al. (2019). The prediction can be greatly improved by considering the Dielectric Dividing Surface (DDS), obtained from the interfacial permittivity profiles Schlaich et al. (2016). As the Gibbs Dividing Surface for density profiles, the DDS locates an equivalent sharp interface between a (water-free) region with permittivity and another with (see SM sup ). In this picture, the capacitance per unit area corresponds to that of three capacitors in series, , with Å the distance between the last atomic plane of each electrode and the corresponding DDS, and the width of the equivalent bulk water region, and provides a rather accurate description of the actual capacitance (see Ref. 58 for a related approach for the solvation free energy).
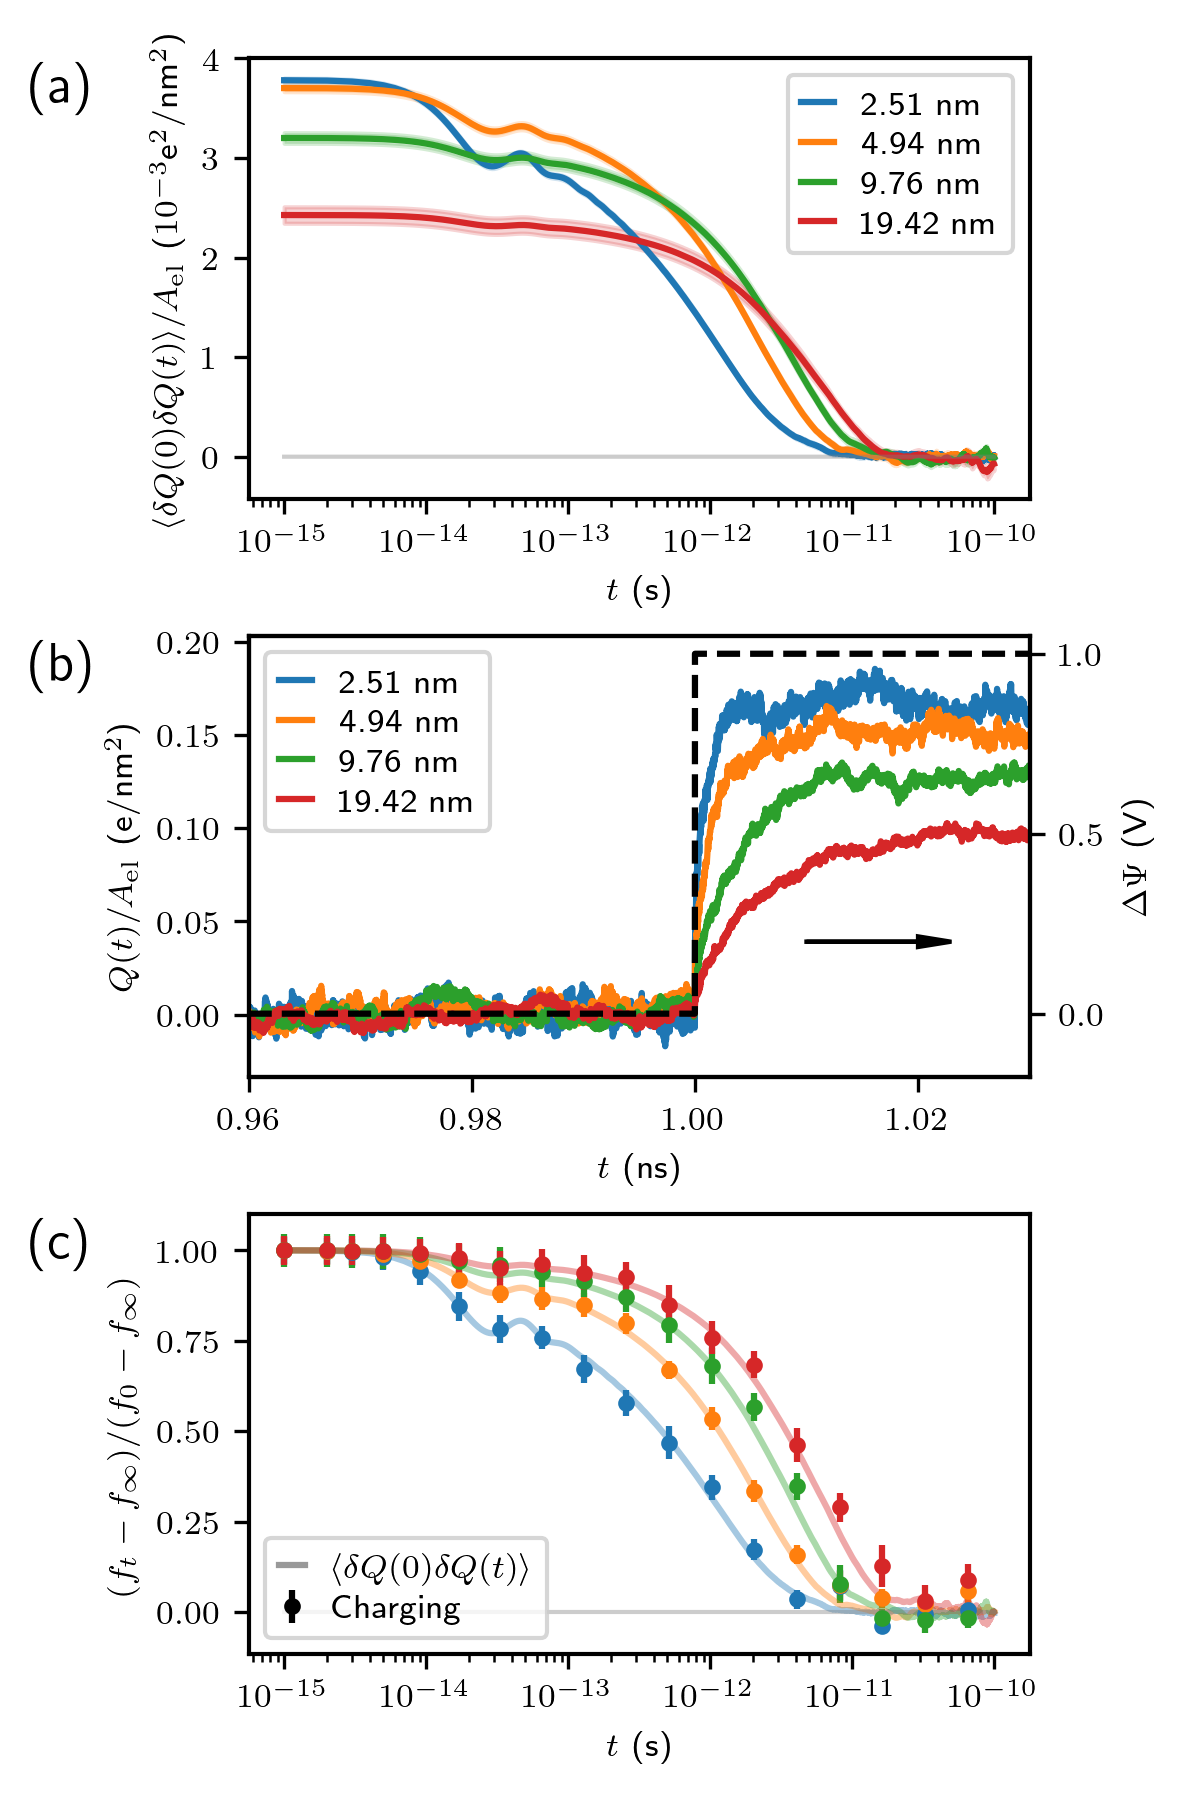
Turning to the dynamics of the charge fluctuations, Fig. 2a shows that the charge ACF displays oscillations at short times and an approximately exponential decay at longer times. Increasing the inter-electrode distance damps the former and slows down the latter. In the linear response regime, should reflect the evolution of during the (dis)charge of the capacitor. Fig. 2b shows the charge as a function of time before after a change from V to 1 V. The plateaus reached after the transient regime are consistent with the capacitance for each , and the characteristic time to reach the new equilibrium increases with , consistently with the slower decay of the ACF in Fig. 2a. However, the link between the equilibrium ACF and the out-of-equilibrium response is much deeper: Fig. 2c shows the equivalence between the two when properly rescaled, as expected from the fluctuation-dissipation theorem, indicating that in these systems the response is linear at least up to 1 V (as observed for the capacitance of water/graphite capacitors Jeanmairet et al. (2019)).
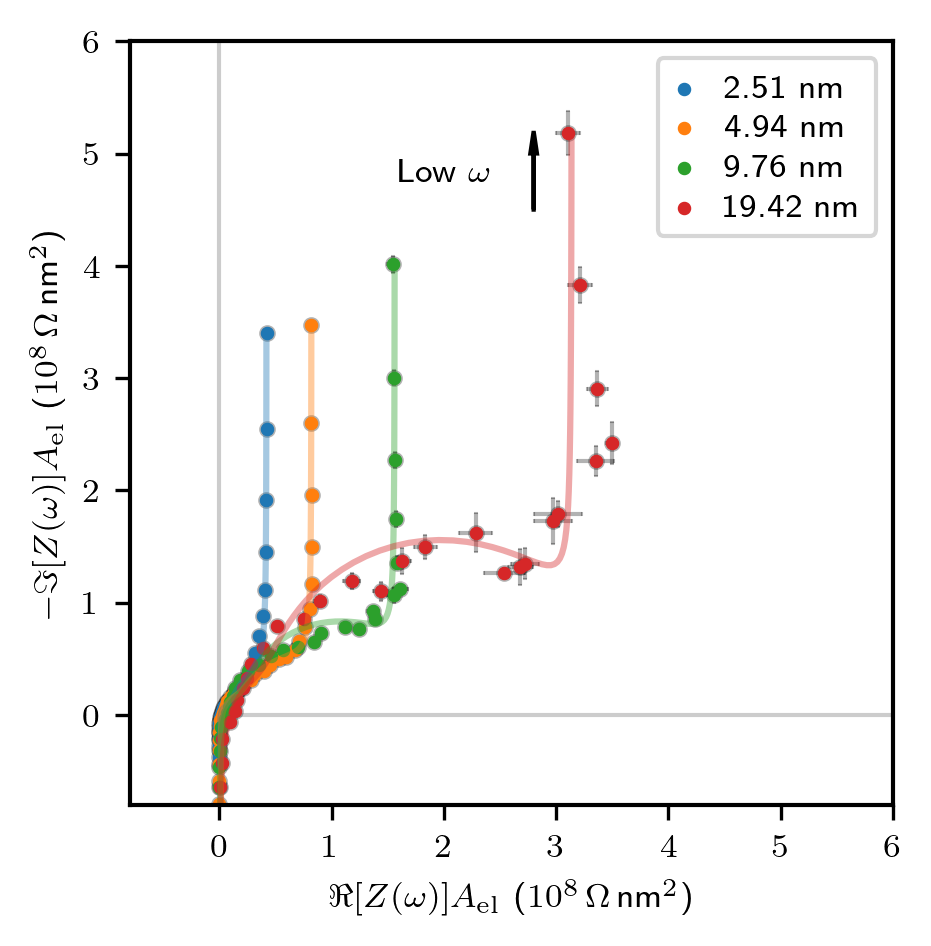
The impedance is usually analyzed in a Nyquist plot, which reports its imaginary and real parts in the complex plane, parameterized by the frequency. The MD results obtained from the ACF using Eq. Frequency-dependent impedance of nanocapacitors from electrode charge fluctuations as a probe of electrolyte dynamics (see SM sup for more details on the numerical procedure) are shown in Fig. 3, for a frequency range spanning 4 orders of magnitude, from to rad s-1. For a sufficiently large system in the lateral directions, the charge ACF, hence the admittance scales linearly with , as shown numerically in SM sup . We therefore plot the impedance multiplied by in Fig. 3. As in experiments, we model the data using an EC with resistances and capacitances fitted to the admittance/impedance from MD (see SM sup ). The Nyquist plots are typical of capacitors with a vertical asymptote at low frequency. The growing real part with inter-electrode distance reflects an increase in dissipative processes. The corresponding resistance scales approximately as , as expected for a macroscopic resistor. At the other end of the frequency spectrum, we observe a sign change in the imaginary part, which reflects the short-time oscillations of the ACF and can be modeled using an inductor in the EC, with .
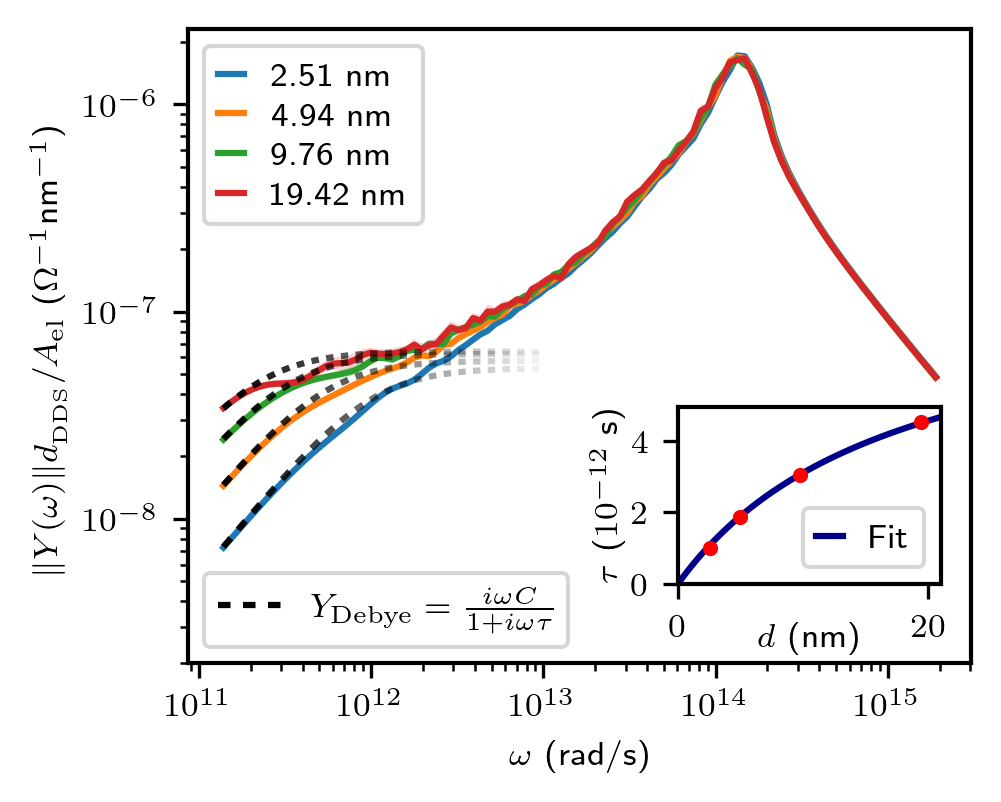
The frequency-dependence is shown in the Bode plot, Fig. 4, where the norm of the complex admittance is multiplied by the effective water slab width and divided by the lateral area to highlight the scaling relations with system size. The most prominent feature is a common peak, with magnitude inversely proportional to , located at rad s-1 and corresponding to the short-time oscillations observed in the charge ACF shown in Fig. 2a. Interestingly, this frequency coincides with the one of the previously reported oscillations of the dipole moment of nanoconfined water Gekle and Netz (2012); Mondal and Bagchi (2021) as well as a feature in the bulk permittivity spectrum of water ascribed to librational modes Carlson et al. (2020). This points to the link between the water polarization and the electrode charge (see below). In addition, the linear scaling of this peak with suggests that it is mainly due to “bulk” water rather than to an interfacial mechanism.
The broad shoulder at low frequency is well described by a Debye model with a single relaxation time. Indeed, from Eq. Frequency-dependent impedance of nanocapacitors from electrode charge fluctuations as a probe of electrolyte dynamics the admittance can be approximated at low frequency by , with the integral of the normalized charge ACF. The deviations from the scaling with reflect the interfacial component of the capacitance captured by the DDS model (see the above discussion of Fig. 1). In the EC picture, this low-frequency behavior corresponds to a RC circuit in series, with relaxation time . Both estimates of coincide and increase with inter-electrode distance approximately as (see inset of Fig. 1 and SM sup ). The fitted value ps is close to the characteristic time corresponding to the Debye relaxation in bulk water ( ps) that can be interpreted as arising from the migration of orientational defects in the H-bond network Popov et al. (2016), even though the separation between individual and collective motion is challenging Carlson et al. (2020). This further illustrates the link between the impedance and the dynamics of the charge fluctuations in MD simulations.
As a first step towards the molecular interpretation of the admittance/impedance, we monitor the components of the dipole moment of the confined water slab in the directions perpendicular and parallel to the electrode surfaces. We show in SM sup that the former almost perfectly follows the dynamics of the electrode charge, while the latter decays more slowly and is only slightly affected by . We also show that, under the considered conditions, the perpendicular component of the total water dipole satisfies , with the instantaneous distance between the charge-weighted atomic positions in each electrode. In the present case of a perfect metal, these positions almost coincide with the first atomic planes for all microscopic configurations (see also Refs. 61; 62 for the charge induced on the same model of gold electrodes), so that , which explains the direct link between the ACF of the electrode charge and that of . The situation might be different in the case of imperfect screening of charge and potential within metals, which can be introduced in MD using the Thomas-Fermi model Scalfi et al. (2020b).
Overall, the present work offers the possibility to extract the frequency-dependent impedance/admittance of electrochemical systems in molecular simulations from the equilibrium dynamical fluctuations of the electrode charge. This opens the way to the interpretation of impedance measurements in terms of microscopic mechanisms, either directly from the dynamics of the electrolyte, or indirectly by EC models used to analyze the experimental data. Beyond the case of pure water considered as an illustration, the next step is to investigate electrolyte solutions and the dynamics of electric double layers. The diffusion of ions introduces longer timescales, so that the study of the charge fluctuations may benefit from implicit solvent descriptions of electrochemical interfaces Cats et al. (2021) and would also bridge the gap with the experimental frequency range probed in typical electrochemical impedance measurements. Nevertheless, the one considered here for pure water already partially overlaps with that of THz spectroscopy experiments, which can also be decomposed into microscopic contributions Heyden et al. (2010) and have recently been used to investigate electrode/electrolyte interfaces Alfarano et al. (2021). Future directions may also include the non-linear dynamical response to large voltages, using e.g. the statistical tools developed to sample electric current fluctuations in MD simulations Lesnicki et al. (2020, 2021), as well as systems with redox reactions at the surface of the electrodes Dwelle and Willard (2019).
The authors thank Mathieu Salanne, Iurii Chubak, Minh-Thé Hoang Ngoc and Jeongmin Kim for discussions. This project received funding from the European Research Council under the European Union’s Horizon 2020 research and innovation program (Grant Agreement No. 863473). The authors acknowledge access to HPC resources from GENCI (grant no. A0110912966).
References
- Mei et al. (2018) B.-A. Mei, O. Munteshari, J. Lau, B. Dunn, and L. Pilon, The Journal of Physical Chemistry C 122, 194 (2018), https://doi.org/10.1021/acs.jpcc.7b10582 .
- Wang et al. (2021) S. Wang, J. Zhang, O. Gharbi, V. Vivier, M. Gao, and M. E. Orazem, Nature Reviews Methods Primers 1, 41 (2021).
- Gaberšček (2021) M. Gaberšček, Nature Communications 12, 6513 (2021).
- Segalini et al. (2010) J. Segalini, B. Daffos, P. Taberna, Y. Gogotsi, and P. Simon, Electrochimica Acta 55, 7489 (2010).
- Siria et al. (2013) A. Siria, P. Poncharal, A.-L. Biance, R. Fulcrand, X. Blase, S. T. Purcell, and L. Bocquet, Nature 494, 455 (2013).
- Siria et al. (2017) A. Siria, M.-L. Bocquet, and L. Bocquet, Nat Rev Chem 1, 0091 (2017).
- Xiao et al. (2019) K. Xiao, L. Chen, R. Chen, T. Heil, S. D. C. Lemus, F. Fan, L. Wen, L. Jiang, and M. Antonietti, Nature Communications 10, 74 (2019).
- Levin et al. (2019) S. Levin, J. Fritzsche, S. Nilsson, A. Runemark, B. Dhokale, H. Ström, H. Sundén, C. Langhammer, and F. Westerlund, Nature Communications 10, 4426 (2019).
- Zevenbergen et al. (2009) M. A. G. Zevenbergen, P. S. Singh, E. D. Goluch, B. L. Wolfrum, and S. G. Lemay, Analytical Chemistry 81, 8203 (2009).
- Mathwig et al. (2012) K. Mathwig, D. Mampallil, S. Kang, and S. G. Lemay, Physical Review Letters 109, 118302 (2012).
- Taberna et al. (2003) P.-L. Taberna, P. Simon, and J.-F. Fauvarque, J. Electrochem. Soc. 150, A292 (2003).
- Bazant et al. (2004) M. Z. Bazant, K. Thornton, and A. Ajdari, Phys. Rev. E 70, 021506 (2004).
- Barbero et al. (2008) G. Barbero, F. Batalioto, and A. M. Figueiredo Neto, Applied Physics Letters 92, 172908 (2008).
- Janssen and Bier (2018) M. Janssen and M. Bier, Phys. Rev. E 97, 052616 (2018).
- Asta et al. (2019) A. J. Asta, I. Palaia, E. Trizac, M. Levesque, and B. Rotenberg, J. Chem. Phys. 151, 114104 (2019).
- Kilic et al. (2007) M. S. Kilic, M. Z. Bazant, and A. Ajdari, Phys. Rev. E 75, 021502 (2007).
- Jiang et al. (2014) J. Jiang, D. Cao, D. E. Jiang, and J. Wu, J. Phys. Chem. Lett. 5, 2195 (2014).
- Lian et al. (2016) C. Lian, S. Zhao, H. Liu, and J. Wu, J. Chem. Phys. 145, 204707 (2016).
- Biesheuvel and Bazant (2010) P. M. Biesheuvel and M. Z. Bazant, Phys. Rev. E 81, 031502 (2010).
- Lian et al. (2020) C. Lian, M. Janssen, H. Liu, and R. van Roij, Phys. Rev. Lett. 124, 076001 (2020).
- Lin et al. (2022) Y. Lin, C. Lian, M. U. Berrueta, H. Liu, and R. van Roij, Physical Review Letters 128, 206001 (2022), publisher: American Physical Society.
- Scalfi et al. (2021) L. Scalfi, M. Salanne, and B. Rotenberg, Annual Review of Physical Chemistry 72, 189 (2021).
- Siepmann and Sprik (1995) J. I. Siepmann and M. Sprik, J. Chem. Phys. 102, 511 (1995).
- Reed et al. (2007) S. K. Reed, O. J. Lanning, and P. A. Madden, J. Chem. Phys. 126, 084704 (2007), publisher: American Institute of Physics.
- Bonnet et al. (2012) N. Bonnet, T. Morishita, O. Sugino, and M. Otani, Phys. Rev. Lett. 109, 266101 (2012).
- Dufils et al. (2019) T. Dufils, G. Jeanmairet, B. Rotenberg, M. Sprik, and M. Salanne, Phys. Rev. Lett. 123, 195501 (2019).
- Deißenbeck et al. (2021) F. Deißenbeck, C. Freysoldt, M. Todorova, J. Neugebauer, and S. Wippermann, Physical Review Letters 126, 136803 (2021).
- Merlet et al. (2012) C. Merlet, B. Rotenberg, P. A. Madden, P.-L. Taberna, P. Simon, Y. Gogotsi, and M. Salanne, Nat. Mater. 11, 306 (2012).
- Salanne et al. (2016) M. Salanne, B. Rotenberg, K. Naoi, K. Kaneko, P.-L. Taberna, C. P. Grey, B. Dunn, and P. Simon, Nature Energy 1, 16070 (2016).
- Simoncelli et al. (2018) M. Simoncelli, N. Ganfoud, A. Sene, M. Haefele, B. Daffos, P.-L. Taberna, M. Salanne, P. Simon, and B. Rotenberg, Physical Review X 8, 021024 (2018).
- Jeanmairet et al. (2022) G. Jeanmairet, B. Rotenberg, and M. Salanne, Chemical Reviews , acs.chemrev.1c00925 (2022).
- Péan et al. (2014) C. Péan, C. Merlet, B. Rotenberg, P. A. Madden, P.-L. Taberna, B. Daffos, M. Salanne, and P. Simon, ACS Nano 8, 1576 (2014).
- Pean et al. (2016) C. Pean, B. Rotenberg, P. Simon, and M. Salanne, J. Power Sources 326, 680 (2016).
- Breitsprecher et al. (2018) K. Breitsprecher, C. Holm, and S. Kondrat, ACS Nano 12, 9733 (2018).
- Breitsprecher et al. (2020) K. Breitsprecher, M. Janssen, P. Srimuk, B. L. Mehdi, V. Presser, C. Holm, and S. Kondrat, Nat. Commun. 11, 6085 (2020).
- Dufils et al. (2021) T. Dufils, M. Sprik, and M. Salanne, The Journal of Physical Chemistry Letters 12, 4357 (2021), publisher: American Chemical Society.
- Limmer et al. (2013a) D. T. Limmer, C. Merlet, M. Salanne, D. Chandler, P. A. Madden, R. van Roij, and B. Rotenberg, Phys. Rev. Lett. 111 (2013a), 10.1103/PhysRevLett.111.106102.
- Scalfi et al. (2020a) L. Scalfi, D. T. Limmer, A. Coretti, S. Bonella, P. A. Madden, M. Salanne, and B. Rotenberg, Phys. Chem. Chem. Phys. 22, 10480 (2020a).
- Nyquist (1928) H. Nyquist, Phys. Rev. 32, 110 (1928).
- Johnson (1928) J. Johnson, Phys. Rev. 32, 97 (1928).
- Merlet et al. (2014) C. Merlet, D. T. Limmer, M. Salanne, R. van Roij, P. A. Madden, D. Chandler, and B. Rotenberg, J. Phys. Chem. C 118, 18291 (2014).
- Rotenberg and Salanne (2015) B. Rotenberg and M. Salanne, J. Phys. Chem. Lett. 6, 4978 (2015).
- Li et al. (2018) Z. Li, G. Jeanmairet, T. Mendez-Morales, B. Rotenberg, and M. Salanne, J. Phys. Chem. C 122, 23917 (2018).
- Scalfi and Rotenberg (2021) L. Scalfi and B. Rotenberg, Proceedings of the National Academy of Sciences 118, e2108769118 (2021), publisher: National Academy of Sciences Section: Physical Sciences.
- Fumagalli et al. (2018) L. Fumagalli, A. Esfandiar, R. Fabregas, S. Hu, P. Ares, A. Janardanan, Q. Yang, B. Radha, T. Taniguchi, K. Watanabe, G. Gomila, K. S. Novoselov, and A. K. Geim, Science 360, 1339 (2018).
- Olivieri et al. (2021) J.-F. Olivieri, J. T. Hynes, and D. Laage, The Journal of Physical Chemistry Letters 12, 4319 (2021), publisher: American Chemical Society.
- Loche et al. (2018) P. Loche, C. Ayaz, A. Schlaich, D. J. Bonthuis, and R. R. Netz, The Journal of Physical Chemistry Letters 9, 6463 (2018).
- Gekle and Netz (2012) S. Gekle and R. R. Netz, The Journal of Chemical Physics 137, 104704 (2012).
- Mondal and Bagchi (2021) S. Mondal and B. Bagchi, The Journal of Chemical Physics 154, 044501 (2021).
- Zhang et al. (2020) Y. Zhang, G. Stirnemann, J. T. Hynes, and D. Laage, Phys. Chem. Chem. Phys. 22, 10581 (2020).
- Limmer et al. (2013b) D. T. Limmer, A. P. Willard, P. Madden, and D. Chandler, Proc. Natl. Acad. Sci. U.S.A. 110, 4200 (2013b).
- Limmer et al. (2015) D. T. Limmer, A. P. Willard, P. A. Madden, and D. Chandler, J. Phys. Chem. C 119, 24016 (2015).
- Kavokine et al. (2022) N. Kavokine, M.-L. Bocquet, and L. Bocquet, Nature 602, 84 (2022).
- (54) See Supplemental Material at [URL will be inserted by publisher] for a detailed derivation of the relation between admittance/impedance and electrode charges, simulation details, static properties, a description of the numerical procedure used to calculate impedance from simulation results, a thorough discussion on the computed electric properties and the equivalent circuit models used to fit the atomistic results, and the relation between the total dipole moment of water and the total electrode charge .
- Marin-Laflèche et al. (2020) A. Marin-Laflèche, M. Haefele, L. Scalfi, A. Coretti, T. Dufils, G. Jeanmairet, S. K. Reed, A. Serva, R. Berthin, C. Bacon, S. Bonella, B. Rotenberg, P. A. Madden, and M. Salanne, Journal of Open Source Software 5, 2373 (2020).
- Jeanmairet et al. (2019) G. Jeanmairet, B. Rotenberg, D. Borgis, and M. Salanne, J. Chem. Phys. 151, 124111 (2019).
- Schlaich et al. (2016) A. Schlaich, E. W. Knapp, and R. R. Netz, Physical Review Letters 117, 048001 (2016).
- Cox and Geissler (2022) S. J. Cox and P. L. Geissler, “Dielectric response of thin water films: A thermodynamic perspective,” (2022), number: arXiv:2203.00575 [cond-mat].
- Carlson et al. (2020) S. Carlson, F. N. Brünig, P. Loche, D. J. Bonthuis, and R. R. Netz, The Journal of Physical Chemistry A 124, 5599 (2020).
- Popov et al. (2016) I. Popov, P. B. Ishai, A. Khamzin, and Y. Feldman, Physical Chemistry Chemical Physics 18, 13941 (2016), publisher: The Royal Society of Chemistry.
- Pireddu et al. (2021) G. Pireddu, L. Scalfi, and B. Rotenberg, The Journal of Chemical Physics 155, 204705 (2021), https://doi.org/10.1063/5.0076127 .
- Serva et al. (2021) A. Serva, L. Scalfi, B. Rotenberg, and M. Salanne, The Journal of Chemical Physics 155, 044703 (2021), publisher: American Institute of Physics.
- Scalfi et al. (2020b) L. Scalfi, T. Dufils, K. G. Reeves, B. Rotenberg, and M. Salanne, The Journal of Chemical Physics 153, 174704 (2020b).
- Cats et al. (2021) P. Cats, R. S. Sitlapersad, W. K. den Otter, A. R. Thornton, and R. van Roij, Journal of Solution Chemistry (2021), 10.1007/s10953-021-01090-7.
- Heyden et al. (2010) M. Heyden, J. Sun, S. Funkner, G. Mathias, H. Forbert, M. Havenith, and D. Marx, Proceedings of the National Academy of Sciences 107, 12068 (2010).
- Alfarano et al. (2021) S. R. Alfarano, S. Pezzotti, C. J. Stein, Z. Lin, F. Sebastiani, S. Funke, C. Hoberg, I. Kolling, C. Y. Ma, K. Mauelshagen, T. Ockelmann, G. Schwaab, L. Fu, J.-B. Brubach, P. Roy, M. Head-Gordon, K. Tschulik, M.-P. Gaigeot, and M. Havenith, Proceedings of the National Academy of Sciences 118, e2108568118 (2021).
- Lesnicki et al. (2020) D. Lesnicki, C. Y. Gao, B. Rotenberg, and D. T. Limmer, Phys. Rev. Lett. 124, 206001 (2020).
- Lesnicki et al. (2021) D. Lesnicki, C. Y. Gao, D. T. Limmer, and B. Rotenberg, J. Chem. Phys. 155, 014507 (2021).
- Dwelle and Willard (2019) K. A. Dwelle and A. P. Willard, J. Phys. Chem. C 123, 24095 (2019).