Organic chemistry in the first phases of Solar-type protostars
Abstract
Planetary systems such as our own are formed after a long process where matter condenses from diffuse clouds to stars, planets, asteroids, comets and residual dust, undergoing dramatic changes in physical and chemical state in less than a few million years.
Several studies have shown that the chemical composition during the early formation of a Solar-type planetary system is a powerful diagnostic to track the history of the system itself.
Among the approximately 270 molecules so far detected in the ISM, the so-called interstellar complex organic molecules (iCOMs) are of particular interest both because of their evolutionary diagnostic power and because they might be potential precursors of biomolecules, which are at the basis of terrestrial life.
This Chapter focuses on the evolution of organic molecules during the early stages of a Solar-type planetary system, represented by the prestellar, Class 0/I and protoplanetary disk phases, and compares them with what is observed presently in Solar System comets.
Our twofold goal is to review the processes at the base of organic chemistry during Solar-type star formation and, in addition, to possibly provide constraints on the early history of our own planetary system.
objoidxoindObject Index
1 INTRODUCTION: A HISTORICAL PERSPECTIVE
Since the discovery of the first diatomic molecule, CH, in the interstellar medium (ISM) at the end of the 1930’s, new molecular discoveries have been made steadily over time. Most of the ISM molecules have been discovered by the use of telescopes in the radio, millimeter (mm) and far-infrared (FIR) wavelengths, where molecules have rotational and ro-vibrational lines. As of the present, the number of identified ISM molecules is about 280, of which about 40% contain at least six atoms111https://cdms.astro.uni-koeln.de/classic/molecules.. Importantly, all these ”large” molecules possess at least one carbon atom, a fact that already suggests a potential link between interstellar chemistry and terrestrial life. Indeed, in the zoo of detected species, they are considered special and are called ”interstellar Complex Organic Molecules” (iCOMs or COMs: Ceccarelli et al., 2017; Herbst and van Dishoeck, 2009). The lower case ”i” is meant to emphasize that the adjective ”complex” only applies in the context of the ISM. Table 1 lists the names and the chemical formulae of the iCOMs most commonly found in Solar-type star-forming regions.
Since the first discovery of formamide (NH2CHO) by Rubin et al. (1971), iCOMs have aroused the curiosity of astronomers. The discovery that iCOMs are numerous and very abundant in massive star forming regions (Blake et al., 1987) started to represent a serious challenge for astrochemists (e.g. Charnley et al., 1992). Eventually, the discovery of numerous and abundant iCOMs in Solar-type protostars (Cazaux et al., 2003) suggested a potential link between interstellar chemistry and the emergence of life on Earth. Understanding how iCOMs are formed and whether they are passed on to nascent planets, comets and asteroids then became a major topic of astronomy.
At present, two major iCOM formation paths have been evoked in the literature, reviewed in Sec. 2. The first one, of which a first version was in vogue until about 2005, postulates that during the cold and quiescent phases of molecular cloud and prestellar core, the interstellar dust grains are enveloped by ice mantles which sublimate when a protostar appears at the centre and warms up the surrounding dust (Millar et al., 1991; Charnley et al., 1992). The mantle components are ejected into the gas-phase and undergo reactions that form new and more complex molecules. However, in 2005, a breakthrough occurred with an experiment that showed that the electron recombination of protonated methanol breaks the species into smaller species (Geppert et al., 2006) rather than producing methanol, which was the assumption of the epoch. In addition, in 2004, theoretical chemical computations showed that an abundant and common iCOM, methyl formate (HCOOCH3), could not be formed by any known gas-phase reaction (Horn et al., 2004). These negative results proved to be the death of the theory for most iCOMs.
| Name | Formula | BE | Ref.a | |
| (K) | ( s-1) | |||
| Methanol | CH3OH | 3770–8618 | 1, 2 | |
| Formic acidb | HCOOH | 5382–10559 | 1 | |
| Acetaldehyde | CH3CHO | 2809–6038 | 3 | |
| Methyl formate | HCOOCH3 | – | – | – |
| Glycolaldehyde | HCO(CH2)OH | – | – | – |
| Acetic acid | CH3COOH | – | – | – |
| Dimethyl ether | CH3OCH3 | – | – | – |
| Acetone | CH3COCH3 | – | – | – |
| Ethanol | CH3CH2OH | 4 | ||
| Propanal | CH3CH2CHO | – | – | – |
| Ethylene glycol | (CH2OH)2 | 5 | ||
| Methyl cyanide | CH3CN | 4745–7652 | 1 | |
| Ethyl cyanide | CH3CH2CN | – | – | – |
| Cyanoacetylene | HC5N | – | – | – |
| Formamide | NH2CHO | 5793–10960 | 1, 6 |
NOTES: a References: 1, Ferrero et al. (2020); 2, Minissale et al. (2022); 3, Ferrero et al. (2022); 4, Private communication from J. Enrique-Romero; 5, Bianchi et al. (2022c); 6, Chaabouni et al. (2018). b Formic acid is included in the list, although it is not an iCOM by strict definition, because it contains three heavy atoms and is an important organic molecule.
The view of several astrochemists became that, if iCOMs cannot form in the gas-phase, they must be synthesized on the grain surfaces. After all, the most abundant molecule, H2, is known to be a grain-surface product (e.g. van de Hulst, 1946; Hollenbach and Salpeter, 1970; Vidali, 2013). Following this idea, Garrod and Herbst (2006) developed a new theory, in which grain-surface chemistry can produce iCOMs during the warm-up phase (see Sec. 2 for more detail). Several laboratory experiments starting in the 90s had already shown that, if an ice with a composition similar to that observed in the ISM by IR absorption observations (see the review by Boogert et al., 2015) is illuminated by UV photons (Schutte et al., 1992; Bernstein et al., 1995, 1999) or energetic particles (Strazzulla, 1997; Palumbo et al., 1999), several very complex molecules are formed on the ice. The most recent experiments show that even amino acids and nucleobases can be found after irradiation by UV photons or energetic particle irradiation (e.g. Muñoz Caro et al., 2002; de Marcellus et al., 2015; Oba et al., 2019). Following this idea, several studies have been carried out to better constrain the pathways to iCOMs induced by photolysis and radiolysis (see e.g. the review by Öberg, 2016). Finally, recent experimental studies have shown that iCOMs and even glycine could be formed via non-energetic processes on CO-rich ices irradiated by thermal H atoms (e.g. Qasim et al., 2019; Ioppolo et al., 2021; Fedoseev et al., 2022).
1.6 \plotonesec2-chemistry-scheme.png
Left blue panel: In the Gas + grain chemistry path, the mantle components are either partially or completely injected into the gas-phase by thermal and non-thermal desorption processes (§ 2.3), where they undergo gas-phase reactions that form iCOMs (§ 2.4). This path can occur either via mantle thermal desorption (§ 2.3.1) in hot corinos (Sec. 4) and inner protoplanetary disks (Sec. 5), or via mantle non-thermal desorption (§ 2.3.2) in prestellar cores (Sec. 3), outer protoplanetary disks (Sec. 5) and molecular outflows (Sec. 6).
Right brown panel: In the Only grain chemistry path, the icy mantles are processed by UV (photolysis) and CR (radiolysis) irradiation while being formed (§ 2.5.1). When the dust temperature increases, radicals on the mantles become mobile and diffuse (§ 2.5.2) and, when they meet, they combine forming iCOMs (§ 2.5.4). Alternatively, non-diffusive processes can also combine radicals into iCOMs (§ 2.5.3). Likewise, some radicals are also predicted to meet and react in non-diffusive processes during the cold phase.
After more than 15 years, the ”grain-surface does all” theory is starting to have its own problems. First, since 2012, observations have shown that iCOMs are numerous and relatively abundant (see Sec. 3) in cold ( K) prestellar cores, where a warm-up phase is absent. Therefore, these observations pose a significant challenge to the original version of the Garrod and Herbst (2006) theory and to astrochemistry in general. At the same time, new laboratory experiments have proved that some neutral-neutral gas-phase reactions, previously thought to be highly inefficient at the low temperatures of the ISM, actually become very fast, thanks to the quantum tunneling of pre-reactive complexes (Shannon et al., 2013). Finally, deep searches of the chemical literature have demonstrated that important gas-phase reactions are missing in the astrochemical networks (Balucani et al., 2015) and new quantum chemical calculations have been enriching the databases with new gas-phase routes (Barone et al., 2015; Skouteris et al., 2018). The game is once again afoot. Very likely, both grain-surface and gas-phase chemistry collaborate to yield the zoo of iCOMs now known to be present in Solar-type star forming regions.
In addition, whatever the formation route, in cold and dense regions, such as in prestellar cores and protoplanetary disks, some mechanism has to be able to remove iCOMs from the grain mantles and inject them into the gas-phase, where they are detected. This is a challenge for our understanding of the iCOM chemistry and the current models. Several non-thermal processes have been proposed in the literature, (see Sec. 2), which depend on several poorly known parameters. A crucial one, common to almost all non-thermal processes, is the binding energy of the iCOMs, namely the energy necessary to release the frozen molecule into the gas. New experiments and theoretical calculations are also finally providing information on these processes and parameters, which are absolutely necessary for the interpretation of the astronomical observations.
In this Chapter, we review the state of the art, by first introducing the basics about iCOM chemistry (Sec. 2) and then describing and discussing each step of the early phases of Solar-type star formation: prestellar cores (Sec. 3), protostars (Sec. 4), protoplanetary disks (Sec. 5), molecular outflows, which offer a unique chemistry laboratory (Sec. 6), and comets, which permit us to forge the link between the present Solar System and the inheritance of interstellar organic chemistry (Sec. 7). A final section (Sec. 8) concludes the Chapter.
2 iCOM FORMATION: GAS-PHASE AND GRAIN-SURFACE CHEMISTRY
2.1 Overview
Two major paths have been invoked in the literature for the formation of iCOMs in the ISM, as summarized in Fig. 1 and here named Gas + grain chemistry and Only grain chemistry, respectively.
The first step (§ 2.2), common to both theories, mainly occurs during the cold molecular cloud and prestellar core phases (Sec. 3), with the formation of icy mantles covering the interstellar grains. Atoms and small molecules remain glued to the grains when they hit them and, there, they are hydrogenated and oxidized (§ 2.2.1) (e.g. Tielens and Hagen, 1982). In this way, water, CO2, methanol, ammonia and methane become the major components of the icy mantles, as observed in the Near Infrared (NIR) (e.g. Boogert et al., 2015). As soon as the first layers of water ice are formed, (small) radicals landing on the grain surfaces can also react with the iced water molecules to form some iCOMs, such as ethanol (Perrero et al., 2022). After this first step, the two paths diverge.
In the Gas + grain chemistry path (§ 2.4), depending on the temperature, thermal and non-thermal processes release the grain mantle components into the gas-phase, partially or completely (§ 2.3). Once in the gas-phase, the mantle components react with the other gaseous species and form, among other species, iCOMs other than those formed in the first step (e.g. Vasyunin and Herbst, 2013; Balucani et al., 2015; Skouteris et al., 2018).
In the Only grain chemistry path (§ 2.5), the grain mantles are processed by UV (photolysis) and cosmic-rays (CR) (radiolysis) irradiation, forming numerous and abundant radicals in their bulk (§ 2.5.1). These radicals become mobile when the dust temperature increases to about 20–30 K (§ 2.5.2). When the radicals meet on the surfaces they can react and form iCOMs (§ 2.5.4) (e.g. Garrod and Herbst, 2006; Garrod et al., 2008; Ruaud et al., 2015; Aikawa et al., 2020). Alternatively, non-diffusive processes can also cause the radicals to meet on the grain surface and react to form iCOMs (§ 2.5.3) (Jin and Garrod, 2020; Garrod et al., 2022). Finally, the iCOMs formed on the grain surfaces are released into the gas-phase, where they are observed, by thermal and non-thermal processes (§ 2.3).
Probably, both gas-phase and grain-surface chemistry are at work in the ISM, dominating the formation of different iCOMs in different environments and at different times.
In the following, we will review the major processes which enter into the formation of iCOMs as well as their presence in the gas-phase, where they are observed: the grain mantle formation (§ 2.2) and desorption processes (§ 2.3), the gas-phase (§ 2.4) and grain-surface (§ 2.5 chemistry, as well as theories alternative to the two reported in Fig. 1 (§ 2.6). The overview of all the above mentioned processes and their interaction is schematised in Fig. 1, where the paragraphs in which they are discussed are also reported. Our goal is to provide the general ideas behind the astrochemical models that are used to interpret the astronomical observations as well as the uncertainties caused by our limited knowledge of the involved basic processes.
2.2 Mantle formation
The grain mantles are mostly made up of water, CO and CO2 with less abundant hydrogenated species such as ammonia, formaldehyde and methanol, as shown by IR solid-state astronomical observations (Boogert et al., 2015).
2.2.1 Hydrogenation and oxidation of atoms/molecules
In general, there is ample consensus on the fact that atoms and simple molecules (e.g. CO) are hydrogenated and oxygenated when they freeze-out onto the grain surfaces. The simple iCOM methanol is believed to be prevalently formed in this way, via the successive addition of H atoms to the frozen CO (e.g. Watanabe and Kouchi, 2002; Rimola et al., 2014). However, even though several laboratory experiments have been carried out and showed the feasibility of the process, the details which enter into the astrochemical models are not completely understood.
Two major questions are still open: (1) how the H atoms diffuse on the icy grain surfaces and (2) what is the barrier of the CO + H and H2CO + H reactions. For example, models often assume that H atoms diffuse on the icy grain surfaces via hopping (e.g. Garrod, 2013; Aikawa et al., 2020), while recent sophisticated quantum mechanical (QM) studies by Senevirathne et al. (2017) show that below K tunneling dominates in amorphous ice. Actually, the relative contribution of H hopping versus tunneling is very difficult to quantify, since it depends on the ice surface structure (Hama et al., 2012). In addition, in the (many) astrochemical models adopting the Garrod (2013) recipes and parameters, the diffusion energy of H is underestimated with respect to the theoretical results by Senevirathne et al. (2017), with a consequent overestimate of the H diffusion. Likewise, in the same models, the energy barriers of the CO + H and H2CO + H reactions are assumed to be rectangular with a width derived from gas-phase computations (Garrod, 2013). However, when compared with the theoretical QM calculations that takes into account the icy surfaces, the rates of CH3OH formation are underestimated by orders of magnitude (Song and Kästner, 2017).
2.2.2 Radical-water ice reactions
Recent theoretical studies have shown that some iCOMs can be formed on water-ice-rich surfaces by reactions of radicals, landing from the gas-phase into the grain surface, with the water molecules of the ice itself. Rimola et al. (2018) studied the case of the formation of formamide by the reaction of CN with H2O to form HNCOH, followed by an H atom addition. More recently, Perrero et al. (2022) showed that ethanol can be formed by the reaction of CCH with one water molecule of ice, plus successive hydrogenation by landing H atoms. Finally, Molpeceres et al. (2021) showed that C atoms landing on the icy grain surfaces react with water molecules and form formaldehyde. The study of the radical-ice water route of formation is at its infancy and may give an interesting alternative path to some iCOM formation not involving radical-radical combination on the grain surfaces.
2.3 Mantle desorption
In interstellar clouds, molecules adsorbed onto mantles of icy material can desorb either thermally (§ 2.3.1) or non-thermally (§ 2.3.2).
2.3.1 Thermal desorption
The thermal desorption of a species bound to a substrate can be approximately described by the Polanyi-Wigner equation (Kolasinski, 2002). The first-order solution pertains to adsorbate molecules that are not strongly associated with each other. This occurs in most cases, when they are adsorbed on a surface made of other species (e.g. water or CO). Under these conditions, the solution for the rate of desorption is given by:
| (1) |
where is the desorption energy, which is approximately the binding energy (BE), given in units of temperature, and is the pre-exponential factor, which depends on the adsorbate and surface (Minissale et al., 2022). We will discuss in some detail both quantities because they have an important impact on the astrochemical models.
Thermal desorption is rarely important at 10 K except for atomic hydrogen and a few other light physisorbed species where van der Waals and dispersion forces keep the species bound to the surface because the desorption energy is typically large enough to keep the adsorbate bound. As the temperature increases, the more volatile adsorbates begin to desorb, and by a temperature of typically 100–120 K, thermal desorption has become an important process for a variety of molecular species.
An intermittent form of thermal desorption is powered by CR which, when they strike the grains, heat them to a temperature that could cause the sublimation of species frozen in the grain mantles (Leger et al., 1985; Hasegawa and Herbst, 1993; Roberts and Millar, 2007; Sipilä et al., 2021).
Overview of the BE and derivation
BE and can be either measured via laboratory experiments or estimated via QM computations. Minissale et al. (2022) provide a recent and detailed review of both techniques. Here we briefly discuss the limitations on the published data used in astrochemical models.
In laboratory experiments, BE and are simultaneously derived from the so-called TPD (Thermal Programmed Desorption) experiments. The species is deposited or co-deposited over a cold (typically 10 K) surface, which is then heated at a constant rate and the sublimation rate into the gas-phase measured as a function of time. Therefore, TPD experiments strictly measure rates of desorption. BE and are then derived from the desorption rate curve by using Eq. 1 (e.g. He et al., 2016).
Theoretical calculations compute the energy necessary for the adsorbate species to leave the surface using the TST (Transition State Theory) methodology. The theoretical works usually only provide the BE value, without reporting , even though it is a product of the calculations (e.g. Ferrero et al., 2022).
In general, the pre-exponential factor can be analytically calculated, following the recipe given by Tait et al. (2005) (see the discussion in Minissale et al., 2022; Ferrero et al., 2022). For relatively large molecules, such as acetaldehyde, is s-1 (Ferrero et al., 2022).
Both recent experiments and theoretical computations have shown that, actually, there is not a unique BE for each species, but rather a distribution of BEs that reflects that the bond of the adsorbed species depends on the site and the species orientation (e.g. Ferrero et al., 2020; Bovolenta et al., 2020; Tinacci et al., 2022b). Astrochemical models often, but not always (e.g. Grassi et al., 2020), use one single value for the BE, and assume s-1, following the recipe by Hasegawa and Herbst (1993), regardless of the source of the BE evaluation. However, as it is the case for acetaldehyde, could be as large as s-1, depending on the species and the method used to derive the BE (e.g. Ferrero et al., 2022). A review of the is reported in Minissale et al. (2022, see also their Fig. 14).
BE and of iCOMs
In general, only the BE and of a few species have been measured in the laboratory (e.g. Collings et al., 2004; He et al., 2015, 2016; Corazzi et al., 2021; Ferrero et al., 2022) or computed (e.g. Wakelam et al., 2017; Das et al., 2018; Ferrero et al., 2020, 2022; Tinacci et al., 2022b). The computations refer to the bond energy of one water molecule (Wakelam et al., 2017), a more complex situation with up to six water molecules (Das et al., 2018), to models of amorphous water ice clusters (Ferrero et al., 2020, 2022), and to models of water-ice grains (Germain et al., 2022; Tinacci et al., 2022b), the most reliable. The iCOMs where BE and have been either measured or evaluated on an ice cluster of more than 20 water molecules are listed in Tab. 1. Clearly, there is a massive lack of data in this respect and this is a first serious warning for the astrochemical models.
To illustrate the impact of the assumed pre-exponential factor value (Eq. 1), Fig. 2 shows the sublimation temperature of frozen methanol (whose BE is taken equal to 6200 K) and formamide (BE = 8400 K) as a function of the heating time, which often, but not always, corresponds to the age of the studied astronomical object. Two values are assumed for (see discussion above). To obtain the sublimation temperature we used the half-life time (=ln(2)/) of the frozen species. Taking the example of methanol, if the heating time is yr then the sublimation temperature would be K, while if it is yr it is K. Likewise, the difference due to the pre-exponential factor assumed and s-1 is K.
In the context of iCOM formation on the grain surfaces by the combination of radicals (HCO, CH3, NH2 et cetera), the BE of the latter is also a crucial parameter because it defines the range within which the radicals remain on the surface and can, therefore, react with each other. Actually, the diffusion energy, which regulates whether radicals can move on the grain surfaces, is also a function of BE. At the time of this Chapter writing, there are no laboratory measurements of the binding energies of radicals, because they are extremely difficult to obtain. Theoretical calculations on models of amorphous water ice exist for a few molecular radicals: O2, OH, HCO, CH3 and NH2 (e.g. Ferrero et al., 2020).

2.3.2 Non-Thermal desorption
There are a number of different mechanisms for non-thermal desorption at low temperatures, only some of which are reasonably well studied. Common to all of these mechanisms is a source of energy to augment the low temperature in the grain mantle. Several mechanisms are discussed here.
Chemical or reactive desorption
Chemical or reactive desorption occurs when a surface reaction possesses sufficient exothermicity to overcome the binding energy of the products. This process is analogous to what chemists refer to as unimolecular dissociation, which is governed by the well-known RRKM (Rice–Ramsperger–Kassel–Marcus) theory, or its simpler version, the RRK model (e.g. Di Giacomo, 2015). An approximation to the fraction of products released into the gas-phase through chemical desorption based on the RRK approximation predicts approximately 1% (Garrod et al., 2007).
More recent and more sophisticated studies appearing in the literature have challenged this simplified and usual assumption. For example, Pantaleone et al. (2020) have simulated the chemical desorption of the reaction H + CO HCO via ab initio molecular dynamics simulations. These authors found that the reaction energy ( eV) is largely absorbed by the icy grains in less than 1 ps, leaving the newly formed HCO radical with too little energy to break the bonds with the water surface. As a consequence, very little or no chemical desorption is expected to occur in this case, as was also found in the experimental studies by Minissale et al. (2016). On the other hand, Pantaleone et al. (2021) studied the H + H H2 reaction and found that the reaction energy ( eV) is also largely absorbed by the water ice but the remaining fraction ( eV) allows the newly formed H2 to desorb, thanks to its low BE. Therefore, each system behaves in a different way and the result depends on the reaction energy, the efficiency of the water ice to absorb it and the BE of the formed species. Finally two systematic experimental studies have provided a semi-empirical theory, in which the chemical desorption depends on the species and on the substrate (Minissale et al., 2016; Yamamoto et al., 2019).
With respect to iCOMs, methanol is the only species for which estimates of the chemical desorption efficiency exist (Minissale et al., 2016; Chuang et al., 2018; Pantaleone et al., 2020). Experiments showed that the chemical desorption efficiency caused by the addition of H atoms to frozen CO and the partially hydrogenated species HCO, H2CO, CH3O and CH3OH, is very low (2 %) on water-rich surfaces, (Minissale et al., 2016; Chuang et al., 2018), in agreement with theoretical predictions (Pantaleone et al., 2020). Chemical desorption for other iCOMs forming on the grain surfaces are at present unknown.
Photodesorption
Another non-thermal mechanism often invoked in the literature is photodesorption via UV radiation. This process has been studied in the laboratory although this direct process can be confused with photodissociation, in which the smaller products are the species that desorb. The direct process appears to occur with a yield of for CO (Fayolle et al., 2011). In these experiments, the photodesorption spectrum tends to mimic the gas-phase spectrum (Fayolle et al., 2011), namely the gas-phase absorption spectrum of CO as a function of frequency and the desorption spectrum of CO from a surface look the same in frequency with the desorption spectrum having greater linewidths. A lower average efficiency of for methanol is thought to occur because of the simultaneous photodissociation of the species (Bertin et al., 2016; Martín-Doménech et al., 2016).
CR-induced desorption
Recent experiments have shown that sputtering by heavy CR can potentially produce gaseous methanol, originally frozen on the grain mantles (Dartois et al., 2015, 2019). Please note that this process is not to be confused with the CR-induced thermal desorption described in § 2.3.1, in which the CR serve only to increase the temperature.
Sputtering
In molecular shocks, frozen species can be injected into the gas-phase because of sputtering caused by the ion-neutral drift velocity (Draine, 1995; Flower and Pineau des Forets, 1995). Several models exist in the literature to predict the amount of sputtered species, especially when the latter is SiO, a common shock tracer (e.g. Flower and Pineau des Forets, 1995; Caselli et al., 1997). In addition to the treatment of the physical and dynamical structure of the shocked gas, the crucial parameter in these models is the so-called threshold energy of each species, which is the energy of the projectile needed to extract the species from the grain mantle. There is more than one treatment to evaluate the threshold energy and, not surprisingly, all depend on the BE of the species on the surface (e.g. May et al., 2000).

Among the iCOMs, only methanol has been the focus of specific studies (May et al., 2000; Jiménez-Serra et al., 2008) even though it is predicted by the Paris-Durham shock model, which is publicly available222https://ism.obspm.fr/shock.html (Lesaffre et al., 2013). While there are studies on the threshold of species such as SiO and CO on silicate surfaces (e.g. May et al., 2000), no specific experimental or theoretical studies exist about methanol on water- or CO- rich ices, to the best of our knowledge. The methanol threshold energy is assumed to be equal to that of water in the Paris-Durham shock model.
2.4 Gas-phase formation of iCOMs
2.4.1 Overview
Once the precursor molecules formed in the icy mantle of interstellar grains have desorbed, molecular complexity can increase further through gas-phase reactions. In addition, the main destruction routes included in astrochemical models occur in the gas-phase.
In the low densities of Solar-type star forming regions, the most important gas-phase reactions that lead to an increase in chemical complexity are bimolecular reactions. This is because three-body collisions are too rare except in the innermost and densest regions of protoplanetary disks (Sec. 5). The same is true also for their destruction routes. In addition, given the low temperatures, only reactions which are exothermic are possible. Exothermicity, however, is insufficient because bimolecular reactions will not take place unless the reactants collide with a certain amount of energy called the ”activation energy” () of the reaction. The activation energy can be seen as the energy involved in breaking or weakening the original bonds before the new ones are formed and only those collisions with energies equal to or greater than the activation energy will result in a reaction. At low temperatures, sometimes, tunneling under the activation energy could be important. For this reason, bimolecular reactions of interest in astrochemistry always involve either a radical or an ion; that is, transient species with unpaired electrons, the reactions of which are usually characterized by a very small ( kJ/mol) or null activation energy.
Two major classes of reactions can form iCOMs in the gas-phase: ion-neutral and neutral-neutral reactions. In Fig. 3, the potential energy profiles of typical bimolecular reactions (upper panels) and the corresponding Arrhenius plots (that is, the variation of the rate coefficient with the temperature, lower panels) are shown. If a reaction is characterized by an activation energy, , the rate coefficient increases with increasing temperature. If the activation energy is null (barrierless reactions), the rate coefficient is either temperature independent or exhibits a slightly negative dependence. For this reason, until recently only reactions with null have been considered in astrochemical models. However, recent experiments based on the CRESU333Cinétique de Réaction en Ecoulement Supersonique Uniforme, which stands for Reaction Kinetics in a Uniform Supersonic Expansion. technique have shown a very interesting effect: the presence of a pre-reactive complex before the system surpasses the activation energy can make the reaction efficient also at temperatures that are too low to overcome the barrier, via the tunneling effect (see below). Note that Fig. 3 refers mainly to neutral-neutral systems; the rate constants of ion-neutral reactions have more restrictive possibilities. Reactions with non-polar neutrals are temperature-independent, while reactions with polar ions are inversely dependent on the square root of temperature.
We will briefly describe ion-neutral and neutral-neutral reactions in the following subsections. Finally, § 2.7 will discuss the state-of-art of astrochemical gas-phase reactions networks.
2.4.2 Ion-neutral reactions
As briefly mentioned in the Introduction, interstellar gas-phase chemistry was initially based mostly on ion-neutral reactions, because of their large rate coefficients at the low temperatures of the ISM (Herbst and Klemperer, 1973; Watson, 1974; Dalgarno and Black, 1976). The final step in the complex ion-neutral reaction chains was supposed to be the conversion of the ionic species into their neutral counterparts, via electron-ion recombination reactions with the release of one H atom and the preservation of the ion molecular skeleton. Later on, however, it was shown that electron-ion recombination reactions are strongly dissociative because of the large amount of energy released in the process and that the major product channels most often consists of small neutral moieties (Geppert et al., 2006). Product channels dominated by the release of one hydrogen atom, on the other hand, rarely account for more than a few percent of products.
2.4.3 Neutral-neutral reactions
The role of neutral-neutral reactions was only recognized in the 90’s after the introduction of an experimental method that allowed investigation of the kinetics of bimolecular reactions at very low temperatures, based on the CRESU technique(Smith and Rowe, 2000).
At present, the characterization of neutral-neutral reactions relies on three complementary approaches: (1) the CRESU technique, to derive low temperature global rate coefficients; (2) collision-free experiments, to derive the nature of the primary reaction products and their branching ratios; and (3) QM theoretical computations, to derive potentials and rates for chemical reactions. This combined effort is necessary because the CRESU technique is able to characterize gas-phase reactions under the appropriate temperature conditions, but cannot reproduce the low number density environment typical of the ISM, while collision-free beam experiments are able to reproduce the low number density environment, but not the low temperature conditions, (e.g. Casavecchia et al., 2009, 2015), with the exception of the Bordeaux apparatus developed by Costes and Naulin (2010).
Finally, QM theoretical calculations are essential not only to support the interpretation of the experimental data, but also to assist the extrapolation of the experimental results. In addition, when no experimental data are available, a theoretical characterization of a gas-phase reaction can provide a realistic estimate of the reaction rate coefficients and product branching ratios (e.g. Sleiman et al., 2018; Ocaña et al., 2018, 2019; Nguyen et al., 2019).
Reactions characterized by a pre-reactive complex and an activation energy have recently attracted much attention (see Fig. 3). In particular, the reactions of the abundant OH radical with several oxygenated iCOMs fall in this category and their investigation has had a profound influence in the understanding of interstellar chemistry. The effect is double: on the one hand, the reaction of oxygenated iCOMS with OH must be considered as an efficient destruction route of those species because of the abundance of the OH radical. On the other hand, the radicals formed by the H-abstraction process can react further and be involved in the formation of other iCOMs (e.g. Shannon et al., 2013; Balucani et al., 2015).
The most important case of this family is the reaction between OH and CH3OH. This reaction is known to have an experimental activation energy ( kJ mol-1) (e.g. Shannon et al., 2013; Roncero et al., 2018). In spite of that, below 200 K the rate coefficient changes its slope with the temperature and starts increasing with decreasing temperature (see Fig. 3). The values below 100 K can be larger by a factor of 103 with respect to the room temperature value. The explanation for such a strong effect has been rationalized by invoking the role of a pre-reactive complex (Shannon et al., 2013; Roncero et al., 2018), which is formed by the strong H-bond interaction between the OH radical and the -OH functional group of methanol. At very low temperature, the pre-reactive complex, characterized by a relatively deep potential well, can live for a time long enough to have a significant probability to tunnel through the barrier rather than re-dissociate back to reactants (Heard, 2018).
Concerning the reactions for which no experimental data exist but QM theoretical computations have been carried out, illustrative successful examples are the reaction NH2 + H2CO (Barone et al., 2015; Skouteris et al., 2017), the only formation gas-phase route of formamide known so far, and the reaction O + CH3CH2OH (Skouteris et al., 2018) on which an entire reaction chain to form very common iCOMs is derived, including glycolaldehyde and acetaldehyde.
Finally, barrierless reactions mostly occur via the formation of one (or more) covalently bound intermediate(s) (see middle panel of Fig. 3). In the absence of three-body collisions, the intermediate cannot be stabilized by dispersing part of its internal energy and, if exothermic exit channels are open, its high internal energy content leads to its fragmentation into one or more sets of bimolecular products. In astrochemistry, however, radiative association might occur, i.e., the intermediate can lose part of its internal energy by emitting a photon (Herbst, 1985). Normally, these processes are not competitive because the typical reaction time is of the order of picosecond while spontaneous emission occurs within milliseconds. However, if no exothermic channels exist and the intermediate can only re-dissociate back to reactants, radiative association can occur with a significant rate coefficient. An important case is represented by the reaction CH3 + CH3O forming dimethyl ether (Vasyunin and Herbst, 2013; Balucani et al., 2015), for which theoretical computations predict large reaction constants (Tennis et al., 2021).
1.5 \plotonesec2-radrad-reactions.png
2.5 Only grain chemistry formation of iCOMs
This theory, inspired by numerous laboratory experiments (e.g. Öberg et al., 2009; Linnartz et al., 2015; Kaiser et al., 2015), was first proposed by Garrod and Herbst (2006) and is based on three fundamental steps: (i) the formation of radicals by UV photons induced by CR irradiation (§ 2.5.1), (ii) the diffusion of radicals when the dust temperature increases to 20–30 K, so that radicals become mobile (§ 2.5.2), and (iii) the combination of radicals into iCOMs (§ 2.5.4). Subsequently, always inspired by laboratory experiments (e.g. Theulé et al., 2013; Qasim et al., 2019; Ioppolo et al., 2021), a new theory, called non-diffusive grain surface chemistry, was developed where the step (ii) of the previous one is not necessary (§ 2.5.3).
2.5.1 Mantle processing
During the formation of the grain mantles, which are enriched in water, ammonia, methanol, formaldehyde and methane, CR-induced UV photons penetrate the mantles and photo-dissociate the frozen species creating radicals. For example, OH and CH3 are formed from the photo-dissociation of methanol. The rate at which the radicals are formed is usually assumed to be equal to that in the gas-phase, which is probably an overestimation. For example, based on modeling of ice formation following the Garrod et al. (2008) scheme and recipes, Kalvāns (2018) estimated that, in order to reproduce the observed solid-phase carbon oxides and ammonia, the rate of radical formation should be a factor 3 lower than that in the gas-phase.
2.5.2 Radical diffusion
The motion of radicals involves hopping over potential barriers, the so-called diffusion energy (DE) barriers, normally treated as a fraction of the desorption barrier (Hasegawa et al., 1992). Therefore, the diffusion of radicals depends on their BE and the fraction DE/BE. We already noted that the BEs of only a few radicals have been computed and published in the literature (§ 2.3). To the best of our knowledge, there are no measurements nor computations of the fraction DE/BE in radicals involved into the formation of iCOMs. Various studies on non-radical species and atoms have reported DE/BE ratios from 0.3 to 0.6 (Karssemeijer and Cuppen, 2014; Minissale et al., 2016; He et al., 2018; Zaverkin et al., 2022). Finally, the coupled theoretical and experimental study by Ghesquière et al. (2015) suggests that small molecules trapped in water ice can diffuse at temperatures larger than K driven by the diffusion of the water molecules in the ice. However, at lower temperatures, neither molecules or radicals seem to diffuse in the mantle bulk (Theulé, 2020) (against the assumption of the majority of astrochemical models).
2.5.3 Non-diffusive grain-surface chemistry
Laboratory experiments have shown that active chemistry also occurs on granular surfaces via thermal, non-diffusive processes (e.g. Theulé et al., 2013), in particular in CO-rich ice surfaces (e.g. Fedoseev et al., 2015; Qasim et al., 2019; Ioppolo et al., 2021; Fedoseev et al., 2022). Recently, based on earlier treatments using stochastic simulations for the production of CO2 (Chang and Herbst, 2014), Jin and Garrod (2020) developed a detailed theory of non-diffusive motion, which can occur via a variety of mechanisms, the simplest of which is a “three-body” process in which two species on the surface initially undergo a diffusive or Eley-Rideal type motion even at low temperatures and form a single molecule. If this single molecule is formed adjacent to a reactive species, a rapid non-diffusive association can occur since no diffusive barrier is involved.
As an example, consider the formation of CO2 on a surface. The standard diffusive process to form CO2 occurs between surface CO and O, a reaction that possesses a non-negligible activation energy and is rather slow. Now consider O and H atoms that move on the surface to form a single OH radical, with only a small barrier. The OH can then react quickly with a nearby CO molecule, a non-diffusive process to form CO2 that has a small activation energy and turns out to be much faster than the simple diffusion mechanism between CO and O. To transfer the mathematics from stochastic simulations to standard kinetic treatments (Herbst, 2021), one removes any barriers to diffusive motion on the surface and replaces them by the probability that a reactive third body lies adjacent to the newly-formed single molecule and can react without any chemical activation energy. The reaction is treated as instantaneous. Other non-diffusive mechanisms include photodissociation leading to fragments, which are formed adjacent to a reactive species. These and other non-diffusive surface mechanisms have been included in a simulation of low-temperature chemistry and often found to form iCOMs more rapidly than via standard diffusive chemistry (Jin and Garrod, 2020). Moreover the approach can also be used successfully to simulate low temperature laboratory experiments leading to iCOMs, for example glycine (Ioppolo et al., 2021).
2.5.4 Radical reactions
A crucial basic assumption of the Only grain chemistry path is that, when two radicals meet on the grain surface, they react in a barrierless manner and combine to form an iCOM (Garrod et al., 2008). In this way, several iCOMs are predicted to be formed, according to the scheme shown in Fig. 4, as an example. However, recent QM computations have shown that radical-radical reactions on water ice surfaces can have barriers and can also have competitive channels such as H-abstraction processes that form simpler molecules. (e.g. Enrique-Romero et al., 2016; Rimola et al., 2018; Enrique-Romero et al., 2021, 2022; Molpeceres et al., 2022). As a consequence, the combination of radicals may not be the dominant channel or even not occur at all on the interstellar grain surfaces. An emblematic and well studied case is that of acetaldehyde, which is unlikely to form on the grain surfaces via the association of HCO and CH3 according to QM simulations (Enrique-Romero et al., 2016, 2021) as opposed to that predicted by the Garrod et al. (2008) scheme (Fig. 4). Experiments where radical diffusion is very accurately controlled show that indeed this is the case: acetaldehyde is not formed on the cold grain surfaces (Gutiérrez-Quintanilla et al., 2021) (Martín-Doménech et al. (2020) did see it form, albeit at a low efficiency). However, other formation reactions leading to species such as ethane, methylamine, and ethylene glycol do not show barriers (Enrique-Romero et al., 2022). Also, a recent theoretical work considered the possibility for acetaldehyde to be formed by the reaction of a C atom landing on a water-methanol icy surface and encountering a methanol molecule (Ben Chouikha et al., 2022), a mechanism that could be efficient in very peculiar conditions where carbon is not all locked into CO molecules but methanol is already formed on the grain mantles.
In conclusion, each system needs to be studied case by case to understand what probably happens on the interstellar grain mantles and in what conditions.
2.6 Other routes of iCOM formation
2.6.1 Rapid Radical Association
Another theory for the iCOM formation appeared in the literature is called ”Rapid Radical Association” (hereafter RRA) (Rawlings et al., 2013). This theory proposes that iCOMs are formed by three-body gas-phase reactions between radicals in warm high density gas. This environment exists, for a very short period of time, following the sudden and total sublimation of grain ice mantles driven by the catastrophic recombination of trapped hydrogen atoms, and other radicals, in the ice. These ”explosions” essentially cause short-lived (100 ns) episodes of high density, high temperature gas which leads to efficient three-body reactions.
2.6.2 Radiolysis
Another granular mechanism to form iCOMs invoked in the literature, especially at low temperatures, is radiolysis, by which is meant the bombardment of icy mantles by CR in interstellar clouds, or by high energy protons or electrons in laboratory simulations (Paulive et al., 2021). If the icy mantles contain carbonaceous species such as CO or CO2, bombardment leads to iCOM production via a complex sequence of reactions involving the formation of ions and secondary electrons, which in turn form energetic radicals, which lead to iCOMs. Although numerous experiments have been performed (e.g. Arumainayagam et al., 2019), it is only recently that theoretical treatments for the low-temperature interstellar medium have been developed (Shingledecker et al., 2018) (see also Reboussin et al., 2014). That said, QM calculations providing an atomistic and precise view of the process are not available in the literature.
2.7 State-of-the-art astrochemical reaction networks
Two major gas-phase networks are publicly available and used by astrochemical models: KIDA444http://kida.obs.u-bordeaux1.fr/ (Wakelam et al., 2015) and UMIST555http://udfa.ajmarkwick.net/ (McElroy et al., 2013). These networks contain about 8000 reactions that involve about 500 species.
Unfortunately, as indicated in the two databases, the large majority of the included reactions has never been studied in laboratory experiments or by theoretical computations. Even in the cases of reactions that have been investigated, the experimental conditions rarely reproduce those typical of Solar-type star forming regions, either regarding the temperature or the density. In the absence of laboratory data, rate coefficients and their temperature dependence are mainly estimated with some chemical intuition or by drawing analogies with similarly known processes. When the data are available outside the temperature or density range of relevance, they are used as such or are extrapolated.
However, both approaches can be seriously wrong because: 1) small details in the molecular structure can induce a huge change in the chemical behaviour and reasoning by analogy can cause severe mistakes; 2) the extrapolation of the temperature dependence of rate coefficients outside the investigated range can be very risky because a change in their reaction mechanism can alter the temperature dependence in non-Arrhenius reactions, while a too high density can lead to the stabilization of reaction intermediates or affect the reaction outcome via secondary or three-body collisions.
Writing down schemes of unknown reactions can also be dramatically wrong when not even the enthalpy of formation of reactants and products is known. This is particularly true when unstable species such as ions or radicals, or other uncommon species are involved. For instance, Tinacci et al. (2022a) carried out a systematic work to ”clean” the gas-phase reaction network GRETOBAPE 666https://aco-itn.oapd.inaf.it/aco-public-datasets/theoretical-chemistry-calculations, which is based on the KIDA network, from the most obvious source of error: the presence of endothermic reactions not recognized as such. Using the enthalpy of formation derived by electronic structure calculations (Woon and Herbst, 2009; Tinacci et al., 2021) about 5% of the reactions in the original network resulted in endothermic reactions erroneously reported as barrieless or with too low activation energies.
Only one public database exists so far with a list of grain-surface reactions, posted on the KIDA website. The list is based on the Garrod et al. (2008) and Garrod (2013) reaction network and is presented in Ruaud et al. (2015).
1.5 \plotonesec3-PSCstructure.png
3 PRESTELLAR CORES: COLD DOES NOT MEAN POOR IN ORGANICS
3.1 Overview of the physical and chemical structure
The first step in the Solar-type star formation is represented by the starless cores, dense condensations (Benson and Myers, 1989) in the filaments of molecular clouds (e.g. André et al., 2019; Könyves et al., 2015; Ladjelate et al., 2020; Fiorellino et al., 2021). Prestellar cores represent a particular sub-group of the starless cores. They are gravitationally-bound objects (André et al., 2014), with evidence of contraction motions (Keto et al., 2015; Lee and Myers, 2011) caused by the fact that matter slowly accumulates towards the center under gravitational contraction counteracted by magnetic pressure and low levels of turbulence (McKee and Ostriker, 2007). Prestellar cores are relatively rare, as their life times are short (Könyves et al., 2015). The best studied ones are in the Solar neighbourhood, at distances below 200 pc. Their sizes are about 104 au, with centrally concentrated structures (Ward-Thompson et al., 1999), reaching central visual extinctions higher than 50 mag and densities higher than 105 cm-3 (Crapsi et al., 2005; Keto and Caselli, 2008), where the temperature drops to about 7 K (e.g. Crapsi et al., 2007; Pagani et al., 2007). They can show evidence of accretion of material from the parental cloud (e.g. Lee et al., 1999) as well as central contraction (Caselli et al., 2012).
In general, prestellar cores are ideal regions to study the initial steps of chemistry, with no strong temperature gradient, no shocks, absence of internal heating and, therefore, no outflows and protostellar feedback.
The general physical-chemical structure of the prototypical prestellar core, L1544, is shown in the scheme of Fig. 5.
The density increases towards the center while the temperature decreases and reaches very low values (10 K).
This physical structure defines three major zones from the chemical point of view:
1- The molecular and iCOM zone, where several molecules and, specifically, iCOMs are observed.
2- The depletion zone, where molecules such as CO freeze-out onto the grain mantles and disappear from the gas-phase.
3- The deuteration zone, where only H-bearing and D-bearing species remain gaseous.
We will briefly describe the three zones, starting from the first two. We will, on the contrary, discuss in detail the organic chemical complexity in the prestellar and starless cores, respectively.
3.2 Depletion and deuteration zones
In the central regions of prestellar cores, the large densities and low temperatures lead to a zone where, with the exception of those containing only H and D atoms, gaseous species freeze-out onto the cold grain surfaces, forming thick icy mantles. In particular, CO depletion (e.g. Caselli et al., 1999) goes hand in hand with a high deuterium fractionation, meaning a high D/H ratio compared to the cosmic D/H value of (Linsky, 2007), in the many detected deuterated molecules in the gas-phase (Caselli et al., 2002; Bacmann et al., 2003; Crapsi et al., 2005; Ceccarelli et al., 2007). This process can be explained by fast reactions involving the abundant ion H, a product of the CR ionisation of H2, with HD, which is the main reservoir of D-atoms in cold molecular gas. The D-atoms are then transferred to H2D+, D2H+ and even D (e.g. Millar et al., 1989; Vastel et al., 2006), before being transferred to gas-phase species (e.g. N2D+, DCO+ and NH2D) and, via dissociative recombination, to the D atoms landing on the dust grain surfaces. The latter lead to an increase of the D/H atomic ratio, by several orders of magnitude above the D cosmic abundance, and an enhanced deuteration of the molecules synthesised on the grain surfaces (e.g. H2CO, CH3OH, H2S and H2O). For example, deuterated methanol, CH2DOH, has been detected and mapped toward the prototypical prestellar core L1544 (Bizzocchi et al., 2014; Chacón-Tanarro et al., 2019). The deuterated ions, H2D+ and D2H+, have been detected in only few prestellar cores, as these observations are particularly difficult (Caselli et al., 2003, 2008; Vastel et al., 2004; Parise et al., 2011; Harju et al., 2017; Brünken et al., 2014).
While CO depletion is important in the central 7000 au region of L1544, some N-bearing species such as N2H+ and NH3 seem to trace the core center defined by the mm and sub-mm observations of the dust continuum emission (e.g. Tafalla et al., 2004; Spezzano et al., 2017). This was unexpected since early measurements of the binding energy (BE) of N2 and CO provided similar values (Bisschop et al., 2006). However, more recent laboratory measurements (Fayolle et al., 2016; Nguyen et al., 2018) and theoretical QM calculations (Ferrero et al., 2020) show that the two species have a distribution of BEs which could possibly explain the observed segregation. In less dense regions, the different timescales for the formation of CO versus N2 and NH3 (which also is formed from N2 in the gas-phase), about a factor of ten, could also explain the observed difference in the CO and NH3 emission. In agreement with these new estimates of the N2 and CO BEs, high-J transition observations of N2D+ have provided evidence of depletion of this molecular ion toward a prestellar core center (Redaelli et al., 2019), without resolving the depletion region. More recently, with the high sensitivity and spatial resolution obtained with ALMA, the presence of a complete depletion zone, where gaseous ammonia also disappears, has been discovered towards L1544 within a 1700 au radius (Caselli et al., 2022), as well as towards H-MM1 (Pineda et al., 2022). This implies that most (%) species heavier than He are locked onto the dust-grain ice mantles (Caselli et al., 2022).
3.3 Organic chemistry and iCOMs in L1544
As mentioned above, one of the breakthrough novelties in organic chemistry since the publication of the Protostars & Planets VI volume, is the detection of iCOMs in prestellar cores. As we will discuss later, the presence of gaseous iCOMs in these cold objects poses a great challenge to the astrochemical models for various reasons and, consequently, provides strong constraints on how these molecules are formed and why they are present in the gas-phase. Here we will review the observations, starting with the case of L1544, which is the best studied prestellar core, then discuss the other prestellar and starless cores.
As already hinted at above, among the known prestellar cores, L1544 stands out. It is one of the densest and most dynamically evolved ones, towards which H2D+ and H2O, for example, were detected for the first time in the cold ISM (Caselli et al., 2003, 2012). The physical and dynamical structure of L1544 has been computed by Keto and Caselli (2010) and Caselli et al. (2012), who predict a central temperature of K, as actually measured by Crapsi et al. (2007), and a peak density cm-3 (see Fig. 5).
The L1544 chemical composition and structure has been the target of several observational projects, in particular the unbiased spectral survey ASAI (Astrochemical Surveys At IRAM) (Lefloch et al., 2018)777https://www.oan.es/asai/. The survey covered the 70–110 GHz range and led to the detection of a rich chemistry in L1544 and a better understanding of its molecular and iCOM zone. For instance, more than 20 S-bearing species have been detected in this survey and their modeling led to the conclusion of a high elemental sulphur depletion in the gas-phase (e.g. Vastel et al., 2018; Cernicharo et al., 2018). Similarly, many N-bearing species have been detected, which helped to better constrain the N chemistry (e.g. Vastel et al., 2015, 2019).

More relevant to this review, several iCOMs have been detected towards L1544, such as methanol, acetaldehyde, dimethyl ether, methyl cyanide and vinyl cyanide (Vastel et al., 2014; Bizzocchi et al., 2014; Jiménez-Serra et al., 2016; Vastel et al., 2019). The study of methanol, which presents the brightest lines among the detected iCOMs, is very instructive to understand the methanol spatial origin. First, from the non-LTE analysis of the methanol lines, Vastel et al. (2014) found that the bulk of the emission originates in the external ( au from the center), relatively dense ( cm-3) and cold ( K) layers of L1544, marked as molecular and iCOM zone in Fig. 5. The average abundance of methanol in the external layer is about with respect to H2. The maps of the methanol emission by Bizzocchi et al. (2014) and Spezzano et al. (2016) and, at higher spatial resolution, by Punanova et al. (2018) confirmed this interpretation and add an important information on the methanol distribution. The methanol emission is not uniformly distributed around the center of L1544, but it is peaked towards the northeast, which is more shielded from interstellar UV photons than the southwest border of the L1544 condensation (Fig. 6). In the same vein, Jiménez-Serra et al. (2016) showed that the abundance of other O-bearing iCOMs is larger towards the methanol peak than towards its center by a factor 2–10 (within the uncertainties), again showing a definitive role of UV in the reducing gaseous iCOMs abundance. The abundance of iCOMs is about 10–100 times smaller than that of methanol. Table 2 lists the measured abundance of iCOMs in L1544.
| Species | Column Density | |
|---|---|---|
| ( cm-2) | ||
| Center | Methanol peak | |
| CH3OH | 30 | – |
| CH3CHO | 0.5-1.2 | 3.2 |
| HCOOCH3 | 44 | 2.31.4 |
| CH3OCH3 | 1.50.2 | 0.770.16 |
| t-HCOOH | 0.5 | – |
| CH2CHCN | 1.20.8 | 0.60.5 |
While the northeast methanol peak is enriched with iCOMs, the southeast part of the L1544 prestellar core is enriched in hydrocarbons and C-bearing chains. Specifically, Spezzano et al. (2016) and Spezzano et al. (2017) found that the c-C2H3 and C4H abundance peaks towards the southeast, where there is a sharp edge and, consequently, it is more exposed to the interstellar radiation field (Fig. 6). Remarkably, in this region, several carbon chains, such as C4H, C6H and C6H- are abundant (Gupta et al., 2009). The C-chain chemistry is so efficient that even long cyanopolyynes with up to nine carbon atoms (HC9N) have been detected (Bianchi et al., 2022a).
The ensemble of these observations seems to provide a very clear message. iCOMs and hydrocarbons/C-chains follow quite alternative routes for the organic chemistry in prestellar cores. In the regions where iCOMs are abundant, hydrocarbons/C-chains are scarce and vice versa. The presence of strong UV illumination seems, at the moment, the major player in determining the divergence. We will discuss the consequences of this finding in Sec. 4.
3.4 iCOMs in other prestellar cores
The presence of iCOMs is not a prerogative of L1544. Although difficult to detect because their lines are weak, both because of the relatively low abundance and gas temperature, a few iCOMs have been detected in several prestellar cores. Notably, the survey by Scibelli and Shirley (2020) towards 31 starless cores, of which many are prestellar cores in the Taurus Molecular Cloud, showed that methanol is present in all the targeted prestellar cores and acetaldehyde in 70% of the sample. Likewise, Punanova et al. (2022) mapped the methanol emission in the Taurus L1495 filament and found emission associated with seven starless cores. Therefore, iCOMs are likely a common product of the cold chemistry.
As in L1544, the methanol emission in the Scibelli and Shirley (2020) sources originates in a cold (T = 6–8 K) gas, and the derived column density ( cm-2) is very similar to that found in L1544 ( cm-2: Vastel et al., 2014). Assuming that acetaldehyde emits in the same gas as methanol, the CH3CHO/CH3OH is 0.02–0.2, with most sources in the middle of the distribution (Scibelli and Shirley, 2020)888However, we emphasize that the error bars are relatively large because of the few lines detected.. The comparison with the CH3CHO/CH3OH in L1544 (Vastel et al., 2014) would suggest a certain similarity among the prestellar cores, when the uncertainties are taken into account, even though this conclusion needs additional observations to rest on a solid basis.
In a few additional prestellar cores, iCOMs other than methanol and acetaldehyde have been detected. We will briefly describe their cases in the following.
L1689B is a well-studied prestellar core in the Ophiuchus star-forming region, which shows a moderate CO depletion (Bacmann et al., 2002; Jessop and Ward-Thompson, 2001), probably sign of youth or a large CR/FUV irradiation. L1689B is one of the first prestellar cores where three iCOMs have been detected: acetaldehyde, dimethyl ether and methyl formate (Bacmann et al., 2012). The acetaldehyde column density is very similar to that found in L1544 and the Scibelli and Shirley (2020) cores, 1–3 cm-2. Likewise, dimethyl ether and methyl formate column densities are about 3–10 times lower than that of acetaldehyde.
H-MM1 is an intriguing prestellar core, located in the eastern side of the L1688 cloud of the Ophiuchus complex, and illuminated on one side by a strong UV field from nearby B-type stars. The asymmetry of the FUV field illumination causes an enhancement of methanol emission in the shielded side (Harju et al., 2020), similarly to what happens in L1544 (see above). Remarkably, also in H-MM1, as in L1544, ammonia is depleted towards its center (Pineda et al., 2022).
B1-b: Finally, the first evidence of efficient production of iCOMs in cold environments was reported by Öberg et al. (2010) and Cernicharo et al. (2012) toward B1-b, a dense core which hosts a Solar-type protostar. These authors reported the detection of three iCOMs (methanol, methyl formate and acetaldehyde) towards the quiescent core and not the outflow driven by the protostar. However, the presence of the outflow could affect the observed species, as also discussed by Fuente et al. (2016), who observed the same source and found enhanced sulphur chemistry, typically an indication of the presence of shocks (as sulphur is heavily depleted in starless cores; e.g. Ruffle et al., 1999).
3.5 iCOMs in starless cores
Starless cores, which do not present evidence of infalling motion, have a relatively flat density profile and motions sometimes displaying oscillations or even expansion (Lada et al., 2003; Tafalla et al., 2004). Thus, a significant fraction of them could be transient and not evolve toward the prestellar phase, i.e. the star formation (Belloche et al., 2011).
We have already mentioned above the study by Scibelli and Shirley (2020), which showed a high frequency of targeted starless cores presenting acetaldehyde and all of them methanol emission. Here we discuss three cases.
L1521E is a starless core with no indications of infall motions and, on the contrary, signs of a dynamical and chemical youth: modest central density ( cm-3) and CO depletion (). Scibelli et al. (2021) detected acetaldehyde, dimethyl ether, methyl formate and acrylonitrile in addition to methanol. The column densities of these iCOMs are about cm-12, similar therefore to the prestellar cores, within the measurement uncertainties. The youth of L1527E ( yr) and the presence of iCOMs at an early evolutionary stage testifies that the formation of the latter is relatively fast, another constraint for astrochemical models.
L1448 is also a starless core where Jiménez-Serra et al. (2021) found interestingly relatively high abundances of N-bearing iCOMs but not O-bearing ones, except for methanol.
TMC-1, in the Taurus Molecular Cloud complex, is by far the most studied starless core, in particular the position known as the ”cyanopolyyne peak”. TMC-1 has a volume density similar to that in the external layer of L1544 (at au), with n(H2) of a few 104 cm-3. What made it famous was the detection of abundant large cyanopolyynes, up to 11 carbons (HC11N) (Loomis et al., 2021). This has been interpreted by many authors as an indication of a chemically young dense core (e.g. Agúndez and Wakelam, 2013), where carbon is not yet largely locked into CO and, therefore, available for the observed rich carbon chemistry.
Indeed, TMC-1 is the site of many first detections of C-bearing large molecules, such as HC4NC (Cernicharo et al., 2020; Xue et al., 2020), HC5NH+ (Marcelino et al., 2020), H2CCCHC3N (Shingledecker et al., 2021), indene (C9H8) (Burkhardt et al., 2021; Cernicharo et al., 2021c), propargyl radical (CH2CCH) (Agúndez et al., 2021), propargyl cyanide (HCCCH2CN) (McGuire et al., 2020), allenyl acetylene (H2CCCHCCH) (Cernicharo et al., 2021a), cyclic aromatic molecules such as benzonitrile (c-C6H5CN) (McGuire, 2018), cyclopentadiene (c-C5H6) (Cernicharo et al., 2021c) and cyanocyclopentadiene (c-C5H5CN) (McCarthy et al., 2021). Remarkably, the detection of benzyne (ortho-C6H4) led Cernicharo et al. (2021b) to hypothesise that, in TMC-1, PAHs are formed bottom-up from small carbon chains, via gas-phase reactions of a few radicals with abundant gaseous hydrocarbons, rather than top-down from carbonaceous-grain fragments.
3.6 Astrochemical models
As mentioned in the Introduction (Sec. 1), the discovery in 2012 of iCOMs in prestellar cores (§ 3.4) was unexpected and not predicted by the astrochemical models. It still poses serious challenges to the current models for two major reasons. The first one is the route of formation of iCOMs for the low temperatures and high densities of the prestellar cores. The second challenge is connected with the very presence of iCOMs in the gas-phase, as the BEs of iCOMs are generally very large and close to that of water (e.g. Ferrero et al., 2020, 2022; Corazzi et al., 2021, see also Sec. 2).
In 2012, iCOM formation models were prevalently based on the Garrod and Herbst (2006) scheme, described in Sec. 2 (see also Fig. 1). Briefly, iCOMs were expected to form during the warm-up phase of the dust grains when the protostar switches on and starts to heat the surrounding material (e.g. Viti and Williams, 1999; Garrod et al., 2008), allowing mobility of the radicals trapped within the icy mantles. These radicals could then react to form iCOMs, which would then be released back in the gas-phase when the dust temperature exceeds the sublimation temperature of the specific species. However, at the low temperatures found in prestellar cores, only hydrogen (and deuterium) atoms can sweep across dust grain surfaces, thus allowing them to react with other species. Depletion of carbon, oxygen and nitrogen atoms as well as CO, as evidenced in prestellar cores (§ 3.2), leads to the production of stable species such as methane, water, ammonia and methanol in the icy mantles (see Sec. 2). These species might be broken into radicals by the external UV photons in the external shells of the core, or by the secondary UV photons produced across the whole core by CR interacting with the abundant H2 molecules. The radicals which are not photodesorbed and remain in the icy mantles are, however, too slow at these temperatures to effectively meet together and, therefore, react to produce heavier iCOMs. Therefore, it appears difficult for iCOMs other than methanol to be synthesized in the solid phase in the cold prestellar cores via this scheme.
Two alternative routes have since been proposed (see Sec. 2): the so-called ”non-diffusive grain-surface chemistry” (Jin and Garrod, 2020) (see below) and iCOM formation in the gas-phase (Vasyunin and Herbst, 2013; Balucani et al., 2015). In the latter scheme, iCOMs form in the gas-phase upon release of methanol and other smaller iCOMs bricks from the grain surfaces. We stress again the difficulty of having iCOMs (including methanol) in the gas-phase, where they are observed (see the discussion in § 2.3).
Detailed astrochemical models have been so far almost exclusively developed to reproduce the iCOMs observed towards L1544 (Vasyunin et al., 2017; Goto et al., 2021). These models use the core physical structure described by Keto and Caselli (2010) and Chacón-Tanarro et al. (2019), and start with the production of methanol on icy mantles rich in CO, at the edge of the catastrophic freeze-out zone of prestellar cores (Caselli et al., 1999). Surface CO molecules are then efficiently hydrogenated into CH3OH, while the CO-rich ice below the newly formed CH3OH molecule allows its efficient reactive desorption (Vasyunin et al., 2017) following the recipe by Minissale et al. (2016) (but see the discussion in Sec. 2). Finally, once methanol and other radical/molecules are released into the gas-phase, neutral-neutral reactions can proceed to produce larger iCOMs (e.g. Vasyunin and Herbst, 2013; Balucani et al., 2015; Vasyunin et al., 2017). These models predict that the peak of methanol and other iCOMs abundance is in a layer at about 8000 au, in agreement with the observations (see § 3.3). Besides, the predicted and observed abundances of gaseous methanol and iCOMs agree within a factor 10, which is reasonable within the various uncertainties. However, the predicted abundance of solid methanol is significantly higher, by about a factor 5, than that observed at the edge of the L1544 condensation by Goto et al. (2021).
1.4 \plotonesec4-protostars-structure.png
Other models aiming at reproducing the iCOM abundances observed towards prestellar and, more generally, starless cores have also been published. The model by Jin and Garrod (2020) is based on the non-diffusive grain-surface chemistry, described in § 2.5. This model, which uses a denser condensation than the one used by Goto et al. (2021), approximately reproduces the abundances of acetaldehyde and methyl formate observed towards L1544 at about 9000 au, but it fails to reproduce methyl formate by several orders of magnitude. The model by Holdship et al. (2019a) is based on the Rapid Radical Association, described in § 2.6. These authors tried to reproduce the abundances of the iCOMs observed towards TMC-1 and concluded that the Rapid Radical Association is not the dominant mechanism for iCOM formation.
As a final note, the authors of the above models caution that ”a chemical model is built on numerous parameters that we do not yet understand well” (Goto et al., 2021), both those regarding the microphysics of the involved processes (e.g., efficiencies of grain-surface reactions, rate constants of gas-phase reactions, binding energies, diffusion efficiencies on the surface: Sec. 2) and the macroscopic ones, namely the profiles of the density, dust and gas densities and temperatures, dust grain sizes, UV illumination, and CR irradiation. For example, in the initial work of Vasyunin et al. (2017), acetaldehyde was produced via a gas-phase reaction with an impossibly large reaction rate (Vazart et al., 2020), and reduced in successive works by Jiménez-Serra et al. (2021) and Scibelli et al. (2021).
Much progress is needed on all these fronts and the next few years promise to be crucial ones. For example, on the observational point of view, JWST is expected to provide maps of methanol ice abundance in prestellar cores, such as that towards L1544 by Goto et al. (2021) but more sensitive, and perhaps maps of other iCOMs. Likewise, ALMA, NOEMA and VLA will provide more detections of iCOMs on a larger number of prestellar cores in different environments allowing a better understanding of the influence of the environment on the early organic chemistry.
4 PROTOSTARS: THE RETAIL SHOPS OF ORGANICS
2.0 \plotonesec4-hotcorino.png
4.1 Overview of the physical and chemical structure of protostars
When the free collapse of matter towards the center starts, a protostar is formed. Briefly, a protostar is made up of four main components: the central object that will eventually become the new star, the infalling envelope from which the central object accretes matter, the circumstellar disk in which eventually planets and comets will form, and an outflow of ejected material. The latter two components, the disk and the outflow, will be discussed in Secs. 5 and 6. Here we focus on the infalling envelope and the organic chemistry during the early phases of the protostar, when the observed sources are called Class 0 and I.
As for the prestellar cores (Sec. 3), the chemical structure and evolution of the matter are tightly linked to its physical structure and evolution (e.g. the density and temperature profiles), as well as the presence of ionising agents (e.g. UV photons and CR).
Given the presence of a central source of heat and centrally peaked infalling envelope, the general physical-chemical structure of a protostar can be divided into three major zones, illustrated in Fig. 7, as follows:
1- A cold envelope, characterised by a dust temperature lower than about 22 K, where several molecules, including CO, are largely frozen into the grain mantles, as in the prestellar cores described in Sec. 3.
2- A lukewarm region, having a dust temperature between the CO and H2O sublimation temperatures (approximately 22 and 100 K, respectively), where organics can be present either in the form of carbon chains, iCOMs or both.
In this region, iced methane sublimates: if abundant enough (see § 4.4), the injection of methane gives rise to a zone enriched with unsaturated carbon-chains, such as C4H or large cyanopolyynes.
The sources where this zone is dominating the chemical appearance are called WCCC (Warm Carbon Chain Chemistry) sources (Sakai and Yamamoto, 2013).
3- A hot region, characterised by a dust temperature higher than about 100 K, where the water-rich ices sublimate injecting into the gas-phase whatever species is trapped in them.
If frozen methanol and other relatively complex species are abundant enough, they give rise to a zone very enriched with iCOMs.
This zone is called hot corino which, in its original definition, is a compact source ( au in radius) possessing high temperatures ( K), high densities ( cm-3) and showing the presence of iCOMs in the region where the water-rich grain mantles sublimate (Ceccarelli, 2004).
The typical spectrum of a hot corino is shown in Fig. 8.
WCCC sources and hot corinos are two chemically distinct classes of Solar-type Class 0/I protostars, meaning that, observationally, their spectra are either dominated by unsaturated carbon-chains or iCOMs. It is not by chance that the first two distinct chemical classes of protostars, WCCC sources and hot corinos, are based on which C-bearing species dominate their spectra, as carbon is the element that allows the richest and most varied chemistry in space (and on Earth!). At present, these two classes are the only ones recognised to be present in Class 0/I protostars, even though there could probably be a differentiation also with respect to N- and S-bearing molecules. As often happens, hot corinos and WCCC sources are the two extremes, and hybrid sources, where the WCCC and hot corino chemistry appear on different scales, have been found (e.g. B335 and CB68: Imai et al., 2016; Oya et al., 2017; Higuchi et al., 2018) (see also Bouvier et al., 2020, for a discussion on the contribution from the surrounding environment). As we will discuss in § 4.2, the number of known protostars with a well enough studied chemical composition is very small at present, so that we are strongly biased in our knowledge towards the hot corinos and WCCC sources. With the improving observational facilities and the increasing number of observational surveys, the situation promises to evolve in the next few years. For example, the ALMA Large Program FAUST999http://faust-alma.riken.jp (Fifty AU STudy of the chemistry in the disk/envelope system of Solar-type protostars: Codella et al., 2021) is designed to reveal the chemical structure of several Class 0/I sources.
4.2 The census of hot corinos and WCCC sources
Hot corinos
The first official detection of a hot corino, IRAS16293-2422 (hereinafter IRAS16293), dates back to 2003 (Cazaux et al., 2003), although its existence was suggested earlier by the observed formaldehyde abundance jump in its inner region (Ceccarelli et al., 2000) and the tentative identification of several iCOMs (Ceccarelli et al., 2002). Later interferometric observations showed that actually IRAS16293 harbors two hot corinos, A and B, respectively (Kuan et al., 2004; Bottinelli et al., 2004b; Jørgensen et al., 2016). Soon after the first discovery, hot corinos were also found towards NGC1333-IRAS4A (Bottinelli et al., 2004a), NGC1333-IRAS2A (Jørgensen et al., 2005b) and NGC1333-IRAS4B (Sakai et al., 2006; Bottinelli et al., 2007). Then for several years no new hot corinos have been discovered, despite studies of formaldehyde and methanol emission had suggested hot corinos also towards L1448-mm, L1448-N and L1157-mm (Maret et al., 2005; Jørgensen et al., 2005a). Only in 2014, the number of hot corinos with the detection of at least one iCOM other than methanol almost doubled, adding to the list B1-a, SVS4-5 and B5-IRS1 (Öberg et al., 2014). These first seven hot corinos were all discovered using the single-dish telescope IRAM-30m. The advent of ALMA and IRAM/NOEMA spurred new studies and, finally, new surveys, such as CALYPSO (Belloche et al., 2020), PEACHES (Yang et al., 2021) and ORANGES (Bouvier et al., 2021, 2022) are steadily increasing the number of known hot corinos. Another breakthrough was obtained with the VLA observations at GHz of the binary system NGC1333-IRAS4A, that showed that the dust is a major obstacle to the hot corino detection (De Simone et al., 2020a). At present, about two dozens hot corinos are confirmed (meaning that they present line emission from more than three iCOMs) and more are candidates (mostly when only methanol is detected).
Before 2015, the fraction of known hot corinos in Class 0/I protostars was 50%, which led to think that almost all Solar-type protostars went trough the hot corino phase and that our Solar System may have not been an exception (Ceccarelli et al., 2007; Öberg et al., 2014). However, the number was heavily biased by the search criteria as, given the difficulty of discovering hot corinos, the most probable sources were searched for. The new surveys provide some contrasting results in terms of the fraction of hot corinos in Class 0/I protostars: CALYPSO found % in a list of 26 protostars with a distance pc, when only sources with more than 3 detected iCOMs, referred in the article as ”confirmed” hot corinos, are counted (Belloche et al., 2020), PEACHES found ()% in a large unbiased sample of 50 protostars in Perseus (Yang et al., 2021), and ORANGES found ()% in an unbiased sample of 19 protostars in Orion OMC-2/3 (Bouvier et al., 2022), the last two surveys counting the sources with detected methanol lines. When comparing the two unbiased samples, ORANGES and PEACHES, which were carried out with comparable spatial resolutions (in au) and sensitivities, there is a marginal, but potentially very interesting evidence that the rate of hot corinos is affected by the environment. Specifically, ORANGES studied the Orion region, where both high- and low- mass stars are presently forming, whereas PEACHES studied the Perseus region, where only low-mass protostars are present. In Orion, the presence of high-mass forming stars makes the regions permeated by strong UV and CR irradiation fields (e.g. Ceccarelli et al., 2014b; Favre et al., 2017), which may reduce the onset of a complex organic chemistry leading to iCOMs in Solar-type protostars (see § 4.4). Perseus, on the contrary, is not exposed to high UV/CR irradiation even though it is known to be the theater of titanic clashes between bubbles and clouds (Dhabal et al., 2018; De Simone et al., 2022). Obviously, more regions need to be studied to draw firm conclusions concerning environmental effects, and to what extent they affect the chemical nature of Solar-type protostars.
WCCC sources
The discovery of the first WCCC protostar arrived in 2008 (Sakai et al., 2008), with the unexpected detection of abundant C4H2, C4H and CH3CCH towards IRAS04368+2557 in L1527 and no iCOMs containing heavier atoms than C. Subsequent observations showed that L1527 is enriched with a variety of unsaturated carbon-chains, including cyanopolyynes with up to 9 carbons (HC9N). As for the hot corinos, the early hunt for new WCCC sources ended up in a frustrating addition of only two other protostars: B228 (Sakai et al., 2009) and TMC-1A (Sakai et al., 2016) and a few other candidates.
Again, new surveys were carried out with single-dish telescopes, with the aim of finding more WCCC sources and understanding the phenomenon, and ended up with some contrasting results. Graninger et al. (2016) studied a sample of 15 Class 0/I protostars with measured (Spitzer) ice abundances and found the co-existence and even correlation between C4H and CH3OH line emission, suggesting that the observed protostars possess both a WCCC and a hot corino zone. However, Lindberg et al. (2016) studied the same species towards 16 protostars in the Ophiuchus molecular cloud complex and found no correlation between C4H and CH3OH. On the contrary, they found a net distinction between WCCC sources and (known) hot corinos. The extensive survey of 36 sources in Perseus by Higuchi et al. (2018) used the CCH and CH3OH line emission to discriminate between the two classes. Based on the two prototypes of each chemical class, IRAS16293 and L1527, Higuchi et al. (2018) assumed that an abundance ratio [CCH]/[CH3OH] would define a WCCC source, while [CCH]/[CH3OH] a hot corino. With this definition, they found four new WCCC candidates. The most recent single-dish survey, carried out by Bouvier et al. (2020), used again CCH and CH3OH line emission, towards nine sources in the Orion OMC-2/3 clouds. All nine sources present a [CCH]/[CH3OH], which would lead to conclude that they are all WCCC sources. However, a careful analysis demonstrates that the single-dish CCH and CH3OH line emission is likely dominated by the Photo-Dissociation Region (PDR) enveloping the OMC-2/3 hosting clouds, making the criterion flawed, when used in combination with single-dish observations only.
1.0 \plotonesec4-mf-dme-LC.png \plotonesec4-glyco-aceta.png
4.3 The census and abundances of detected iCOMs
Hot corinos are the Class 0/I protostars that present the richest chemical composition, so that in this section we will focus on the iCOMs detected there.
iCOM census and abundances
At present, more than twenty iCOMs have been detected in hot corinos, mostly due to the spectacular spectral survey carried out with the ALMA interferometer in the 300 GHz band by the PILS survey (Protostellar Interferometric Line Survey: Jørgensen et al., 2016). However, the vast majority of iCOMs has only been detected towards IRAS16293 A and B (e.g. Jørgensen et al., 2016; Ligterink et al., 2017; Jørgensen et al., 2018; Calcutt et al., 2018; Zeng et al., 2019; Manigand et al., 2020, 2021), whereas only less than ten iCOMs have been detected in other hot corinos (e.g. Taquet et al., 2015; Imai et al., 2016; López-Sepulcre et al., 2017; Marcelino et al., 2018; Bianchi et al., 2019; Bergner et al., 2019; Belloche et al., 2020; Ligterink et al., 2021; Nazari et al., 2021; Martín-Doménech et al., 2021; Chahine et al., 2022).
In general, measuring absolute abundances of iCOMs provides relatively unreliable numbers, because of the uncertain H2 column density (for example, the continuum does not necessarily trace the same gas where the iCOM emits) and the problem of dust absorption of the iCOM lines (De Simone et al., 2020a). For example, Zamponi et al. (2021) found that the dust opacity towards the IRAS16293 B peak exceeds 100 at 300 GHz, the frequency range covered by the PILS survey. Consequently, even considering that the PILS survey provided abundance one beam offset from the center, the absolute abundances towards that source are likely substantially underestimated.
For the above reason, it is common use to plot relative iCOM abundance ratios to understand how much chemistry is affected by the hot corino possible different conditions and to provide constrains to the astrochemical models. As an example, Fig. 9 shows the abundance ratio of dimethyl ether over methyl formate in known Class 0/I hot corinos (Chahine et al., 2022). This ratio, close to unity in all hot corinos, with the possible exception of HOPS108 in OMC-2 FIR4 (Chahine et al., 2022), suggests a mother-daughter or sister relation between these two species (e.g. Jaber et al., 2014; Balucani et al., 2015), even though it is not a proof (Belloche et al., 2020). Another example is provided by the tight correlation between the measured abundance of glycolaldehyde and acetaldehyde in Class 0/I hot corinos, again suggesting a possible mother-daughter or sister relation, where the two species may be one the mother of the other or they both derive by a common mother, for example ethanol, as suggested by Vazart et al. (2020). We will discuss both cases in § 4.4.
Finally, recent observations towards the hot corino of NGC1333-SVS13A have shown a spatial stratification of the iCOM emission over a ( au) scale, caused by the combined effect of the dust optical depth and iCOM binding energy (Bianchi et al., 2022c). Interestingly, the observed stratification supports the idea that the iCOMs presence in the gas-phase is caused by the thermal sublimation of the mantle ices, rather than shocks or other non-thermal processes (as initially supposed: Ceccarelli, 2004). Note this does not necessarily imply a grain-surface origin as iCOMs could also be formed from smaller species released in the gas-phase (Sec. 2).

D fractionation in iCOMs
A recent and extremely important breakthrough has been the detection of D-bearing iCOMs, other than methanol, where the D fractionation could be measured: formamide, acetaldehyde, dimethyl ether, methyl formate, glycolaldehyde, ethanol and ethyl cyanide (Richard et al., 2013; Coutens et al., 2016; Jørgensen et al., 2018; Persson et al., 2018; Manigand et al., 2019; Richard et al., 2021; Bianchi et al., 2022b). The detection and abundance determination of deuterated iCOMs is important because it has the great diagnostic power to discriminate the route of formation of the species, as it will be explained in § 4.4. In general, iCOMs show a deuterium fractionation (2–10 %) larger than that measured in water (%) towards the same sources. As already pointed out by previous works (see e.g. Ceccarelli et al., 2014a, and the references there), this systematic difference is probably caused by the different formation time of water with respect to iCOMs. Indeed, water is the first ice component to be formed whereas iCOMs are formed after the depletion of CO onto the icy grain mantles, which enhances the H2D+/H ratio in the gas-phase, at the base of the methanol and formaldehyde deuteration.
iCOMs in the cold envelopes
Although with a much lower abundance, iCOMs are also present in the more extended and cold envelopes of Class 0/I protostars, where the dust temperature is lower than the icy mantle sublimation one. Öberg et al. (2010) found weak extended emission from iCOMs associated with the lukewarm envelope of B1-b. Later, Jaber et al. (2014) found methyl formate, dimethyl ether, acetaldehyde and formamide towards the cold envelope of IRAS16293. Their abundances are about a factor 100 lower than those measured in the hot corinos A+B, but still they are present. As mentioned in Sec. 3, iCOMS are also found in prestellar cores, in the outer layers where the conditions are similar to the lukewarm envelopes of the protostars, so that it is probable that the same process is responsible for the presence of iCOMs in both environments.
4.4 Astrochemical models
As the general ideas about the chemistry of iCOMs have been already discussed in Sec. 2, here we only summarise some specific examples of a few iCOMs.
Hot corino versus WCCC source chemistry
As discussed in § 4.2, Class 0/I protostars can be roughly classified into two classes, hot corinos and WCCC sources, with respect to their organic contents. Note, however, that this classification is not rigorous, because there are also hybrid sources. What determines the chemical nature of a protostar is a subject of debate. At present, two major reasons have been invoked in the literature: a different time scale of the formation of the grain mantles (Sakai and Yamamoto, 2013), a different illumination from UV photons (Spezzano et al., 2016), or both. The above two hypothesis have in common the idea that the differentiation is caused by the different major reservoir of the frozen carbon: methanol versus methane. When methanol is more abundant, it gives rise to the hot corino chemistry with the productions of iCOMs, whereas when methane is more abundant the chemistry is dominated by the formation of unsaturated carbon chains originating the WCCC sources. Therefore, the above two hypothesis differ on what species dominates the frozen carbon, methanol rather than methane. Methanol is thought to be formed on the grain surfaces by the hydrogenation of CO, whereas methane by hydrogenation of C. Therefore, the basic point is whether CO is abundant or not on the grain surfaces with respect to C. The first possibility is that, since methanol is formed on the grain surfaces after CO freezes-out at relatively late times ( yr), the formation time of the icy grain mantles determines whether they are enriched with methanol rather than methane. The second possibility is that CO is less abundant than C because of the UV illumination that would photo-dissociate CO. Both mechanisms can explain the existence of sources having the hybrid nature.
Models have been developed to quantitatively address this issue. Aikawa et al. (2020) carried out a parameter study to understand what affects most the appearance of a hot corino and WCCC source. They concluded that the chemical appearance of the protostars depends on a complex function of time (i.e. mantle formation duration), extinction (i.e. exposure to UV illumination), and thermal history (i.e. the dust temperature at the formation of the icy mantles). On the same vein, Kalvāns (2021) studied in detail the influence of the UV illumination and CR irradiation, concluding that the WCCC sources are the results of an enhancement of either of the two.
Deuterated iCOMs
The iCOM deuteration follows a different path than the standard one initiated by and completely dependent on the H2D+ ion at the moment of the molecule formation (e.g. Ceccarelli et al., 2014a). Indeed, since iCOMs are ”second-generation” species their deuteration is inherited from their precursors (and not directly from H). With second generation here we mean that iCOMs are not the products of hydrogenation, as methanol, whose deuteration depends exclusively on the D/H atomic ratio on the grain surfaces, which, in turn, depends on the H/H2D+ ratio. For example, acetaldehyde (CH3CHO) is thought to be formed by the combination of HCO and CH3 on the grain surfaces (Garrod and Herbst, 2006) (§ 2.5.4) or by a series of reactions starting from ethanol (CH3CH2OH) in the gas-phase (Vazart et al., 2020) (§ 2.4.3). Therefore, the production of its two D-isomers, CH3CDO and CH2DCHO, depends on the ratios of DCO/HCO and CH2D/CH3, if formed on the grain surfaces, and of CH2DCH2OH/CH3CH2OH, CH3CHDOH/CH3CH2OH and CH3CH2OD/CH3CH2OH, if formed in the gas-phase.
In addition, the deuteration of the precursors is not just plainly passed on to the iCOM: the reaction leading to the iCOM itself can alter the deuteration, because of the so-called kinetic isotope effect (KIE), a well-known effect in chemistry, which is different from the thermodynamic isotope effect (TIE). The latter dominates the deuteration of the species directly linked to H, and it is due to the difference in the zero point energy of H and H2D+ which makes that H + HD H2D+ + H2 is slightly exothermic, while the reverse process is slightly endothermic. In iCOMs other than methanol, the final deuteration depends on the passed moiety and how this is obtained, so that the iCOM deuteration depends on the deuteration of its precursors and its formation route. If one has the possibility to measure the deuteration of the iCOM and of its precursors, then this is potentially an extremely powerful way to constrain the iCOM formation route.

A very nice example is provided by the case of formamide (NH2CHO), a species that can in principle be formed both on the grain surfaces by the combination of NH2 and HCO (Garrod and Herbst, 2006) and in the gas-phase by the reaction H2CO + NH2 (Barone et al., 2015). In IRAS16293 B, the measured abundances of the formamide deuterated isomers are in agreement with the theoretical predictions of the gas-phase formation route (Skouteris et al., 2017), which suggests that formamide is formed in the gas-phase in this source. Unfortunately, no theoretical predictions exist so far on the predicted deuteration in case of formamide formation on the grain surfaces so that it is not possible to perform a similar significant comparison with the observations. In the same vein, Vazart et al. (2022) found that the deuterated forms of glycolaldehyde are also in agreement with the theoretical predictions of its formation in the gas, following the scheme starting from ethanol (Skouteris et al., 2018).
5 PROTOPLANETARY DISKS: WHERE ORGANICS ARE BURIED
5.1 Overview of the physical and chemical structure of protostars
Circumstellar disks are expected to be present since the earliest phases of the star forming process, i.e. the protostellar Class 0 protostar phase described in the previous section, and evolve into what are traditionally called protoplanetary disks, in the Class I and II protostars phases. Protoplanetary disks are complex structures composed by a mixture of dust and gas and the chemistry occurring in the gas-phase and/or on the grain surfaces reflects the diversity, the inhomogeneity and the evolutionary stage of these objects.
Although their physical and chemical structure changes with time, from gas-rich and with small (m) grains to gas-poor and pebbles ( m) (see, e.g., Chapters by Bae et al. and Miotello et al.), the chemical structure can be approximately subdivided in three different zones, shown in Fig. 11 (e.g. Aikawa and Herbst, 1999; Dullemond et al., 2007; Dutrey et al., 2014; Walsh et al., 2014):
1- The hot surface layer, where the chemistry is dominated by the UV photons.
As in the Photo-Dissociation Regions (PDRs), only ionised and neutral atoms are present in this zone, because molecules are photo-dissociated.
2- The warm molecular layer, where molecules are in the gas-phase.
In this zone, the UV photons are largely absorbed and the dust temperature is large enough for several molecules to remain gaseous.
This is the layer where iCOMs can be and are detected (e.g. Öberg et al., 2014).
3- The cold (outer) midplane, where molecules freeze-out onto grain mantles and only H and D bearing species are in the gas-phase, e.g. H2D+ (Ceccarelli and
Dominik, 2005).


The freeze-out of different molecular species occurs at the disk radius and height where the dust temperature is lower than the molecule freeze-out temperature, which in turn depends on its BE. The loci of the gaseous-solid transition of a molecule is called snowline and it is specific to each molecule. Although in the regions beyond the snowline molecules are prevalently frozen into the grain mantles, a small fraction of them can be in the gas-phase thanks to the UV and X-ray photon illumination or the CR irradiation (e.g. Walsh et al., 2014; Loomis et al., 2015), via the non-thermal processes described in detail in § 2.3.
In general, the detection of iCOMs in disks is very challenging because (i) the dust along the line of sight might heavily absorb the line emission, and (ii) the most chemically active regions are actually expected to have low (beam-averaged) column densities because of the small vertical size of the outer molecular layer and the small size of the warm molecular inner zone. As a consequence, high-angular resolution and high sensitivities are crucial to detect organic molecules (e.g. Walsh et al., 2014). Remarkably, protoplanetary disks show gaps in the dust continuum emission maps, possibly testifying of forming planets (e.g. Fedele et al., 2016; Sheehan and Eisner, 2017, 2018; Segura-Cox et al., 2020) (see also Chapters by Lesur et al., Benisty et al and Pinte et al.). Therefore, despite this complex scenario and the observational challenge, it is essential to probe the chemical composition of the young disks to understand whether more evolved disks inherit the chemical complexity observed at the protostellar stage (Sec. 4), as suggested by Bianchi et al. (2019) and Drozdovskaya et al. (2019).
5.2 iCOMs in Class 0 protoplanetary disks
Many recent observations show that circumstellar disks are present in Class 0 protostars, still embedded in infalling-rotating envelopes. The dust absorption as well as the line emission from the infalling envelopes easily mask the line emission from the disk itself, in particular weak iCOM lines.
A remarkable exception is represented by the archetypal protostellar disk around HH 212-mm, located in Orion B. The HH 212 system has been observed with ALMA with a spatial resolution of up to au, revealing a dusty edge-on disk with a radius of au. The disk is obscured along the equatorial plane because of the high dust optical depth (Fig. 12: Lee et al., 2017b; Lee et al., 2019a). Several iCOMs have been detected towards the HH 212 disk (e.g. Codella et al., 2018, 2019; Lee et al., 2017a; Lee et al., 2019a) with the following abundances (with respect to H2): [CH3OH] , [HCOOH] , [CH3CHO] , [HCOOCH3] and [NH2CHO] . More specifically, iCOMs have been observed only in the upper outer disk layers, at 40 au from the equatorial plane (Fig. 12: Lee et al., 2019a). In addition, Lee et al. (2022) found a stratified radial distribution, with the outer emission radius increasing from 24 au for NH2CHO, to 36 au for CH3CHO, 40 au for CH3OH, and to 48 au for H2CO (Fig. 13). The increasing outer radii are consistent with the decreasing molecules BEs, suggesting that these species are thermally desorbed from the dust icy mantles at the different radii because of the dust heating from the central object and, therefore, not because of shocks or other non-thermal processes (§ 2.3). The HH 212 iCOM stratification is similar to that also observed towards NGC1333-SVS13A (Bianchi et al., 2022c) and described in § 4.3 (see also Fig. 10). Finally, the lack of iCOM emission towards the equatorial plane is probably due to the dust absorption at sub-mm wavelengths (Fig. 12). Observations at lower frequencies, e.g. in the cm, would be necessary to reveal the gas chemical composition in the equatorial plane.
5.3 iCOMs in Class I/II protoplanetary disks
In the more evolved disks surrounding Class I and Class II protostars, most of the molecules are frozen onto the dust icy mantles in the disk midplane and only a relatively low column density remains gaseous. iCOM detections in Class I/II disks have been rare, but the few detections that do exist provide vital information about the iCOM reservoir available to forming planets, the evolution of iCOM chemistry during star and planet formation, and the specific origins of iCOMs in disks.
Up to date, few detections of iCOMs towards protoplanetary disks have been reported. The detection of methanol (Walsh et al., 2016) and formaldehyde (Öberg et al., 2017), which are key species for the formation of other iCOMs, along with that of methyl cyanide (Loomis et al., 2018) and formic acid (Favre et al., 2018) towards the disk surrounding the very close (60 pc) young Solar-type T-Tau star TW Hya strongly suggests an active organic gas-phase chemistry taking place also at this stage (as discussed later) and/or non-thermal desorption from the grain mantles (see § 2.3) of previously formed organic molecules (see e.g. Walsh et al., 2016). The recent survey of protoplanetary disks MAPS (Molecules with ALMA at Planet-forming Scales; Öberg et al., 2021) shows that methyl cyanide, for example, is present in four out of the five targets (Ilee et al., 2021). The emission is concentrated in rings at distances that vary with the source or peaked towards the center (see Fig. 14) and it originates in regions with temperatures between 25 and 50 K, relatively close to the midplane, z/r . Since the CH3CN binding energy (BE) is similar to that of water, it is formed either via gas-phase reactions between smaller molecules with relatively low BEs or a non-thermal mechanism would be operating (§ 2.3).

Methanol, a key iCOM, has been recently detected in the Class I disk IRAS 04302+2247 (Podio et al., 2020a; Garufi et al., 2021) and towards the disk around the A-type star HD 100546 (Booth et al., 2021). Methyl cyanide and formaldehyde have been imaged towards a dozen of disks, such as e.g. TW Hya, DG Tau B, DM Tau, HL Tau, MWC 480 (Öberg et al., 2015; Bergner et al., 2018; Loomis et al., 2018; Podio et al., 2019; Podio et al., 2020b; Pegues et al., 2020; Garufi et al., 2021). Typical abundances are: (H2CO), (CH3OH, HCOOH), and (CH3CN). The formaldehyde spatial distribution can be either centrally-peaked or centrally-depressed showing an outer ring at a radius around 50 au (Podio et al., 2019; Podio et al., 2020b; Pegues et al., 2020; Garufi et al., 2021). The emission in the inner few au can indeed be masked by dust optically depth effects. However, the detection of considerable formaldehyde emission beyond the CO snowline shows that formaldehyde can be produced in the gas-phase from species with lower BE than CO. Finally, the abundance of methyl cyanide (and also that of HC3N) is relatively high compared to its simpler relative, HCN (Öberg et al., 2015; Bergner et al., 2018).
In general, in protoplanetary Class I/II disks , N-bearing iCOMs are much easier to detect than other iCOMs observed in the protostellar stage (Sec. 4): methyl cyanide lines are considerably brighter towards the nearby Class II disk around TW Hya compared to either methanol or formic acid (Loomis et al., 2018; Walsh et al., 2016). This suggests, first, that, at least in this disk, the iCOM inventory is not simply/completely inherited from the prestellar or protostellar stages and, second, that the environmental conditions in Class I/II disks favor the production of N-bearing iCOMs. The link between the N- versus O- bearing iCOMs is discussed in § 5.5.
Finally, it is worth noting that the very recent detection of dimethyl ether and, tentatively, methyl formate towards the Herbig IRS 48 transition disk by Brunken et al. (2022) promises an era where it will be possible to observe more iCOMs in protoplanetary disks and, consequently, their chemistry.

5.4 iCOMs in protoplanetary disks of Fu Ori stars
Protoplanetary disks surrounding FU Orionis stars (hereafter Fu Ori) are precious laboratories where to study the disk chemical composition. Indeed, in Fu Ori stars, the luminosity of the central Solar-type young star fluctuates so that the illumination of the surrounding disk can vary by up to 2-3 orders of magnitude. The increased luminosity leads to the dust warming up and it causes the sublimation of the dust icy mantles in relatively large portions of the disk. In turn, this makes it possible to observe the molecular content just released from the grains (see also Sec. 7) and detect iCOMs in the disk.
The case of the disk surrounding the V883 Ori star is an illustrative one. V883 Ori is a Class I protostar, where the surrounding infalling envelope is not yet completely dissipated, with a prominent disk. A burst of the star luminosity was first announced in 1888 (but not measured: Connelley and Reipurth, 2018) and, later, Strom and Strom (1993) have measured a bolometric luminosity of L⊙. The luminosity has steadily decreased in the past years up to the present value of 218 L⊙ (Fischer et al., 2019). Five iCOMs (methanol, formic acid, acetaldehyde, methyl cyanide and methyl formate) have been detected using ALMA observations (van ’t Hoff et al., 2018; Lee et al., 2019b) (Fig. 15). The relatively large emitting region (–0.8 in diameter, equivalent to about 150–300 au) coupled with the ALMA high spatial resolution permit to resolve the iCOM line emission and to map the kinematics of the emitting gas. There are no doubts that the detected iCOMs originate in a rotating disk (Fig. 15 Lee et al., 2019b). Interestingly enough, the derived gas temperature, 100–120 K, and the measured molecules column densities, 1016–1017 cm-2 (Lee et al., 2019b), are similar to the ones observed in typical hot corinos (Sec. 4).
5.5 Astrochemical models
The formation of iCOMs in disks has been modeled in a few studies, probably because of the scarcity of iCOM detections to date. One of the most comprehensive study was carried out by Walsh et al. (2014), who predicted that disk chemistry can produce large quantities of iCOMs (mostly via grain-surfaces reactions: see the discussion below and in Sec. 2). In this model, whether these iCOMs are observable in the gas-phase largely depends on their non-thermal sublimation efficiencies, which are poorly constrained for iCOMs (see § 2.3). In general, the desorption efficiencies are suspected to be quite low, based on the experiments and computations on the paradigmatic iCOM, CH3OH, (e.g. Martín-Doménech et al., 2016; Minissale et al., 2016; Chuang et al., 2018; Pantaleone et al., 2020) and the relatively large BE of the iCOMs. Whatever the mechanism of the iCOM formation, gas-phase (§ 2.4) or grain-surface (§ 2.5)), and the non-thermal desorption efficiency (§ 2.3), the vast majority of produced iCOMs end up frozen into the grain mantles due to their short freeze-out timescales.
Two recent models focused on the most commonly observed iCOM in disks, methyl cyanide (Loomis et al., 2018; Le Gal et al., 2019). They both consider gas-phase (mainly by the radiative association reaction CH + HNC CH3CNH+ + followed by the recombination of CH3CNH+) and grain-surface (mainly hydrogenation of C2N) formation of CH3CN. Loomis et al. (2018) found that gas-phase and grain-surface reactions regulate the CH3CN formation in different regions of the disk: the former at high () heights from the midplane while the latter, which dominates the overall CH3CN column density, closer to the midplane (). In addition, Le Gal et al. (2019) and Fedele and Favre (2020) found that an enhanced C/O ratio facilitates the CH3CN production, because of the increased availability of carbon atoms to form molecules other than CO. This may explain why this particular iCOM is so abundant in disks. Needless to say, all the uncertainties on the chemical processes incorporated in the astrochemical models and discussed in §2 apply to the chemical disk models too, so that a word of caution is mandatory on the interpretation of these theoretical results. Specifically, as also discussed by Loomis et al. (2018), it is important to emphasize that the efficiency of the two above routes of CH3CN formation are highly uncertain, as neither of them has been studied in laboratory or theoretically. In addition, the models assume a reactive and photo- desorption equal to 1% and , respectively, and that the desorption leaves CH3CN intact, which are very likely optimistic values (see discussion in § 2.3.2).
| Element | Detected | Imaged |
|---|---|---|
| O | CH3OH [1], 13CH3OH [2,3], CH2DOH [4] | CH3OH [10], CH2DOH [11] |
| CH3CHO [4], CH3OCH3 [7] | CH3CHO [12], CH3OCH3 [14] | |
| CH3CH2OH [5], HCOOCH3 [5], HCO(CH2)OH [7], HCOOH [5] | ||
| N | NH2CHO [3], CH3CN [9], HC5N [8] | NH2CHO [13], CH3CN [9] |
| S | CH3SH [6] |
Notes: We give as reference the first detection reported in the literature both for detection and interferometric imaging. [1] Bachiller and Pérez Gutiérrez (1997); [2] Codella et al. (2012)); [3] Yamaguchi et al. (2012); [4] Sugimura et al. (2011); [5] Arce et al. (2008) [6] Lefloch et al. (2018); [7] Lefloch et al. (2017); [8] Mendoza et al. (2018); [9] Codella et al. (2009); [10] Benedettini et al. (2007); [11] Fontani et al. (2014); [12] Codella et al. (2015); [13] Codella et al. (2017); [14] De Simone et al. (2020b).
Finally, both models and observations show clear evidence for substantial inheritance of iCOMs into disks from the preceding evolutionary stages. Most of the time, however, the inherited reservoir is expected to be frozen into the icy mantles of the dust grains oi the midplane and, therefore, not observable in the gas-phase. For example, this scenario has been confirmed by the methanol detection towards two Herbig Ae disks, which are too warm to have in situ CH3OH formation from frozen CO hydrogenation (Booth et al., 2021; van der Marel et al., 2021). In summary, both inheritance and in situ chemistry are responsible for the presence of iCOMs in disks. On the one hand, iCOMs formed during the prestellar and protostellar phases are incorporated into Class II disks and constitute a rich chemical reservoir of O- and, at a less extent, N- rich organics. Most of this reservoir is hidden from sight, in the freezing cold disk midplane. On the other hand, in the warmer disk layers, the gas is likely carbon enriched (because oxygen is frozen in the dust icy mantles), which leads to an in situ gas-phase and grain-surface O-poor iCOM chemistry, testified by the presence of abundant complex nitriles. Therefore, inherited and freshly formed iCOMs will eventually seed the forming planetesimals, asteroids, comets and planets.
6 MOLECULAR OUTFLOW SHOCKS: THE SPACE CHEMICAL LABORATORIES
6.1 The census of iCOMs in molecular shocks
The first observational evidence of iCOMs in protostellar outflows dates back to the mid-1990s with the detection and the spectacular map of methanol in the prototypical outflow of L1157 (and two other outflows) by Bachiller et al. (1995). More studies of methanol emission followed up towards a few Solar-type Class 0 sources such as BHR71, NGC133-IRAS2 and confirmed the association of bright CH3OH emission with shocked gas, related to non-steady mass-loss ejections (Bachiller and Pérez Gutiérrez, 1997; Bachiller et al., 1998, 2001; Jørgensen et al., 2004). Multi-line radiative transfer modelling of the CH3OH lines allowed to constrain the gas density and temperature to be higher than the ambient gas, supporting the interpretation of methanol being associated with shocked gas. The next significant step was made by Arce et al. (2008), who reported the first detection, towards the B1 shock of the L1157 outflow, of other iCOMs than methanol: methyl formate, formic acid, methyl cyanide and ethanol. Soon after, Codella et al. (2009) reported the first high resolution map of an iCOM other than methanol, that of the methyl cyanide, again towards L1157-B1, showing a distribution similar, but not exactly the same, to that of the methanol one and definitively different from that of SiO, another classical shock tracer. These results definitely made the shock region L1157-B1 the prototype for studies on the shock-driven chemical complexity.
The new generation of broad-band heterodyne receivers has revolutionized the field by significantly reducing the observation time cost of unbiased spectral line surveys in the sub-mm domain making it possible to detect new molecules towards L1157-B1: methanol and its D-isotopomer CH2DOH, acetaldehyde, formamide (Sugimura et al., 2011; Yamaguchi et al., 2012), dimethyl ether, ketene (H2CCO) and glycolaldehyde (Lefloch et al., 2017), within the IRAM Large Program ASAI (see § 3.3: Lefloch et al., 2018). Remarkably, the same ASAI survey towards the source driving the L1157 outflow, L1157-mm, showed that the latter possesses a much poorer spectrum, dominated by C-bearing species (see § 4.2) in contrast with the iCOM rich spectrum at the shocked site B1 (Bachiller et al., 2001).
The list of iCOMs detected in shocks is given in Table 3. The ASAI spectral survey provides source-averaged () column densities towards L1157-B1 (Lefloch et al., 2017): cm-2 (CH3OH), 2–5 1013 cm-2 (CH3COH, HCOOCH3, HCOCH2OH, CH3OCH3, C2H5OH), and cm-2 (NH2CHO). Thanks to a multiline and profile CO analysis, Lefloch et al. (2012) estimated in the same region an H2 column density equal to cm-2. In turn, this implies iCOMs abundances in the range from a few 10-9 to (CH3OH). The spatial distributions obtained thanks to IRAM NOEMA (Codella et al., 2017, 2020) reveals higher values at the peak regions (not beam-diluted): cm-2 (CH3OH), 7 1013 cm-2 (CH3COH), cm-2 (NH2CHO). In the same vein, imaging the NGC1333-IRAS4A shocked regions, De Simone et al. (2020b) derived column densities up to 5 1015 cm-2 for methanol, cm-2 for acetaldehyde and dimethyl ether, and 5 1012 cm-2 for formamide.
When considering the case of L1157-B1, where the largest number of iCOMs is detected, there is a predominance of O-bearing iCOMs, seven detected, against only three N- and and one S- bearing iCOMs (Tab. 3). In general, the abundances of iCOMs other than methanol are similar, , within a factor of 3, and represent about 2–5% of the methanol abundance. Puzzlingly, relatively large iCOMs such as acetone, ethylene glycol, acrylonitrile and ethyl cyanide have not been detected so far. Note that, on average, iCOM abundances in L1157-B1 are higher than those measured in hot corinos by a factor 2-10, depending on the species, with the possible exception of dimethyl ether (Lefloch et al., 2017). Arce et al. (2008) were the first to notice that the iCOM abundances relative to methanol are similar to those found in massive hot cores and molecular clouds in the Galactic Center region.
Finally, Holdship et al. (2019b) analysed the iCOM line profiles of a sample of eight molecular outflow shocks. They found an approximately constant abundance ratio of methanol over acetaldehyde in the lower-velocity gas and suggested that this is in favor of a grain surface scenario for acetaldehyde formation. However, we note that, if acetaldehyde is formed from ethanol (Vazart et al., 2020), which is probably a grain-surface product (Perrero et al., 2022), a constant abundance ratio [CH3OH]/[CH3CHO] would likely result as well. Holdship et al. (2019b) also found evidence for the destruction of methanol and acetaldehyde in the post-shock gas of fast outflows (see also Suutarinen et al., 2014). We caution, though, that these results, based on the line profile analysis, need to be confirmed by high-spatial-resolution maps of shocked regions.

6.2 The post-shock gas chemical structure
It has recently become possible with radio to mm interferometers to resolve the molecular gas emission down to spatial scales of a few 100 au or less in the nearest star forming regions. This instrumental progress has allowed to peer into the time-dependent chemical structure of the shocked gas and to set stringent constraints on the possible iCOM formation pathway(s) at work in shocked regions.
As already mentioned, the best characterized source is the L1157-B1 shock region, in which several iCOMs and closely related species were mapped at sufficiently high angular resolution to constrain their possible formation pathways (Fig. 16 and Table 3). Dynamical modelling of the outflow and its precessing jet has provided a detailed picture of the mass-ejection history and the associated shock regions, which trace the jet impact against the outflow cavity (Gueth et al., 1996; Podio et al., 2016). Based on these studies, the kinematical age of the L1157-B1 region is yr. Figure 16 shows the chemical differentiation between formamide and acetaldehyde, observed towards L1157-B1 the NOEMA SOLIS Large Project. A key to interpret the L1157-B1 observed chemical structure is SiO, expected to form in high-velocity ( 10 km s-1) shocks, which can sputter dust mantles as well as part of the refractory core (e.g. Guillet et al., 2011). The high-velocity SiO emission identifies the region where the youngest shock events in B1 occurred (Gueth et al., 1998). Therefore, time increases and chemistry evolves going from North to South in Fig. 16. Three main classes of organic molecules can be identified, as follows.
1. Tracers of the entire bow shock structure: The line emission of simple organic species such as H2CO, HNCO or HC3N encompasses the whole outflow lobe, including the bow shock structure of B1 (e.g. Benedettini et al., 2013). These species are also relatively abundant in molecular clouds so that the enhancement of their emission in correspondence to the bow shock is due to the combination of two effects: (i) the increase of the density and temperature of the shocked gas and (ii) the increase of their abundances caused by gas-phase reactions with temperature barriers which become accessible in the warm shocked gas (Burkhardt et al., 2016; Mendoza et al., 2018).
2. Tracers of freshly shocked material: Species such as methanol (e.g. Codella et al., 2020) and the deuterated isotopologue of formaldehyde (e.g. HDCO Fontani et al., 2014) trace only the youngest shocked regions of B1. They are (prevalently) formed on the icy mantles of dust grains in the initial, quiescent pre-shock gas of the natal molecular cloud (see § 2.2), and subsequently released in the initial phase of velocity decoupling between the neutral and ionic fluids. They trace the shocked material freshly injected into the gas-phase and are primarily located at the head of the bow shock. Interestingly, acetaldehyde and methyl cyanide show a spatial distribution similar to that of methanol and HDCO (Codella et al., 2009, 2015, 2020), so that they are likely tracers of freshly shocked gas too.
3. Tracers of chemically evolved shocked material: Formamide represents a peculiar case: it is detected downstream of the freshly shocked material region in L1157-B1 and the high-temperature peak region revealed by the high-velocity SiO (Codella et al., 2017). Note that the anti-correlation between formamide and acetaldehyde is not due to excitation effects; both species are detected through low-lying upper level energy transitions (13-26 K). When considering the sequence of ejection events (see the time arrow in Fig. 16), this implies that formamide is a tracer of chemically more evolved shocked material. We will show in the next subsection that the segregation between formamide and acetaldehyde provides a crucial information that helps to constrain the route of formation of formamide.
The above structure refers to the only shocked region so far investigated in detail, L1157-B1. Even in this case, only a few iCOMs have been studied with mm interferometers until now and a lot remains to be done. Several iCOMs detected with single-dish surveys are still not imaged with interferometers. As we will discuss in the next subsection, having more imaged iCOMs and understanding whether they are associated with fresh or evolved shocked material would provide stringent tests to current iCOM formation models.
Furthermore, it is time to have new ”chemical laboratories” in addition to L1157-B1. This is mandatory to carry on the search for iCOMs in shocked regions as well as to confirm on a statistical basis what has been found so far. Recently, De Simone et al. (2020b) imaged the two outflows driven by the NGC1333-IRAS4A binary system in the context of the NOEMA Large Program SOLIS (Ceccarelli et al., 2017) reporting, beside methanol, the detection of acetaldehyde, dimethyl ether, and formamide.

6.3 Chemical Modelling
While it is established that methanol forms from frozen CO hydrogenation on the dust grain icy surfaces (Watanabe and Kouchi, 2002; Hidaka et al., 2008) (see also § 2.2), the cases of formamide and acetaldehyde are less clear, as for both species routes of formation in the gas-phase and on the grain surfaces have been evoked in the literature. Specifically, formamide can be the product of the gas-phase reaction NH2 + H2CO (Barone et al., 2015; Skouteris et al., 2017) or the grain-surface reaction HCO + NH2 (Garrod et al., 2008) (see the discussion in Sec. 2). Likewise, acetaldehyde can be the product of the gas-phase O + CH3CH2 reaction (Charnley, 2004) and the chain of reactions starting from ethanol (Skouteris et al., 2018) or the grain-surface reaction HCO + CH3 (Garrod et al., 2008).
The chemical stratification of these two species observed in L1157-B1, which corresponds to a chemical evolution (see § 6.2), can be compared with the predicted time-dependent abundance of these species and, hence, can constrain their formation routes. The SOLIS observations by Codella et al. (2017) show that the [CH3CHO]/[NH2CHO] abundance ratio decreases with time (equivalent to a more distant position from the central star: see Fig. 16). To reproduce this trend either acetaldehyde is destroyed faster than formamide or formamide takes more time to be formed. This already rules out that both species are both sputtered from the grain mantles because they would be injected at the same time and destroyed by similar reactions with molecular ions: hence, their abundance ratio should be constant across the B1 region (Codella et al., 2017).
Figure 17 shows the model predictions obtained by Codella et al. (2017) assuming that formamide and acetaldehyde are formed in the gas-phase or grain surfaces. The observed [CH3CHO]/[NH2CHO] decrease with time can only be reproduced if NH2CHO forms in the gas-phase at later times than CH3CHO. This is because NH2 is formed in the gas-phase from ammonia, which is sputtered from the grain mantles, and the conversion takes time. With a different and more complete modeling, Burkhardt et al. (2019) reached the same conclusion, i.e. that formamide attains high abundances in the post shock phase at the B1 kinematical age ( yr) only if formed in the gas-phase.
On the contrary, so far observations towards L1157-B1 have been unable to put constrain to the formation routes, grain-surface and gas-phase chemistry, of acetaldehyde. Codella et al. (2020) observed a substantial overlap between the spatial distribution of acetaldehyde and methanol towards L1157-B1 (Fig. 16). Using methanol as reference of grain-surface product sputtered in the shock, this indicates that either acetaldehyde is formed on the grain surfaces or that it is quickly ( 103 yr) formed in the gas-phase using a parent molecule released from dust mantles. Unfortunately, the relatively large errors in the estimates of the methanol and acetaldehyde column densities do not allow to discriminate between these two hypothesis (Codella et al., 2020). That said, if the major formation route of acetaldehyde is the gas-phase reaction O + CH3CH2 (Charnley, 2004), then CH3CH2 would be formed from C2H6, released from dust mantles. Figure 17 shows the model predicted [CH3OH]/[CH3CHO] abundance ratio as a function of the methanol and the CH3CH2 abundance. In order to reproduce the observed abundance ratio and the large () methanol abundance, very high CH3CH2 abundances are requested, i.e. about 0.1% of carbon would be locked into iced hydrocarbons (Codella et al., 2020). A similar conclusion is reached by De Simone et al. (2020b) in their study of the IRAS4A outflows, also reported in Fig. 17. As for formamide, using a sophisticated modeling, Burkhardt et al. (2019) concluded that the CH3CHO formation in the gas-phase is predominant in the post-shock region of L1157-B1.
6.4 Future challenges
Having seen the ability of interferometric maps of shocked regions to efficiently constrain the chemistry at work, it is essential to obtain images of more iCOMs, for example those already detected using single-dish telescopes, such as CH3OCH3, CH3OCHO, and HCOCH2OH.
However, in order to fully take advantage of the observations, a better understanding of the iCOM formation and destruction routes in shocks is mandatory. This requires a detailed description of both the structure and chemistry of the shocked dust and gas, as well as the microphysics entering into the chemical process (Sec. 2). Different approximations are usually made regarding the dust grain surface chemistry and reactivity, from considering only dust sputtering but neglecting the shock impact on the dust structure, to modelling the dust behaviour (heating, reactivity, condensation) across the shock. The knowledge of the initial conditions in the pre-shock phase is also essential, given that it determines both the abundances of iCOMs present on the mantles and their precursors, which come into play once released into the gas-phase.
Species produced by H atom addition reactions, such as CH3OH, are predicted to be abundant in icy mantles in the pre-shock gas. Conversely, the formation of iCOMs on the grain surfaces via radical-radical combination (Garrod et al., 2008) would have a very low efficiency at low dust temperature (§2.5), so that no iCOM is expected to be formed in this way. Likewise, the non-diffusive iCOM formation route proposed by Jin and Garrod (2020) would also be inefficient, as it needs a prevalently CO covered surface to take place (§2.5), while the shocked regions are usually far away from the centers and, therefore, the mantles are rather CO-poor. To support this point, the methanol abundance is a small fraction (%) of the CO one in those shocked regions. On the other hand, at high temperatures, it appears that some species released from grain mantles are chemically processed in the hot post-shock gas. This is well illustrated by formamide, whose abundance is predicted to efficiently increase in the post-shock region, in agreement with the L1157-B1 observations.
The observation of a similar/different behaviour in other iCOMs (e.g. methyl formate) would be a good test for their formation routes. The sensitivity to the initial gas and dust conditions, the role of the CR ionization rate and an external radiation field, the duration and elemental composition of the gas-phase, the influence of the shock parameters (density, velocity, B-field) on iCOM chemistry, and the possible O/N differentiation, also remain to be investigated.
Finally, low-velocity shocks deserve attention as they can release molecules from the grain mantles without destroying most molecular bonds. They are also the best sites to test the occurrence of a short-lived dust warm-up phase before sputtering takes over, which would result from collisional heating and could induce a rapid formation of iCOMs on ice mantles. Sputtering efficiency in the low-velocity regime has been poorly studied and observational/experimental constraints to models are needed.
7 COMETS: GET THE ORGANICS OUT OF THE REFRIGERATOR
7.1 Overview
Comets are among the most primitive and unprocessed bodies in the Solar System. They likely formed at large distances from the Sun, where volatile ices could condense and remain stable, and retain a cosmochemical record of the composition of, and the processes in, the Solar Nebula (aka, the Solar System protoplanetary disk). They have been stored in cold, distant orbits, either in the Kuiper Belt region at 35–100 au (which is the source of short-period comets of the Jupiter family), or in the Oort cloud at au (the source of long period comets). The primitive nature of cometary material is confirmed by, e.g., a near-solar bulk elemental composition including the light elements C and O (Bardyn et al., 2017; Rubin et al., 2019), no clear evidence of aqueous alteration after accretion unlike asteroids (Capaccioni et al., 2015; Quirico et al., 2016), and the presence of highly volatile ices such as N2 and CO, e.g. see Rubin et al. (2015) for measurements in comet 67P/Churyumov-Gerasimenko (hereafter 67P).
The present knowledge of the composition of cometary ices is essentially based on remote sensing and in situ investigations of cometary atmospheres. A little more than two dozen molecules (not including isotopologues, molecular ions, atoms and radicals) have been identified from spectroscopic investigations in the radio (20–600 GHz), near-IR (2.9–5 m), and, to a lesser extent, UV domains. The major volatiles are water (about 80% by number) followed by CO2, CO, CH3OH, H2CO, CH4, H2S and CH4 (Table 4, Bockelée-Morvan and Biver, 2017; Rubin et al., 2020).
7.2 iCOMs in comets
Most of the iCOMs, including methyl formate, acetaldehyde, ethylene glycol and formamide, have been first identified in the great comets C/1996 B2 (Hyakutake) and C/1995 O1 (Hale-Bopp) from emission lines in the mm range (Lis et al., 1997; Bockelée-Morvan et al., 2000; Crovisier et al., 2004). More recently, glycolaldehyde and ethanol were discovered in the atmosphere (i.e. coma) of C/2014 Q2 (Lovejoy), together with other previously identified iCOMs (Biver et al., 2014, 2015). Sensitive upper limits for iCOMs that are found in protostars (e.g., acetic acid, and dimethyl ether: Sec. 4) have also been derived from spectra of bright comets (Crovisier et al., 2004; Biver et al., 2021).
The ESA/Rosetta mission (Taylor et al., 2017) accompanied comet 67P, a short-period comet of the Jupiter family, for over two years along its orbit around the Sun, and provided a more complete picture of the composition of cometary ices by more than doubling the number of identified molecules (Altwegg et al., 2019; Rubin et al., 2019, 2020; Hänni et al., 2022). The payload of the Rosetta mission included several mass spectrometers designed for gas-phase studies that all revealed a chemical complexity of the organics: COSAC (Cometary Sampling and Composition experiment) (Goesmann et al., 2015) and Ptolemy (Wright et al., 2015) on the Philae lander, which collected information directly from the comet surface, and DFMS (Double Focusing Mass Spectrometer) and RTOF (Reflectron-type Time-Of-Flight Mass Spectrometer) of the ROSINA instrument suite, which observed the coma throughout the two-year encounter. Thanks to a high mass resolution (/ = 3000 at 1% peak height) and large mass range (12–150 amu), DFMS was perfectly suited for a detailed analysis of the comet’s organic composition. Since mass spectrometers cannot unambiguously distinguish isomers as they have the same mass, the identification of large cometary iCOMs was made considering the expected fragmentation pattern inside the instrument and the detection of the daughter species in the mass spectra. However, unequivocal isomer identification was often difficult (Rubin et al., 2019; Schuhmann et al., 2019b). For example, the abundances of methyl formate and glycolaldehyde (which have the chemical formula C2H4O2 and, hence, the same mass 60 Da) could not be measured from DFMS mass spectra (Schuhmann et al., 2019b). Their isomer, acetic acid, best explains the fragmentation pattern observed in DFMS mass spectra acquired in May 2015 (Schuhmann et al., 2019b) but, in spectra acquired in September 2016, most of the C2H4O2 60 u/e peak was assigned to glycolaldehyde (Altwegg et al., 2020). Another example is the detected peak at 62 u/e, which might be a combination of ethylene glycol (detected in several comets by spectroscopy) and methoxymethanol (CH3OCH2OH), both observed in protostellar sources, including the Solar-type Class 0 IRAS 16293-2422 source (Manigand et al., 2020).
| Moleculea | Cometsb | 67Pc |
| O2 | – | 3.1 1.1 |
| CO | 0.4–35 | 3.1 0.9 |
| CO2 | 2.5–30 | 4.7 1.4 |
| CH4 | 0.12–1.5 | 0.340.07 |
| C2H2 | 0.04–0.5 | – |
| C2H4 | 0.2 | – |
| C2H6 | 0.14–2.0 | 0.290.06 |
| C3H8 | – | 0.0180.004 |
| C6H6 | – | 0.000690.00014 |
| C7H8 | – | 0.00620.0012 |
| CH3OH | 0.7–6.1 | 0.210.06 |
| H2CO | 0.13–1.4 | 0.320.10 |
| HCOOH | 0.03–0.18 | 0.0130.008 |
| CH3CHO | 0.05–0.08 | 0.0470.017 |
| c-C2H4O | 0.006 | |
| CH2CHOH | – | |
| CH2CO | 0.008 | – |
| HCOOCH3 | 0.06–0.08 | |
| CH2OHCHO | 0.02–0.04 | |
| CH3COOHd | 0.03 | 0.00340.0020 |
| C2H5OH | 0.1–0.2 | 0.039 0.023 |
| CH3OCH3 | 0.025 | |
| (CH2OH)2 | 0.07–0.35 | 0.0110.007 |
| CH3OCH2OH | – | |
| CH3(CH2)2CHO | – | 0.0100.003 |
| CH3CH2OCH=CH2 | – | |
| CH3COOCH3 | – | 0.00210.0007 |
| CH3CH2COOH | – | |
| CH3CCH2OH | – | |
| CH3CH2CHO | – | 0.00470.0024 |
| (CH3)2CO | 0.01 | |
| NH3 | 0.3–0.7 | 0.670.20 |
| N2 | – | 0.0890.024 |
| HCN | 0.08–0.25 | 0.140.04 |
| HNC | 0.002–0.035 | |
| HNCO | 0.009–0.08 | 0.0270.016 |
| HCNO | 0.0016 | |
| CH3CN | 0.008–0.054 | 0.00590.0023 |
| CH3NC | – | |
| HC3N | 0.002–0.068 | 0.000400.00023 |
| HC5N | 0.003 | – |
| NH2CHO | 0.016–0.022 | 0.00400.0023 |
| CH2NH | 0.03 | – |
| CH3NH2 | 0.06 | – |
| NH2CN | 0.004 | – |
| C2H3CN | 0.003 | – |
| C2H5CN | 0.004 | – |
NOTES: a Isomers contributing to the mass peak in DFMS mass spectra are listed. b Range of values and upper limits from remote sensing spectroscopic observations in a large ( 50) sample of comets (Bockelée-Morvan and Biver, 2017; Biver et al., 2021, 2022; Crovisier et al., 2004). c Measurements with the DFMS/Rosetta instrument from data acquired in May 2015 at au from the Sun (Rubin et al., 2019). d Best explains the DFMS data acquired in May 2015.
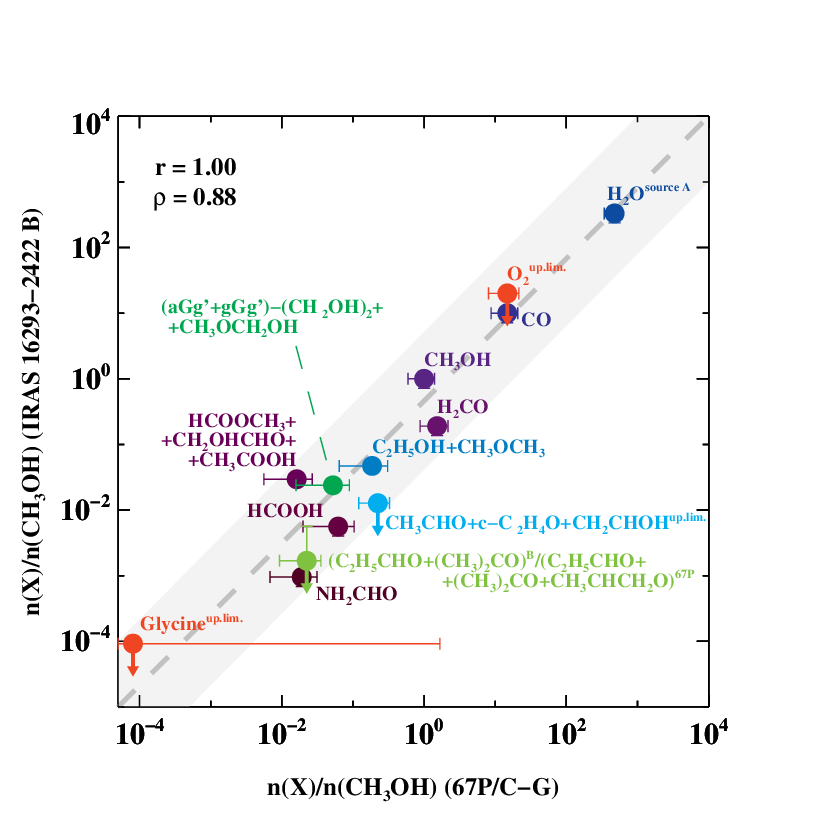
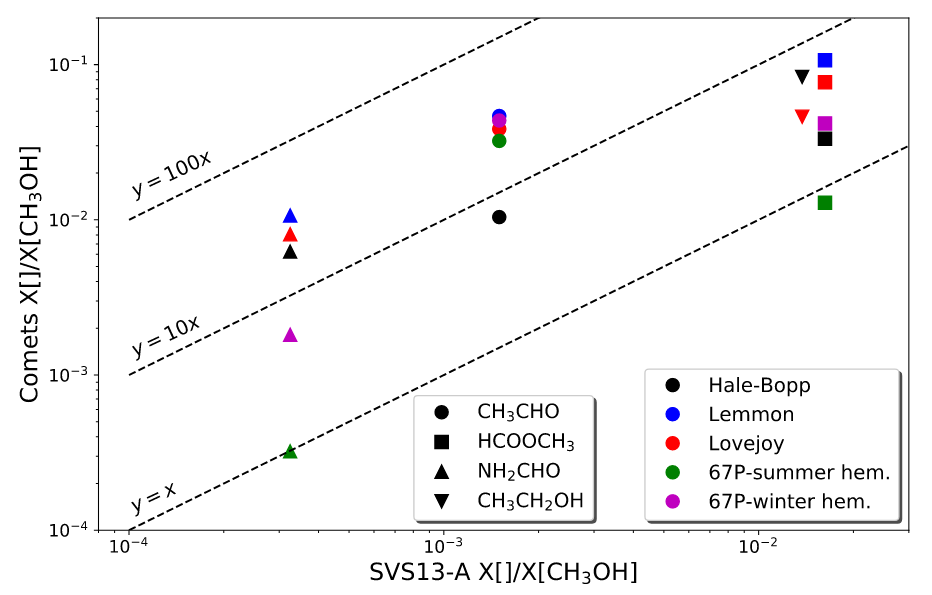
A list of organics identified by ROSINA/DFMS, which includes a great variety of CH-, CHN-, CHS-, CHO-, CHO2-, and CHNO- bearing saturated and unsaturated species, is given by Altwegg et al. (2019) and Hänni et al. (2022). Among the newly identified cometary iCOMs are compounds at mass of 58 Da, that could be acetone or propanal, or a combination of both. These two species have been detected in protostellar sources, with the former dominating the latter by a factor of in IRAS 16293-2422 B (Lykke et al., 2017). Acetone is indicated as firmly identified in comet 67P by Altwegg et al. (2017). A peak at 72 u/e is identified as C4H8O, and is provisionally attributed to butanal (CH3(CH2)2CHO) (Schuhmann et al., 2019b). Another peak at 74 u/e is best assigned to methyl acetate (CH3COOCH3) (Schuhmann et al., 2019b). The detected hydrocarbons include the full series of alkanes up to C9H20, and aromatic hydrocarbons such as benzene, C6H6, toluene, C7H8, xylene, C8H10 and naphtalene, C10H8 (Altwegg et al., 2019; Schuhmann et al., 2019a; Hänni et al., 2022). Complex alcohols are detected (e. g. propanol and pentanol) as well as complex acids as benzoic acid (C7H6O2). Besides HNCO and NH2CHO, first detected in cometary mm spectra, two other CHON compounds are identified in 67P mass spectra: acetamide (CH3CONH2), and glycine (C2H5NO2) (Altwegg et al., 2016), with several lines of evidence that glycine is released from warm dust icy grains. The concentration of glycine in water ice is estimated to 170 ppb in mass (Hadraoui et al., 2019). Methylamine (CH3NH2) and ethylamine (C2H5NH2) are seen in the mass spectra only when glycine is detected, with relative abundances with respect to glycine of 1.00.5 and 0.30.2 (Altwegg et al., 2016), respectively, suggesting a formation pathway for glycine, e.g., via the photochemistry of methylamine and CO2 ice (Bossa et al., 2010). Glycine and these two amines were previously detected in the dust particles collected by the Stardust sample return mission (Glavin et al., 2008). Finally, new organo-sulfur compounds have been identified : methyl mercaptan (CH3SH), a combination of ethyl mercaptan (C2H5SH) and dimethyl sulfide (CH3SCH3), and methyl hydrogen sulfide (CH4S2) (Calmonte et al., 2016; Altwegg et al., 2019).
The ROSINA/DFMS spectra collected on 3 August 2015, when comet 67P was just about to reach its perihelion, showed signals of C-bearing species up to = 140 u/e (Hänni et al., 2022). The DFMS likely measured the outgassing from both the nucleus and small dust particles. The mass spectra are dominated by the signatures of hydrocarbons, with the next dominant group being CHO-bearing species. A plethora of chained-based, cyclic, and aromatic hydrocarbons are present, at a ratio of 6:3:1. The ensemble has an average composition of C1O0.134N0.046S0.017, not considering the abundant and major C-bearing cometary gases (e.g. CO, CO2 Hänni et al., 2022).
Tables 4 and 5 present a compilation of the abundances measured using spectroscopy in a large sample of comets (Bockelée-Morvan and Biver, 2017). It also lists abundances in comet 67P’s coma derived from DFMS May–2015 data at 1.5 au from the Sun (Rubin et al., 2019); quantification is still missing for a number of detected species. Abundances vary by a factor of about 3 to 100 (for CO), both in the Oort-cloud and Kuiper-Belt comet populations (Dello Russo et al., 2016; Bockelée-Morvan and Biver, 2017). There is increasing evidence that this chemical diversity is primarily primitive (related to comet formation environment), and secondarily the result of evolutionary processing history after formation (Dello Russo et al., 2016; A’Hearn et al., 2012; Rubin et al., 2020). Whereas the majority of the detected molecules are presumably released from the nucleus ices, there are lines of evidence that some of them have significant contributions from extended sources in the coma. The best documented species are H2CO and HNC, whose behaviors with heliocentric distance and spatial distributions suggest that they are produced by the thermal degradation of organic grains (Lis et al., 2008; Cordiner et al., 2014). Several ammoniated salts (NH4Cl, NH4CN, NH4OCN, NH4HCOO, and NH4CH3COO) have been identified in a grain of comet 67P (Altwegg et al., 2020), and are present as well on the whole nucleus surface (Poch et al., 2020). Their sublimation in the coma should be the source of some of the detected cometary species (e.g., HCOOH, HNCO), the contribution of which is still unclear.
Altogether, based on the coma volatile composition, CHO-bearing molecules constitute % of the volatiles (in number) in cometary ices, hydrocarbons %, N-bearing %, and S-bearing %. Saturated aliphatic and aromatic hydrocarbons are in about equal (namely 44:56) proportion (Schuhmann et al., 2019b). A huge fraction of the organic material is in the refractory phase (almost 50% by weight), in the form of very large macromolecular compounds, analogous to the insoluble organic matter (IOM) found in carbonaceous chondritic meteorites (Fray et al., 2016). The composition and structural properties of the organics captured by ROSINA/DFMS near 67P perihelion resemble to meteoritic soluble organic matter (SOM) (Hänni et al., 2022). Finally, a large fraction of nitrogen is possibly locked in the ammonium salts (Altwegg et al., 2020; Poch et al., 2020).
| Moleculea | Cometsb | 67Pc |
|---|---|---|
| H2S | 0.09–1.5 | 0.110.046 |
| OCS | 0.05–0.40 | 0.041 |
| CS | 0.02–0.20 | – |
| CS2 | – | 0.0057 |
| SO | 0.04–0.30 | 0.071 |
| SO2 | 0.03-0.23 | 0.127 |
| S2 | 0.001-0.25 | 0.002 |
| H2CS | 0.009-0.09 | 0.0027 |
| CH3SH | 0.023 | 0.038 |
| C2H5SH | – | 0.00058 |
| (CH3)2S | – | |
| NS | 0.006–0.012 | – |
| (CH3)2S | – | |
| NS | 0.006–0.012 | – |
a,b,c see caption to Table 4.
7.3 Cometary ices and protostellar environments

The similarity of cometary ices with interstellar ices and protostellar environments was first highlighted in the early 2000s. Ehrenfreund and Charnley (2000) made comparisons with simple interstellar ices observed with the Infrared Space Observatory (ISO) and concluded that cometary ices are a mixture of original interstellar material and material that has been processed to some extent in the Solar Nebula. Bockelée-Morvan et al. (2000) found a strong correlation between Hale-Bopp’s abundances of CHO– and N-bearing molecules and those measured in hot cores and bipolar flows, and concluded that similar chemical processes must be at work forming these compounds under comparable conditions, perhaps gas-grain chemistry. A similar conclusion was obtained using early DFMS data of comet 67P (at 3 au from the Sun) from Le Roy et al. (2015) and comparing with the same ISM abundances as used by Bockelée-Morvan et al. (2000). A detailed comparison of comet 67P (abundances from Tables 4–5) with the Solar-type young Class 0 protostar IRAS 16293-2422 B was recently performed by Drozdovskaya et al. (2019), and shows a close match for CHO– (Fig. 18) and N-bearing molecules, as well as for the S-bearing species albeit with a significant scatter. Likewise, Bianchi et al. (2019) found a good agreement between the formamide and methyl formate abundance in the Class I protostar SVS13-A and the 67P ices, within a factor 10. On the contrary, the comparison with other comets shows larger difference, in particular for the acetaldehyde and formamide (Fig. 18).
In Fig. 19, we summarise the comparison of iCOMs abundances measured in the Oort-cloud comets C/1995 O1 (Hale-Bopp) and C/2014 Q2 (Lovejoy) with several low mass protostellar objects. In addition to IRAS 16293-2422 B, an instructive comparison with the Class 0 stage can be done with HH 212. Lee et al. (2019a) and Lee et al. (2022) imaged several iCOMs (e.g. CH3OH, CH3CHO, HCOOCH3, NH2CHO and CH3CH2OH) associated with the rotating accreting disk within au from the protostar. Figure 19 shows that the abundance ratios of iCOMs, with respect to methanol, of HH 212 and the comets are, within a factor of a few, consistent.
FU Orionis (FU Ori) stars are young stellar objects (§ 5.4) that undergo rapid increases of accretion rate, and high luminosity enhancements shifting the snow lines to much larger radii. They provide a unique and direct probe to study the composition of material freshly sublimated from ices located in the disk midplane. Several iCOMs (CH3OH, HCOOH, CH3CHO, HCOOCH3, CH3COCH3, c-H2COCH2, CH3CN, CH3SH) have been detected in the FUor V883 Ori (Lee et al., 2019b), whose water snow line in the disk mid-plane has been estimated to be located at au (Cieza et al., 2016). The estimated abundances of acetaldehyde and methyl formate agree with those measured in comets (Fig. 19). The abundance of acetone, relative to methanol, [CH3COCH3]/[CH3OH[ = 0.014 (Lee et al., 2019b), is comparable with the value measured in comet 67P (0.022, Table 4). However, formic acid is more abundant in V883 Ori than in comets, but the identification in V883 Ori is considered as tentative (Lee et al., 2019b).
The comparison of the cometary ices with the chemical composition observed in the shocked regions induced by protostellar jets is, in principle, very instructive. Indeed, in these regions, the chemical content of the gas is enriched with the grain mantle components injected into the gas-phase because of the sputtering and shattering of the dust (both volatile mantles and refractory cores: see Sec. 6). Thus, Fig. 19 reports also the iCOM content of the prototypical L1157-B1 shocked region (§ 6.1) showing a good agreement with what is obtained in comets.
In summary, these findings suggest a limited chemical evolution of the iCOMs content, when considering relative abundances, during the evolution from the Class 0/I protostellar phases to comets. It is tempting to conclude that the chemical complexity in the regions where planets form has been significantly inherited from the earliest star forming stages. However, this speculation is based on a limited number of objects and needs to be supported by the measurements of a statistically significant number of protostars, imaged on Solar System scales (as in the HH 212 case: § 5.2), as well as of comets.
As final remark, it is important to stress that the mere presence of iCOMs in cometary ices is not an evidence of their formation on the grain surfaces (Sec. 2) as, even if formed in the gas-phase, iCOMs would anyway freeze-out onto the grain surfaces in the cold regions of the protoplanetary disk of the Solar Nebula (see Sec. 5 and, more specifically, § 5.5) and then they would be found frozen in the cometary ices.
7.4 D fractionation in iCOMs
It has been shown that molecular deuteration is a good proxy to link the various evolutionary stages of a Solar-type star and planet formation and the small bodies of the Solar System, including comets (e.g. Ceccarelli et al., 2014a, and see also the Chapter by Nomura et al.).
In comets, only deuterated methanol has been so far detected. Specifically, D-methanol (CH3OD and CH2DOH combined) and D2-methanol (CH2DOD and CHD2OH combined) have been detected in ROSINA mass spectra of comet 67P, with abundances of 5.50.5% and 0.0690.014% relative to normal methanol, respectively (Drozdovskaya et al., 2021). The cometary D-methanol abundance is consistent with the values measured with interferometers in Class 0 and I hot corinos (Bianchi et al., 2017b; Bianchi et al., 2020; Jørgensen et al., 2018; Jacobsen et al., 2019; Manigand et al., 2020; van Gelder et al., 2020), supporting the inheritance scenario also for methanol deuteration. Unfortunately, a meaningful comparison between D2-bearing cometary methanol and existing ISM values (Bianchi et al., 2017a) is currently not feasible (Drozdovskaya et al., 2021), because of the various uncertainties in the derivation of the column densities, the major one being linked to spectroscopic data. The D/H ratio has also been measured in the refractory organic material of 67P (Paquette et al., 2021). It is one order of magnitude lower than the D/H ratio in cometary methanol, but much higher than the D/H protosolar value and also higher than the bulk value in primitive chondritic IOM, suggesting at least partial inheritance from the pre-solar stage (Paquette et al., 2021). The macromolecular organics in comets and carbonaceous meteorites possibly formed from the UV irradiation of ice mixtures, but the exact formation mechanism is unknown.
8 CONCLUSIONS: CONNECTING THE DOTS TO DISCOVER OUR ORIGINS
Organic chemistry has a very special role in Chemistry, because it lies at the basis of terrestrial life. It starts with small molecules and reaches the complexity that makes a living being. This is chemistry, the bonding of atoms in structures, in a seemingly infinite number of combinations. Yet, they are not random combinations, because all the chemical structures, from the smallest to the most complex ones, just follow the laws of Physics. Everything is connected to and is a consequence of the laws of Physics, hence also life. Take the three most abundant and critical elements for terrestrial life: hydrogen, oxygen and carbon. The first two make water molecules, while the last is the basis of organic chemistry. It cannot be a pure chance that H, O and C are also the three most abundant elements in the Solar neighborhood, when excluding He which does not participate in chemistry. Life, thus, used what was available in the largest quantities.
Water is known to be very abundant in Solar-type star forming regions (e.g. Whittet et al., 1988; Ceccarelli et al., 1999; Cernicharo and Crovisier, 2005; van Dishoeck et al., 2021), exactly because O and H are abundant and H2O is easily formed on the grain mantles (e.g. Tielens and Hagen, 1982; Oba et al., 2009; Mokrane et al., 2009; Dulieu et al., 2010; Molpeceres et al., 2019). Organic chemistry is now known to be active and rich in Solar-type star forming regions, as described throughout this Chapter. In fact, all interstellar molecules with at least six atoms are organic. Again, this is due to the laws of Physics, specifically the electronic structure of C, which gives the largest number of possible bonds among the most abundant elements synthesised in the stellar nucleosynthesis. Silicon would also be potentially a large-molecule maker but, contrary to C, it is mostly trapped into the refractory dust grains and, hence, not available for making molecules, in addition to making much weaker chemical bonds than carbon.
In this Chapter, we have shown that organic chemistry starts to be complex very early in the formation of a Solar-type planetary system, already at the starless core phase, when gravitational collapse has not even started (Sec. 3). It then progresses at its highest level of known richness during the protostellar phase, in the hot corinos, which have sizes comparable to the planet forming regions (Sec. 4). Although more difficult to observe for practical reasons, it is very likely that the same level of organic complexity, if not higher, is also present in protoplanetary disks, where planets, asteroids and comets form (Sec. 5). We can study the processes responsible for this organic richness better in molecular outflow shocks, because they provide the precious additional constraint of temporal chemical evolution (Sec. 6). As a matter of fact, we find a similar organic chemical composition, within a rough factor of 10, of comets and various objects during the Solar-type star formation process (Sec. 7).
With the advent of larger or more sensitive facilities the ”interstellar organic world” continues to expand and, at present, the limit to new discoveries comes from the lack of spectroscopic data (e.g. Cernicharo et al., 2021c). However, whatever the progress will be and whatever complex organic molecule will be discovered, there will always be a limit to which molecule we can identify from astronomical observations. This limit exists because of the intrinsic problem that the larger the molecule the more numerous and, consequently, the weaker the lines. This will lead to a point where any spectrum will consist of a ”grass” of faint lines, where the line coincidence criterion for identifying a species will fail. Therefore, in order to know the ultimate organic complexity reachable during the Solar-type star forming process, we need a reliable theory for the iCOM formation. As very briefly discussed in Sec. 2 and throughout the following sections, we are far from being in that position. Many more interdisciplinary studies are necessary, where laboratory experiments and quantum chemical computations need to converge to understand the micro-physics processes. Only then can they reliably be incorporated into astrochemical models and the astronomical observations compared with model predictions (see for example the interdisciplinary projects DOC -the Dawn of Organic Chemistry101010https://doc.osug.fr/- and ACO -AstroChemical Origins111111www.aco-itn.org). This is the future for organic astrochemistry and there are no shortcuts. Eventually, only when astrochemical models can be trusted in predicting the existence of molecules that we will never be able to detect, will we be in a position to know the ultimate organic complexity reached by our Solar System progenitor, and whether it may have had a role in the emergence of life on Earth.
Acknowledgments This project has received funding within the European Union’s Horizon 2020 research and innovation programme from the European Research Council (ERC) for the project “The Dawn of Organic Chemistry” (DOC), grant agreement No 741002, and from the Marie Sklodowska-Curie for the project ”Astro-Chemical Origins” (ACO), grant agreement No 811312. We wish to thank Prof. P. Ugliengo, Dr. A. Rimola, Dr. J. Enrique-Romero, Dr. S. Pantaleone, L. Tinacci and Prof. Gretobape for the numerous and stimulating discussions on interstellar grain-surface chemistry. We also acknowledge the extremely useful discussions with Dr. A. Lopéz-Sepulcre, Dr. L. Podio, Prof. S. Viti, and the invaluable contribution of Dr. E. Bianchi, Dr. M. Bouvier and Dr. M. De Simone.
References
- Agúndez and Wakelam (2013) Agúndez M. and Wakelam V., 2013 Chem.Rev., 113, 12, 8710.
- Agúndez et al. (2021) Agúndez M. et al., 2021 A&A, 647, L10.
- A’Hearn et al. (2012) A’Hearn M. F. et al., 2012 ApJ, 758, 1, 29.
- Aikawa and Herbst (1999) Aikawa Y. and Herbst E., 1999 A&A, 351, 233.
- Aikawa et al. (2020) Aikawa Y. et al., 2020 ApJ, 897, 2, 110.
- Altwegg et al. (2016) Altwegg K. et al., 2016 Sci.Adv., 2, 5, 1600285.
- Altwegg et al. (2017) Altwegg K. et al., 2017 MNRAS, 469, S130.
- Altwegg et al. (2019) Altwegg K. et al., 2019 ARA&A, 57, 113.
- Altwegg et al. (2020) Altwegg K. et al., 2020 Nat.Astr., 4, 533.
- André et al. (2014) André P. et al., 2014 Protostars and Planets VI, pp. 27–51.
- André et al. (2019) André P. et al., 2019 A&A, 629, L4.
- Arce et al. (2008) Arce H. G. et al., 2008 ApJ, 681, L21.
- Arumainayagam et al. (2019) Arumainayagam C. R. et al., 2019 Chem.Soc.Rev., 48, 2293.
- Bachiller and Pérez Gutiérrez (1997) Bachiller R. and Pérez Gutiérrez M., 1997 ApJ, 487, 1, L93.
- Bachiller et al. (1995) Bachiller R. et al., 1995 A&A, 295, L51.
- Bachiller et al. (1998) Bachiller R. et al., 1998 A&A, 335, 266.
- Bachiller et al. (2001) Bachiller R. et al., 2001 A&A, 372, 899.
- Bacmann et al. (2002) Bacmann A. et al., 2002 A&A, 389, L6.
- Bacmann et al. (2003) Bacmann A. et al., 2003 ApJ, 585, L55.
- Bacmann et al. (2012) Bacmann A. et al., 2012 A&A, 541, L12.
- Balucani et al. (2015) Balucani N. et al., 2015 MNRAS, 449, L16.
- Bardyn et al. (2017) Bardyn A. et al., 2017 MNRAS, 469, S712.
- Barone et al. (2015) Barone V. et al., 2015 MNRAS, 453, L31.
- Belloche et al. (2011) Belloche A. et al., 2011 A&A, 535, A2.
- Belloche et al. (2020) Belloche A. et al., 2020 A&A, 635, A198.
- Ben Chouikha et al. (2022) Ben Chouikha I. et al., 2022 RSC Advances, 12, 29, 18994.
- Benedettini et al. (2007) Benedettini M. et al., 2007 MNRAS, 381, 3, 1127.
- Benedettini et al. (2013) Benedettini M. et al., 2013 MNRAS, 436, 1, 179.
- Benson and Myers (1989) Benson P. J. and Myers P. C., 1989 ApJS, 71, 89.
- Bergner et al. (2018) Bergner J. B. et al., 2018 ApJ, 857, 69.
- Bergner et al. (2019) Bergner J. B. et al., 2019 ACS ESC, 3, 8, 1564.
- Bernstein et al. (1995) Bernstein M. P. et al., 1995 ApJ, 454, 327.
- Bernstein et al. (1999) Bernstein M. P. et al., 1999 Science, 283, 1135.
- Bertin et al. (2016) Bertin M. et al., 2016 ApJ, 817, L12.
- Bianchi et al. (2017a) Bianchi E. et al., 2017a MNRAS, 467, 3011.
- Bianchi et al. (2017b) Bianchi E. et al., 2017b A&A, 606, L7.
- Bianchi et al. (2019) Bianchi E. et al., 2019 MNRAS, 483, 1850.
- Bianchi et al. (2020) Bianchi E. et al., 2020 MNRAS, 498, 1, L87.
- Bianchi et al. (2022a) Bianchi E. et al., 2022a submitted.
- Bianchi et al. (2022b) Bianchi E. et al., 2022b A&A, 662, A103.
- Bianchi et al. (2022c) Bianchi E. et al., 2022c ApJ, 928, 1, L3.
- Bisschop et al. (2006) Bisschop S. E. et al., 2006 A&A, 449, 3, 1297.
- Biver et al. (2014) Biver N. et al., 2014 A&A, 566, L5.
- Biver et al. (2015) Biver N. et al., 2015 Sci.Adv., 1, 1500863.
- Biver et al. (2021) Biver N. et al., 2021 A&A, 648, A49.
- Biver et al. (2022) Biver N. et al., 2022 arXiv e-prints, arXiv:2207.04800.
- Bizzocchi et al. (2014) Bizzocchi L. et al., 2014 A&A, 569, A27.
- Blake et al. (1987) Blake G. A. et al., 1987 ApJ, 315, 621.
- Bockelée-Morvan and Biver (2017) Bockelée-Morvan D. and Biver N., 2017 Phyl.Trans.Roy.Soc. London S.A, 375, 2097, 20160252.
- Bockelée-Morvan et al. (2000) Bockelée-Morvan D. et al., 2000 A&A, 353, 1101.
- Boogert et al. (2015) Boogert A. C. A. et al., 2015 ARA&A, 53, 541.
- Booth et al. (2021) Booth A. S. et al., 2021 Nat.Astr., 5, 684.
- Bossa et al. (2010) Bossa J. B. et al., 2010 J. Phys. Org. Chem., 23, 333.
- Bottinelli et al. (2004a) Bottinelli S. et al., 2004a ApJ, 615, 354.
- Bottinelli et al. (2004b) Bottinelli S. et al., 2004b ApJ, 617, 1, L69.
- Bottinelli et al. (2007) Bottinelli S. et al., 2007 A&A, 463, 601.
- Bouvier et al. (2020) Bouvier M. et al., 2020 A&A, 636, A19.
- Bouvier et al. (2021) Bouvier M. et al., 2021 A&A, 653, A117.
- Bouvier et al. (2022) Bouvier M. et al., 2022 ApJ, 929, 1, 10.
- Bovolenta et al. (2020) Bovolenta G. et al., 2020 Mol.Astr., 21, 100095.
- Brunken et al. (2022) Brunken N. G. C. et al., 2022 A&A, 659, A29.
- Brünken et al. (2014) Brünken S. et al., 2014 Nature, 516, 7530, 219.
- Burkhardt et al. (2016) Burkhardt A. M. et al., 2016 ApJ, 827, 1, 21.
- Burkhardt et al. (2019) Burkhardt A. M. et al., 2019 ApJ, 881, 1, 32.
- Burkhardt et al. (2021) Burkhardt A. M. et al., 2021 ApJ, 913, 2, L18.
- Calcutt et al. (2018) Calcutt H. et al., 2018 A&A, 616, A90.
- Calmonte et al. (2016) Calmonte U. et al., 2016 MNRAS, 462, S253.
- Capaccioni et al. (2015) Capaccioni F. et al., 2015 Science, 347, 6220, 628.
- Casavecchia et al. (2009) Casavecchia P. et al., 2009 PCCP, 11, 1, 46.
- Casavecchia et al. (2015) Casavecchia P. et al., 2015 Int.Rev.Phys.Chem., 34, 2, 161.
- Caselli et al. (1997) Caselli P. et al., 1997 A&A, 322, 296.
- Caselli et al. (1999) Caselli P. et al., 1999 ApJ, 523, L165.
- Caselli et al. (2002) Caselli P. et al., 2002 ApJ, 565, 1, 331.
- Caselli et al. (2003) Caselli P. et al., 2003 A&A, 403, L37.
- Caselli et al. (2008) Caselli P. et al., 2008 A&A, 492, 3, 703.
- Caselli et al. (2012) Caselli P. et al., 2012 ApJ, 759, 2, L37.
- Caselli et al. (2022) Caselli P. et al., 2022 ApJ, 929, 1, 13.
- Cazaux et al. (2003) Cazaux S. et al., 2003 ApJ, 593, L51.
- Ceccarelli (2004) Ceccarelli C., 2004 Star Formation in the ISM, vol. 323 of Astr.Soc.PacificConf. (D. Johnstone and et al.), p. 195.
- Ceccarelli and Dominik (2005) Ceccarelli C. and Dominik C., 2005 A&A, 440, 2, 583.
- Ceccarelli et al. (1999) Ceccarelli C. et al., 1999 A&A, 342, L21.
- Ceccarelli et al. (2000) Ceccarelli C. et al., 2000 A&A, 357, L9.
- Ceccarelli et al. (2002) Ceccarelli C. et al., 2002 A&A, 395, L29.
- Ceccarelli et al. (2007) Ceccarelli C. et al., 2007 Protostars and Planets V, pp. 47–62.
- Ceccarelli et al. (2014a) Ceccarelli C. et al., 2014a Protostars and Planets VI, pp. 859–882.
- Ceccarelli et al. (2014b) Ceccarelli C. et al., 2014b ApJ, 790, 1, L1.
- Ceccarelli et al. (2017) Ceccarelli C. et al., 2017 ApJ, 850, 176.
- Cernicharo and Crovisier (2005) Cernicharo J. and Crovisier J., 2005 Space Sci. Rev., 119, 1-4, 29.
- Cernicharo et al. (2012) Cernicharo J. et al., 2012 ApJ, 759, L43.
- Cernicharo et al. (2018) Cernicharo J. et al., 2018 ApJ, 853, 2, L22.
- Cernicharo et al. (2020) Cernicharo J. et al., 2020 A&A, 642, L8.
- Cernicharo et al. (2021a) Cernicharo J. et al., 2021a A&A, 647, L3.
- Cernicharo et al. (2021b) Cernicharo J. et al., 2021b A&A, 652, L9.
- Cernicharo et al. (2021c) Cernicharo J. et al., 2021c A&A, 649, L15.
- Chaabouni et al. (2018) Chaabouni H. et al., 2018 A&A, 612, A47.
- Chacón-Tanarro et al. (2019) Chacón-Tanarro A. et al., 2019 A&A, 622, A141.
- Chahine et al. (2022) Chahine L. et al., 2022 A&A, 657, A78.
- Chang and Herbst (2014) Chang Q. and Herbst E., 2014 ApJ, 787, 135.
- Charnley (2004) Charnley S. B., 2004 Adv.Sp.Res., 33, 1, 23.
- Charnley et al. (1992) Charnley S. B. et al., 1992 ApJ, 399, L71.
- Chuang et al. (2018) Chuang K. J. et al., 2018 ApJ, 853, 2, 102.
- Cieza et al. (2016) Cieza L. A. et al., 2016 Nature, 535, 7611, 258.
- Codella et al. (2009) Codella C. et al., 2009 A&A, 507, L25.
- Codella et al. (2012) Codella C. et al., 2012 ApJ, 757, L9.
- Codella et al. (2015) Codella C. et al., 2015 MNRAS, 449, L11.
- Codella et al. (2017) Codella C. et al., 2017 A&A, 605, L3.
- Codella et al. (2018) Codella C. et al., 2018 A&A, 617, A10.
- Codella et al. (2019) Codella C. et al., 2019 ACS ESC, 3, 10, 2110.
- Codella et al. (2020) Codella C. et al., 2020 A&A, 635, A17.
- Codella et al. (2021) Codella C. et al., 2021 Fr.Astr.Sp.Sci., 8, 227.
- Collings et al. (2004) Collings M. P. et al., 2004 MNRAS, 354, 4, 1133.
- Connelley and Reipurth (2018) Connelley M. S. and Reipurth B., 2018 ApJ, 861, 2, 145.
- Corazzi et al. (2021) Corazzi M. A. et al., 2021 ApJ, 913, 2, 128.
- Cordiner et al. (2014) Cordiner M. A. et al., 2014 ApJ, 792, 1, L2.
- Costes and Naulin (2010) Costes M. and Naulin C., 2010 PCCP, 12, 32, 9154.
- Coutens et al. (2016) Coutens A. et al., 2016 A&A, 590, L6.
- Crapsi et al. (2005) Crapsi A. et al., 2005 ApJ, 619, 1, 379.
- Crapsi et al. (2007) Crapsi A. et al., 2007 A&A, 470, 1, 221.
- Crovisier et al. (2004) Crovisier J. et al., 2004 A&A, 418, 1141.
- Dalgarno and Black (1976) Dalgarno A. and Black J. H., 1976 Rep.Prog.Phys., 39, 6, 573.
- Dartois et al. (2015) Dartois E. et al., 2015 A&A, 576, A125.
- Dartois et al. (2019) Dartois E. et al., 2019 A&A, 627, A55.
- Das et al. (2018) Das A. et al., 2018 ApJS, 237, 1, 9.
- de Marcellus et al. (2015) de Marcellus P. et al., 2015 PNAS, 112, 4, 965.
- De Simone et al. (2020a) De Simone M. et al., 2020a ApJ, 896, 1, L3.
- De Simone et al. (2020b) De Simone M. et al., 2020b A&A, 640, A75.
- De Simone et al. (2022) De Simone M. et al., 2022 MNRAS, 512, 4, 5214.
- Dello Russo et al. (2016) Dello Russo N. et al., 2016 Icarus, 278, 301.
- Dhabal et al. (2018) Dhabal A. et al., 2018 ApJ, 853, 2, 169.
- Di Giacomo (2015) Di Giacomo F., 2015 J.Chem.Edu., 92, 3, 476.
- Draine (1995) Draine B. T., 1995 Ap&SS, 233, 1-2, 111.
- Drozdovskaya et al. (2019) Drozdovskaya M. N. et al., 2019 MNRAS, 490, 1, 50.
- Drozdovskaya et al. (2021) Drozdovskaya M. N. et al., 2021 MNRAS, 500, 4, 4901.
- Dulieu et al. (2010) Dulieu F. et al., 2010 A&A, 512, A30.
- Dullemond et al. (2007) Dullemond C. P. et al., 2007 Protostars and Planets V, p. 555.
- Dutrey et al. (2014) Dutrey A. et al., 2014 Protostars and Planets VI (H. Beuther and et al.), p. 317.
- Ehrenfreund and Charnley (2000) Ehrenfreund P. and Charnley S. B., 2000 ARA&A, 38, 427.
- Enrique-Romero et al. (2016) Enrique-Romero J. et al., 2016 MNRAS, 459, L6.
- Enrique-Romero et al. (2021) Enrique-Romero J. et al., 2021 A&A, 655, A9.
- Enrique-Romero et al. (2022) Enrique-Romero J. et al., 2022 ApJS, 259, 2, 39.
- Favre et al. (2017) Favre C. et al., 2017 A&A, 608, A82.
- Favre et al. (2018) Favre C. et al., 2018 ApJ, 862, L2.
- Fayolle et al. (2011) Fayolle E. et al., 2011 ApJ, 739, L36.
- Fayolle et al. (2016) Fayolle E. C. et al., 2016 ApJ, 816, 2, L28.
- Fedele and Favre (2020) Fedele D. and Favre C., 2020 A&A, 638, A110.
- Fedele et al. (2016) Fedele D. et al., 2016 A&A, 591, A95.
- Fedoseev et al. (2015) Fedoseev G. et al., 2015 MNRAS, 448, 2, 1288.
- Fedoseev et al. (2022) Fedoseev G. et al., 2022 ApJ, 924, 2, 110.
- Ferrero et al. (2020) Ferrero S. et al., 2020 ApJ, 904, 1, 11.
- Ferrero et al. (2022) Ferrero S. et al., 2022 MNRAS, 516, 2, 2586.
- Fiorellino et al. (2021) Fiorellino E. et al., 2021 MNRAS, 500, 4, 4257.
- Fischer et al. (2019) Fischer W. J. et al., 2019 ApJ, 872, 2, 183.
- Flower and Pineau des Forets (1995) Flower D. R. and Pineau des Forets G., 1995 MNRAS, 275, 4, 1049.
- Fontani et al. (2014) Fontani F. et al., 2014 ApJ, 788, L43.
- Fray et al. (2016) Fray N. et al., 2016 Nature, 538, 7623, 72.
- Fuente et al. (2016) Fuente A. et al., 2016 A&A, 593, A94.
- Garrod (2013) Garrod R. T., 2013 ApJ, 765, 1, 60.
- Garrod and Herbst (2006) Garrod R. T. and Herbst E., 2006 A&A, 457, 927.
- Garrod et al. (2007) Garrod R. T. et al., 2007 A&A, 467, 1103.
- Garrod et al. (2008) Garrod R. T. et al., 2008 ApJ, 682, 283.
- Garrod et al. (2022) Garrod R. T. et al., 2022 ApJS, 259, 1, 1.
- Garufi et al. (2021) Garufi A. et al., 2021 A&A, 645, A145.
- Geppert et al. (2006) Geppert W. D. et al., 2006 Faraday Discussions, 133, 177.
- Germain et al. (2022) Germain A. et al., 2022 ACS ESC, 6, 5, 1286.
- Ghesquière et al. (2015) Ghesquière P. et al., 2015 PCCP, 17, 17, 11455.
- Glavin et al. (2008) Glavin D. P. et al., 2008 Met.Plan.Sci., 43, 1, 399.
- Goesmann et al. (2015) Goesmann F. et al., 2015 Science, 349, 6247, 2.689.
- Goto et al. (2021) Goto M. et al., 2021 A&A, 651, A53.
- Graninger et al. (2016) Graninger D. M. et al., 2016 ApJ, 819, 140.
- Grassi et al. (2020) Grassi T. et al., 2020 A&A, 643, A155.
- Gueth et al. (1996) Gueth F. et al., 1996 A&A, 307, 891.
- Gueth et al. (1998) Gueth F. et al., 1998 A&A, 333, 287.
- Guillet et al. (2011) Guillet V. et al., 2011 A&A, 527, A123.
- Gupta et al. (2009) Gupta H. et al., 2009 ApJ, 691, 2, 1494.
- Gutiérrez-Quintanilla et al. (2021) Gutiérrez-Quintanilla A. et al., 2021 MNRAS, 506, 3, 3734.
- Hadraoui et al. (2019) Hadraoui K. et al., 2019 A&A, 630, A32.
- Hama et al. (2012) Hama T. et al., 2012 ApJ, 757, 2, 185.
- Hänni et al. (2022) Hänni N. et al., 2022 Nature Com., 13, 3639.
- Harju et al. (2017) Harju J. et al., 2017 A&A, 600, A61.
- Harju et al. (2020) Harju J. et al., 2020 ApJ, 895, 2, 101.
- Hasegawa and Herbst (1993) Hasegawa T. I. and Herbst E., 1993 MNRAS, 263, 589.
- Hasegawa et al. (1992) Hasegawa T. I. et al., 1992 ApJS, 82, 167.
- He et al. (2015) He J. et al., 2015 ApJ, 801, 2, 120.
- He et al. (2016) He J. et al., 2016 ApJ, 825, 2, 89.
- He et al. (2018) He J. et al., 2018 ApJ, 863, 2, 156.
- Heard (2018) Heard D. E., 2018 Acc.Chem.Reas., 51, 11, 2620.
- Herbst (1985) Herbst E., 1985 ApJ, 291, 226.
- Herbst (2021) Herbst E., 2021 Fr.Astr.Sp.Sci., 8, 207.
- Herbst and Klemperer (1973) Herbst E. and Klemperer W., 1973 ApJ, 185, 505.
- Herbst and van Dishoeck (2009) Herbst E. and van Dishoeck E. F., 2009 ARA&A, 47, 427.
- Hidaka et al. (2008) Hidaka H. et al., 2008 Chem.Phys.Let., 456, 1-3, 36.
- Higuchi et al. (2018) Higuchi A. E. et al., 2018 ApJS, 236, 52.
- Holdship et al. (2019a) Holdship J. et al., 2019a ApJ, 878, 1, 65.
- Holdship et al. (2019b) Holdship J. et al., 2019b ApJ, 880, 2, 138.
- Hollenbach and Salpeter (1970) Hollenbach D. and Salpeter E. E., 1970 J. Chem. Phys., 53, 1, 79.
- Hollenbach et al. (2009) Hollenbach D. et al., 2009 ApJ, 690, 2, 1497.
- Horn et al. (2004) Horn A. et al., 2004 ApJ, 611, 1, 605.
- Ilee et al. (2021) Ilee J. D. et al., 2021 ApJS, 257, 1, 9.
- Imai et al. (2016) Imai M. et al., 2016 ApJ, 830, L37.
- Ioppolo et al. (2021) Ioppolo S. et al., 2021 Nat. Astron., 5, 197.
- Jaber et al. (2014) Jaber A. A. et al., 2014 ApJ, 791, 29.
- Jacobsen et al. (2019) Jacobsen S. K. et al., 2019 A&A, 629, A29.
- Jessop and Ward-Thompson (2001) Jessop N. E. and Ward-Thompson D., 2001 MNRAS, 323, 4, 1025.
- Jiménez-Serra et al. (2008) Jiménez-Serra I. et al., 2008 A&A, 482, 2, 549.
- Jiménez-Serra et al. (2016) Jiménez-Serra I. et al., 2016 ApJ, 830, L6.
- Jiménez-Serra et al. (2021) Jiménez-Serra I. et al., 2021 ApJ, 917, 1, 44.
- Jin and Garrod (2020) Jin M. and Garrod R. T., 2020 ApJS, 249, 26.
- Jørgensen et al. (2004) Jørgensen J. K. et al., 2004 A&A, 415, 1021.
- Jørgensen et al. (2005a) Jørgensen J. K. et al., 2005a A&A, 437, 2, 501.
- Jørgensen et al. (2005b) Jørgensen J. K. et al., 2005b ApJ, 632, 2, 973.
- Jørgensen et al. (2016) Jørgensen J. K. et al., 2016 A&A, 595, A117.
- Jørgensen et al. (2018) Jørgensen J. K. et al., 2018 A&A, 620, A170.
- Kaiser et al. (2015) Kaiser R. I. et al., 2015 Angewandte Chemie, 127, 1, 197.
- Kalvāns (2018) Kalvāns J., 2018 MNRAS, 478, 2, 2753.
- Kalvāns (2021) Kalvāns J., 2021 ApJ, 910, 1, 54.
- Karssemeijer and Cuppen (2014) Karssemeijer L. J. and Cuppen H. M., 2014 A&A, 569, A107.
- Keto and Caselli (2008) Keto E. and Caselli P., 2008 ApJ, 683, 1, 238.
- Keto and Caselli (2010) Keto E. and Caselli P., 2010 MNRAS, 402, 3, 1625.
- Keto et al. (2015) Keto E. et al., 2015 MNRAS, 446, 4, 3731.
- Kolasinski (2002) Kolasinski K., 2002 Surf.Sci., John Wiley & Sons, LTD.
- Könyves et al. (2015) Könyves V. et al., 2015 A&A, 584, A91.
- Kuan et al. (2004) Kuan Y.-J. et al., 2004 ApJ, 616, 1, L27.
- Lada et al. (2003) Lada C. J. et al., 2003 ApJ, 586, 1, 286.
- Ladjelate et al. (2020) Ladjelate B. et al., 2020 A&A, 638, A74.
- Le Gal et al. (2019) Le Gal R. et al., 2019 ApJ, 886, 2, 86.
- Le Roy et al. (2015) Le Roy L. et al., 2015 A&A, 583, A1.
- Lee et al. (2017a) Lee C.-F. et al., 2017a Nat.Astr., 1, 0152.
- Lee et al. (2017b) Lee C.-F. et al., 2017b Sci.Adv., 3, 1602935.
- Lee et al. (2019a) Lee C.-F. et al., 2019a ApJ, 876, 1, 63.
- Lee et al. (2022) Lee C.-F. et al., 2022 ApJ, 937, 1, 10.
- Lee and Myers (2011) Lee C. W. and Myers P. C., 2011 ApJ, 734, 1, 60.
- Lee et al. (1999) Lee C. W. et al., 1999 ApJ, 526, 2, 788.
- Lee et al. (2019b) Lee J.-E. et al., 2019b Nat.Astr., 3, 314.
- Lefloch et al. (2012) Lefloch B. et al., 2012 ApJ, 757, 2, L25.
- Lefloch et al. (2017) Lefloch B. et al., 2017 MNRAS, 469, L73.
- Lefloch et al. (2018) Lefloch B. et al., 2018 MNRAS, 477, 4792.
- Leger et al. (1985) Leger A. et al., 1985 A&A, 144, 1, 147.
- Lesaffre et al. (2013) Lesaffre P. et al., 2013 A&A, 550, A106.
- Ligterink et al. (2017) Ligterink N. F. W. et al., 2017 MNRAS, 469, 2, 2219.
- Ligterink et al. (2021) Ligterink N. F. W. et al., 2021 A&A, 647, A87.
- Lindberg et al. (2016) Lindberg J. E. et al., 2016 ApJ, 833, 1, L14.
- Linnartz et al. (2015) Linnartz H. et al., 2015 Inter.Rev.Phys.Chem., 34, 205.
- Linsky (2007) Linsky J. L., 2007 Space Sci. Rev., 130, 367.
- Lis et al. (1997) Lis D. C. et al., 1997 Icarus, 130, 2, 355.
- Lis et al. (2008) Lis D. C. et al., 2008 ApJ, 675, 1, 931.
- Loomis et al. (2015) Loomis R. A. et al., 2015 ApJ, 809, 2, L25.
- Loomis et al. (2018) Loomis R. A. et al., 2018 ApJ, 859, 2, 131.
- Loomis et al. (2021) Loomis R. A. et al., 2021 Nat.Astr., 5, 188.
- López-Sepulcre et al. (2017) López-Sepulcre A. et al., 2017 A&A, 606, A121.
- Lykke et al. (2017) Lykke J. M. et al., 2017 A&A, 597, A53.
- Manigand et al. (2019) Manigand S. et al., 2019 A&A, 623, A69.
- Manigand et al. (2020) Manigand S. et al., 2020 A&A, 635, A48.
- Manigand et al. (2021) Manigand S. et al., 2021 A&A, 645, A53.
- Marcelino et al. (2018) Marcelino N. et al., 2018 A&A, 620, A80.
- Marcelino et al. (2020) Marcelino N. et al., 2020 A&A, 643, L6.
- Maret et al. (2005) Maret S. et al., 2005 A&A, 442, 527.
- Martín-Doménech et al. (2016) Martín-Doménech R. et al., 2016 A&A, 589, A107.
- Martín-Doménech et al. (2020) Martín-Doménech R. et al., 2020 ApJ, 894, 2, 98.
- Martín-Doménech et al. (2021) Martín-Doménech R. et al., 2021 ApJ, 923, 2, 155.
- May et al. (2000) May P. W. et al., 2000 MNRAS, 318, 3, 809.
- McCarthy et al. (2021) McCarthy M. C. et al., 2021 Nat.Astr., 5, 176.
- McElroy et al. (2013) McElroy D. et al., 2013 A&A, 550, A36.
- McGuire (2018) McGuire B. A., 2018 ApJS, 239, 17.
- McGuire et al. (2020) McGuire B. A. et al., 2020 ApJ, 900, 1, L10.
- McKee and Ostriker (2007) McKee C. F. and Ostriker E. C., 2007 ARA&A, 45, 1, 565.
- Mendoza et al. (2018) Mendoza E. et al., 2018 MNRAS, 475, 4, 5501.
- Millar et al. (1989) Millar T. J. et al., 1989 ApJ, 340, 906.
- Millar et al. (1991) Millar T. J. et al., 1991 ApJ, 369, 147.
- Minissale et al. (2016) Minissale M. et al., 2016 A&A, 585, A24.
- Minissale et al. (2016) Minissale M. et al., 2016 MNRAS, 458, 3, 2953.
- Minissale et al. (2022) Minissale M. et al., 2022 ACS ESC, 6, 3, 597.
- Mokrane et al. (2009) Mokrane H. et al., 2009 ApJ, 705, 2, L195.
- Molpeceres et al. (2019) Molpeceres G. et al., 2019 MNRAS, 482, 4, 5389.
- Molpeceres et al. (2021) Molpeceres G. et al., 2021 J.Phys.Chem.Lett., 12, 10854.
- Molpeceres et al. (2022) Molpeceres G. et al., 2022 A&A, 663, A41.
- Muñoz Caro et al. (2002) Muñoz Caro G. M. et al., 2002 Nature, 416, 6879, 403.
- Nazari et al. (2021) Nazari P. et al., 2021 A&A, 650, A150.
- Nguyen et al. (2018) Nguyen T. et al., 2018 A&A, 619, A111.
- Nguyen et al. (2019) Nguyen T. L. et al., 2019 J. Chem. Phys., 150, 8, 084105.
- Oba et al. (2009) Oba Y. et al., 2009 ApJ, 701, 1, 464.
- Oba et al. (2019) Oba Y. et al., 2019 Nat.Com., 10, 4413.
- Öberg (2016) Öberg K. I., 2016 Chem. Rev., 116, 9631.
- Öberg et al. (2009) Öberg K. I. et al., 2009 A&A, 504, 891.
- Öberg et al. (2010) Öberg K. I. et al., 2010 ApJ, 716, 825.
- Öberg et al. (2014) Öberg K. I. et al., 2014 ApJ, 788, 68.
- Öberg et al. (2015) Öberg K. I. et al., 2015 Nature, 520, 198.
- Öberg et al. (2017) Öberg K. I. et al., 2017 ApJ, 839, 1, 43.
- Öberg et al. (2021) Öberg K. I. et al., 2021 ApJS, 257, 1, 1.
- Ocaña et al. (2018) Ocaña A. J. et al., 2018 PCCP, 20, 5865.
- Ocaña et al. (2019) Ocaña A. J. et al., 2019 PCCP, 21, 13, 6942.
- Oya et al. (2017) Oya Y. et al., 2017 ApJ, 837, 174.
- Pagani et al. (2007) Pagani L. et al., 2007 A&A, 467, 1, 179.
- Palumbo et al. (1999) Palumbo M. E. et al., 1999 A&A, 342, 551.
- Pantaleone et al. (2020) Pantaleone S. et al., 2020 ApJ, 897, 1, 56.
- Pantaleone et al. (2021) Pantaleone S. et al., 2021 ApJ, 917, 1, 49.
- Paquette et al. (2021) Paquette J. A. et al., 2021 MNRAS, 504, 4, 4940.
- Parise et al. (2011) Parise B. et al., 2011 A&A, 526, A31.
- Paulive et al. (2021) Paulive A. et al., 2021 MNRAS, 500, 3414.
- Pegues et al. (2020) Pegues J. et al., 2020 ApJ, 890, 2, 142.
- Perrero et al. (2022) Perrero J. et al., 2022 ACS ESC, 6, 496.
- Persson et al. (2018) Persson M. V. et al., 2018 A&A, 610, A54.
- Pineda et al. (2022) Pineda J. E. et al., 2022 AJ, 163, 6, 294.
- Poch et al. (2020) Poch O. et al., 2020 Science, 367, 6483, 7462.
- Podio et al. (2016) Podio L. et al., 2016 A&A, 593, L4.
- Podio et al. (2019) Podio L. et al., 2019 A&A, 623, L6.
- Podio et al. (2020a) Podio L. et al., 2020a A&A, 642, L7.
- Podio et al. (2020b) Podio L. et al., 2020b A&A, 644, A119.
- Punanova et al. (2018) Punanova A. et al., 2018 ApJ, 855, 112.
- Punanova et al. (2022) Punanova A. et al., 2022 ApJ, 927, 2, 213.
- Qasim et al. (2019) Qasim D. et al., 2019 A&A, 627, A1.
- Quirico et al. (2016) Quirico E. et al., 2016 Icarus, 272, 32.
- Rawlings et al. (2013) Rawlings J. M. C. et al., 2013 MNRAS, 430, 1, 264.
- Reboussin et al. (2014) Reboussin L. et al., 2014 MNRAS, 440, 4, 3557.
- Redaelli et al. (2019) Redaelli E. et al., 2019 A&A, 629, A15.
- Richard et al. (2013) Richard C. et al., 2013 A&A, 552, A117.
- Richard et al. (2021) Richard C. et al., 2021 A&A, 651, A120.
- Rimola et al. (2014) Rimola A. et al., 2014 A&A, 572, A70.
- Rimola et al. (2018) Rimola A. et al., 2018 ACS ESC, 2, 7, 720.
- Roberts and Millar (2007) Roberts H. and Millar T. J., 2007 A&A, 471, 849.
- Roncero et al. (2018) Roncero O. et al., 2018 PCCP, 20, 40, 25951.
- Ruaud et al. (2015) Ruaud M. et al., 2015 MNRAS, 447, 4, 4004.
- Rubin et al. (2015) Rubin M. et al., 2015 Science, 348, 6231, 232.
- Rubin et al. (2019) Rubin M. et al., 2019 MNRAS, 489, 1, 594.
- Rubin et al. (2020) Rubin M. et al., 2020 Space Sci. Rev., 216, 5, 102.
- Rubin et al. (1971) Rubin R. H. et al., 1971 ApJ, 169, L39.
- Ruffle et al. (1999) Ruffle D. P. et al., 1999 MNRAS, 306, 3, 691.
- Sakai and Yamamoto (2013) Sakai N. and Yamamoto S., 2013 Chem.Rev., 113, 8981.
- Sakai et al. (2006) Sakai N. et al., 2006 PASJ, 58, L15.
- Sakai et al. (2008) Sakai N. et al., 2008 ApJ, 672, 371-381.
- Sakai et al. (2009) Sakai N. et al., 2009 ApJ, 697, 769.
- Sakai et al. (2016) Sakai N. et al., 2016 ApJ, 820, L34.
- Schuhmann et al. (2019a) Schuhmann M. et al., 2019a A&A, 630, A31.
- Schuhmann et al. (2019b) Schuhmann M. et al., 2019b ACS ESC, 3, 9, 1854.
- Schutte et al. (1992) Schutte W. A. et al., 1992 Adv.Sp.Res., 12, 4, 47.
- Scibelli and Shirley (2020) Scibelli S. and Shirley Y., 2020 ApJ, 891, 1, 73.
- Scibelli et al. (2021) Scibelli S. et al., 2021 MNRAS, 504, 4, 5754.
- Segura-Cox et al. (2020) Segura-Cox D. M. et al., 2020 Nature, 586, 7828, 228.
- Senevirathne et al. (2017) Senevirathne B. et al., 2017 Mol.Astr., 6, 59.
- Shannon et al. (2013) Shannon R. J. et al., 2013 Nat.Chem., 5, 9, 745.
- Sheehan and Eisner (2017) Sheehan P. D. and Eisner J. A., 2017 ApJ, 851, 45.
- Sheehan and Eisner (2018) Sheehan P. D. and Eisner J. A., 2018 ApJ, 857, 1, 18.
- Shingledecker et al. (2018) Shingledecker C. N. et al., 2018 ApJ, 861, 20.
- Shingledecker et al. (2021) Shingledecker C. N. et al., 2021 A&A, 652, L12.
- Sipilä et al. (2021) Sipilä O. et al., 2021 ApJ, 922, 2, 126.
- Skouteris et al. (2017) Skouteris D. et al., 2017 MNRAS, 468, L1.
- Skouteris et al. (2018) Skouteris D. et al., 2018 ApJ, 854, 2, 135.
- Sleiman et al. (2018) Sleiman C. et al., 2018 PCCP, 20, 5478.
- Smith and Rowe (2000) Smith I. and Rowe B., 2000 Acc.Chem.Reas., 33, 5, 261.
- Song and Kästner (2017) Song L. and Kästner J., 2017 ApJ, 850, 2, 118.
- Spezzano et al. (2016) Spezzano S. et al., 2016 A&A, 592, L11.
- Spezzano et al. (2017) Spezzano S. et al., 2017 A&A, 606, A82.
- Strazzulla (1997) Strazzulla G., 1997 Adv.Sp.Res., 19, 7, 1077.
- Strom and Strom (1993) Strom K. M. and Strom S. E., 1993 ApJ, 412, L63.
- Sugimura et al. (2011) Sugimura M. et al., 2011 PASJ, 63, 459.
- Suutarinen et al. (2014) Suutarinen A. N. et al., 2014 MNRAS, 440, 2, 1844.
- Tafalla et al. (2004) Tafalla M. et al., 2004 A&A, 416, 191.
- Tait et al. (2005) Tait S. L. et al., 2005 J.Chem.Phys., 122, 164708.
- Taquet et al. (2015) Taquet V. et al., 2015 ApJ, 804, 81.
- Taylor et al. (2017) Taylor M. G. G. T. et al., 2017 Phyl.Trans.Roy.Soc. London S.A, 375, 20160262.
- Tennis et al. (2021) Tennis J. et al., 2021 ApJ, 922, 2, 133.
- Theulé (2020) Theulé P., 2020 Laboratory Astrophysics, vol. 350 (F. Salama and H. Linnartz), p. 139.
- Theulé et al. (2013) Theulé P. et al., 2013 Adv.Sp.Res., 52, 8, 1567.
- Tielens and Hagen (1982) Tielens A. G. G. M. and Hagen W., 1982 A&A, 114, 2, 245.
- Tinacci et al. (2021) Tinacci L. et al., 2021 ApJS, 256, 2, 35.
- Tinacci et al. (2022a) Tinacci L. et al., 2022a submitted.
- Tinacci et al. (2022b) Tinacci L. et al., 2022b ACS ESC, 6, 6, 1514.
- van de Hulst (1946) van de Hulst H. C., 1946 Rech.Astr.obser.Utrecht, 11, 2.
- van der Marel et al. (2021) van der Marel N. et al., 2021 A&A, 651, L5.
- van Dishoeck et al. (2021) van Dishoeck E. F. et al., 2021 A&A, 648, A24.
- van Gelder et al. (2020) van Gelder M. L. et al., 2020 A&A, 639, A87.
- van ’t Hoff et al. (2018) van ’t Hoff M. L. R. et al., 2018 ApJ, 864, 1, L23.
- Vastel et al. (2004) Vastel C. et al., 2004 ApJ, 606, 2, L127.
- Vastel et al. (2006) Vastel C. et al., 2006 ApJ, 645, 2, 1198.
- Vastel et al. (2014) Vastel C. et al., 2014 ApJ, 795, L2.
- Vastel et al. (2015) Vastel C. et al., 2015 A&A, 582, L3.
- Vastel et al. (2018) Vastel C. et al., 2018 MNRAS, 478, 4, 5514.
- Vastel et al. (2019) Vastel C. et al., 2019 A&A, 625, A91.
- Vasyunin and Herbst (2013) Vasyunin A. I. and Herbst E., 2013 ApJ, 769, 34.
- Vasyunin et al. (2017) Vasyunin A. I. et al., 2017 ApJ, 842, 1, 33.
- Vazart et al. (2020) Vazart F. et al., 2020 MNRAS, 499, 4, 5547.
- Vazart et al. (2022) Vazart F. et al., 2022 ApJ, in press.
- Vidali (2013) Vidali G., 2013 Chem.Rev., 113, 12, 8752.
- Viti and Williams (1999) Viti S. and Williams D. A., 1999 MNRAS, 305, 4, 755.
- Wakelam et al. (2015) Wakelam V. et al., 2015 ApJS, 217, 2, 20.
- Wakelam et al. (2017) Wakelam V. et al., 2017 Mol.Astr., 6, 22.
- Walsh et al. (2014) Walsh C. et al., 2014 A&A, 563, A33.
- Walsh et al. (2016) Walsh C. et al., 2016 ApJ, 823, 1, L10.
- Ward-Thompson et al. (1999) Ward-Thompson D. et al., 1999 MNRAS, 305, 1, 143.
- Watanabe and Kouchi (2002) Watanabe N. and Kouchi A., 2002 ApJ, 571, 2, L173.
- Watson (1974) Watson W. D., 1974 ApJ, 188, 35.
- Whittet et al. (1988) Whittet D. C. B. et al., 1988 MNRAS, 233, 321.
- Woon and Herbst (2009) Woon D. E. and Herbst E., 2009 ApJS, 185, 2, 273.
- Wright et al. (2015) Wright I. P. et al., 2015 Science, 349, 6247, 2.673.
- Xue et al. (2020) Xue C. et al., 2020 ApJ, 900, 1, L9.
- Yamaguchi et al. (2012) Yamaguchi T. et al., 2012 PASJ, 64, 105.
- Yamamoto et al. (2019) Yamamoto T. et al., 2019 MNRAS, 490, 1, 709.
- Yang et al. (2021) Yang Y.-L. et al., 2021 ApJ, 910, 1, 20.
- Zamponi et al. (2021) Zamponi J. et al., 2021 MNRAS, 508, 2, 2583.
- Zaverkin et al. (2022) Zaverkin V. et al., 2022 MNRAS, 510, 2, 3063.
- Zeng et al. (2019) Zeng S. et al., 2019 MNRAS, 484, 1, L43.