∎
University of Calgary, Calgary, Canada
22email: ehsan.mashhadi@ucalgary.ca 33institutetext: Shaiful Chowdhury 44institutetext: Schulich School of Engineering
University of Calgary, Calgary, Canada
44email: shaiful.chowdhury@ucalgary.ca 55institutetext: Somayeh Modaberi 66institutetext: Schulich School of Engineering
University of Calgary, Calgary, Canada
66email: somayeh.modaberi@ucalgary.ca 77institutetext: Hadi Hemmati 88institutetext: Schulich School of Engineering
University of Calgary, Calgary, Canada
88email: hadi.hemmati@ucalgary.ca 99institutetext: Gias Uddin 1010institutetext: Schulich School of Engineering
University of Calgary, Calgary, Canada
1010email: gias.uddin@ucalgary.ca
An Empirical Study on Bug Severity Estimation Using Source Code Metrics and Static Analysis
Abstract
In the past couple of decades, significant research efforts are devoted to the prediction of software bugs (i.e., defects). These works leverage a diverse set of metrics, tools, and techniques to predict which classes, methods, lines, or commits are buggy. However, most existing work in this domain treats all bugs the same, which is not the case in practice. The more severe the bugs the higher their consequences. Therefore, it is important for a defect prediction method to estimate the severity of the identified bugs, so that the higher severity ones get immediate attention. In this paper, we provide a quantitative and qualitative study on two popular datasets (Defects4J and Bugs.jar), using 10 common source code metrics, and also two popular static analysis tools (SpotBugs and Infer) for analyzing their capability in predicting defects and their severity. We studied 3,358 buggy methods with different severity labels from 19 Java open-source projects. Results show that although code metrics are powerful in predicting the buggy code (Lines of the Code, Maintainable Index, FanOut, and Effort metrics are the best), they cannot estimate the severity level of the bugs. In addition, we observed that static analysis tools have weak performance in both predicting bugs (F1 score range of 3.1%-7.1%) and their severity label (F1 score under 2%). We also manually studied the characteristics of the severe bugs to identify possible reasons behind the weak performance of code metrics and static analysis tools in estimating the severity. Also, our categorization shows that Security bugs have high severity in most cases while Edge/Boundary faults have low severity. Finally, we show that code metrics and static analysis methods can be complementary in terms of estimating bug severity.
Keywords:
Bug Severity Defect Prediction Code Complexity Metrics Static Analysis Tools Defects4J Bugs.jar1 Introduction
Software maintenance is one of the most challenging and expensive parts in the software development life cycle kafura1987use . Handling bugs (including detecting, localizing, fixing, etc.) is the most typical challenge associated with the software maintenance step borstler2016role ; bennett2000software . Consequently, both practitioners and researchers are trying to make this tedious task as automated as possible from different aspects such as defect prediction, test generation, fault-localization, and program repair kondo2020impact ; shin2010evaluating ; tosun2010practical ; zhou2010ability ; mashhadi2021applying .
While there has been much research in handling bugs using different techniques like search-based le2011genprog , pattern-based long2016automatic and ML-based techniques mashhadi2021applying , there is little research that focuses explicitly on the severe bugs. In other words, most of the research implicitly assumes that all bugs have the same importance shamshiri2015automatically ; mashhadi2021applying ; wong2016survey ; pearson2017evaluating . However, the bug severity indicates the intensity of the impact the bug has on system operation neysiani2020efficient . Critical bugs may cause a system to crash completely or cause non-recoverable conditions such as data loss. High-severity bugs affect major system components that prevent users from working with some parts of the system. Fixing severe bugs are typically more challenging compared to the medium or low severity bugs, where few components are affected and there is an easy workaround vucevic2012testing . Therefore, in practice, bugs with higher severity tend to be fixed sooner than other less severe bugs uddin2017survey ; kanwal2012bug ; saha2014empirical .
In general, software practitioners have several means to detect bugs. These can range from QA practices such as code review kononenko2016code ; mantyla2008types ; bacchelli2013expectations , and inspection to different testing approaches, and even development methodologies such as pair programming williams2000strengthening ; nawrocki2001experimental ; sun2015effectiveness , and Test Driven Development (TDD) bhat2006evaluating ; martin2007professionalism ; aniche2013asserts ; rafique2012effects . When a bug is detected, it is common for the development teams to consider the most severe/important bugs first which helps them to prevent extreme consequences. Some issue tracking systems, such as Jira111https://www.atlassian.com/software/jira, have a specific field named Severity/Priority which is assigned during the bug reporting, and helps the development teams to consider bug importance during debugging.
It is important to note that bug severity does not have a standard formal definition. The definition depends on the context of the software, the nature of the bug, the current state of the project, the ratio of affected users, potential harm to users, and many other factors. The current state of the practice to identify and record the severity of bugs is through a manual process in issue tracking systems, where the severity of a bug has its own field (with options such as Blocker, Critical, Major, Minor, and Trivial or sometimes with numbers ranging from zero to 20). The field is manually populated by the person who documents the bug, however, it may change by the technical team during the bug reporting review process. Thus, the whole process is not only quite subjective but is also an error-prone task.
Therefore, it seems that an approach that can estimate the severity of a given bug, automatically and systematically (not biased to the opinion of the bug reporter), can be quite helpful not only for the developers and QA teams but also as an input for other automated software tools, such as program repair, to prioritize their process, accordingly. However, the current literature in this domain is limited to predicting the severity based on the bug report description using NLP techniques chaturvedi2012determining ; tan2020bug , which still has the bias issue (subjective to reporter’s opinion) and ignores the context (underlying source code). Also, their applicability is limited to projects with rich and informative bug reports. Therefore, in this paper, we would like to empirically investigate the potential of source code for estimating the severity of a bug.
To be able to estimate bug severity, we study two well-known categories of approaches that have a track record of predicting issues in the code: (a) source code metrics and (b) static analysis.
Code metrics have shown a great deal of success in predicting code smell tufano2015and , maintenance effort polo2001using and defects giger2012method ; ferenc2020deep .
Static analysis tools such as SpotBugs spotbugs , the successor to the popular FindBugs findbugs tool, Facebook Infer infer , and Google Error Prone error_prone have also been successfully used in related research habib2018many ; tomassi2018bugs . These tools use different techniques such as AST-based patterns or data-flow analysis to find a bug’s existence and to predict the bug’s type and severity. These tools are updated regularly to cover modern bug patterns and they require the compiled code to perform the analysis which takes longer than the source code metric calculation (e.g, several hours compared to several minutes) which makes it less practical for big projects.
To the best of our knowledge, there is no study that explores code metrics and modern static analysis tools’ ability in estimating bug severity. Our approach focuses on method-level granularity in contrast to class/module-level, since researchers and developers find the class/module level granularity too coarse-grained for practical usage shihab2012industrial ; pascarella2020performance ; grund2021codeshovel ; hata2012bug .
We use two popular datasets: Defects4J just2014defects4j , and Bugs.jar saha2018bugs which contain real bugs from different open-source Java projects. We studied 19 projects containing 1,668 bugs (3,358 buggy methods) for our quantitative study. Furthermore, we studied 60 randomly sampled bugs from both datasets for our qualitative study to find the bug characteristic according to their severity labels.
To guide our study, we target answering the following research questions (RQ):
-
•
RQ1: Are source code metrics good indicators of buggyness and bug severity? The results show that most of the code metrics (e.g, Lines of Code, McCabe, McClue, Nested Block Depth, Proxy Indentation, FanOut, Readability, Difficulty, and Effort) are good indicators of buggyness, but they perform quite poorly for predicting bug severity. Line of Code has the best performance in finding buggyness, but the least performance in finding bug severity. However, the Difficulty and Effort metrics are the best indicators of bug severity.
-
•
RQ2: What is the capability of static analysis tools in finding bugs and their severity? The results show that the studied static analysis tools (SpotBugs and Infer) are not yet powerful enough to find many bug types and in many cases, they miss or mislabel the bug severity.
-
•
RQ3: What are the characteristics of bugs with different severity values? Results reveal that the severity of bugs is mostly related to the software’s specification, which is not predictable solely based on method-granularity level analysis. Also, we found no direct relationship between method complexity and its severity value. Many low severity bugs exist in the quite complex methods according to the code metrics, but these functions handle trivial functionalities, such as GUI, or they do not lead to a crash or unauthorized access.
The findings of this paper help researchers and practitioners to better understand the characteristics of severe bugs and guide future research/tools on how to advance the field to better predict bug severity.
The remainder of the paper is organized as follows: We provide our dataset, and experiments setup in Section 2. Experiment motivation, design and results are discussed in Section 3. Discussions about the results are provided in Section 4. Threats to validity of our work are described in Section 5. Related works to this paper are described in Section 6. We conclude this paper with possible future work in Section 7.
2 Study Setup
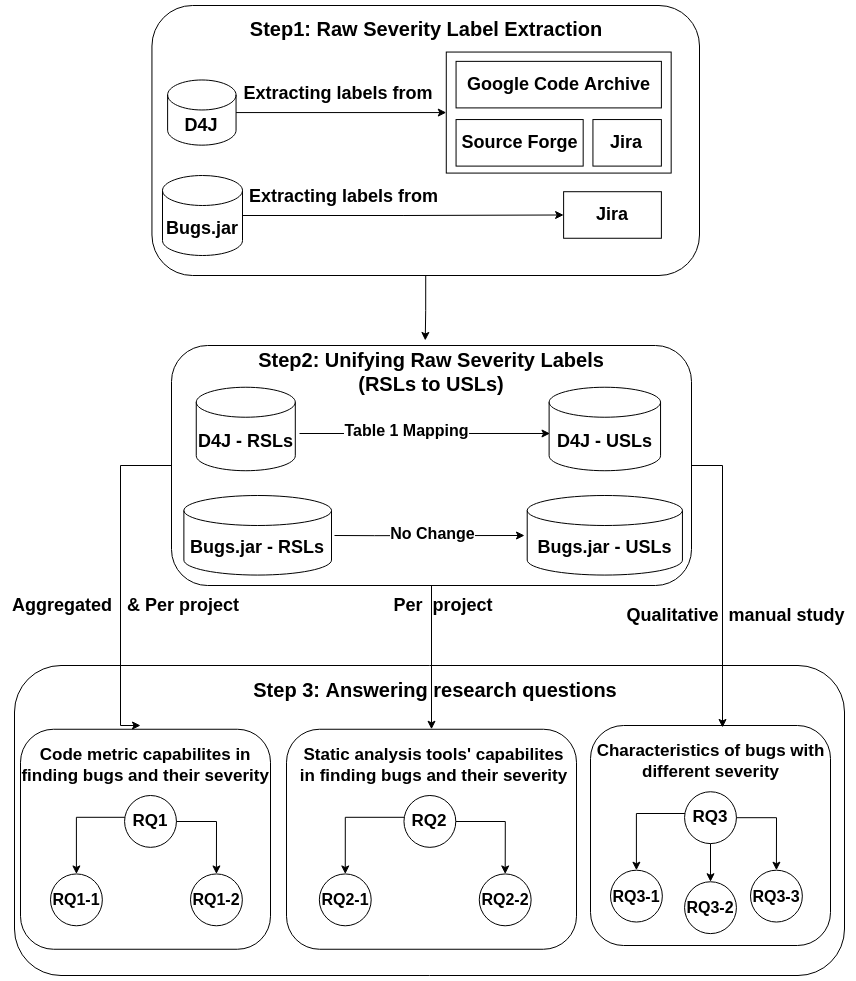
In this section, we describe our datasets, the preprocessing steps, studied code metrics, and static analysis tools. The overall approach of our data gathering, preprocessing, and their relation to each RQ is shown in Fig 1 where Step1 shows the process of extracting labels from different issue management systems for each dataset. Step2 depicts the preprocessing method and Step3 provides the details of how the data is used for each RQ.
2.1 Dataset and Preprocessing
We use Defect4J just2014defects4j and Bugs.jar saha2018bugs datasets for our study which contain bugs from different popular Java projects. Defect4J is used because it has been widely used in different automated software engineering research domains such as Test Generation shamshiri2015automatically , Program Repair martinez2017automatic , and Fault Localization pearson2017evaluating . Also, this is a generic dataset containing real bugs from different projects with different domains. Bugs.jar has also been widely used in Program Repair saha2017elixir and contains many real bugs and also there is a corresponding bug report for each sample in Jira222https://www.atlassian.com/software/jira containing the bug severity.
| Unified Severity Label (USL) | Raw Severity Label (RSL) |
|---|---|
| Critical | Critical |
| High | High, Major, 3 |
| Medium | Medium, 5 |
| Low | Low, Trivial, Minor, 7, 8, 9 |
2.1.1 Defects4J
The latest version (2.0.0) of Defects4J contains 835 bugs from 17 Java projects. The dataset does not have any information regarding the bug severity itself, so we extract bug severity values from different issue tracking systems. There are three software hosting services used for these projects: Jira, SourceForge, and Google Code Archive. After extracting the severity values from these systems, we concluded with 510 bugs out of 835 bugs containing severity labels.
After extracting the raw severity labels (RSL), we found that there are many inconsistencies between these raw severity labels of the Defects4J dataset. Some projects use numerical (smaller values indicate higher severity while larger values indicate lower severity) and others use categorical values because of different issue tracking systems. Therefore, we unified similar raw labels to produce four meaningful unified severity labels (USL): “Critical”, “High”, “Medium”, and “Low” severity labels. Table 1 shows the mapping between all RSL and the USL labels of the Defects4J dataset.
2.1.2 Bugs.jar
The Bugs.jar dataset contains 1,158 bugs from eight large, popular, and diverse open-source Java projects.
All of these projects use Jira as an issue management system, and each of the bugs has an assigned severity level. The severity labels from this dataset are “Blocker”, “Critical”, “Major”, “Minor”, and “Trivial”. Since the RSLs of this dataset are consistent, there is no need for a unifying process like what we did for the Defects4J dataset, and we considered all the RSLs as USLs
After mentioned preprocessing step we concluded with two datasets containing the USLs (RSLs are discarded and not used anymore). The Defect4J dataset contains “Critical”, “High”, “Medium”, and “Low”. Bugs.jar dataset contains “Blocker”, “Critical”, “Major”, “Minor”, and “Trivial”. This is our extracted and preprocessed dataset, but we will group some of these USLs in different RQs according to their experiment design requirements, which will be explained in their related sections accordingly.
2.1.3 Buggy vs. Not Buggy
Since we focus on the method-level granularity, we consider a method as a buggy method if it is modified/removed by a bug fixing patch. If a method, however, is introduced with a bug fix patch, we do not label this method as buggy. We discard the static initialization blocks and constructors since those are special types of methods that are used for initializing the enclosed class, mostly.
A bug fixing patch, however, can impact multiple methods, in that case, we consider all of them as buggy. This has been a common practice in earlier studies (e.g., chowdhury:2022 ; pascarella2020performance ; Mo:2022 ). We discuss the relevant threats in Section 5. Finally, from the 510 bugs of the Defects4J dataset, we found 742 buggy methods and from the 1,158 bugs of the Bugs.jar dataset, we found 2616 buggy methods.
Similar to earlier studies (e.g., chowdhury:2022 ; pascarella2020performance ; Mo:2022 ), we considered a method as non-buggy if it was not modified in the current bug fixing patch inside the buggy class. In this way, we are extracting methods that are contributing to the same functionality as the buggy methods since methods of a class have high cohesion.
We extracted 20,179 and 57,197 non-buggy methods from the Defects4J and Bugs.jar, respectively. The list of the buggy and non-buggy methods containing their project name, class name, start line, end line, and bug severity (corresponding bug severity for non-buggy methods) is available in our publicly shared GitHub repository 333https://github.com/EhsanMashhadi/EMSE-BugSeverity
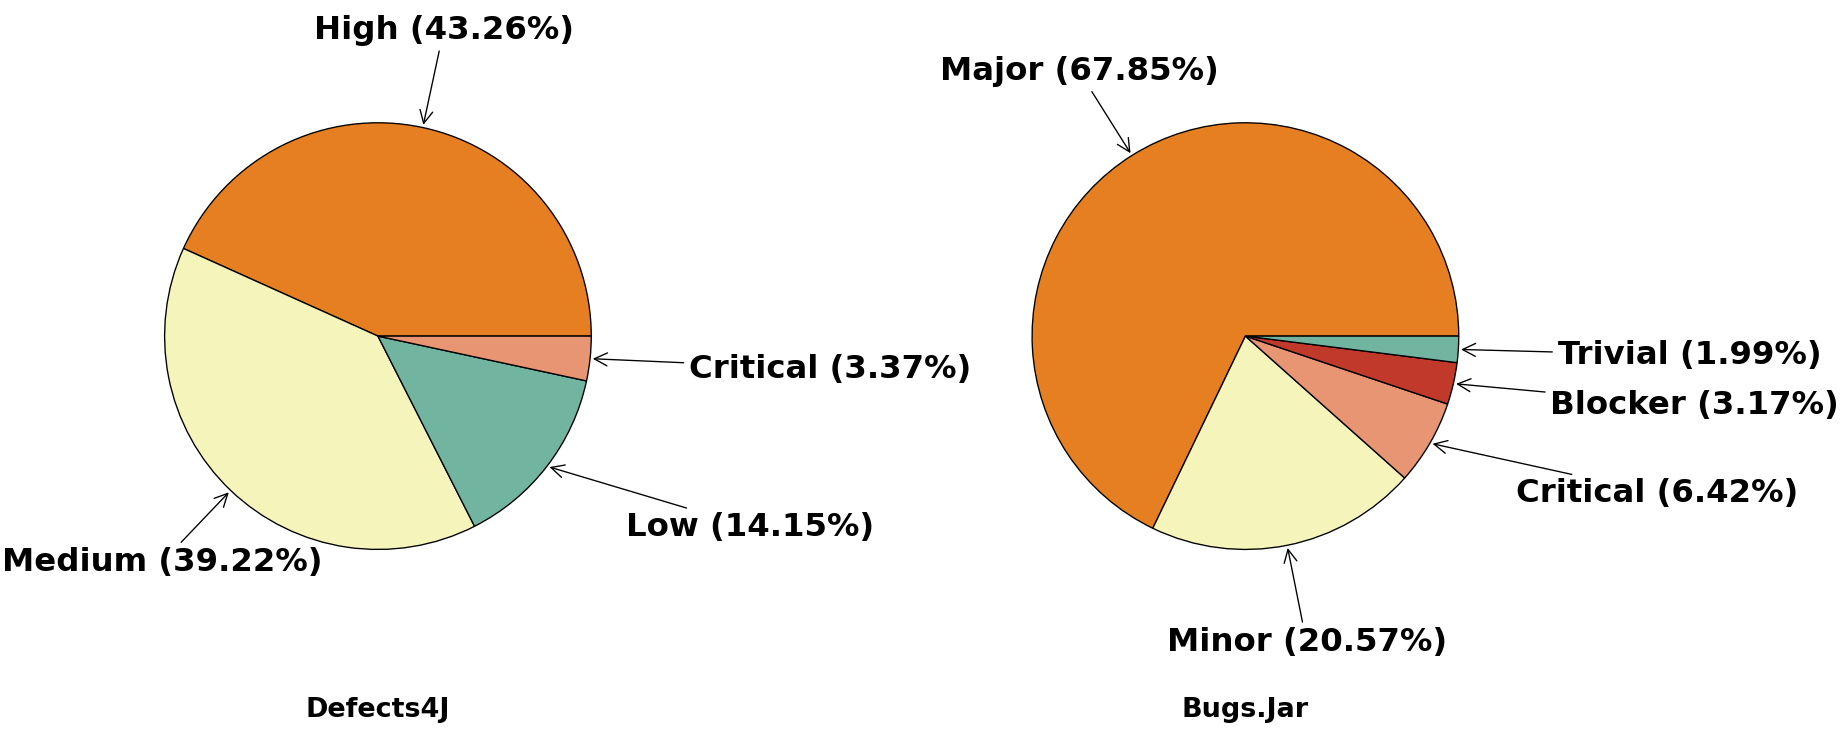
The severity distributions of the buggy methods for Defects4J and Bugs.jar datasets are shown in Fig 2. We study these two datasets separately because of the difference in their labels.
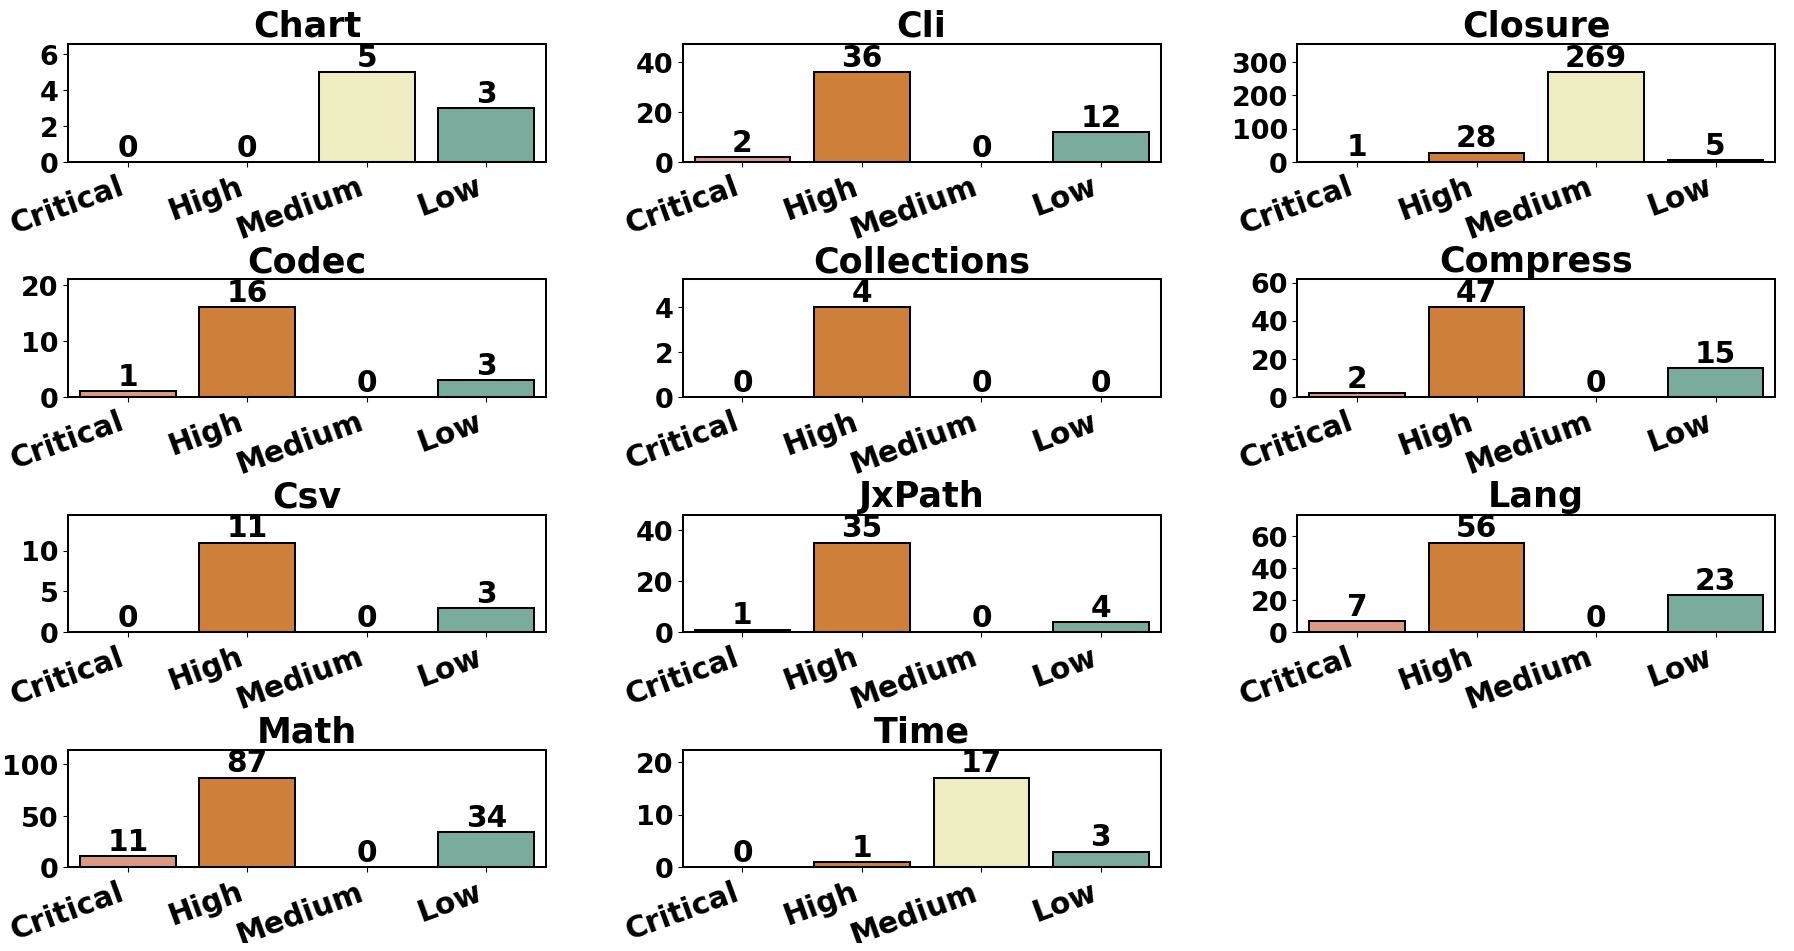
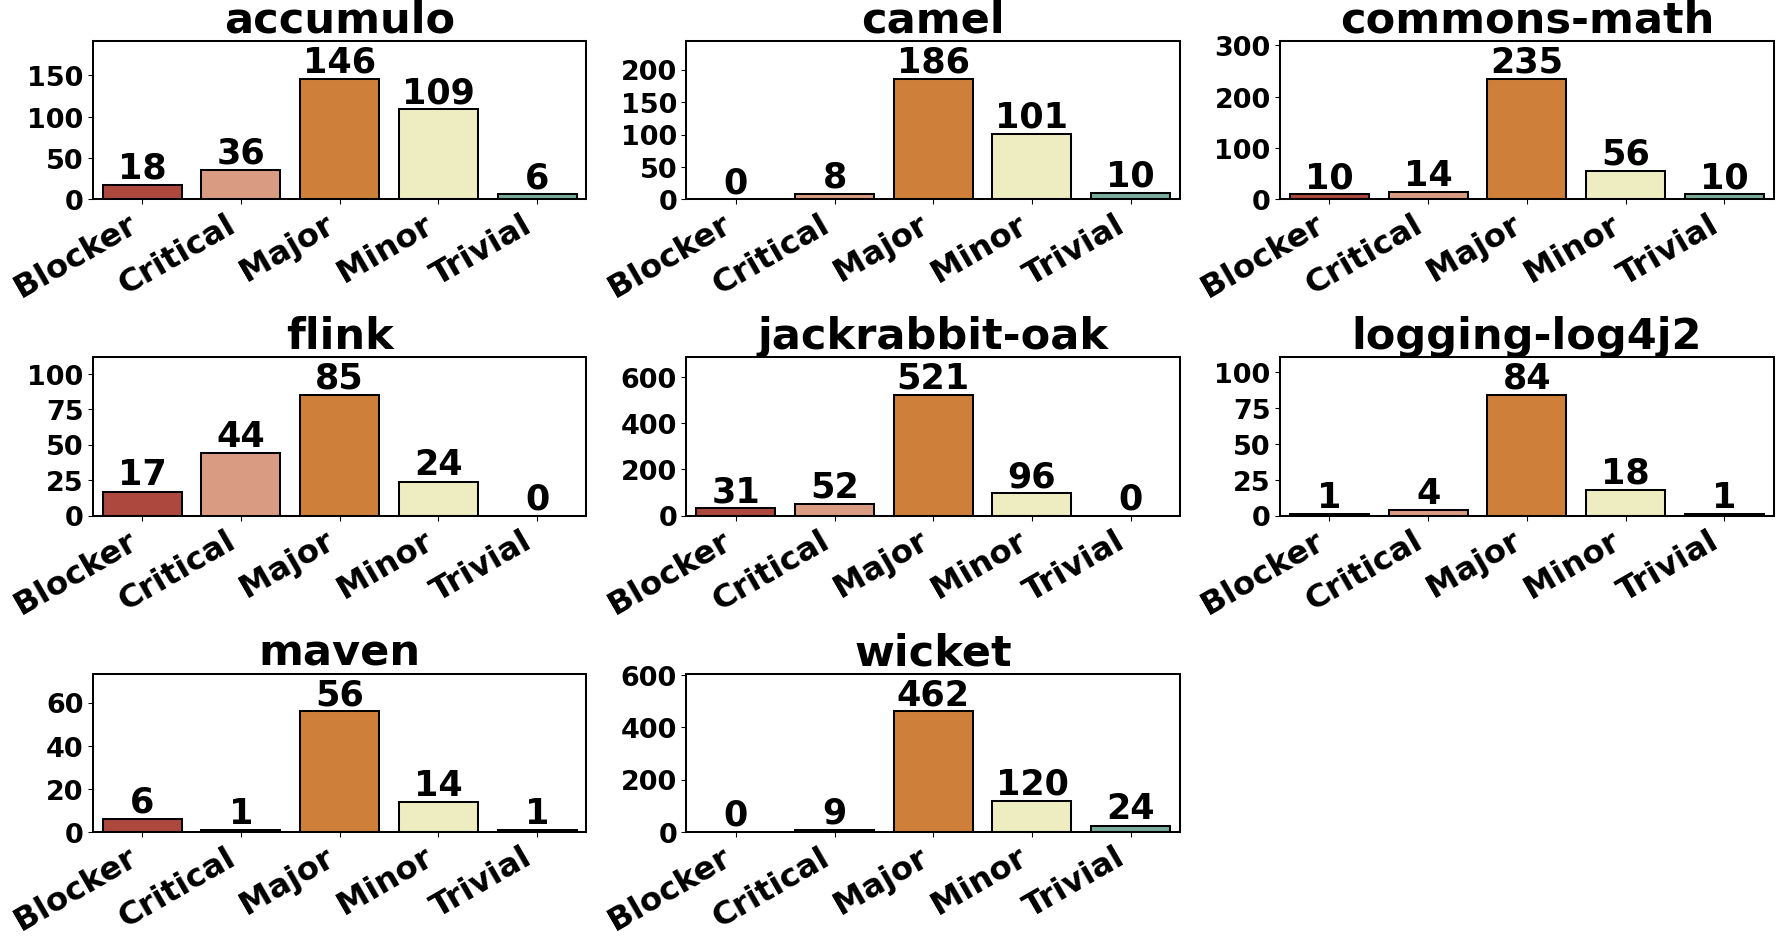
The severity distribution per project is shown in Fig 3 and Fig 4. The figures show that some projects do not have enough samples in all severity categories such as Chart project, containing only a few bugs in “Medium” and “Low” severity groups, or the Closure project, which mainly contains Medium severity bugs. Because of not having enough samples in each project/severity group, we may combine data in different RQs, which we discuss later.
2.2 Studied Code Metrics and Static Analysis Tools
In this section, we describe the code metrics and static analysis tools we use in this study, as well as the reasons for choosing them.
2.2.1 Source Code Metrics
Different source code metrics with module-level, class-level, and method-level granularities have been used to measure software quality and predict bugs in previous research giger2012method ; pecorelli2019comparing . In this paper, we leverage most of the common method-level source code metrics that are used in the previous research (mentioned in the Related Work section) to see their capability in predicting buggy codes and their severity. Although the list of selected metrics is not exhaustive (given the numerous metrics explored in this field and the limitations of experiment size in one article), but we made sure we have most of the metrics that have been shown effective in predicting the method-level bugginess, in the past. These metrics are defined as follows:
Lines of Code (LC): Size, also known as lines of code (LC), is the most popular, easy to measure, and the most effective code metric for estimating software maintenance Gil:2017 ; Emam:2001 ; chowdhury:2022 . The use of LC as a proxy maintenance indicator is so prevalent that there are dedicated studies that completely focus on LC and its correlation with other quality metrics (e.g., Gil:2017 ; landman2014empirical ; chowdhury:2022 ). LC has been extensively studied for bug prediction, fault localization, and for finding vulnerabilities (e.g., pascarella2020performance ; antinyan2014identifying ; shin2010evaluating ; chowdhury:2022 ). In this paper, we calculate LC as the source lines of code without comments and blank lines, similar to landman2014empirical ; ralph2018construct ; chowdhury:2022 to prevent the code formatting and comments effects, which are out of this study scope.
McCabe (MA): McCabe mccabe1976complexity ; landman2014empirical , also known as cyclomatic complexity, is another very popular metric that indicates the number of independent paths, and thus the logical complexity of a program. Intuitively, components with high McCabe values are more bug-prone. McCabe has been studied extensively to find bugs and locate suspicious code antinyan2014identifying , to understand its correlation with code quality pantiuchina2018improving , and to leverage its value for test generation methods, such as structured testing (path testing) watson1996structured . McCabe can be calculated as mccabe1976complexity .
McClure (ML): McClure mcclure1978model ; kafura1987use was proposed as an improvement over McCabe. Unlike McCabe, McClure considers the number of control variables, and the number of comparisons in a predicate, which is not supported by McCabe. Intuitively, a predicate with multiple comparisons and multiple control variables would be more complex, and thus more bug-prone, than a predicate with only one comparison or only a single control variable.
Nested Block Depth (NBD): McCabe and McClure do not consider nested depth. According to these metrics, there is no difference between two code snippets containing two identical for loops if they are arranged serially or nested. NBD kasto2013measuring ; alenezi2019impact ; zaw2020software has been studied alongside McCabe and McClure to alleviate this issue.
Proxy Indentation (PI): Since McCabe-like complexity measures require a language-specific parser (for finding the predicates), Hindle et al. hindle2008reading proposed Proxy Indentation metric as a proxy for McCabe-like complexity metrics. It was shown that, for measuring complexity, indentation measurement can perform very similar to more complex measurements such as McCabe, without requiring a language-specific parser. Indentation measurement is done for each line, and then an aggregated value is calculated for the whole program component (e.g., a method). Hindle et al. showed that the standard deviation as an aggregated value outperforms mean, median or max.
FanOut (FO): This metric calculates the total number of methods called a given method. This provides an estimate of the coupling—i.e., dependency of a particular method on other methods. It is observed that code components that are highly coupled are less maintainable and bug-prone mo2016decoupling ; alomar2019impact .
Readability (R): This metric combines different code features to calculate a single value for estimating code readability. We used the readability metric proposed by Buse et al. buse2009learning which generates a readability score for a given method. The readability scores range from 0 to 1 for specifying least readable code to most readable code, respectively. The authors concluded that this metric has a significant level of correlation with defects, code churn, and self-reported stability.
Halstead Metrics: The Halstead code metrics contain seven measures based on the number of operators and operands in a component halstead1977elements . These metrics have been used in different research such as measuring code complexity perceived by developers antinyan2017evaluating , calculating the complexity of software maintenance tasks curtis1979measuring ; kafura1987use , finding their correlation with indentation measures hindle2008reading , and estimating software readability posnett2011simpler . As all the Halstead metrics are highly correlated to each other, so in this paper, we consider only two of them: Difficulty (D) and Effort (E) which use other Halstead metrics in their formulas. The Halstead Difficulty is calculated as:
Where is the number of distinct operators, is the number of distinct operands, and is the total number of operands.
The Halstead Effort is calculated as:
Where is the total number of operators.
Maintainability Index (MI): Maintainability Index has been introduced by Omran and Hagemeister oman1992metrics where the authors defined metrics for measuring the maintainability of a software system and combine those metrics into a single value. This metric has evolved over time and was adopted by popular tools like Visual Studio visual_studio . MI can be calculated as:
| Metric | Description |
|---|---|
| LC | Number of source code lines without comments and blank lines |
| MA | Number of independent paths (logical complexity) |
| ML | Number of control variables and number of comparisons in a predicate |
| NBD | Counting the depth of most nested block |
| PI | Counting indentation of source code lines |
| FO | Counting total number of methods called a given method |
| R | Measuring the readability of the code in the range of 0-1 (least to most) |
| D | Measure the difficulty of the program to write or understand the code |
| E | Determining the required effort for developing/maintaining the code |
| MI | Measuring how much the code is maintainable |
2.2.2 Static Analysis Tools
Static analysis tools have been introduced for finding bugs by using different techniques, such as pattern matching. FindBugs findbugs is an open-source tool that analyzes Java byte code for finding bugs. SpotBugs spotbugs is a successor of FindBugs which is actively under maintenance. SpotBugs has more than 400 bug patterns and their description is available on the tool’s website spotbugs . Infer infer is a static analysis tool for different programming languages such as Java, C++, Objective-C, and C, which is also actively maintained. Infer has more than 100 predefined issue types which are described on its website infer . Error prone error_prone is another static analysis tool from Google which is used for Java code to catch common programming faults at the compile-time, and it is actively under maintenance. We have selected SpotBugs and Infer tools for our study because of their extensive usage in the previous studies and in practice, and we exclude the ErrorProne because its latest versions do not support older versions of Java projects which exist in our datasets. A more detailed explanation of our selected configuration for these tools is explained in Section 3.2.2.
3 Experiment Design and Results
In this section, we provide the motivation, experiment designs, and results for each RQ. Since each RQ has a few sub-RQs they may have different experiment designs which are explained in the related section.
3.1 Code Metrics & Bug Severity (RQ1)
We aim to understand the capabilities of source code metrics in finding bugs and predicting their severity labels.
3.1.1 Motivation
One of the most important attributes in every issue tracking system is bug severity which is usually determined manually by the developers/QA team. This process is time-consuming and error-prone since the technical team should investigate the effects of the reported bug (e.g., number of affected users, number of crashes, probable consequence on the whole system) based on the bug description or other available data from analytical systems (e.g., crash report logging systems).
As we have mentioned in Section 6, there have been various prosperous research that uses source code metrics for defect-related issues, but the severity prediction studies mostly use bug description which works in cases where there is a well-written bug description and also is quite subjective. Therefore, in this RQ we study source code metrics’ ability in predicting bug severity.
3.1.2 Approach
We examine the code metrics in predicting buggyness and the severity labels by following RQ and sub-RQs.
RQ1: Are source code metrics good indicators of buggyness and bug severity?
RQ1-1: Do source code metrics identify buggy code?
RQ1-2: Do source code metrics distinguish between different bug severity?
Design of RQ1: In this RQ, we first assess code metrics’ capabilities in finding bugs and then evaluate them further in terms of their potential in estimating the bugs’ severity, using a static analysis test. To find the answer to this RQ, we apply a statistical test to see if distributions of methods (e.g., buggy vs non-buggy or critical vs low) are statistically different according to our selected code metrics.
After applying the Shapiro-Wilk test shaphiro1965analysis using 5% level of significance ( = 0.05), we found out that none of our distributions are normal, so we use the non-parametric Wilcoxon Rank-sum test for answering RQ1 with the 5% level of significance ( = 0.05) with the following two null-hypotheses for RQ1-1 and RQ1-2:
-
•
RQ1-1: Distributions of buggy methods and non-buggy methods are not statistically different.
-
•
RQ1-2: Distributions of buggy methods with different severity values are not statistically different.
For finding the significance of the difference, we calculated Cliff’s Delta effect size. We followed the values provided by Hess and Kromrey hess2004robust for interpreting the result of this value. We considered values smaller than 0.147 to be negligible, values in range [0.147, 0.33) to be small, values in range [0.33, 0.474) to be medium, values greater than 0.474 to be large.
Since we are using the static analysis test for this RQ, it is important to make sure that each distribution has enough samples, and distributions are diverse enough (having samples from different projects for reducing the bias problem) to make the results robust. Also, we discard the methods with LC<4 in this RQ since they are mostly boilerplate code such as setters, getters, and constructors which are generated automatically.
We found that our studied datasets contain imbalanced distributions for RQ1-2 since some USLs contain only a few samples (e.g., the Critical USL in the Defects4J contains only 25 samples) or some USLs do not contain enough bugs from various projects to make that category diverse (e.g., 92% of samples in the Medium USL of the Defect4J dataset are from Closure project). Because of the mentioned problem, we merge some USLs (Defined in Section 2.1 one level further for RQ1-2 which is shown in Table 3.
| Dataset | Unified Severity Label (USL) | Merged Category |
| D4J | Critical, High | High |
| Low, Medium | Low | |
| Bugs.jar | Blocker, Critical | Critical |
| Major | Major | |
| Minor, Trivial | Minor |
As shown in Table 3, for the Defects4J dataset, the Critical USL is merged into the High, and also the Medium and Low USLs are merged, so we ended up with two categories of High and Low severity bugs.
In the Bugs.jar dataset, the Blocker and Critical USLs are merged, and also the Trivial and Minor USLs are merged, so we concluded with three severity categories of Critical, Major, and Minor. The Blocker and Critical USLs are merged since the Critical USL does not contain enough samples, the Minor and Trivial USLs are merged because of not enough sample in Trivial. We keep the Major USL as an independent category since it has enough samples.
3.1.3 Results
RQ1-1 Answer: Figure 5 compares the distribution of different code metrics between buggy and non-buggy methods (Figure 5(a) for the Defect4J, and Figure 5(b) for the Bugs.jar datasets). These are aggregated results, as we have combined data for all the projects in a specific dataset. Results suggest that the median values of all code metrics except for the Readability and Maintainable Index in the buggy methods are larger than the median or Q3 (75th percentile) values in the non-buggy methods. Also, for Maintainable Index and Readability, the median of non-buggy methods are larger than the median or Q3 (75th percentile) values in the non-buggy methods. Evidently, the buggy methods are generally larger (LC), more complex (e.g., McCabe, McClure), and less readable than the non-buggy methods. These figures imply that buggy and non-buggy distributions are different regarding all code metrics.
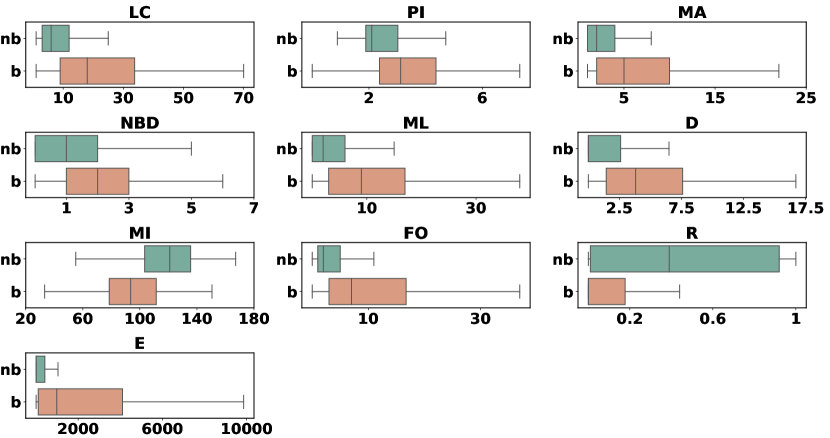
After applying the Wilcoxon Rank Sum Test to find if there is a statistical difference between these two distributions, we found that all of our comparisons for code metrics between buggy and non-buggy methods are statistically significant (). Therefore, the null hypothesis is rejected which means that these metrics are able to distinguish between buggy code and non-buggy code. We provided the Cliff’s delta size values in Table 4 which shows that effect size values are small or medium in all cases. In particular, LC, FanOut, Maintainable Index and, Halstead Effort exhibit better performance than other metrics, because for them the effect size is medium in both datasets.
| Dataset | LC | PI | MA | NBD | ML | D | MI | FO | R | E |
|---|---|---|---|---|---|---|---|---|---|---|
| Defects4J | M | S | M | S | M | S | M | M | S | M |
| Bugs.jar | M | S | S | S | S | S | M | M | S | M |
With aggregated analysis, however, we can not observe if our results are true for all of the projects. The aggregated data can be highly influenced by a few large projects. Also, different external factors, such as code review policy WANG:2019 , developers’ commit patterns Herzig:2013 and expertise Matter:2009 , can impact the distribution of code metrics and bug-proneness of a particular project. Therefore, we now reproduce the results for each project individually.
| Dataset | LC | PI | MA | NBD | ML | D | MI | FO | R | E |
|---|---|---|---|---|---|---|---|---|---|---|
| Defects4J | 100% | 50% | 70% | 80% | 80% | 70% | 100% | 100% | 90% | 80% |
| Bugs.jar | 100% | 87.5% | 100% | 100% | 100% | 100% | 100% | 100% | 100% | 100% |
| Defects4J | Bugs.jar | |||||||
|---|---|---|---|---|---|---|---|---|
| Metrics | N | S | M | L | N | S | M | L |
| LC | 0 | 40 | 30 | 30 | 0.0 | 25 | 62.5 | 12.5 |
| PI | 30 | 50 | 10 | 10 | 37.5 | 62.5 | 0.0 | 0.0 |
| MA | 20 | 40 | 20 | 20 | 12.5 | 37.5 | 50 | 0.0 |
| NBD | 20 | 50 | 10 | 20 | 12.5 | 75 | 12.5 | 0.0 |
| ML | 10 | 30 | 40 | 20 | 0.0 | 62.5 | 37.5 | 0.0 |
| D | 20 | 40 | 30 | 10 | 12.5 | 37.5 | 50 | 0.0 |
| MI | 0 | 30 | 40 | 30 | 0.0 | 25 | 62.5 | 12.5 |
| FO | 0 | 40 | 40 | 20 | 0.0 | 37.5 | 50 | 12.5 |
| R | 0 | 50 | 40 | 10 | 0.0 | 87.5 | 12.5 | 0.0 |
| E | 10 | 30 | 30 | 30 | 0.0 | 37.5 | 62.5 | 0.0 |
We calculated the percent of projects where the distributions of a particular metric are statistically different between buggy and non-buggy methods.
Table 5 shows the results for all the code metrics. The distribution of LC, Maintainable Index, and FanOut are statistically different between buggy and non-buggy methods in all the studied projects from both datasets (100%). In the Defect4J dataset, the proxy indentation (PI) metric has the weakest performance since in 50% of the projects, the result is not significantly different. Most of the metrics, however, show good performance in distinguishing the buggy method from the non-buggy method. We also calculated the Cliff’s effect sizes of the differences, as presented
and described in Table 6. The results show that Lines of Code, Maintainable Index, Fan Out, and Readability metrics do not exhibit negligible effect size for both datasets, but Proxy Indentation has the largest percentage of negligible effect size in both datasets.
Summary of RQ1.1 Results:
Our selected code metrics show high performance in identifying the buggyness of methods in both datasets, and on both the aggregated datasets and the individual projects. Line of Code, Maintainable Index, Fan-out, and Effort metrics have the best performance while Proxy Indentation and Nested Block Depth have the worst performance.
RQ1.2 Answer: After observing the somewhat known power of code metrics in distinguishing buggy and non-buggy methods, in this sub-RQ, we show their power in estimating the bug’s severity. Although we wanted to perform the analysis for each project separately, there is not enough data in each severity category, except for accumulo and jackrabbit-oak projects. The accumulo project has 44, 100, 87 and jackrabbit-oak project has 71, 439, 80 samples in Critical, Major, and High categories (we described in Section2.1) respectively. The number of samples for each category in other projects was much lower, so we did not report their statistical test results separately.
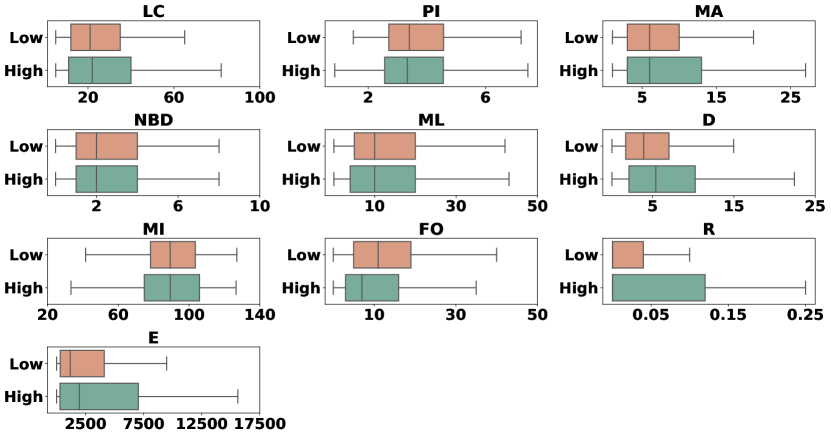
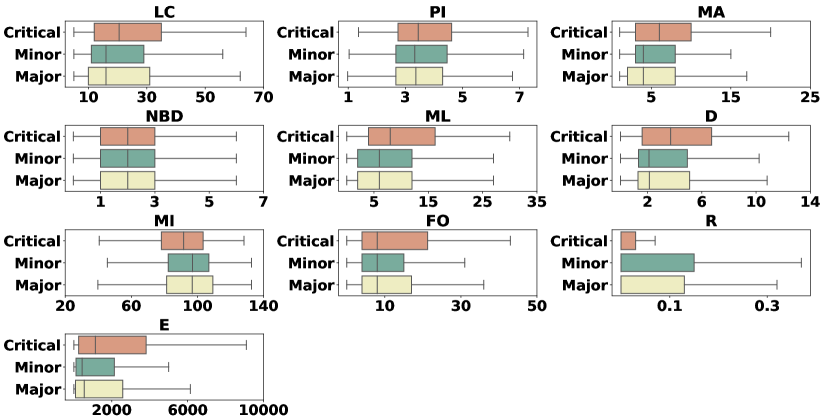
Fig 6 compares the
distributions of different code metrics after grouping the bugs into different bug severity categories. To provide better insights, we also provide the Wilcoxon Rank-Sum test and Cliff’s Delta size values for both datasets in Table 7. While the first two major rows (for Defect4J, and Bugs.jar) show results for aggregated analysis, the last two rows also show results for the two individual projects: accumulo and jackrabbit-oak.
In contrast to the previous section, in many cases, the results are not significantly different between different bug severity categories. Considering the aggregated analysis in both datasets, only Halstead difficulty, and effort show desired behavior: methods with higher severity bugs have higher difficulty and effort distribution. Maintainability index (MI) performs the worst: only in two cases it exhibits statistically different distributions. Readability shows desired behavior for the Bugs.jar dataset when comparison was done between critical and major, and critical and minor. The statistically different distributions among these groups suggest that, a method with lower readability has higher chance to have more severe bugs. Although source lines of code (LC) was very helpful to differentiate between buggy and non-buggy methods (Figure 5(b), Table 5 and Table 6), its performance is significantly worse when it comes to distinguishing different levels of bug severity. This is interesting because numerous previous studies (e.g., Emam:2001 ; Gil:2017 ; TSE:2013 ) has shown that size (source lines of code) is the most important code metric, and none of the other code metrics provide any new information if their correlation with size is normalized. Our result challenges that claim because we find the superior performance of other code metrics (e.g., Halstead difficulty, and Halstead effort) than size when distinguishing methods with different bug severity.
| Project | Distributions | LC | PI | MA | NBD | ML | D | MI | FO | R | E |
| Defect4J (all) | High-Low | N | N | N | N | N | S | N | S | N | N |
| Critical-Major | N | N | S | N | S | S | N | N | N | S | |
| Critical-Minor | N | N | N | N | N | S | N | N | N | S | |
| Bugs.jar (all) | Major-Minor | N | N | N | N | N | N | N | N | N | N |
| Critical-Major | N | N | S | S | S | N | N | N | N | N | |
| Critical-Minor | S | S | S | S | S | S | S | S | N | S | |
| accumulo | Major-Minor | N | S | N | N | N | N | N | S | N | N |
| Critical-Major | N | N | N | N | N | N | N | S | N | N | |
| Critical-Minor | N | S | N | S | S | S | N | N | S | N | |
| jackrabbit-oak | Major-Minor | S | S | S | S | S | S | N | S | N | S |
In many cases, there is no statistical difference between these code metrics when compared against bug severity. It means that there are some cases where the code is complex which makes it error-prone, but severe bugs are not necessary in the complex code. We may intuitively say that there may be bugs in a simple method containing a SQL query for reading data from a database. In such a method, the code complexity metrics suggest a simple method, but if the developers do not handle input validation, so the code will be vulnerable to SQL Injection. On the other hand, we may have a very complex and big method containing nested loops with different switch cases and exception handling statements. The code complexity metrics suggest the complex method, but this method may try to handle the UI/GUI part of the system only, which is not vulnerable to any critical or high severity bugs. We will explore the real examples from our datasets regarding our intuition in RQ3.
Summary of RQ1.2 Results: None of the selected code metrics show promising results in distinguishing bug severity. While Difficulty and Effort metrics have the best performance in the aggregated datasets, the Maintainable Index and Proxy indentation metrics have the weakest performance. Although the Line of Code metric has the best performance in distinguishing buggyness of the methods, it has the worst performance in finding bug severity, in both the aggregated datasets and the individual projects.
3.2 Static Analysis Tools & Bug Severity (RQ2)
The second goal of our study is to find out if static analysis tools can detect the bugs and their severity labels.
3.2.1 Motivation
Since source code metrics do not show promising results in predicting the bug severity according to Section 3.1.2, we explore other approaches. To do so, we study the static analysis tools which are widely used in practice for different purposes (e.g., finding programming errors, coding standard violations, syntax violations, security vulnerabilities) by technical teams. This approach is favorable because of its higher speed than the human code review and its capability in working offline with low required resources. Since these tools are already integrated into the deployment process of many companies, so if we could use them for predicting the severity we can leverage them for prioritizing the bugs without requiring any other tools/methods. Therefore, in this RQ, first, we need to find out if these tools can detect real-world complex bugs, and then we study their performance in predicting the detected bug’s severity.
3.2.2 Approach
We pose one RQ with its two sub-RQs to find the static analysis tools capabilities in bug/severity detection.
RQ2: What is the capability of static analysis tools in finding bugs and their severity?
RQ2-1: How effective static analysis tools are in detecting buggy methods?
RQ2-2: Can static analysis tools estimate detected bugs’ severity?
Design of RQ2: To answer this RQ, we selected two static analysis tools named SpotBugs, spotbugs and Infer infer . We selected SpotBugs because it not only can detect bugs but also report a Rank value which indicates the severity. We used the popular Infer tool only to detect buggy methods regardless of their severity values. Since there is no need for a statistical test in this RQ, and therefore there is no restriction on the number of samples in each group we used the USL values (mentioned in Section 2.1 directly without a need for any merging process.
SpotBugs has different configurations which affect it performance in finding bugs. It has some specific detector modules, which focus on specific bug types, but we used the standard detectors, which is also the default option. Also, this tool has a configuration option named effort which adjusts the taken effort in finding bugs. We used the effort=max, which is the highest level of effort, so in this way, we have provided as much as the computation cost this tool requires to work on our datasets.
There are different ways to provide projects’ source code to these tools, such as providing only the buggy class(es), the package containing the buggy class(es), or the whole project. By providing only the buggy class, the tool may not be able to find the bugs that are across different classes since it only analyses that specific class, but when we provide the whole package or the whole project, it analyses any file in these modules to find the bugs accurately which also needs more resources and time. We provided the whole project to be analyzed with tools to make the result more robust. However, this takes 3 and 52 hours for the Defect4J and Bugs.jar dataset, respectively, on a regular computer with 16GB RAM and 16 CPU cores.
Although we successfully applied these tools on all of the Defects4J projects, for several projects of the Bugs.jar dataset we faced build errors due to dependency issues. We were successful in building flink, commons-math, and accumulo projects which consist of 248 buggy methods.
SpotBugs reports the Confidence value for each bug instance, which indicates the level of confidence the tool has in reporting this warning. This attribute may have different values such as 1 to match high-confidence warnings, 2 to match normal-confidence warnings, or 3 to match low-confidence warnings. We considered all of the reported warnings regardless of their confidence values.
Also, this tool reports the Rank property which indicates the bug rank. This property is an integer value between 1 and 20, where 1 to 4 are scariest, 5 to 9 scary, 10 to 14 troubling, and 15 to 20 of concern bugs. spotbugs . The higher the number, the more important it is. This property has a similar semantic to the bug severity value, so we used this value to see the tools capability in finding the bugs’ severity.
| Unified Severity Label (USL) | SpotBugs Reported Rank (SRR) |
|---|---|
| Critical, Blocker | 1 to 4 |
| Major, High | 5 to 9 |
| Medium | 10 to 14 |
| Low, Trivial, Minor | 15 to 20 |
The translation between the range of this value and our USLs is provided in Table 8. As the table shows, we consider 1 to 4 as Critical and Blocker USL, 5 to 9 as Major and High USL, 10 to 14 as Medium USL, and 15 to 20 as Minor, Low, and Trivial USL. For example, when the SpotBugs reports any number in the range of [1,4], and the actual severity value is either Critical or Blocker we say that it detects the severity correctly.
The Infer tool reports the IssueType attribute with these categories: 1) Error 2) Warning 3) Info, Advice, Like. These values can be interpreted as the bug importance, but we found that all of our bugs are mapped to the Error category, based on their severity values. Thus it is not possible to leverage the IssueType property to predict the bug severity, and we cannot use this tool to predict the severity. Therefore, we leverage this tool only to see if it can detect buggy methods, regardless of their severity values.
Both of these tools report the roots of detected bugs according to their defined patterns, by locating the start and end lines of the bug. Since we are considering bugs at the method-level granularity, we consider a method to be buggy whenever these tools report a bug in that method regardless of the reported start and end lines.
3.2.3 Results
RQ2-1 Answer: After applying SpotBugs and Infer tools we count the number of buggy methods that are reported as buggy (TP), the number of non-buggy methods which are not reported as buggy (TN), the number of buggy methods that are not detected by tools (FN), and the number of non-buggy methods which are reported as buggy methods (FP). If any of these tools report more than one bug for each method we only count that method once to prevent the duplication problem.
| Dataset | Tool | Accuracy | Precision | Recall | F1 |
|---|---|---|---|---|---|
| D4J | SpotBugs | 93% | 7.1% | 7.2% | 7.1% |
| Infer | 95% | 9% | 1.9% | 3.1% | |
| Bugs.jar | SpotBugs | 95% | 7.6% | 4.3% | 5.4% |
We calculated the Accuracy, Precision, Recall, and F1 values which are shown in Table 9. These values show that these tools have poor performance in detecting buggy methods of both datasets. The precision value range is 7%-9% which means that they may report many non-buggy methods as buggy methods, so the technical team may spend extra time on finding bugs in these methods, and this increase the cost of the development phase without any useful result. However, the recall value (predicting buggy methods as non-buggy methods) is a more important metric in our case which has a smaller range of 2%-7%. This small value indicates that these tools miss many bugs which may lead to harmful consequences. The calculated F1 score shows that SpotBugs have better performance in finding bugs in the Defect4J dataset than the Bugs.jar dataset, and Infer tool has worse performance than SpotBugs for the Defects4J dataset.
Our results are consistent with the previous study habib2018many in 2018 where the authors studied the capability of SpotBugs, Infer, and ErrorProne tools in finding buggy methods of an older version of the Defects4J dataset. They concluded that 95.5% of buggy methods are not detected by these tools. Surprisingly, although these tools have been updated several times since four years ago, their performance in finding bugs is not improved much.
Since these tools are matching the provided code with their predefined generic bug patterns, we may intuitively say that in cases where the bug is complex or related to the software specification, they are missed by the tools. We will perform a qualitative study of some randomly sampled bugs to find the reasons behind this poor performance, in RQ3.
Summary of RQ2.1 Results:
Both SpotBugs and Infer tools have significantly low performance in finding bugs even with many existing developed patterns. The precision range for both datasets is 7%-9% and the Recall range is 2%-7% which shows the high number of missed bugs.
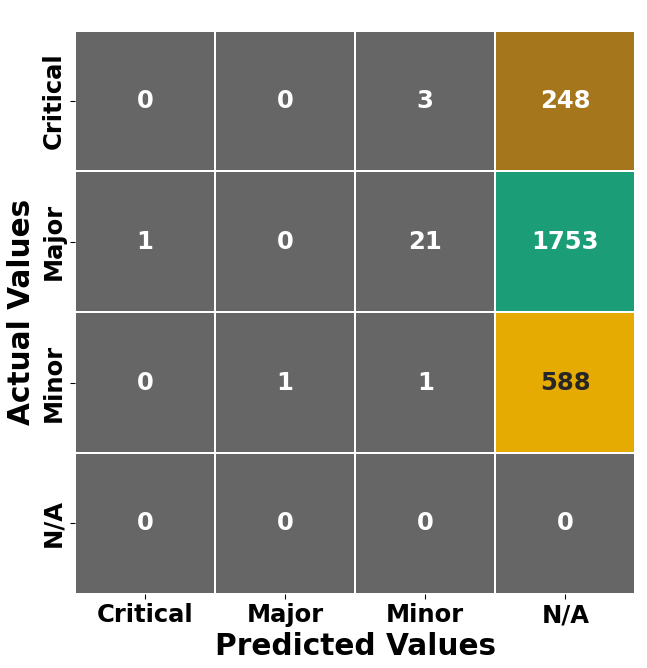
RQ2.2 Answer: Since only the SpotBugs tool can detect the severity of bugs, in this section we provide the results of only this tool on both Defects4J and Bugs.jar datasets.
Defects4J
Bugs.jar
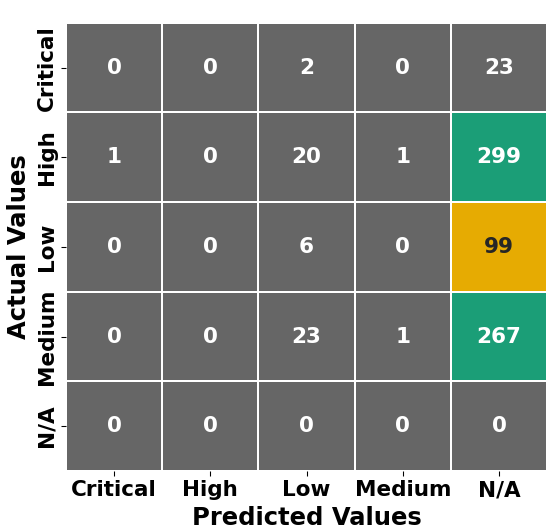
We provided the confusion matrices for SpotBugs tool in Fig 7. These figures show that this tool cannot detect bug severity in many cases, and also mislabeled many bugs with wrong severity labels. For example, it detects two critical bugs as low-severity bugs and 20 high-severity bugs as low-severity bugs, in the Defects4J dataset. These figures show that the SpotBugs did not detect the severity of any Critical bugs in Defect4J and Bugs.jar datasets.
Table 10 shows different descriptive statistics of this tool performance. Since we have multi-class labels, we used macro average macroaverage for calculating these values. In this method, the final result is computed by taking the arithmetic mean of all the per-class descriptive scores.
The overall score F1 score shows that SpotBugs has significantly better performance for the Defect4J dataset, but the scores show that this tool has, overall, a very low performance. We studied bug characteristics manually in RQ3 to find the reasons for this weak performance.
| Dataset | Accuracy | Precision | Recall | F1 |
|---|---|---|---|---|
| D4J | 94.00% | 12.35% | 1.25% | 1.67% |
| Bugs.jar | 0.03% | 1.00% | 0.04% | 0.08% |
Summary of RQ2.2 Results:
SpotBugs has significantly better performance in finding bug severity of the Defects4J dataset than the Bugs.jar dataset. However, this tool wrongly assigns lower severity values to bugs in many cases. The overall performance shows that there is still much work to be done for this tool to accurately estimate bug severity.
3.3 Manual Analysis of Bug Characteristics (RQ3)
Our final goal, in RQ3, is to dig more into the results of RQ1 and RQ2 and study the bug characteristics in different important scenarios such as (a) when there is a contradiction between code metrics and severity, (b) when the static analysis tools miss/mislabel severe bugs, and (c) when code metrics and static analysis tools can be complementary.
3.3.1 Motivation
To understand why source code metrics cannot indicate the bug severity, we need to study the cases where there is a contradiction between the bug severity and source code metrics. Also, it seems important to find out if there is any relationship between the bug’s type and its severity. The answer to this question can help researchers to consider bug types as important features when providing new approaches for bug prediction to have better accuracy, and also developers may pay more attention to specific bug types during the manual severity assignment process.
To find out why static analysis tools miss many severe bugs or predict lower severity than the actual severity, in most cases, we need to study if this problem exists because of the nature of static analysis tools or if there is potential for improvement. The answer to this question will help researchers to improve the developed approaches to enhance the bug severity performance and also developers can get insights into how confidently they should use these tools in their projects.
Finally, since real bugs are very complex due to the complexity of the current software and various new technologies, it would be useful to consider multiple approaches instead of relying on a single approach to predict the severity. Therefore, we also study if code metrics and static analysis tools are complementary in terms of bug severity prediction. This may lead to a technique that combines these approaches to predict the severity more accurately.
3.3.2 Approach
We provided one RQ with three sub-RQs to study the bug characteristics.
RQ3: What are the characteristics of bugs with different severity values?
RQ3-1: What factors may lead to inconsistencies between bug severity and code metrics?
RQ3-2: Why do static analysis tools miss or mislabel severe bugs?
RQ3-3: Do the results of code metrics and static analysis tools have overlap?
Design of RQ3-1: As we show in the RQ1 results section, there is a correlation between bug existence and code complexity metrics, but there is no significant correlation between bug severity and code complexity metrics. Therefore, we manually investigated a random sample of bugs for finding factors that lead to contradictions between bug severity values and code metrics. The goal of this sub-RQ is to study the characteristics of buggy methods with high severity (e.g., Blocker, Critical, Major) which have low code metrics measurement. Also, to study buggy methods with low severity (e.g., Low, Minor, Trivial) which have high code metrics measurement.
To facilitate the manual analysis, we split all bugs into two high-level categories of severity, which are: severe (including Blocker, Critical, Major, and High severity USLs from RQ1) and non-severe (including Medium, Low, Minor, and Trivial USLs from RQ1).
To find the two lists of the most and the least complex methods, we calculate a representative sum complexity value from different code metrics. Since our code metric values do not have the same range, we normalize them by using the Robust Scaler algorithm robustscaler , which is robust against outliers. It follows a similar algorithm to the MinMax scale, but it uses the interquartile range rather than the min-max. The formula for Robust Scaler is:
Where is the 1st quartile, and is the third quartile.
To find the Sum Complexity (SC) value—which indicates the total complexity of the method—we take the sum of different code metrics (we multiply Readability and Maintainable Index by -1 to reverse their value). We provide the same weight to all the code metrics and the possible impact of this decision is discussed in the Threats to Validity section. Table 11 shows two sample bugs with the calculated code metrics, the normalized code metric, and also the Sum Complexity values.
| Severe | Non-Severe | |||
| Metrics | Raw | Normalized | Raw | Normalized |
| LC | 13.00 | -0.35 | 532.00 | 21.27 |
| PI | 2.89 | -0.25 | 8.61 | 2.75 |
| MA | 3.00 | -0.37 | 194.00 | 23.50 |
| NBD | 1.00 | -0.33 | 12.00 | 3.33 |
| ML | 2.00 | -0.53 | 219.00 | 13.93 |
| D | 1.86 | -0.39 | 18.84 | 2.20 |
| FO | 4.00 | -0.35 | 40.00 | 22.14 |
| E | 220.14 | -0.27 | 214131.00 | 45.50 |
| MI | -103.93 | -0.53 | 23.86 | 4.15 |
| R | -0.22 | -3.66 | 0 | 0 |
| Sum Complexity | 143.74 | -7.07 | 215459.26 | 138.80 |
After calculating the SC value, to find the contradiction, we sorted our samples based on the SC (normalized version) value in ascending and descending orders separately and keep the first 60 samples in both cases for both datasets which result in 240 samples:
For preventing bias, we randomly select 60 bugs out of these 240 bugs distributed evenly between Severe and Non-Severe bugs (our two categories in this RQ) and also between Defects4J and Bugs.jar (our datasets). Then, we provide the buggy code and the corresponding fixed code of these samples to the first and third authors.
We use a grounded theory approach called Card Sorting miles1994qualitative to label the bug type manually. In this approach, we asked the first and third authors to label each buggy method with one or more bug types of their choice, based on their own-defined list of bugs types (e.g., Network, UI/GUI, IndexOutofBound, Math calculation), by looking at the buggy code and the fixed code only. The total unique labels created by the two authors in this phase were nine low-level labels (mentioned in the 3.3.3 section).
Then, the first and third authors had a meeting to discuss their assigned labels and also merge them into the final set of high-level labels containing four labels.
During the merging process, while authors agreed on most of the samples’ labels, several assigned labels had similar meanings but were expressed in different terms. We resolved those conflicts by assigning a more generic label that covers both original labels. For example, there is a sample where the first author assigned “I/O bug”, as the label, but the third author assigned “Network bug”. We merged these two labels in I/O bug label which covers Network bug too. Also, there are a few cases where the first and third authors cannot make the decision because of the conflicts, so we resolved these conflicts by comparing both provided categories and the code.
Following this approach, we ended up with these four labels per bug: Integration, Edge/Boundary/ Security, and Specification.
Design of RQ3-2: Based on RQ2 results, we found that the SpotBugs tool missed or mislabeled bug severity in many cases, which may lead to undesirable consequences. For example, mislabeling the high-severity bugs with low severity values will reduce the bug’s importance. Thus the development team may postpone the fixing process. Therefore, in this sub-RQ, we want to find out the reasons behind why these tools are not able to find the bugs or their severity values.
To do so, we first manually analyze 25 randomly chosen severe bugs (Blocker, Critical, Major, and High severity categories) in both datasets that are missed by static analysis tools, by comparing the buggy code and fixed code. In this step, we mainly want to know if the lack of bug patterns in static analysis tools prevents them from detecting these bugs, or if these bugs’ nature is such that static analysis tools cannot detect them regardless of what pattern/rule they implement. We will provide a few samples in the following section including buggy and fixed code.
We then study a set of 25 randomly selected samples of severe bugs (Blocker, Critical, Major, and High severity categories) which are detected by SpotBugs tools, but the reported severity is lower than the actual severity values, e.g., when the actual severity value is Critical, but the tools report the Low severity value.
Design of RQ3-3: Given the results of RQ1 and RQ2, in this sub-RQ, we want to see if both severity estimation approaches (based on code complexity and static analysis tools) are leveraging similar or different characteristics of the code to predict severity or not. The motivation behind this sub-RQ is that if they are focusing on different aspects, combining both approaches will lead to a better prediction.
To answer this question, we manually investigate all the samples predicted by the SpotBugs to see if the calculated Sum Complexity (mentioned in the RQ3-1) values are aligned with the reported bug severity by this tool. We report samples where these values are contradictory, and one of them predicts the bug severity, accurately, in the following section. For instance, we look at a case where there is a high-severity buggy method in the dataset, which has a large Sum Complexity value, but the SpotBugs reports Low severity. We also summarize cases where using both of these approaches has better performance than using either of them in the following section.
3.3.3 Results
RQ3-1 Answer: After applying the Card Sorting approach which is explained in Section 3.3.2 we found nine low-level bug labels such as UI (User Interface) bug, multi-threading bug, and math calculation bugs. These labels may have overlap in many scenarios, and some of them contain only one or two samples.
| Low-level Label | Number |
|---|---|
| I/O | 2 |
| UI | 1 |
| Multi-threading | 2 |
| Null checking | 4 |
| Exception handling | 4 |
| Math/String calculation | 3 |
| Wrong/missing objects and parameters | 21 |
| Input/state checking | 16 |
| Completely wrong implementation | 7 |
Table 12 shows bug types and their distributions. I/O bugs occur in a method where the code access any I/O such as a file or network. Multi-threading bugs are due to not handling threading issues such as deadlock. Null checking bugs happen when the code access the null object or do not handle special specification when the method argument is null. Exception handling bugs occur when the method does not handle exceptions when a variable/object has a special value. Math/String calculation bugs occur when the mathematical calculations or string manipulations are performed wrongly. Wrong/missing objects and parameters type refers to code where the developer passes a wrong parameter to a method or use the wrong object to call. Input/state checking bugs happen when the code does not validate the function inputs or it does not consider the specific case of an object state for having different logic. Completely wrong implementation bug type shows cases where the fixed code is changed completely to implement new logic compared to the buggy code.
| High-level Label | Severe Bug & Low SC | Non-severe Bug & High SC |
|---|---|---|
| Integration | 2 | 0 |
| Edge/Boundary | 2 | 7 |
| Security | 7 | 3 |
| Specification | 19 | 20 |
We provided the distributions of high-level bug labels in case of severe bugs and low Sum Complexity (SC), and also non-severe bugs and high Sum Complexity (SC) in Table 13. The number of Security faults is more when the bugs are labeled as severe, but the code metric values are low which indicates that security bugs may appear in simple methods but may lead to severe bugs. Furthermore, Edge/Boundary faults are mostly available in samples with high Sum Complexity (SC) values where the code is complex by having many different branches and statements where developers tend to miss edge/boundary cases, but these bugs are not severe necessarily.
In the following, we will provide a definition for each of these four bug type categories and give some samples per category. Just a reminder that these categories have been defined based on our dataset and are the result of merging the labels from the Card Sorting phase.
Integration faults:
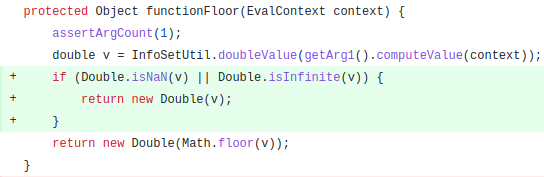
This bug label exhibit cases where the bug is related to another component, module, or class that our buggy method is using, so it would be impossible to access the buggy method without considering the called module(s). For example, Fig 8 shows a buggy code and its corresponding fixed code in the JxPath-14 project. The buggy method seems to be very simple containing only three statements, so based on the code metric values this is not a complex code, but the actual severity value is high. The bug is related to the floor() method which is from another module (math). It seems that this module may not handle NaN and Infinite values or it may handle them differently than the studied project’s (JxPath) specification. From the patch, we see that the developer needs to return a different value when the v parameter is NaN or Infinite, so the developer had to handle this case in the code before calling the Math.floor() function. As another example, the buggy method in the Cli-2 project uses the NumberUtils.createNumber() method to convert the variable with String type to the Number type, but the patch shows that the developer has rewritten the logic of converting String to Number inside the code without using the NumberUtils anymore. In this case, the called component may contain a bug or it may be developed with different specification which does not satisfy the caller component’s developer’s requirement, so for detecting the severity value of this kind of bug accurately it is required to consider both caller and called module code together.
Since we found only two Integration faults, we do not draw a conclusion about the correlation between the Integration faults and their high severity. However, our observations show that estimating the severity of faults in this category by only considering the caller method seems impossible. Thus an analysis in a coarser granularity (e.g, class/module/package) is suggested.
Edge/Boundary cases:
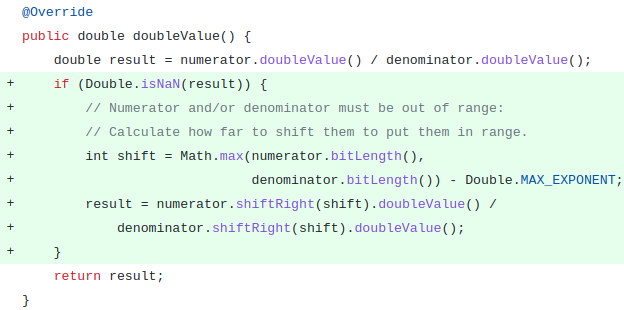
This kind of bug happens when the developers do not handle edge/boundary cases which usually leads to a software crash. Several samples in this category contain a severe bug with a simple code according to our code metrics, containing only a few statements. For example, Fig 9 shows the buggy method in the Math-36 project, where the developer did not handle the edge case (Double.isNaN(result)), but the patch shows that the studied method should have performed an extra calculation when the result variable is NaN. This bug may lead to a software crash, unauthorized access, or undesired behaviour.
Another severe bug exists in the accumulo project where the buggy method renames a requested table. In this method, the code does not check if the requested table exists already or whether the new requested name is already taken by another table, so this bug probably leads to a software crash or overwriting the existing table.
We found that most of the Edge/Boundary bugs are not severe in our datasets, but they appear in complex methods. Measuring the bug consequences in the whole system would be required to find the bug impact and eventually the severity. Edge/Boundary case testing could be a possible solution to determine the bug impact based on the number of failed tests.
Security faults: Security faults can be exploited to gain unauthorized access/privileges by intruders. Since it is not easy to find if there is a security fault, solely from the source code, we found that some bugs are highly potential to be exploited by intruders by considering keywords and the method context.
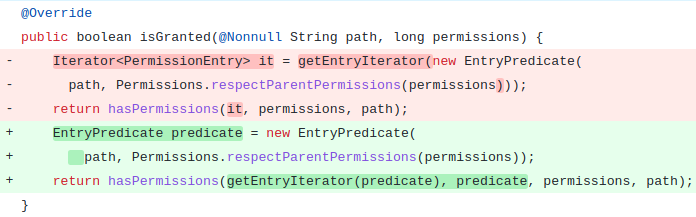
For example, there is a bug with Major severity in the jackrabbit-oak project which is shown in Fig 10. This simple (based on the code metric values) method checks whether the requested path argument has the access permission to be used. Handling permissions incorrectly may potentially lead to unauthorized access, and this usually has harmful consequences such as data loss or breaking the system completely.
After investigating all the samples in this category, we found that Security faults are severe (Blocker, Critical, Major, High) in most cases. However, these bugs are available in simple methods (based on our code metrics) that handle a sensitive task which may lead to harmful consequences and result in severe bugs.
Although we found most of our Security faults happen in the simple methods, but more specific methodologies such as security testing are required to find these bugs’ severity values. If we can find the security faults type (e.g., Injection, Data Exposure, Broken Access Control, etc) the bug severity can be found easily, since security fault types typically have a specific ranking based on their probable consequences in a few defined standards.
Specification faults: This category, which is our largest category, exhibits bugs where developers have not implemented the full specification (e.g., the logic related to a partition in the input space has been ignored, i.e., misrepresented). This bug type is called Specification faults since they may not occur if the developers would follow the specification of the software completely hemmati2015effective . Patches for these bugs contain changing conditional statements, math calculations, string manipulation, or a complete rewrite of the code.
For example, there is a bug with the Low severity value in Closure-119 project where the buggy method is too complex (containing 120 lines of code having many nested switch-case and conditional statements), but the patch is very simple which handles a small part of input space. Part of this method and its patch are shown in Fig 11. Long methods such as our mentioned example are usually bug-prone, and they are detected as buggy by code metrics correctly, but the bug could have a Low severity value since these long and complicated methods may handle a not sensitive task such as handling the GUI part.
Also, Fig 12 shows part of a buggy method from the Lang30 project which has a Low severity value. In this sample, the patch is not as simple as the previous example and part of the code is rewritten, but the severity is still low.
The number of Specification faults in both severe and non-severe categories is almost equal as shown in Table 13, so further information is strongly required to detect the bug severity in this case.
Summary of RQ3.1 Results:
Most of our studied bugs were placed in the Specification categories, evenly, regardless of their severity value. Our studied bugs in the Edge/Boundary category are complex (high SC value) but mainly have a Low severity value. Security bugs have High severity, but they are mostly not complex (low SC value). It is almost impossible to detect the Integration fault severity label without considering the called module/class.
RQ3-2 Answer: In this section, we provide the results of our manual investigation of severe bugs (Blocker, Critical, Major, High) that are not detected by static analysis tools and go through some examples of severe bugs that are miss-labeled by SpotBugs.
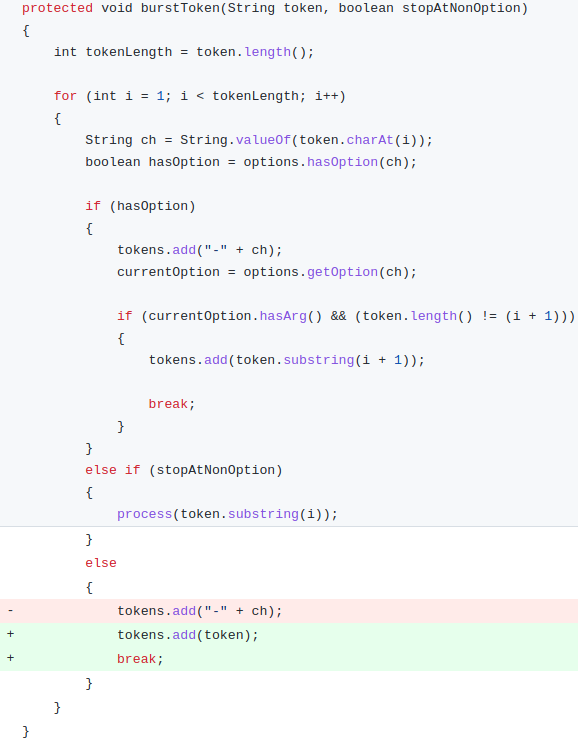
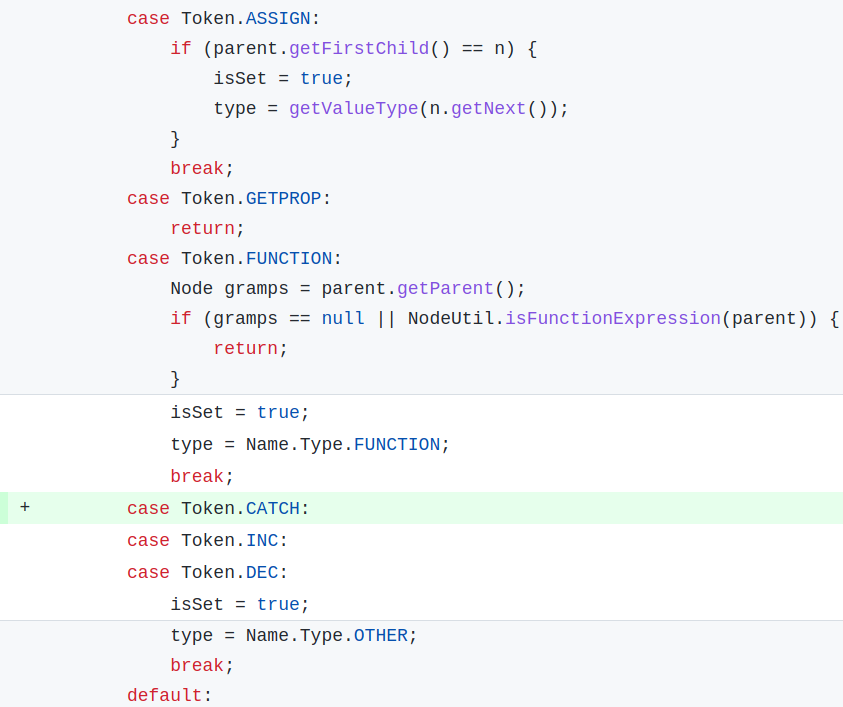
Fig 13 shows a Critical bug in Cli-2 project, which is not detected by SpotBugs and Infer because it cannot be fitted into any rule. The provided patch seems to be simple, but the bug is too complex, since it is related to a specific case where the developer should use token variable and also the break statement in the last else branch to handle a special case required by the specification.
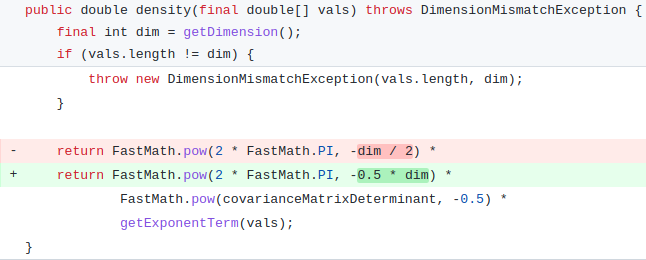
Another example is a Critical bug in the Math-11 project which is shown in Fig 14. The patch is very simple, and the buggy statement looks almost identical to the fixed statement such that it is even very hard for a human to find the issue without knowing the special values of dim variable that leads to the bug.
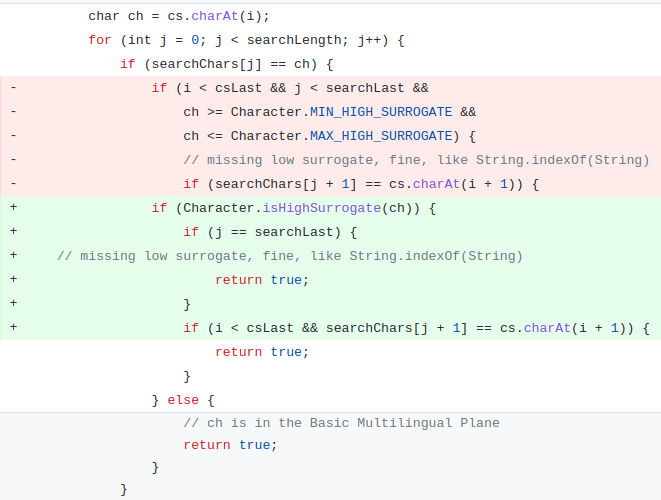
We found other severe bugs that cannot be generalized in the bug patterns such as a bug in the Math-105 project where the getSumSquaredErrors() in the buggy code returns the maximum number between the error value and zero wrongly. The patch shows that it should return the calculated error value only (there is no need for the max function). Also, Codec-18 project contains a bug where the equals method check if two provided CharSequence objects are equal. The patch shows that the developer implemented the equality condition wrongly by not considering the maximum length of these strings which are patched in the fixed version.
In all of the mentioned examples, we found that these bugs are so complex that cannot be mapped to any of the predefined patterns. Detecting these severe bugs by only leveraging the source code (even at the coarse-level granularity such as class/package/module) is almost impossible. Therefore, more sophisticated patterns need to be implemented by static analysis tools. One may also try using dynamic approaches such as testing to detect these types of bugs.
Furthermore, we found some samples when there is a specific rule for the bug in the tools, but the bug is not detected by any of the tools. For example, the buggy method in the Cli-9 project copies the values of a mapping variable (defined at the class level) to the provided argument of the method. The provided patch shows that there is a specific condition when the mapping variable is null, so the buggy method should return the provided argument instead of copying data. Although the SpotBugs tool has some predefined rules regarding the null handling of variables in the method it cannot report this method as buggy.
One possibility for this low effectiveness by static analysis tools is that since these tools are heavily used in production as a part of the development environment or building process, there is a high chance that all of these projects were scanned by these tools after each commit/release, so all bugs that can be detected by these tools have been fixed already.
By investigating the results of the SpotBugs tool to see why this tool mislabeled the severity of many bugs we found that 70 bugs are detected to have lower severity values than their actual severity value. After analyzing these samples, we found two scenarios. The first one would be samples that SpotBugs reported another bug in the buggy method than the actual bug. In the second case, Spotbugs reports the bug correctly, but it assigns the lower severity labels.
For example, the reported bug in the Math-91 project has High severity, but SpotBugs reports Low severity. The actual reported bug is due to the equality problem of two Fraction objects because of the limited precision 444https://issues.apache.org/jira/browse/MATH-252, but the SpotBugs reports the CO_COMPARETO_INCORRECT_FLOATING as the issue type which is in the BAD_PRACTICE category with the following description:
“This method compares double or float values using pattern like this: ”
Although this statement exists in the buggy method, the actual reported bug is not happening because of this statement.
Another example is the bug in the Compress-12 project where the actual reported bug is related to throwing the IllegalArgumentException instead of IOException on corrupted files 555https://issues.apache.org/jira/browse/COMPRESS-178. However, the SpotBugs reported this method containing a Low-severity bug with the I18N issue type in the DM_DEFAULT_ENCODING category with the following description:
“Found a call to a method which will perform a byte to String (or String to byte) conversion, and will assume that the default platform encoding is suitable.”
In the mentioned examples we found that SpotBugs reported a different bug with Low severity instead of the actual bug with High severity.
Conversely, there is a Major bug in the accumulo-209_397f86f6 project regarding the multi-byte character encoding 666https://github.com/bugs-dot-jar/accumulo/tree/bugs-dot-jar_ACCUMULO-209_397f86f6, and the SpotBugs reported a DM_DEFAULT_ENCODING as the issue type in I18N category with the following description:
“Found a call to a method which will perform a byte to String (or String to byte) conversion, and will assume that the default platform encoding is suitable.”
It seems that the SpotBugs has detected the bug correctly, but it assigns a low severity to it. Based on our best knowledge, SpotBugs assign the severity of the reported bugs based on their implemented patterns, so it always reports Low severity for this kind of bug. However, in practice, one specific issue may lead to a severe or non-severe bug in different cases such as the number of affected users or the project timeline.
Summary of RQ3.2 Results:
SpotBugs missed most of the studied bugs regardless of their severity value because of no matching rule for those bugs. In specific cases there are matching (almost the same) rules, however, the bugs cannot be detected accurately. Bugs are assigned different (lower) severity by SpotBugs since it detected the severity value based on the general pre-defined bug patterns, but in practice, a specific bug may have different severity values in different projects based on the number of affected users or the project timeline.
RQ3-3 Answer: By comparing the calculated SC (mentioned in 3.3.2) and the severity predicted by the SpotBugs tool we found some samples where using both of these results will be more useful.
For example, we consider the buggy method computeShiftIncrement() in the Math-87 project has High severity value. The SpotBugs tool reports the Low severity value, but the SC value shows that this method is a complex method regarding the code metrics we used. In this case, the code metric values exhibit the severity better.
Conversely, there is a buggy method named parse() in the Closure-68 project with the Medium severity value. The SC value for this buggy method is very large which shows the complexity of the method, so we may assume this is a severe bug, but the SpotBugs reports the Low severity value. In the mentioned example, the SpotBugs prediction is closer to the actual severity value than the code metric values.
The above-mentioned examples show that these two approaches focus on different aspects of bugs, so considering both of them can lead to better prediction than using only one of them.
Summary of RQ3.3 Results: Considering both code metrics and static analysis tools together may lead to better performance since they leverage different characteristics of bugs in some cases.
4 Discussion
Our results from RQ1 indicate that all of the studied code metrics have significant performance in finding the buggy methods. However, the Line of Code, Maintainable Index, FanOut, and Effort metrics have the best performance which implies the importance of these metrics to be used in the research community and also in practice to warn developers about their code complexity. However, we found no significant relationship between studied code metrics and the bug severity which means high-severity bugs may exist in the simple code or low-severity bugs may exist in the complex code. Surprisingly, the Line of Code has is the worst indicator of bug severity which indicates there is no relationship between the size of a buggy method and its severity. Our findings from this RQ suggest that developers may still avoid long and complex methods to reduce the chance of bugs, but they may expect severe bugs even in the simple method with few line of codes.
Our RQ2 results show that studied static analysis tools (SpotBugs and Infer) can detect neither the buggy methods nor their severity. However, since these tools are used extensively in practice, many of the detected bugs may have been fixed soon during the development process by developers already. Our results imply that they are not practical in case of real complex problems, and there is a potential gap for the research community and the developers to study and provide more complex bug patterns or a combination of different approaches to detect real bugs. Furthermore, the reported severity values by SpotBugs show that it mislabels many of the severe bugs which reduces the usability of this tool in finding the bug severity, so this implies that the implemented approach by this tool, which is assigning the predefined severity value based on the bug pattern, is not practical and different conditions should be considered in determining the severity of a specific bug.
The results from RQ3 show that Security bugs have high severity in most cases while the Edge/Boundary bugs have low severity. We found that the bug type is a better indication of the bug severity in contrast to the bug complexity. Also, we found that SpotBugs tool does not have enough bug patterns to predict many of our studied severe bugs while it predicts lower severity values in most of the cases. However, we found that source code metrics and static analysis tools leverage different characteristics of the bugs, so leveraging both of them is more helpful.
Our findings can be used by the research community and the developers, so that they leverage other code metrics to see their capability in finding bug severity, or perhaps other combinations of several code metrics may be found more useful. Also, our findings can be used for improving the quality of static analysis tools, especially in the case of the studied missed bugs. Developers should insist on writing simple methods to prevent bugs, but they may consider different conditions (the potential consequences on the overall system such as leaking sensitive information or crashing the whole system) during the development phase in order to reduce the risk of having high-severity bugs.
5 Threats to Validity
Similar to any empirical study there are some threats that may impact our results, so in this section, we provide possible threats and our actions to mitigate these threats.
5.1 External Validity
Our selected projects may not be consistent with the closed-source projects or may not cover various software domains or other programming languages. We did our best to select two large and popular datasets containing real-world bugs of a diverse set of open-source projects which have been used in many studies martinez2017automatic ; shamshiri2015automatically ; pearson2017evaluating ; saha2017elixir . The next threat would be the selection of static analysis tools, and for mitigating this problem we used the most popular tools which are used in practice and state-of-the-art research. We exclude Google Error Prone from the list of our tools since we found that it is not possible to handle older Java versions (exist in our dataset) with the latest versions of this tool. Also, the selected code metrics may not reveal the potential of all available code metrics in finding bug severity and this may impact our result generalizability, but to mitigate this issue we tried to leverage as many as available method-level code metrics that are used in previous research for defect-related problems (e.g, defect prediction).
5.2 Internal Validity
Another threat would be our strategy in selecting the buggy methods since we selected all methods that are changed/removed during the bug fixing patch as a buggy method which is a common approach in the state-of-the-art approaches (referenced in 2.1). The reason behind this is that bug fixing usually requires changing multiple methods and specifying one single method to be the source of a bug requires other information such as a bug report description. For mitigating this threat we consider each of those methods as an independent sample, so code metrics and static analysis tools can consider them independently. The next threat is the method of identifying reported bugs by static analyzers’ tools. In this study, we consider the tools’ report at the method-level granularity without considering the exact reported lines by these tools. We did this because there is no information regarding the exact bug location (line) in our datasets, and we want to keep the same method-granularity for RQ1 and RQ2. In order to mitigate this threat whenever any of our tools report a bug inside the method, we count it as a correct detection to not underestimate the tools’ performance.
5.3 Construct Validity
When calculating the sum complexity for answering RQ3-1, we have provided the same weight to all the different code metrics. These can be inaccurate because some code metrics can be more important than others. Through our manual observation, however, we found that a more complex method based on the sum complexity has higher complexity values for all the code metrics than a less complex method.
5.4 Conclusion Validity
Despite the efforts made though, these results may not be generalized using other tools and datasets. Our results of static analysis tools may be affected by using projects that have already applied the studied static analyzer tools warnings during the software development life cycle. Since it is not easy to understand if it happened, our results should be considered as an assessment of those bugs that are not already fixed by tools. Our selection of code metrics may not be sufficient to expose the bug severity, but for mitigating this issue we considered the 10 popular metrics which have established performance in finding bugs in our study.
6 Related Work
There has been much research in the bug-prediction field by focusing on different aspects using diverse granularity levels and various techniques hall2011systematic ; hosseini2017systematic ; wahono2015systematic ; li2020systematic . Previous studies can be categorized from different aspects such as working on the characteristics of source code khomh2012exploratory ; palomba2018diffuseness ; bacchelli2010popular ; bavota2012does ; pai2007empirical ; spadini2018relation ; rahman2019source or the bug description sun2019bug ; wang2010detect ; khatiwada2018just . From the source code granularity aspect, there has been research in file level zimmermann2007predicting ; giger2011comparing , package level zimmermann2007predicting , class level shivaji2009reducing , and method level giger2012method . For bug severity prediction task, almost all of the existing works have leveraged bug report using natural language techniques or different classic and deep neural network models. In the rest of this section, we briefly discuss the related work on generic bug prediction, bug severity prediction, and static analysis tools.
6.1 Bug Prediction
Bug prediction studies have used different code metrics such as LOC pascarella2020performance ; antinyan2014identifying ; shin2010evaluating ; chowdhury:2022 , McCabe antinyan2014identifying , Halstead metrics antinyan2017evaluating , C&K metrics subramanyam2003empirical ; jureczko2010using . Code metrics have been applied on different granularity levels such as package/class level Okutan:2014 ; Koru:2005 ; zimmermann2007predicting , method level pascarella2020performance ; giger2012method ; ferenc:2020 ; chowdhury:2022 ; grund2021codeshovel ; Mo:2022 , and line level wattanakriengkrai2020predicting . One major problem with the high granularity levels (package/class) is that they are practically less helpful for the developers giger2012method ; pascarella2020performance since it requires significant effort to locate bugs at the package/class components. Unfortunately, line-level granularity can suffer from too many false positives, because multiple lines can be similar just by chance Daniela:2014 ; Francisco:2017 . Consequently, method level granularity has been the new focus to the community pascarella2020performance ; giger2012method ; ferenc:2020 ; chowdhury:2022 ; grund2021codeshovel ; Mo:2022 , especially for developing bug prediction models, and several studies show positive and encouraging results giger2012method ; ferenc:2020 ; Mo:2022 .
6.2 Bug Severity Prediction
Tian et al. tian2012information leveraged bug reports and their severity labels in the past to recommend fine-grained severity labels for newly reported bugs by measuring the similarity between bug reports and using nearest neighbors classification. The authors improved the f-measure of the state-of-the-art approach significantly. Ramay et al ramay2019deep proposed an approach by using a deep learning model, natural language techniques, and emotion analysis by using bug reports for predicting bug severity. They mentioned that this method improved the f-measure of state-of-the-art approaches by 7.90% on average. Lamkanfi et al zhang2016towards proposed the bug triage and bug severity prediction using Topic Modeling. Their evaluation of 30,000 bug reports extracted from Eclipse, Mozilla, and Netbeans projects shows the effectiveness of their approach in predicting severity. Tan et al tan2020bug leveraged question-and-answer pairs from Stack Overflow and combine them with related bug reports to make an enhanced version of the bug reports. They predict the severity of bug reports using different machine learning models which led to improvements by approximately 23% of the average f-measure.
6.3 Static Analysis Tools
Various research has been done to evaluate the true effectiveness of various static analysis tools for bug detection tasks. Some researchers leveraged these tools as an oracle for their own provided techniques. For example, Tomassi tomassi2018bugs used SpotBugs and ErrorProne to detect bugs in the BugSwarm dataset, and they found that these tools are not effective in finding the bugs since their results show only one successful bug detection by SpotBugs. Ayewah et al. ayewah2007using leveraged FindBugs for finding bugs in Google’s internal code-base, and they found that integrating this tool into Google’s Mondrian code review system would help developers see the potential bug existence in the code. Habib and Pradel habib2018many studied SpotBugs, Infer, and Google Error Prone tools to find their capabilities in detecting java real bugs. They concluded that these tools are mostly complementary to each other, and they miss the large majority of the bugs. Dura et al. dura2021javadl introduced the JavaDL which is a Datalog-based declarative specification language for bug pattern detection in Java code, and compare it against the SpotBugs and ErrorProne tools. Authors found that JavaDL has comparable performance to these tools. Habib and Pradel habib2019neural proposed a method to consider bug detection as a classification problem by using the neural networks and using Google Error Prone as an oracle.
To the best of our knowledge, none of the previous studies have investigated the relationship between various popular code metrics and bug severity in method-level granularity, nor the effectiveness of static analysis tools for bug severity detection.
7 Conclusion and Future Work
Detecting and fixing bugs are among the main maintenance activities in the software life cycle. However, among many bugs that potentially exist in the code the high severity ones are in great interest for the developers since their consequences are the most. Unfortunately, most existing studies in defect detection take all bugs the same and ignore their severity. In this paper, we studied 10 source code metrics and two static analysis tools, as common methods for predicting buggy code, to find their capability in estimating the bugs’ severity levels. Our quantitative and qualitative studies on Defects4J and Bugs.jar datasets containing 3,358 buggy methods from 19 projects of Java open-source projects, showed that code metrics are good indicators of buggyness (Line of Code, Maintainable Index, Fan-out, and Effort are the best metrics), but neither code metrics nor static analysis tools are significant estimators of bugs severity. We found that there is no relationship between the code complexity and bug severity, and static analysis tools miss many bugs due to the lack of complex defined patterns.
Manual inspection of severe bugs reveals that the Security and Edge/Boundary bug types have high and low severity in most cases, respectively. Finally, we showed that code metrics and static analysis tools leveraged different characteristics of the code, so they can be complementary to predict the bug severity.
Potential future directions of this research are studying the power of dynamic analysis and testing in estimating bug severity. In addition, one can use the findings of this study regarding static analysis tools limitations and try to enrich their rule sets to better identify severe bugs.
References
- (1) Errorprone. URL https://errorprone.info/. [Online; accessed 20-April-2022
- (2) Findbugs. URL http://findbugs.sourceforge.net/. [Online; accessed 20-April-2022]
- (3) Infer. URL https://fbinfer.com/. [Online; accessed 20-April-2022]
- (4) Macroaverage. URL https://scikit-learn.org/stable/modules/generated/sklearn.metrics.f1_score.html. [Online; accessed 20-April-2022]
- (5) Robustscaler. URL https://scikit-learn.org/stable/modules/generated/sklearn.preprocessing.RobustScaler.html. [Online; accessed 20-April-2022]
- (6) Spotbugs. URL https://spotbugs.github.io/. [Online; accessed 20-April-2022]
- (7) Visual studio3. URL https://docs.microsoft.com/en-us/visualstudio/code-quality/code-metrics-maintainability-index-range-and-meaning?view=vs-2022&viewFallbackFrom=vs-2022%3A. [Online; accessed 20-April-2022]
- (8) Alenezi, M., Akour, M., Al Sghaier, H.: The impact of co-evolution of code production and test suites through software releases in open source software systems. International Journal of Innovative Technology and Exploring Engineering (IJITEE) 9(1), 2737–2739 (2019)
- (9) AlOmar, E.A., Mkaouer, M.W., Ouni, A., Kessentini, M.: On the impact of refactoring on the relationship between quality attributes and design metrics. In: 2019 ACM/IEEE International Symposium on Empirical Software Engineering and Measurement (ESEM), pp. 1–11. IEEE (2019)
- (10) Aniche, M.F., Oliva, G.A., Gerosa, M.A.: What do the asserts in a unit test tell us about code quality? a study on open source and industrial projects. In: 2013 17th European Conference on Software Maintenance and Reengineering, pp. 111–120. IEEE (2013)
- (11) Antinyan, V., Staron, M., Meding, W., Österström, P., Wikstrom, E., Wranker, J., Henriksson, A., Hansson, J.: Identifying risky areas of software code in agile/lean software development: An industrial experience report. In: 2014 Software Evolution Week-IEEE Conference on Software Maintenance, Reengineering, and Reverse Engineering (CSMR-WCRE), pp. 154–163. IEEE (2014)
- (12) Antinyan, V., Staron, M., Sandberg, A.: Evaluating code complexity triggers, use of complexity measures and the influence of code complexity on maintenance time. Empirical Software Engineering 22(6), 3057–3087 (2017)
- (13) Ayewah, N., Pugh, W., Morgenthaler, J.D., Penix, J., Zhou, Y.: Using findbugs on production software. In: Companion to the 22nd ACM SIGPLAN conference on Object-oriented programming systems and applications companion, pp. 805–806 (2007)
- (14) Bacchelli, A., Bird, C.: Expectations, outcomes, and challenges of modern code review. In: 2013 35th International Conference on Software Engineering (ICSE), pp. 712–721. IEEE (2013)
- (15) Bacchelli, A., D’Ambros, M., Lanza, M.: Are popular classes more defect prone? In: International Conference on Fundamental Approaches to Software Engineering, pp. 59–73. Springer (2010)
- (16) Bavota, G., De Carluccio, B., De Lucia, A., Di Penta, M., Oliveto, R., Strollo, O.: When does a refactoring induce bugs? an empirical study. In: 2012 IEEE 12th International Working Conference on Source Code Analysis and Manipulation, pp. 104–113. IEEE (2012)
- (17) Bennett, K.H., Rajlich, V.T.: Software maintenance and evolution: a roadmap. In: Proceedings of the Conference on the Future of Software Engineering, pp. 73–87 (2000)
- (18) Bhat, T., Nagappan, N.: Evaluating the efficacy of test-driven development: industrial case studies. In: Proceedings of the 2006 ACM/IEEE international symposium on Empirical software engineering, pp. 356–363 (2006)
- (19) Börstler, J., Paech, B.: The role of method chains and comments in software readability and comprehension—an experiment. IEEE Transactions on Software Engineering 42(9), 886–898 (2016)
- (20) Buse, R.P., Weimer, W.R.: Learning a metric for code readability. IEEE Transactions on software engineering 36(4), 546–558 (2009)
- (21) Chaturvedi, K.K., Singh, V.: Determining bug severity using machine learning techniques. In: 2012 CSI sixth international conference on software engineering (CONSEG), pp. 1–6. IEEE (2012)
- (22) Chowdhury, S., Uddin, G., Holmes, R.: An empirical study on maintainable method size in java. In: 19th International Conference on Mining Software Repositories (2022)
- (23) Curtis, B., Sheppard, S.B., Milliman, P., Borst, M., Love, T.: Measuring the psychological complexity of software maintenance tasks with the halstead and mccabe metrics. IEEE Transactions on software engineering (2), 96–104 (1979)
- (24) Dura, A., Reichenbach, C., Söderberg, E.: Javadl: automatically incrementalizing java bug pattern detection. Proceedings of the ACM on Programming Languages 5(OOPSLA), 1–31 (2021)
- (25) El Emam, K., Benlarbi, S., Goel, N., Rai, S.N.: The confounding effect of class size on the validity of object-oriented metrics. IEEE Transactions on Software Engineering 27(7), 630–650 (2001)
- (26) Ferenc, R., Bán, D., Grósz, T., Gyimóthy, T.: Deep learning in static, metric-based bug prediction. Array 6, 100021 (2020)
- (27) Ferenc, R., Gyimesi, P., Gyimesi, G., Tóth, Z., Gyimóthy, T.: An automatically created novel bug dataset and its validation in bug prediction. The Journal of systems and software 169, 110691 (2020)
- (28) Giger, E., D’Ambros, M., Pinzger, M., Gall, H.C.: Method-level bug prediction. In: Proceedings of the 2012 ACM-IEEE International Symposium on Empirical Software Engineering and Measurement, pp. 171–180. IEEE (2012)
- (29) Giger, E., Pinzger, M., Gall, H.C.: Comparing fine-grained source code changes and code churn for bug prediction. In: Proceedings of the 8th Working Conference on Mining Software Repositories, pp. 83–92 (2011)
- (30) Gil, Y., Lalouche, G.: On the correlation between size and metric validity. Empirical Software Engineering 22(5), 2585–2611 (2017)
- (31) Grund, F., Chowdhury, S., Bradley, N.C., Hall, B., Holmes, R.: Codeshovel: Constructing method-level source code histories. In: 2021 IEEE/ACM 43rd International Conference on Software Engineering (ICSE), pp. 1510–1522. IEEE (2021)
- (32) Habib, A., Pradel, M.: How many of all bugs do we find? a study of static bug detectors. In: 2018 33rd IEEE/ACM International Conference on Automated Software Engineering (ASE), pp. 317–328. IEEE (2018)
- (33) Habib, A., Pradel, M.: Neural bug finding: A study of opportunities and challenges. arXiv preprint arXiv:1906.00307 (2019)
- (34) Hall, T., Beecham, S., Bowes, D., Gray, D., Counsell, S.: A systematic literature review on fault prediction performance in software engineering. IEEE Transactions on Software Engineering 38(6), 1276–1304 (2011)
- (35) Halstead, M.H.: Elements of Software Science (Operating and programming systems series). Elsevier Science Inc. (1977)
- (36) Hata, H., Mizuno, O., Kikuno, T.: Bug prediction based on fine-grained module histories. In: 2012 34th international conference on software engineering (ICSE), pp. 200–210. IEEE (2012)
- (37) Hemmati, H.: How effective are code coverage criteria? In: 2015 IEEE International Conference on Software Quality, Reliability and Security, pp. 151–156. IEEE (2015)
- (38) Herzig, K., Zeller, A.: The impact of tangled code changes. In: 2013 10th Working Conference on Mining Software Repositories, pp. 121–130 (2013)
- (39) Hess, M.R., Kromrey, J.D.: Robust confidence intervals for effect sizes: A comparative study of cohen’sd and cliff’s delta under non-normality and heterogeneous variances. In: annual meeting of the American Educational Research Association, vol. 1. Citeseer (2004)
- (40) Hindle, A., Godfrey, M.W., Holt, R.C.: Reading beside the lines: Indentation as a proxy for complexity metric. In: 2008 16th IEEE International Conference on Program Comprehension, pp. 133–142. IEEE (2008)
- (41) Hosseini, S., Turhan, B., Gunarathna, D.: A systematic literature review and meta-analysis on cross project defect prediction. IEEE Transactions on Software Engineering 45(2), 111–147 (2017)
- (42) Jureczko, M., Spinellis, D.: Using object-oriented design metrics to predict software defects. Models and Methods of System Dependability. Oficyna Wydawnicza Politechniki Wrocławskiej pp. 69–81 (2010)
- (43) Just, R., Jalali, D., Ernst, M.D.: Defects4j: A database of existing faults to enable controlled testing studies for java programs. In: Proceedings of the 2014 International Symposium on Software Testing and Analysis, pp. 437–440 (2014)
- (44) Kafura, D., Reddy, G.R.: The use of software complexity metrics in software maintenance. IEEE Transactions on Software Engineering (3), 335–343 (1987)
- (45) Kanwal, J., Maqbool, O.: Bug prioritization to facilitate bug report triage. Journal of Computer Science and Technology 27(2), 397–412 (2012)
- (46) Kasto, N., Whalley, J.: Measuring the difficulty of code comprehension tasks using software metrics. In: Proceedings of the Fifteenth Australasian Computing Education Conference-Volume 136, pp. 59–65 (2013)
- (47) Khatiwada, S., Tushev, M., Mahmoud, A.: Just enough semantics: An information theoretic approach for ir-based software bug localization. Information and Software Technology 93, 45–57 (2018)
- (48) Khomh, F., Penta, M.D., Guéhéneuc, Y.G., Antoniol, G.: An exploratory study of the impact of antipatterns on class change-and fault-proneness. Empirical Software Engineering 17(3), 243–275 (2012)
- (49) Kondo, M., German, D.M., Mizuno, O., Choi, E.H.: The impact of context metrics on just-in-time defect prediction. Empirical Software Engineering 25(1), 890–939 (2020)
- (50) Kononenko, O., Baysal, O., Godfrey, M.W.: Code review quality: How developers see it. In: Proceedings of the 38th international conference on software engineering, pp. 1028–1038 (2016)
- (51) Koru, A., Liu, H.: Building effective defect-prediction models in practice. IEEE Software 22(6), 23–29 (2005)
- (52) Landman, D., Serebrenik, A., Vinju, J.: Empirical analysis of the relationship between cc and sloc in a large corpus of java methods. In: 2014 IEEE International Conference on Software Maintenance and Evolution, pp. 221–230. IEEE (2014)
- (53) Le Goues, C., Nguyen, T., Forrest, S., Weimer, W.: Genprog: A generic method for automatic software repair. Ieee transactions on software engineering 38(1), 54–72 (2011)
- (54) Li, N., Shepperd, M., Guo, Y.: A systematic review of unsupervised learning techniques for software defect prediction. Information and Software Technology 122, 106287 (2020)
- (55) Long, F., Rinard, M.: Automatic patch generation by learning correct code. In: Proceedings of the 43rd Annual ACM SIGPLAN-SIGACT Symposium on Principles of Programming Languages, pp. 298–312 (2016)
- (56) Mäntylä, M.V., Lassenius, C.: What types of defects are really discovered in code reviews? IEEE Transactions on Software Engineering 35(3), 430–448 (2008)
- (57) Martin, R.C.: Professionalism and test-driven development. Ieee Software 24(3), 32–36 (2007)
- (58) Martinez, M., Durieux, T., Sommerard, R., Xuan, J., Monperrus, M.: Automatic repair of real bugs in java: A large-scale experiment on the defects4j dataset. Empirical Software Engineering 22(4), 1936–1964 (2017)
- (59) Mashhadi, E., Hemmati, H.: Applying codebert for automated program repair of java simple bugs. In: 2021 IEEE/ACM 18th International Conference on Mining Software Repositories (MSR), pp. 505–509. IEEE (2021)
- (60) Matter, D., Kuhn, A., Nierstrasz, O.: Assigning bug reports using a vocabulary-based expertise model of developers. In: 2009 6th IEEE International Working Conference on Mining Software Repositories, pp. 131–140 (2009)
- (61) McCabe, T.J.: A complexity measure. IEEE Transactions on software Engineering (4), 308–320 (1976)
- (62) McClure, C.L.: A model for program complexity analysis. In: Proceedings of the 3rd international conference on Software engineering, pp. 149–157 (1978)
- (63) Miles, M.B., Huberman, A.M.: Qualitative data analysis: An expanded sourcebook. sage (1994)
- (64) Mo, R., Cai, Y., Kazman, R., Xiao, L., Feng, Q.: Decoupling level: a new metric for architectural maintenance complexity. In: 2016 IEEE/ACM 38th International Conference on Software Engineering (ICSE), pp. 499–510. IEEE (2016)
- (65) Mo, R., Wei, S., Feng, Q., Li, Z.: An exploratory study of bug prediction at the method level. Information and software technology 144, 106794 (2022)
- (66) Nawrocki, J., Wojciechowski, A.: Experimental evaluation of pair programming. European Software Control and Metrics (Escom) pp. 99–101 (2001)
- (67) Neysiani, B.S., Babamir, S.M., Aritsugi, M.: Efficient feature extraction model for validation performance improvement of duplicate bug report detection in software bug triage systems. Information and Software Technology 126, 106344 (2020)
- (68) Okutan, A., Yıldız, O.T.: Software defect prediction using bayesian networks. Empirical software engineering : an international journal 19(1), 154–181 (2014)
- (69) Oman, P., Hagemeister, J.: Metrics for assessing a software system’s maintainability. In: Proceedings Conference on Software Maintenance 1992, pp. 337–338. IEEE Computer Society (1992)
- (70) Pai, G.J., Dugan, J.B.: Empirical analysis of software fault content and fault proneness using bayesian methods. IEEE Transactions on software Engineering 33(10), 675–686 (2007)
- (71) Palomba, F., Bavota, G., Penta, M.D., Fasano, F., Oliveto, R., Lucia, A.D.: On the diffuseness and the impact on maintainability of code smells: a large scale empirical investigation. Empirical Software Engineering 23(3), 1188–1221 (2018)
- (72) Pantiuchina, J., Lanza, M., Bavota, G.: Improving code: The (mis) perception of quality metrics. In: 2018 IEEE International Conference on Software Maintenance and Evolution (ICSME), pp. 80–91. IEEE (2018)
- (73) Pascarella, L., Palomba, F., Bacchelli, A.: On the performance of method-level bug prediction: A negative result. Journal of Systems and Software 161, 110493 (2020)
- (74) Pearson, S., Campos, J., Just, R., Fraser, G., Abreu, R., Ernst, M.D., Pang, D., Keller, B.: Evaluating and improving fault localization. In: 2017 IEEE/ACM 39th International Conference on Software Engineering (ICSE), pp. 609–620. IEEE (2017)
- (75) Pecorelli, F., Palomba, F., Di Nucci, D., De Lucia, A.: Comparing heuristic and machine learning approaches for metric-based code smell detection. In: 2019 IEEE/ACM 27th International Conference on Program Comprehension (ICPC), pp. 93–104. IEEE (2019)
- (76) Polo, M., Piattini, M., Ruiz, F.: Using code metrics to predict maintenance of legacy programs: A case study. In: Proceedings IEEE International Conference on Software Maintenance. ICSM 2001, pp. 202–208. IEEE (2001)
- (77) Posnett, D., Hindle, A., Devanbu, P.: A simpler model of software readability. In: Proceedings of the 8th working conference on mining software repositories, pp. 73–82 (2011)
- (78) Rafique, Y., Mišić, V.B.: The effects of test-driven development on external quality and productivity: A meta-analysis. IEEE Transactions on Software Engineering 39(6), 835–856 (2012)
- (79) Rahman, A., Williams, L.: Source code properties of defective infrastructure as code scripts. Information and Software Technology 112, 148–163 (2019)
- (80) Ralph, P., Tempero, E.: Construct validity in software engineering research and software metrics. In: Proceedings of the 22nd International Conference on Evaluation and Assessment in Software Engineering 2018, pp. 13–23 (2018)
- (81) Ramay, W.Y., Umer, Q., Yin, X.C., Zhu, C., Illahi, I.: Deep neural network-based severity prediction of bug reports. IEEE Access 7, 46846–46857 (2019)
- (82) Saha, R.K., Khurshid, S., Perry, D.E.: An empirical study of long lived bugs. In: 2014 Software Evolution Week-IEEE Conference on Software Maintenance, Reengineering, and Reverse Engineering (CSMR-WCRE), pp. 144–153. IEEE (2014)
- (83) Saha, R.K., Lyu, Y., Lam, W., Yoshida, H., Prasad, M.R.: Bugs. jar: a large-scale, diverse dataset of real-world java bugs. In: Proceedings of the 15th international conference on mining software repositories, pp. 10–13 (2018)
- (84) Saha, R.K., Lyu, Y., Yoshida, H., Prasad, M.R.: Elixir: Effective object-oriented program repair. In: 2017 32nd IEEE/ACM International Conference on Automated Software Engineering (ASE), pp. 648–659. IEEE (2017)
- (85) Servant, F., Jones, J.A.: Fuzzy fine-grained code-history analysis. In: Proceedings of the International Conference on Software Engineering (ICSE), pp. 746–757 (2017)
- (86) Shamshiri, S., Just, R., Rojas, J.M., Fraser, G., McMinn, P., Arcuri, A.: Do automatically generated unit tests find real faults? an empirical study of effectiveness and challenges (t). In: 2015 30th IEEE/ACM International Conference on Automated Software Engineering (ASE), pp. 201–211. IEEE (2015)
- (87) Shaphiro, S., Wilk, M.: An analysis of variance test for normality. Biometrika 52(3), 591–611 (1965)
- (88) Shihab, E., Hassan, A.E., Adams, B., Jiang, Z.M.: An industrial study on the risk of software changes. In: Proceedings of the ACM SIGSOFT 20th International Symposium on the Foundations of Software Engineering, pp. 1–11 (2012)
- (89) Shin, Y., Meneely, A., Williams, L., Osborne, J.A.: Evaluating complexity, code churn, and developer activity metrics as indicators of software vulnerabilities. IEEE transactions on software engineering 37(6), 772–787 (2010)
- (90) Shivaji, S., Whitehead, E.J., Akella, R., Kim, S.: Reducing features to improve bug prediction. In: 2009 IEEE/ACM International Conference on Automated Software Engineering, pp. 600–604. IEEE (2009)
- (91) Sjøberg, D.I.K., Yamashita, A., Anda, B.C.D., Mockus, A., Dybå, T.: Quantifying the effect of code smells on maintenance effort. IEEE Transactions on Software Engineering 39(8), 1144–1156 (2013)
- (92) Spadini, D., Palomba, F., Zaidman, A., Bruntink, M., Bacchelli, A.: On the relation of test smells to software code quality. In: 2018 IEEE international conference on software maintenance and evolution (ICSME), pp. 1–12. IEEE (2018)
- (93) Steidl, D., Hummel, B., Juergens, E.: Incremental origin analysis of source code files. In: Proceedings Working Conference on Mining Software Repositories (MSR), pp. 42 – 51 (2014)
- (94) Subramanyam, R., Krishnan, M.S.: Empirical analysis of ck metrics for object-oriented design complexity: Implications for software defects. IEEE Transactions on software engineering 29(4), 297–310 (2003)
- (95) Sun, W., Marakas, G., Aguirre-Urreta, M.: The effectiveness of pair programming: Software professionals’ perceptions. IEEE Software 33(4), 72–79 (2015)
- (96) Sun, X., Zhou, W., Li, B., Ni, Z., Lu, J.: Bug localization for version issues with defect patterns. IEEE Access 7, 18811–18820 (2019)
- (97) Tan, Y., Xu, S., Wang, Z., Zhang, T., Xu, Z., Luo, X.: Bug severity prediction using question-and-answer pairs from stack overflow. Journal of Systems and Software 165, 110567 (2020)
- (98) Tian, Y., Lo, D., Sun, C.: Information retrieval based nearest neighbor classification for fine-grained bug severity prediction. In: 2012 19th Working Conference on Reverse Engineering, pp. 215–224. IEEE (2012)
- (99) Tomassi, D.A.: Bugs in the wild: examining the effectiveness of static analyzers at finding real-world bugs. In: Proceedings of the 2018 26th ACM Joint Meeting on European Software Engineering Conference and Symposium on the Foundations of Software Engineering, pp. 980–982 (2018)
- (100) Tosun, A., Bener, A., Turhan, B., Menzies, T.: Practical considerations in deploying statistical methods for defect prediction: A case study within the turkish telecommunications industry. Information and Software Technology 52(11), 1242–1257 (2010)
- (101) Tufano, M., Palomba, F., Bavota, G., Oliveto, R., Di Penta, M., De Lucia, A., Poshyvanyk, D.: When and why your code starts to smell bad. In: 2015 IEEE/ACM 37th IEEE International Conference on Software Engineering, vol. 1, pp. 403–414. IEEE (2015)
- (102) Uddin, J., Ghazali, R., Deris, M.M., Naseem, R., Shah, H.: A survey on bug prioritization. Artificial Intelligence Review 47(2), 145–180 (2017)
- (103) Vucevic, D., Yaddow, W.: Testing the data warehouse practicum: Assuring data content, data structures and quality. Trafford Publishing (2012)
- (104) Wahono, R.S.: A systematic literature review of software defect prediction. Journal of software engineering 1(1), 1–16 (2015)
- (105) Wang, D., Lin, M., Zhang, H., Hu, H.: Detect related bugs from source code using bug information. In: 2010 IEEE 34th Annual Computer Software and Applications Conference, pp. 228–237. IEEE (2010)
- (106) Wang, Q., Xia, X., Lo, D., Li, S.: Why is my code change abandoned? Information and Software Technology 110, 108 – 120 (2019)
- (107) Watson, A.H., Wallace, D.R., McCabe, T.J.: Structured testing: A testing methodology using the cyclomatic complexity metric, vol. 500. US Department of Commerce, Technology Administration, National Institute of … (1996)
- (108) Wattanakriengkrai, S., Thongtanunam, P., Tantithamthavorn, C., Hata, H., Matsumoto, K.: Predicting defective lines using a model-agnostic technique. arXiv preprint arXiv:2009.03612 (2020)
- (109) Williams, L., Kessler, R.R., Cunningham, W., Jeffries, R.: Strengthening the case for pair programming. IEEE software 17(4), 19–25 (2000)
- (110) Wong, W.E., Gao, R., Li, Y., Abreu, R., Wotawa, F.: A survey on software fault localization. IEEE Transactions on Software Engineering 42(8), 707–740 (2016)
- (111) Zaw, K.K., Hnin, H.W., Kyaw, K.Y., Funabiki, N.: Software quality metrics calculations for java programming learning assistant system. In: 2020 IEEE Conference on Computer Applications (ICCA), pp. 1–6. IEEE (2020)
- (112) Zhang, T., Chen, J., Yang, G., Lee, B., Luo, X.: Towards more accurate severity prediction and fixer recommendation of software bugs. Journal of Systems and Software 117, 166–184 (2016)
- (113) Zhou, Y., Xu, B., Leung, H.: On the ability of complexity metrics to predict fault-prone classes in object-oriented systems. Journal of Systems and Software 83(4), 660–674 (2010)
- (114) Zimmermann, T., Premraj, R., Zeller, A.: Predicting defects for eclipse. In: Third International Workshop on Predictor Models in Software Engineering (PROMISE’07: ICSE Workshops 2007), pp. 9–9. IEEE (2007)