Supplementary information for ”Converse magneto-photostrictive effect and its coefficient in extrinsic multiferroics.”
Matthieu Liparo
Univ. Brest, Laboratoire d’Optique et de Magnétisme (OPTIMAG), EA 938, 29200 Brest, France
Cr Research Group, Department of Physics, University of Johannesburg, PO Box 524, Auckland Park 2006, South Africa
Jean-Philippe Jay
Matthieu Dubreuil
Univ. Brest, Laboratoire d’Optique et de Magnétisme (OPTIMAG), EA 938, 29200 Brest, France
Gaëlle Simon
Univ. Brest, Service général des plateformes technologiques, Service RMN-RPE, 29200 Brest, France
Alain Fessant
Univ. Brest, Laboratoire d’Optique et de Magnétisme (OPTIMAG), EA 938, 29200 Brest, France
Walaa Jahjah
Yann Le Grand
Univ. Brest, Laboratoire d’Optique et de Magnétisme (OPTIMAG), EA 938, 29200 Brest, France
Charles Sheppard
Aletta R. E. Prinsloo
Cr Research Group, Department of Physics, University of Johannesburg, PO Box 524, Auckland Park 2006, South Africa
Vincent Vlaminck
Vincent Castel
Loic Temdie-Kom
Guillaume Bourcin
IMT-Atlantique, Campus de Brest, Département Micro-Ondes, Technopole Brest-Iroise, CS83818, 29238 Brest Cedex 03, France
David Spenato
Univ. Brest, Laboratoire d’Optique et de Magnétisme (OPTIMAG), EA 938, 29200 Brest, France
David T. Dekadjevi
Univ. Brest, Laboratoire d’Optique et de Magnétisme (OPTIMAG), EA 938, 29200 Brest, France
Cr Research Group, Department of Physics, University of Johannesburg, PO Box 524, Auckland Park 2006, South Africa
david.dekadjevi@univ-brest.fr
(February 27, 2024)
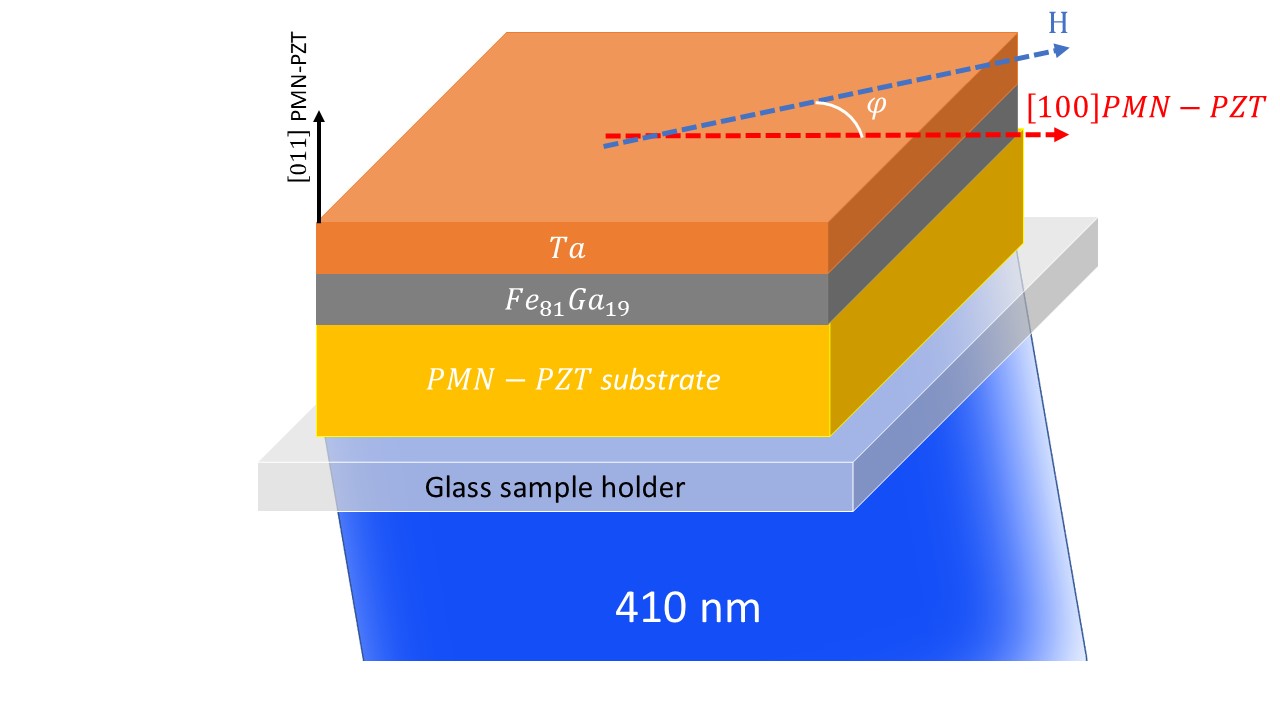
Figure S1 shows a scheme of the experimental set-up for static measurements.
Figure 1: Schematic drawing of the ME composite consisting of the magnetostrictive FeGa and the (011)-oriented PMN-PZT substrate. The configuration of measurement is also indicated using , the angle between the applied magnetic field (dashed blue axis) and the [100] direction of the substrate (dashed red axis).
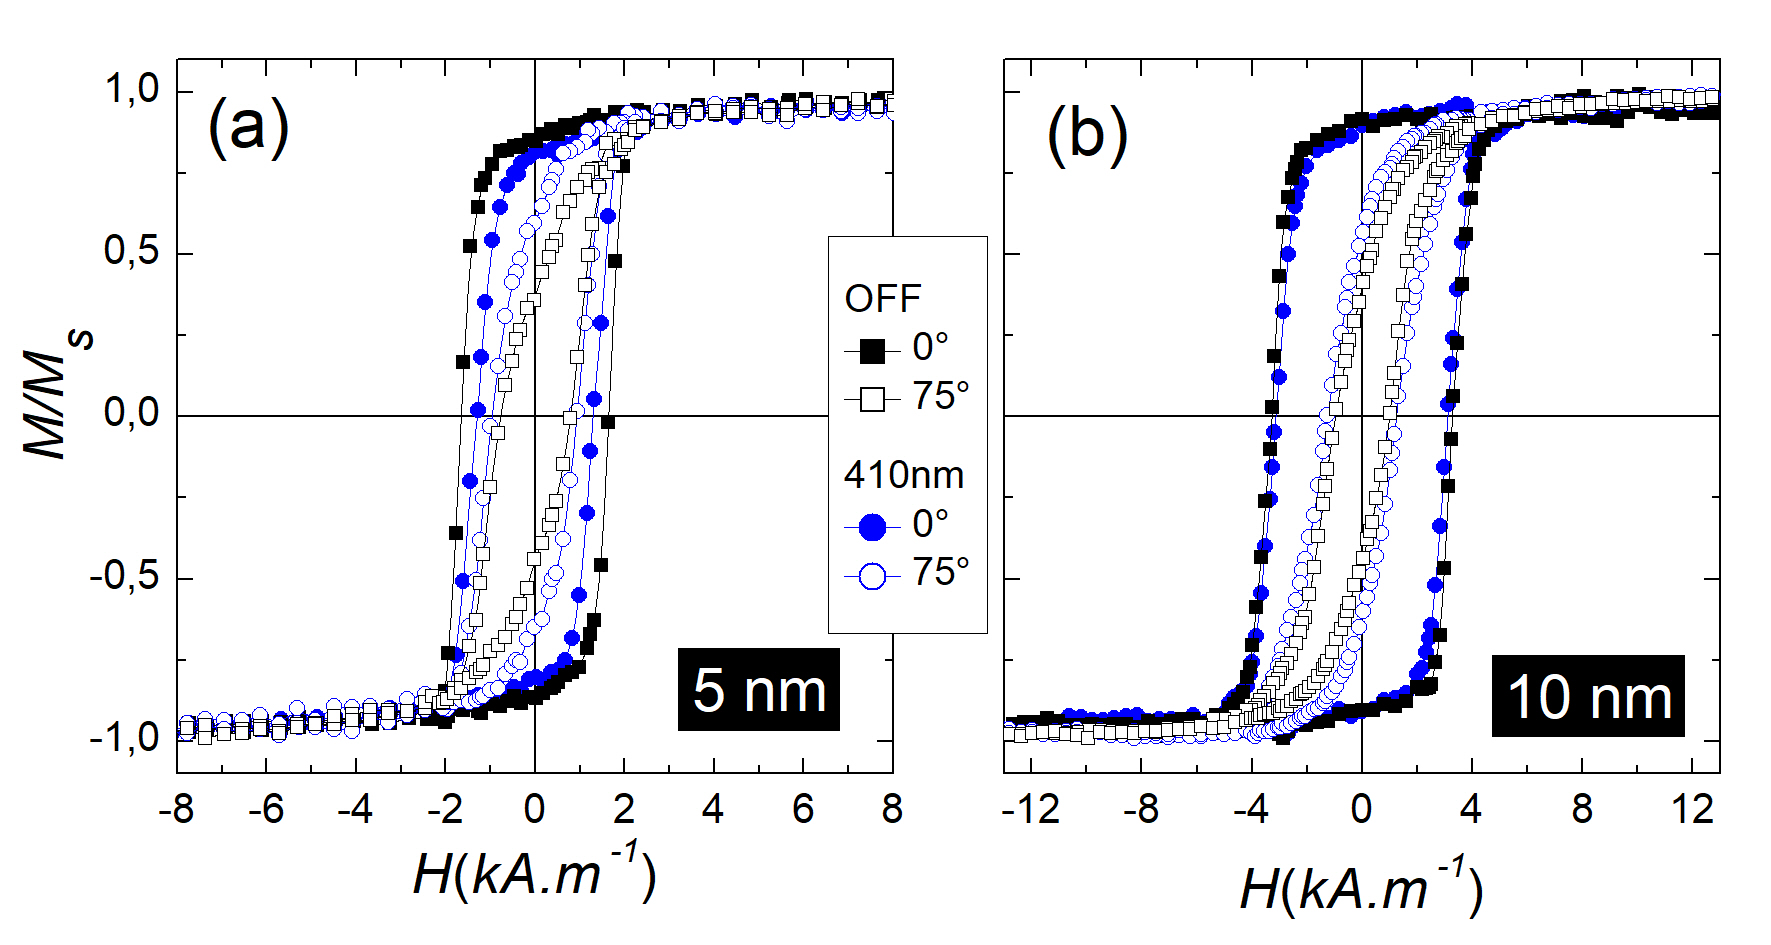
Figure S2 (a) and (b) show the entire M-H loops which were zoomed to obtain Figure 1(a) and (b) of the manuscript.
Figure 2: The entire MH loops of the normalized magnetization reversal of the Ta(10 nm)/FeGa(5 nm ; 10 nm)/PMN-PZT(0.3 mm), measured in-plane with the magnetic field respectively parallel to [100] ( = 0°, i.e. along the deposition field axis dep) and = 75°, under MPE (i.e. under illumination at 410nm) and in the dark state (OFF) materials.
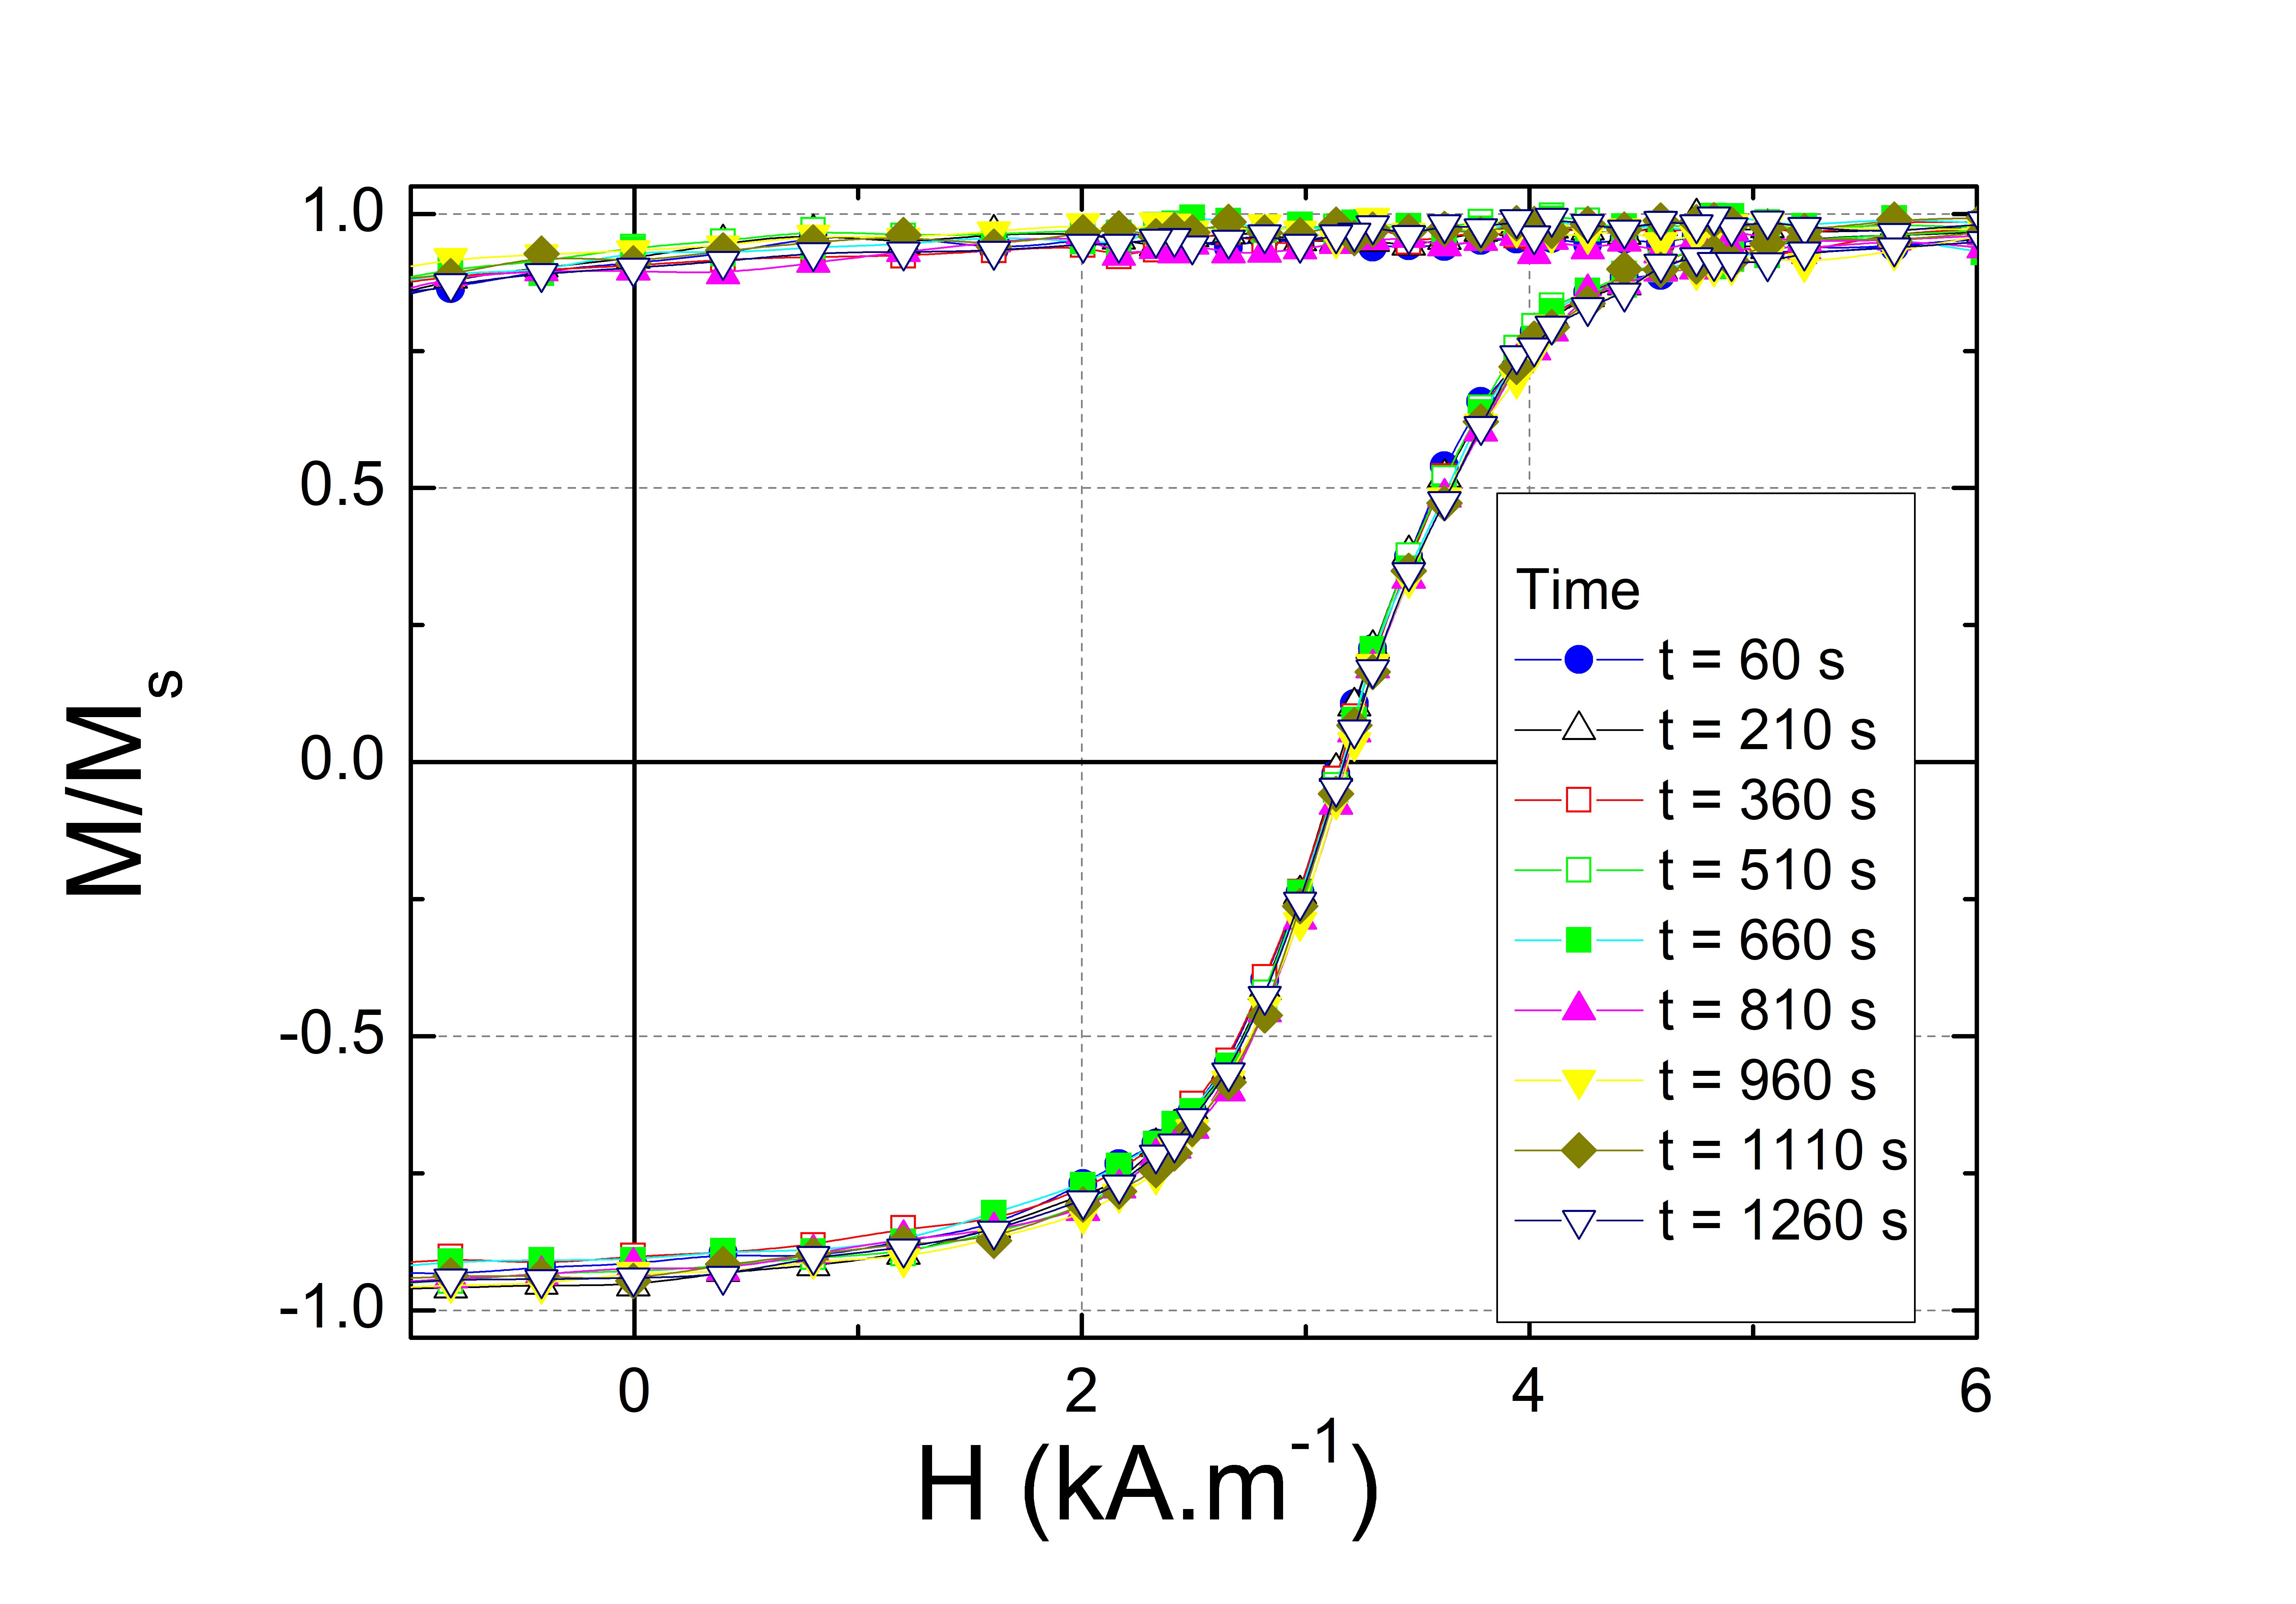
Figure S3 shows the time evolution of M-H loops under sample illumination for the 10 nm FeGa sample at . The illumination started at 0 s and a delay time of 45 s was set before starting the first M-H loop measurement. Each M-H loop took 150 s to be obtained. (In the manuscript, a given MH loop corresponds to the average of 5 MH loops. Thus, it took s s to record each M-H loop presented in the manuscript).
Figure 3: Time evolution under sample illumination of the M-H loops for the 10 nm FeGa sample at , zoomed in-between kA.m-1 and 6 kA.m-1
.
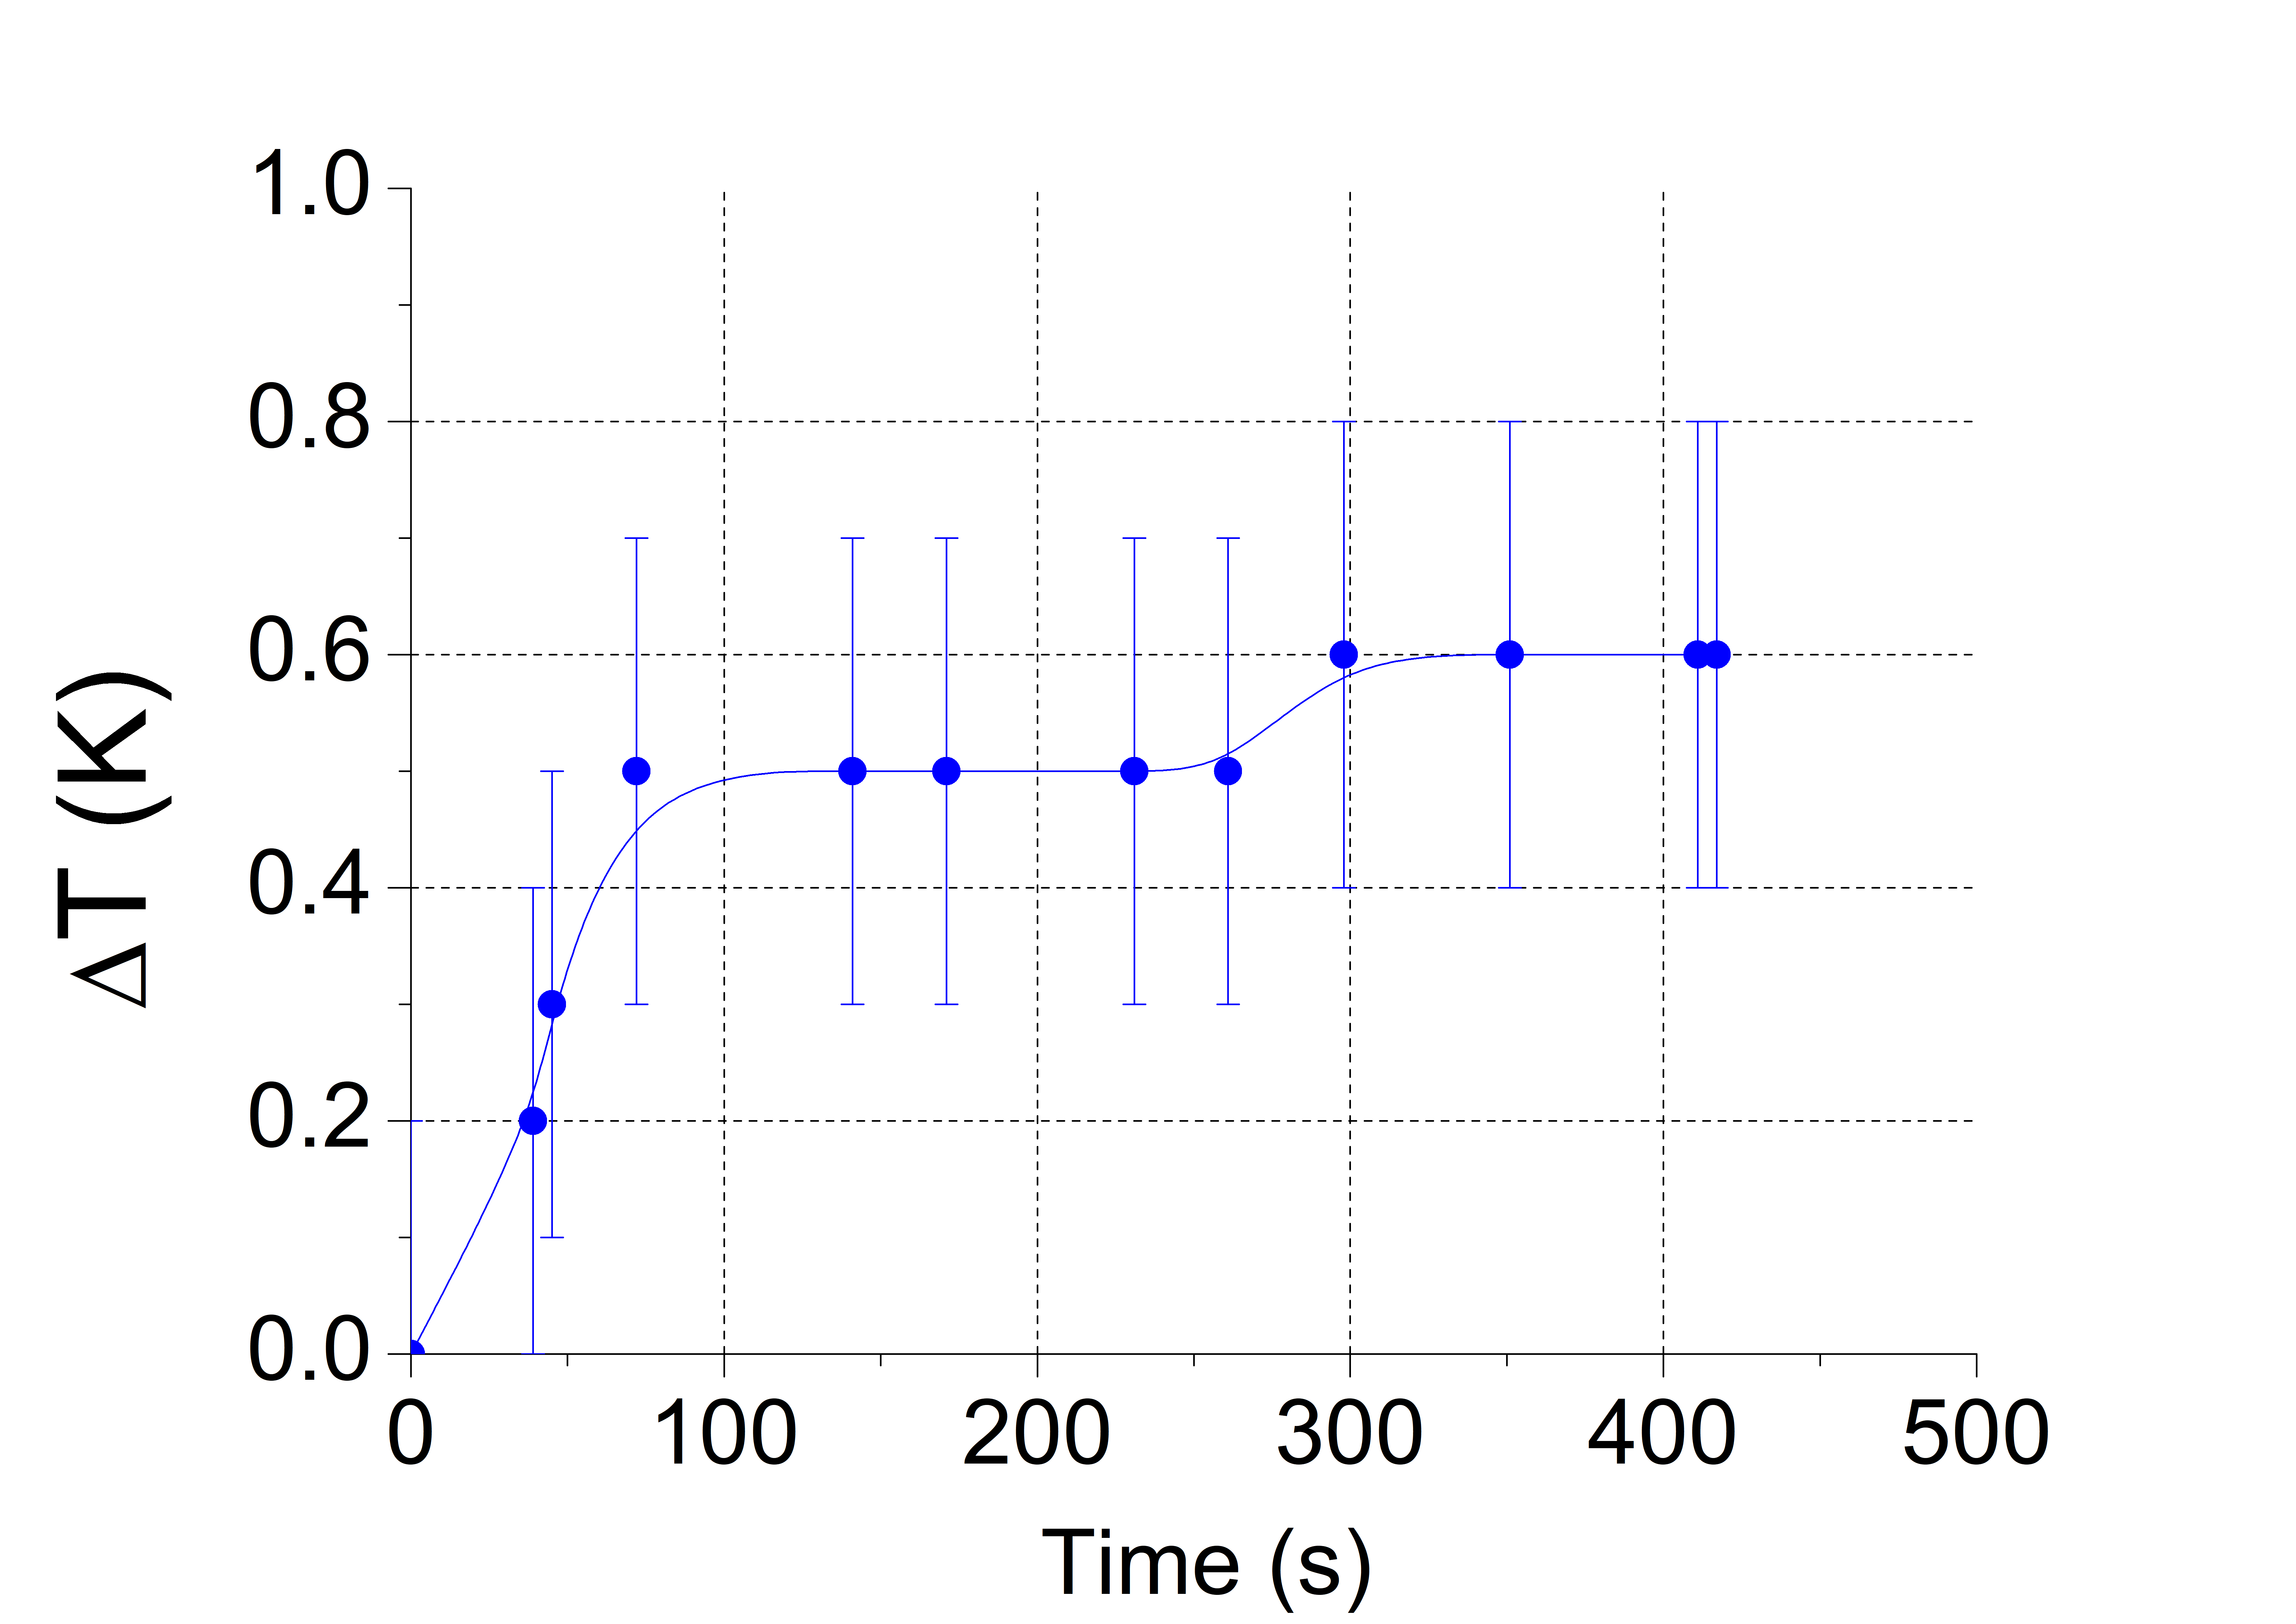
Figure S4 shows the time evolution of temperature changes probed at the sample surface when the material is illuminated by the laser. The illumination started at s. The measurement was performed with an infrared thermometer.
Figure 4: Time evolution of temperature changes probed at the sample surface under laser illumination.
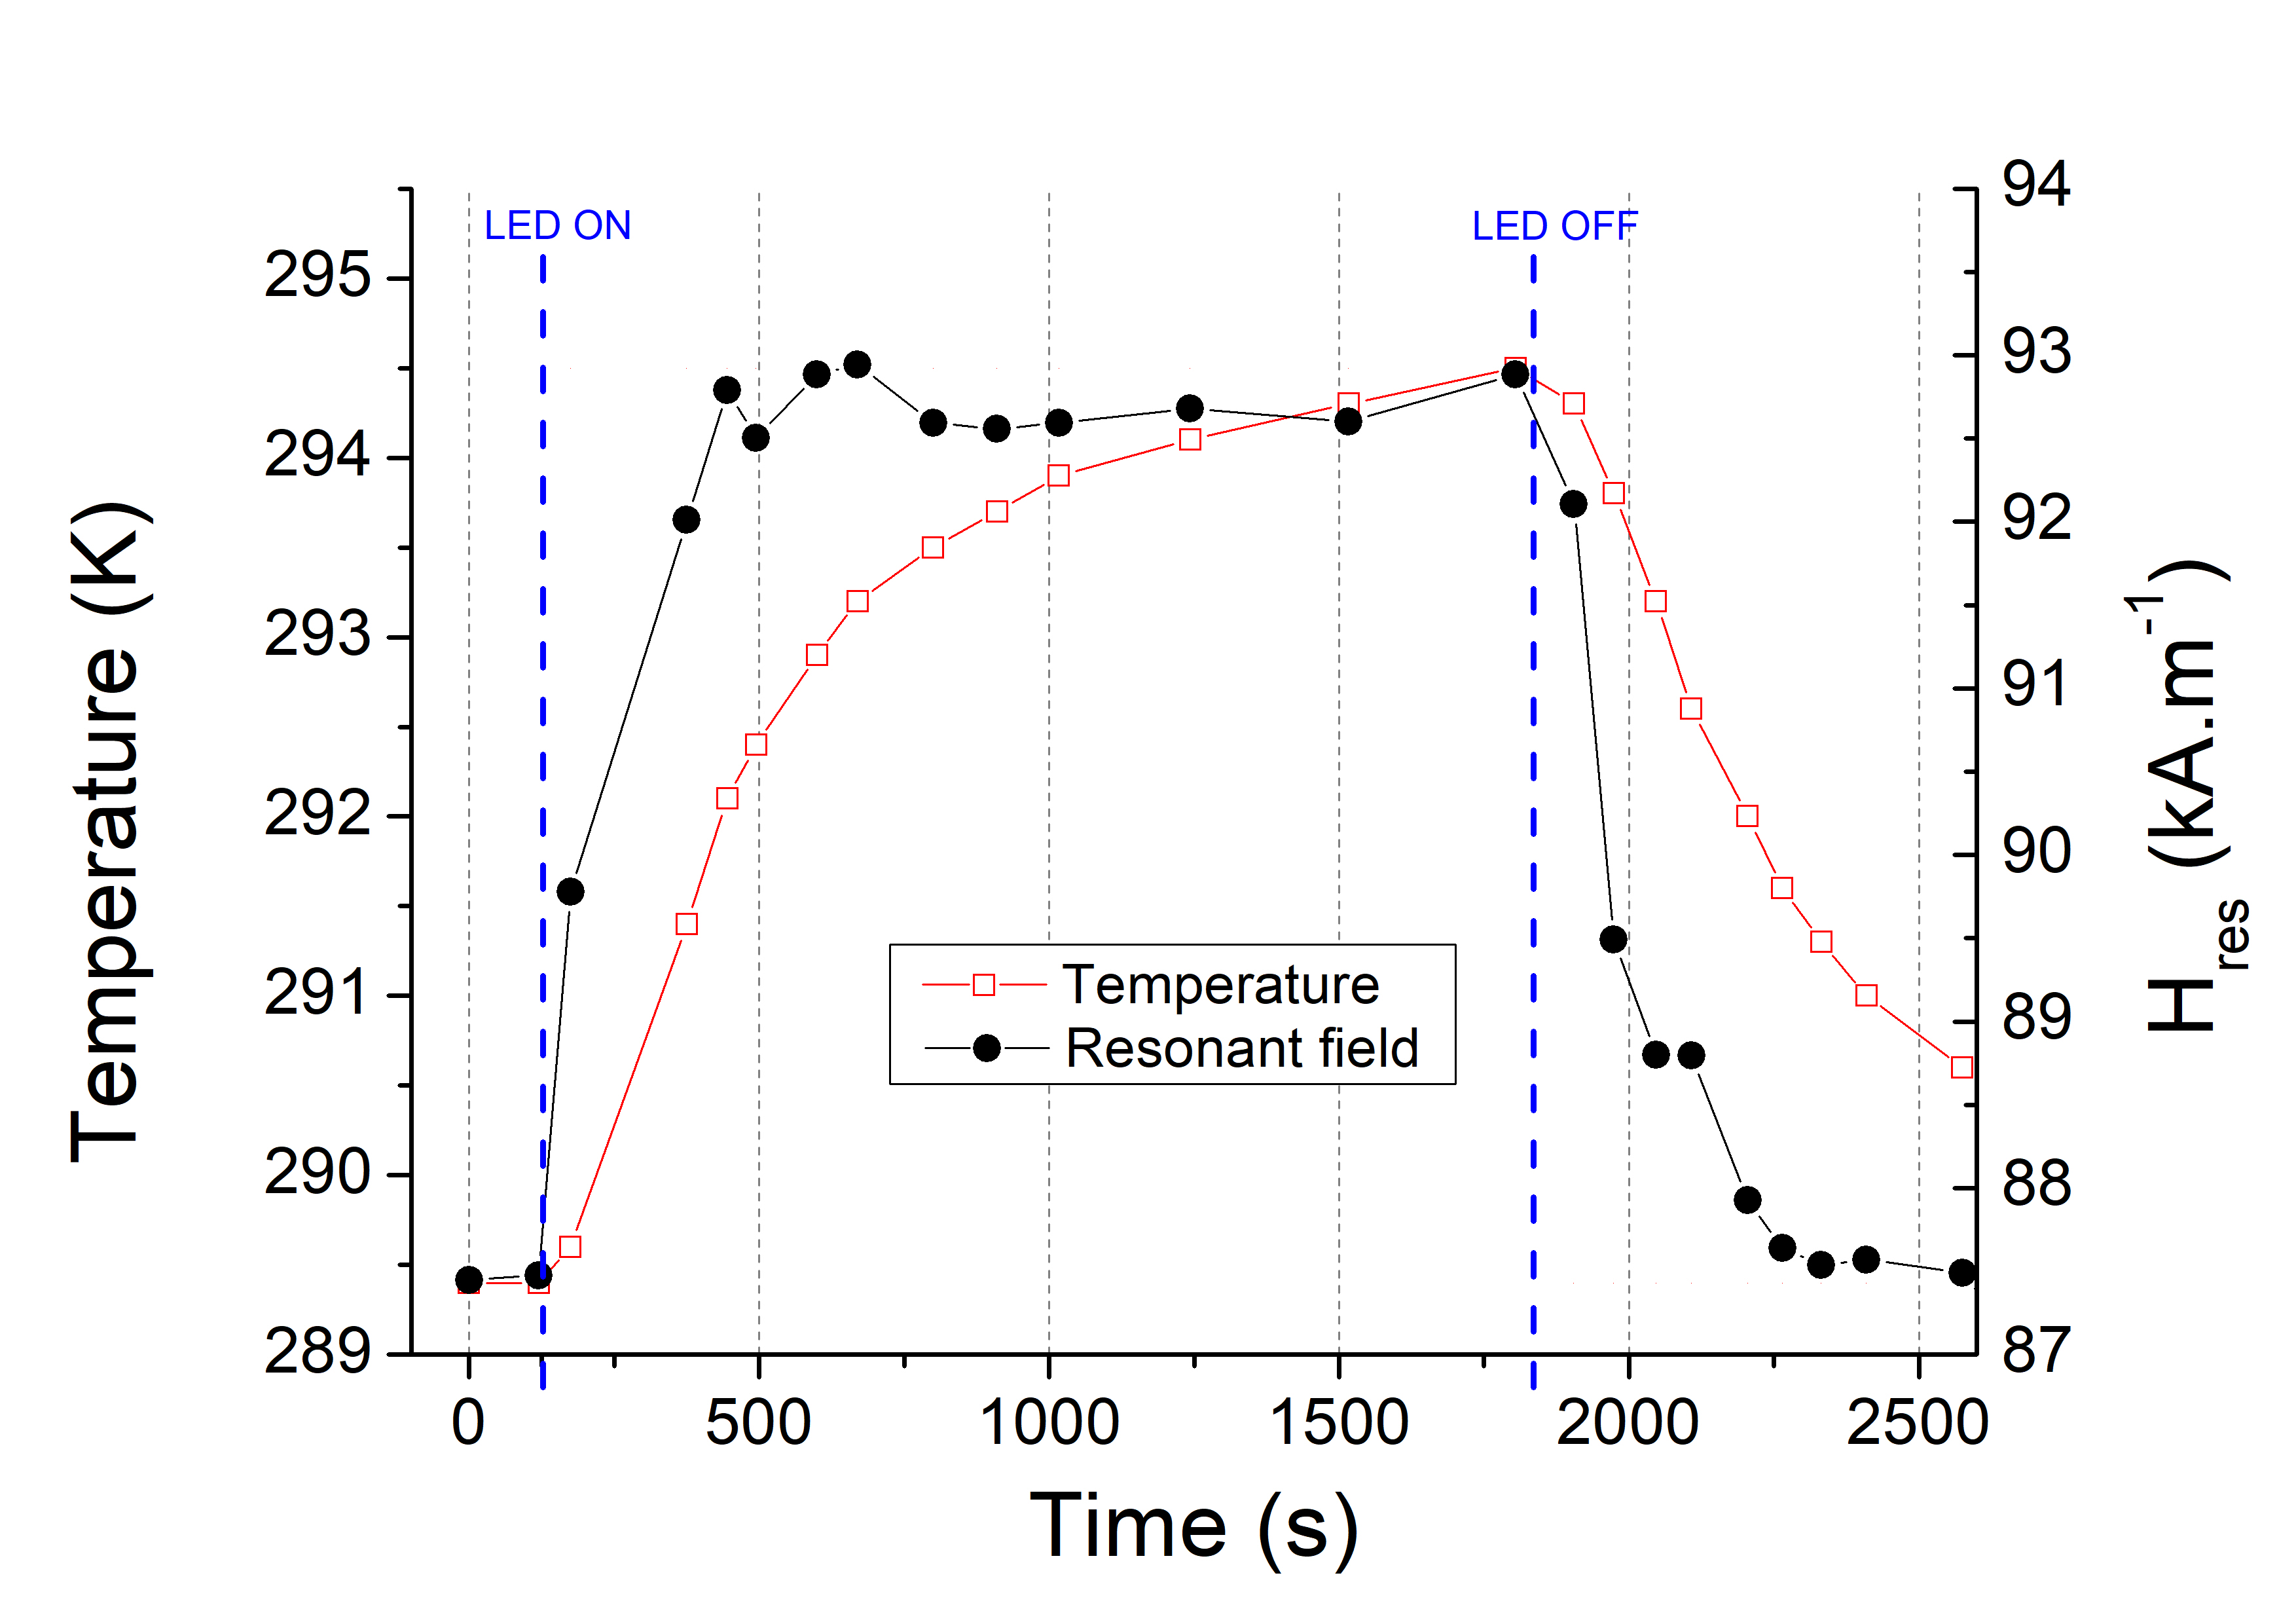
Figure S5 shows the time evolution of the temperature and of the resonance field for the 5 nm sample along . The LED illumination began at t=125s (i.e. LED ON) and finished at t=1836s (i.e. LED OFF).
Figure 5: Time evolution of the temperature and of the resonance field for the 5 nm sample along .