Application of a simple short-range attraction long-range repulsion colloidal model towards predicting the viscosity of protein solutions
Abstract
Some hard sphere colloidal models have been criticized for inaccurately predicting the solution viscosity of complex biological molecules like proteins. Competing short-range attractions and long-range repulsions, also known as SALR interactions, have been thought to affect the microstructure of a protein solution at low to moderate ionic strength. However, such interactions have been implicated primarily in causing phase transition, protein gelation, or reversible cluster formation and their effect on protein solution viscosity change is not fully understood. In this work we show the application of a hard sphere colloidal model with SALR interactions towards predicting the viscosity of dilute to semi-dilute protein solutions. The comparison is performed for a globular shaped albumin and Y-shaped therapeutic monoclonal antibody that are not explained by previous colloidal models. The model predictions show that it is the coupling between attractions and repulsions that give rise to the observed experimental trends in solution viscosity as a function of pH, concentration, and ionic strength. The parameters of the model are obtained from measurements of the second virial coefficient and net surface charge/zeta-potential, without additional fitting of the viscosity.
keywords:
proteins, therapeutic antibody, viscosity, protein-protein interactions, colloidal model, second-virial coefficient1 Introduction
Protein-protein interactions (PPIs) play an integral part in driving many biophysical and biological processes of proteins in solutions, a few of which are phase separation, aggregation, intracellular signalling pathways, and molecular transport. Neurodegenerative diseases like Alzheimer, Parkinson and Creutzfeldt-Jakob are known now to be caused by aberrant PPIs resulting in protein aggregation 1, 2, 3. Similarly, although protein crystallization mechanisms are still unclear 4 but nucleation pathways of crystals have been found to be sensitive to a balance of specific and non-specific protein interactions 5.
Protein solutions such as recombinant globular proteins and therapeutic monoclonal antibodies are routinely formulated and subcutaneously administered at high concentrations ( 50 mg/ml) due to potency concerns 6. Undesirable high viscosity is a common occurrence in high concentration formulations/injections which may even alter or render the drug ineffective 7. Numerous other variables than concentration, related either to the protein bio-molecule (surface charge, shape, molecular and charge anisotropy) or solution conditions (salt concentration, pH, solvent viscosity, temperature) can further affect the protein solution viscosity 8. Such a broad array of factors that can individually affect the protein-protein interactions have made the problem of understanding or predicting viscosity behavior difficult.
Colloidal hard sphere models have been able to explain many behaviors of protein solutions like aggregation, self-assembly, and stability 9, 10. These studies consider the dispersed particles under the influence of a strong single type of particle-particle interaction. Hard sphere models under the assumption of a single and strong dominating interaction have however noticeably failed to explain or predict the viscosity behavior of some protein solutions under variable conditions of pH, protein concentration, and added salt concentration 11, 12, 13, 14. This failure of classical colloidal models in predicting the viscosity of protein solution has been used as a source of criticism on the usefulness of colloidal models towards understanding the dynamic and structural properties of the protein solutions 14, 15, 16.
Previous work has shown that instead of a single dominant interaction (attraction or repulsion), the combined effect of equally strong competing interactions (short-range attraction and long-range repulsion), can change qualitative trends in a colloidal model of solution viscosity 17. SALR(short-range attraction and long-range repulsion) interactions have experimentally demonstrated their effect in protein solutions at low to moderate salt concentration. Lysozyme, a globular protein solution displays an intermediate range order structure as well as different phases like dispersed fluid, clustered fluid, random percolated, and glassy states 18, 19, 20, 21. Reversible cluster formation has also been observed in many monoclonal antibody solutions 22, 23. In these cases, the change in microstructure of the protein solution due to the competing interactions has been thought to affect the viscosity significantly. Still, experimental and theoretical studies of SALR systems have focused on understanding microstructural ordering and phase transition of protein solutions 24.
In this paper, we apply our isotropic colloidal model of SALR interactions 17 to predict the viscosity behavior of two different classes of protein solutions: a. Globular shaped bovine serum albumin (BSA) protein solution at low ionic strength over a wide range of pH conditions and concentration. b. Y-shaped therapeutic monoclonal antibody (mAb) solution as a function of solution salt concentration, pH, and protein concentration. These molecules are unrelated but share similar trends in their viscosity behavior with solution conditions (indicative of SALR interactions), that currently remains unexplained from the classical colloidal models perspective 11, 13. Through these examples, our aim is to show that SALR PPIs could be the driving interactions behind the complex viscosity behavior of dilute to semi-dilute protein solutions. Further, coupling between the interactions is important for designing therapeutic protein formulations where low viscosity is desired at high concentrations.
2 Methods
2.1 SALR colloidal model for protein-protein interactions
We briefly describe the colloidal model for SALR protein interactions developed and analysed in our recent work 17. The long-range electrostatic repulsions were modelled using an approximate screened-Coulomb (SC) potential given by 25
| (1) |
where is the center-to-center distance between two particles nondimensionalized by the particle radius and is the inverse of the Debye length nondimensionalized by the particle radius given by
| (2) |
where is Avogadro’s number, is the elementary charge, is the ionic strength of the solution, is the permittivity of the fluid, is Boltzmann’s constant, and is the absolute temperature.
The dimensionless group represents the repulsion strength of the particle interactions and is given by
| (3) |
where is the zeta potential. can also be written in terms of molecular net surface charge using Debye-Huckel approximation in conditions where the magnitude of the zeta potential is less than 26. The net surface charge for a uniformly charged sphere is related to the measured zeta potential as
| (4) |
Substituting equation into equation and representing the repulsion strength in terms of net surface charge
| (5) |
Substitution of equation into equation gives the screened Coulomb potential developed by Vilker 27 for small surface potentials ( ) that is used here.
The short-ranged attractive interactions were modeled using a Morse potential 28 which for is
| (6) |
where denotes the attractive well depth at and is the sticky interaction range. An effective stickiness parameter denoting the strength of short-range attractions for this model was calculated using the integral of the equilibrium radial distribution function
| (7) |
This is equivalent to using the second virial coefficient for the case of sticky hard spheres to define the strength of attractions.
Ref. 17 developed analytical approximations of the second virial coefficient and zero-shear viscosity coefficient which will be used in this work. The second-virial coefficient of a dilute suspension can be used to measure the equilibrium protein-protein pair interactions. Theoretically, the is scaled by the hard sphere result to produce . For this model can be approximated as 17
| (8) |
where is the long-ranged electrostatic potential at/near contact and is the dimensionless inter-particle distance at which the electrostatic potential and thermal energy terms balance each other 25. The constant in equation was previously inserted to match the approximation with numerical calculations. It was found to be order one, and depend on the dimensionless Debye length. Here we will use it as a fit parameter when determining model parameters from the experimental second virial coefficient. For , can be approximated as 25
| (9) |
For a dilute suspension of particles the relative zero-shear viscosity can be written as a series in the concentration of the particles (protein) 29
| (10) |
where and are the viscosity of the solution and the solvent respectively, is the intrinsic viscosity, and is the Huggins coefficient. For a suspension of spheres the intrinsic viscosity is related to the hydrodynamic radius by
| (11) |
where is the molar mass of the object. In situations where the term is important, the fluid can be non-Newtonian, in which the viscosity depends on shear rate and the type of flow. For the experiments used here, a shear flow was used in the measurements and the viscosity was nearly independent of shear rate.
For spheres the relative viscosity of the solution can also be expressed in terms of volume fraction of the solute , in which case the quadratic coefficient of viscosity is denoted by
| (12) |
By matching the two expressions for , the Huggins coefficient can be determined from or vice-versa using .
This work will use an analytical approximation for given by Ref. 17 in terms of the hydrodynamic contribution , Brownian contribution , and interaction contribution given by
| (13) |
The parameter was previously inserted to match the approximation with numerical calculations. It was found to be order one, and depend on the dimensionless Debye length. Here we will use as an estimate for the ionic conditions to be analyzed and so that the viscosity calculations involve no fitting of experimental viscosity measurements.
3 Results and Discussion
The results here focus on viscosity measurements in the literature that were not previously explained by simple colloidal models of viscosity. The work of Sarangapani 11 measured bovine serum albumin (BSA) protein solution viscosity at low ionic strength over a wide range of concentration (2 mg/ml c 400 mg/ml) and concurrently varying the pH (4.0 pH 7.4). We simultaneously apply our approximations to predict the viscosity behaviour of a therapeutic monoclonal antibody (mAb) solution in a diverse buffer pH (5.0 pH 7.0) at a concentration range (0 mg/ml c 250 mg/ml) and with NaCl concentrations ranging from 13mM to 103mM 13. The experimental data presents a broad parameter space so are an ideal system to understand the application of our SALR colloidal model. We do so by determining first the parameters using the charge and the second-virial coefficient then compare the model predictions with the experimental viscosity without additional fitting. The highest concentrations correspond to volume fractions . It is expected that the quadratic expansion used will not be quantitatively accurate at these concentrations, but will be accurate at intermediate concentrations.
3.1 Determining PPI parameters from second-virial coefficient
The experimental net surface charge on the BSA molecules at different pH was taken from the hydrogen ion titration data of Ref. Tanford and Buzzell 30. The surface charges are in agreement with other BSA solution studies 31, 32. The effective hydrodynamic/Stokes radius of a BSA monomer molecule at all the pH samples was taken to be 3.4 nm which is an experimentally determined value of stokes radius 33 and agrees well with other experimentally reported values 34, 35. The ionic strength of 20 mM at 25∘C used gives a . Together these produce the values given in Table 1.
| Bovine Serum Albumin (BSA) | ||
| pI=4.8; =67 kDa; a=3.4 nm | ||
| pH | Z | |
| 4.0 | +8 | 76.8 |
| 5.0 | -4 | 19.2 |
| 6.0 | -9 | 97.3 |
| 7.4 | -12 | 172.9 |
For determining the short-range attraction strength () of BSA solution, we fit the analytical approximation of using equation to the experimentally determined values from Ref. 11. This fitting, along with using =67 kDa, results in a value of along with . Figure 1 shows a comparison of the second virial coefficient between the colloidal model and experiments. At pH 5.0, the small surface charge maximizes the contribution from short-ranged attractions. The fit using the model matches both this negative as well as the positive for other values of pH.

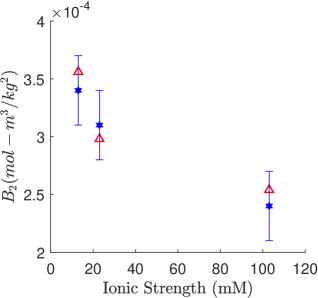
A similar approach is used for an antibody solution based on the system in Ref. 36 with =142 kDa and nm. The charge was measured for different conditions of pH and ionic strength. The parameters in the colloidal model have been computed for these conditions, and are given in Table 2.
| Monoclonal Antibody (mAb) | ||||
| pI=8.1; =142 kDa; a=5.43 nm | ||||
| pH | Ionic strength | Z | ||
| 5.0 | 13 mM | 12 | 2.04 | 248.1 |
| 5.0 | 23 mM | 14 | 2.72 | 1171.6 |
| 5.0 | 103 mM | 24 | 5.75 | 947000 |
| 6.0 | 20 mM | 6 | 2.53 | 152 |
| 7.0 | 20 mM | 3 | 2.53 | 38 |
.
The short-range attraction strength () was computed by fitting the from self-interaction chromatography (SIC) measurements. The fitting results in a value and a value . Figure 2 compares the from SIC measurements at with the fit from the colloidal model. The model matches the experiments to within the experimental error bars.
3.2 Predicting viscosity of protein solutions from PPI parameters
3.2.1 Effect of pH on the viscosity of protein solutions
The solution pH can alter the viscosity of a protein solution by changing the net charge on the proteins. A simple model that attempts to capture this effect is a colloidal model of for hard spheres with strong long-range electrostatic repulsions only () 25. For these conditions, the strong repulsions create an excluded region around each sphere, in which the radius of the excluded shell depends on the charge. The quadratic coefficient of viscosity for this screened Coulomb model is given by
| (14) |
For semi-dilute to concentrated protein solutions, this model fails to predict the viscosity and its behaviour with a pH change 11, 13, 37, 38. The reported viscosity in these studies are the highest at a pH close to the pI (isoelectric point) and lower at pH values where the absolute net charge on the molecule is higher compared to pI. This viscosity behaviour is opposite of what equation (14) would predict, in which a larger gives a larger and larger viscosity.
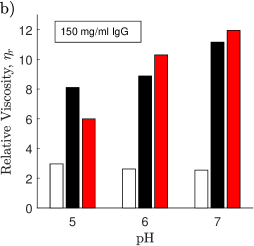
Here we will compare the experimental observations with predictions from the colloidal model reviewed earlier that incorporates short ranged attractions. Ref. 17 showed that attractions can play an important role in the viscosity behavior even if the is positive (i.e. with respect to osmotic pressure, repulsions are more important than attractions). BSA solution at 300 mg/ml 11 and mAb solution at 150 mg/ml 13 were chosen as the example cases for the comparison.
The parameters for computing in equation (13) and subsequently in equation (10) using were taken from Section 3.1. For the given hydrodynamic radii, the solution intrinsic viscosity [] (calculated using equation ) are = 0.0037 ml/mg and = 0.0071 ml/mg. The parameter is the range of the short ranged attractions nondimensionalized by the particle radius. Hydrophobic interactions typically occur over a length scale of a few water molecules. Comparing this to the radii of the proteins examined here, we choose to be in the correct order of magnitude. The weak logarithmic dependence on in equation (13) means that the order of magnitude is the primary concern and it is not necessary to use a different for the different proteins.
The expressions in equations (6) and (7) provide a relationship among , , and . Therefore, the choice of leads to a one-to-one relationship between and . The value of for BSA corresponds to . The value of for the mAb corresponds to .
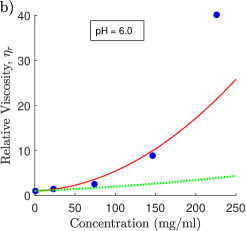
The results of the relative viscosity comparison are shown in Figure 3. We also show the predictions based on equation (14) that include repulsions only. The model including both attractions and repulsions captures the experimental trends with pH. The model including attractions gives a higher viscosity closer to the isoelectric point, while the model with only repulsions gives a lower viscosity closer to the isoelectric point. The attractions play an important role even though the is positive in most conditions.
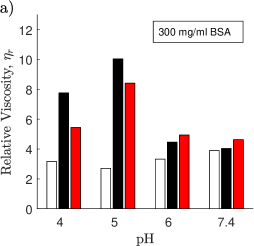
The mechanism for this trend stems from the factor in equation (13). This term modulates the increase in viscosity due to attractions via a Boltzmann factor containing the Coulumb potential at contact between two proteins. The repulsions of objects with a net charge reduces the likelihood that two objects get close together where the attractions can increase the viscosity.
3.2.2 Protein solution viscosity as a function of protein concentration
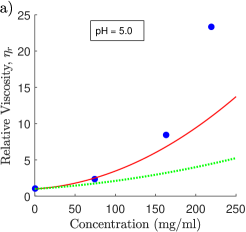
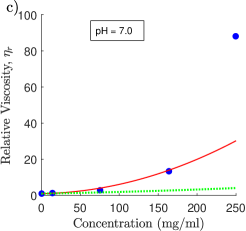
The previous comparison as a function of pH focused on a single value of the protein concentration. Since the viscosity of a protein solution can depend strongly on concentration, we show here the comparison between experiments and predictions of the model as a function of protein concentration. Figure 4 shows the comparison for BSA solutions while Figure 5 shows the comparison for mAb solutions. The experimental data were again extracted from the work of Sarangapani 11 and Binabaji 13. The predictions of the colloidal model including attractions are compared with the model only including repulsions.
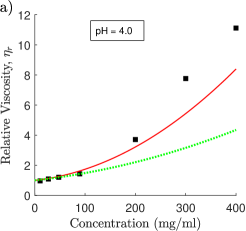
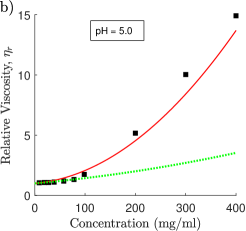
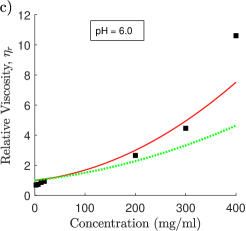
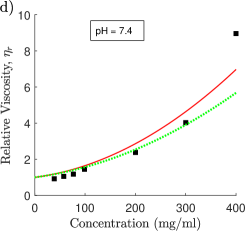
At very low concentrations, the viscosity is linear in concentration. In this region, the viscosity is independent of protein-protein interactions, so both models are the same and match well with the experimental data. This suggests that the protein radii that are used (and the resulting intrinsic viscosity) are reasonable.
At higher concentrations the viscosity increases quadratically with a quadratic coefficient that depends on protein-protein interactions. Without additional fitting, the colloidal model including attractions matches the experiments nearly quantitatively. The model that only includes repulsions underpredicts the experiments except for the higher pH BSA solutions for which the repulsions are stronger.
At the highest protein concentrations, the viscosity increases faster than a quadratic, so are not captured quantitatively by a model that truncates the series in equation (10) at the quadratic term. For the data shown here, that typically occurs for concentrations greater than 200 mg/mL, but the details of the deviation from a quadratic depends on the protein and solution conditions. The BSA solution at pH of 5.0 is captured nearly quantitatively up to concentrations of 400 mg/mL.
3.2.3 Effect of ionic strength on the viscosity of protein solutions
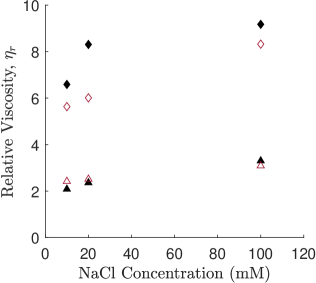
Many studies present the observation that with an increase in the ionic strength, viscosity of an antibody solution is reduced that hints to the dependence of viscosity on electrostatic repulsions which are screened at higher ionic strengths 22, 39, 40, 41. A contrasting and interesting result has been highlighted by other studies where an increase in ionic strength led to an increase in solution viscosity 13, 42, 43, 44.
Figure 6 compares the experimental relative viscosity from Ref. 13 with the predictions of the colloidal model used here. At 75 mg/mL concentration, the model matches with the experiments. At 150 mg/mL concentration, the model based on a quadratic dependence on concentration underpredicts the experiments similar to the behavior seen in Figure 5. Importantly the models at both concentrations match the experimental trend of increasing viscosity with increasing salt concentration. This supports the conclusion that protein-protein attractions play an important role in determining the viscosity of the solutions even though the second virial coefficient (shown in Figure 2) is positive.
4 Conclusion
We show through this work the application of a colloidal hard sphere model with SALR (short-range attraction and long-range repulsion) interactions in predicting the viscosity of dilute to semi-dilute protein solutions. The predictions have been done to explain the previously published viscosity behaviour of BSA solution 11 and a therapeutic mAb IgG1 solution 13. Both of these studies stand out due to the inability of classical colloidal models in explaining their viscosity trends. We use independent measurements of charge and second virial coefficient to determine the model parameters and predict the viscosity as a function of pH, protein concentration, and ionic strength. The model predictions are nearly quantitatively accurate up to protein concentrations of 150-200 mg/mL or even higher in some cases. This is the case despite the relative simplicity of using a model based on spheres with isotropic interactions and using a quadratic expansion of viscosity in terms of concentration. Through this paper we also showed that in protein solutions of low to moderate ionic strength, SALR interactions may determine the solution viscosity when the repulsions are strong enough to give positive second virial coefficient and prevent a phase transition. This may help enable control over the viscosity of protein solutions through mutations designed to alter the protein attractions and repulsions. It may also help in the understanding of the role of excipients in solution. Some excipients alter short-ranged hydrophobic interactions, which could be approximated by changing the parameter . Excipients may also lead to slip of water over the protein surface, which would alter the hydrodynamic interactions used in the derivation of equation (13). In some cases of protein shape and directional interactions, this model will likely not be accurate. But it can then form the basis for comparison of extended colloidal models that include nonspherical objects, anisotropic interactions, and multibody interactions.
This work was supported by the National Science Foundation under Grant No. [CBET 1803497].
References
- Ross and Poirier 2004 Ross, C. A.; Poirier, M. A. Protein aggregation and neurodegenerative disease. Nature medicine 2004, 10, S10–S17
- Spires-Jones et al. 2017 Spires-Jones, T. L.; Attems, J.; Thal, D. R. Interactions of pathological proteins in neurodegenerative diseases. Acta neuropathologica 2017, 134, 187–205
- Hernandez et al. 2020 Hernandez, S. M.; Tikhonova, E. B.; Karamyshev, A. L. Protein-protein interactions in alpha-synuclein biogenesis: new potential targets in Parkinson’s disease. Frontiers in Aging Neuroscience 2020, 12, 72
- Sleutel and Van Driessche 2018 Sleutel, M.; Van Driessche, A. E. Nucleation of protein crystals–A nanoscopic perspective. Nanoscale 2018, 10, 12256–12267
- Whitelam 2010 Whitelam, S. Control of pathways and yields of protein crystallization through the interplay of nonspecific and specific attractions. Physical Review Letters 2010, 105, 088102
- Kollár et al. 2020 Kollár, É.; Balázs, B.; Tari, T.; Siró, I. Development challenges of high concentration monoclonal antibody formulations. Drug Discovery Today: Technologies 2020, 37, 31–40
- Shire et al. 2004 Shire, S. J.; Shahrokh, Z.; Liu, J. Challenges in the development of high protein concentration formulations. Journal of pharmaceutical sciences 2004, 93, 1390–1402
- Yadav et al. 2010 Yadav, S.; Shire, S. J.; Kalonia, D. S. Factors affecting the viscosity in high concentration solutions of different monoclonal antibodies. Journal of pharmaceutical sciences 2010, 99, 4812–4829
- Piazza et al. 1998 Piazza, R.; Peyre, V.; Degiorgio, V. “Sticky hard spheres” model of proteins near crystallization: a test based on the osmotic compressibility of lysozyme solutions. Physical Review E 1998, 58, R2733
- Heinen et al. 2012 Heinen, M.; Zanini, F.; Roosen-Runge, F.; Fedunová, D.; Zhang, F.; Hennig, M.; Seydel, T.; Schweins, R.; Sztucki, M.; Antalík, M., et al. Viscosity and diffusion: crowding and salt effects in protein solutions. Soft Matter 2012, 8, 1404–1419
- Sarangapani et al. 2013 Sarangapani, P. S.; Hudson, S. D.; Migler, K. B.; Pathak, J. A. The Limitations of an Exclusively Colloidal View of Protein Solution Hydrodynamics and Rheology. Biophys. J. 2013, 105, 2418–2426
- Sarangapani et al. 2015 Sarangapani, P. S.; Hudson, S. D.; Jones, R. L.; Douglas, J. F.; Pathack, J. A. Critical Examination of the Colloidal Particle Model of Globular Proteins. Biophys. J. 2015, 108, 724–737
- Binabaji et al. 2015 Binabaji, E.; Ma, J.; Zydney, A. L. Intermolecular Interactions and the Viscosity of Highly Concentrated Monoclonal Antibody Solutions. Pharm. Res. 2015, 32, 3102–3109
- Pathak et al. 2021 Pathak, J. A.; Nugent, S.; Bender, M.; Roberts, C. J.; Curtis, R. J.; Douglas, J. F. Comparison of Huggins coefficients and osmotic second virial coefficients of buffered solutions of monoclonal antibodies. Polymers 2021, 13, 601
- Prausnitz 2015 Prausnitz, J. The fallacy of misplaced concreteness. Biophysical Journal 2015, 108, 453
- Roche et al. 2022 Roche, A.; Gentiluomo, L.; Sibanda, N.; Roessner, D.; Friess, W.; Trainoff, S. P.; Curtis, R. Towards an improved prediction of concentrated antibody solution viscosity using the Huggins coefficient. Journal of Colloid and Interface Science 2022, 607, 1813–1824
- Tang et al. 2022 Tang, E. M.; Virk, S. S.; Underhill, P. T. Coupling between long ranged repulsions and short ranged attractions in a colloidal model of zero shear rate viscosity. Journal of Rheology 2022, 66, 491–504
- Stradner et al. 2004 Stradner, A.; Sedgwick, H.; Cardinaux, F.; Poon, W. C.; Egelhaaf, S. U.; Schurtenberger, P. Equilibrium cluster formation in concentrated protein solutions and colloids. Nature 2004, 432, 492–495
- Liu et al. 2011 Liu, Y.; Porcar, L.; Chen, J.; Chen, W.-R.; Falus, P.; Faraone, A.; Fratini, E.; Hong, K.; Baglioni, P. Lysozyme protein solution with an intermediate range order structure. The Journal of Physical Chemistry B 2011, 115, 7238–7247
- Godfrin et al. 2015 Godfrin, P. D.; Hudson, S. D.; Hong, K.; Porcar, L.; Falus, P.; Wagner, N. J.; Liu, Y. Short-time glassy dynamics in viscous protein solutions with competing interactions. Physical review letters 2015, 115, 228302
- Godfrin et al. 2018 Godfrin, P. D.; Falus, P.; Porcar, L.; Hong, K.; Hudson, S. D.; Wagner, N. J.; Liu, Y. Dynamic properties of different liquid states in systems with competing interactions studied with lysozyme solutions. Soft Matter 2018, 14, 8570–8579
- Liu et al. 2005 Liu, J.; Nguyen, M. D.; Andya, J. D.; Shire, S. J. Reversible self-association increases the viscosity of a concentrated monoclonal antibody in aqueous solution. Journal of pharmaceutical sciences 2005, 94, 1928–1940
- Yearley et al. 2013 Yearley, E. J.; Zarraga, I. E.; Shire, S. J.; Scherer, T. M.; Gokarn, Y.; Wagner, N. J.; Liu, Y. Small-angle neutron scattering characterization of monoclonal antibody conformations and interactions at high concentrations. Biophysical journal 2013, 105, 720–731
- Liu and Xi 2019 Liu, Y.; Xi, Y. Colloidal systems with a short-range attraction and long-range repulsion: Phase diagrams, structures, and dynamics. Current opinion in colloid & interface science 2019, 39, 123–136
- Russel 1978 Russel, W. B. The rheology of suspensions of charged rigid spheres. J. Fluid Mech. 1978, 85, 209–232
- Hunter 2013 Hunter, R. J. Zeta potential in colloid science: principles and applications; Academic press, 2013; Vol. 2
- Vilker et al. 1981 Vilker, V. L.; Colton, C. K.; Smith, K. A. The osmotic pressure of concentrated protein solutions: effect of concentration and pH in saline solutions of bovine serum albumin. Journal of Colloid and Interface Science 1981, 79, 548–566
- Kallus and Holmes-Cerfon 2017 Kallus, Y.; Holmes-Cerfon, M. Free energy of singulr sticky-sphere clusters. Phys. Rev. E 2017, 95, 1–18
- Russel 1984 Russel, W. B. The Huggins Coefficient as a Mean for Characterizing Suspended Particles. J. Chem. Soc. Faraday Trans. 2 1984, 80, 31–41
- Tanford and Buzzell 1956 Tanford, C.; Buzzell, J. G. The viscosity of aqueous solutions of bovine serum albumin between pH 4.3 and 10.5. The Journal of Physical Chemistry 1956, 60, 225–231
- Zhang et al. 2007 Zhang, F.; Skoda, M. W.; Jacobs, R. M.; Martin, R. A.; Martin, C. M.; Schreiber, F. Protein interactions studied by SAXS: effect of ionic strength and protein concentration for BSA in aqueous solutions. The Journal of Physical Chemistry B 2007, 111, 251–259
- Li et al. 2016 Li, R.; Wu, Z.; Wangb, Y.; Ding, L.; Wang, Y. Role of pH-induced structural change in protein aggregation in foam fractionation of bovine serum albumin. Biotechnology Reports 2016, 9, 46–52
- González Flecha and Levi 2003 González Flecha, F. L.; Levi, V. Determination of the molecular size of BSA by fluorescence anisotropy. Biochemistry and molecular biology education 2003, 31, 319–322
- Kuntz Jr and Kauzmann 1974 Kuntz Jr, I.; Kauzmann, W. Hydration of proteins and polypeptides. Advances in protein chemistry 1974, 28, 239–345
- Axelsson 1978 Axelsson, I. Characterization of proteins and other macromolecules by agarose gel chromatography. Journal of Chromatography A 1978, 152, 21–32
- Binabaji et al. 2013 Binabaji, E.; Rao, S.; Zydney, A. L. Improved method for evaluating the dead volume and protein–protein interactions by self-interaction chromatography. Analytical chemistry 2013, 85, 9101–9106
- Saluja et al. 2006 Saluja, A.; Badkar, A. V.; Zeng, D. L.; Nema, S.; Kalonia, D. S. Application of high-frequency rheology measurements for analyzing protein–protein interactions in high protein concentration solutions using a model monoclonal antibody (IgG2). Journal of pharmaceutical sciences 2006, 95, 1967–1983
- Yadav et al. 2011 Yadav, S.; Shire, S. J.; Kalonia, D. S. Viscosity analysis of high concentration bovine serum albumin aqueous solutions. Pharmaceutical research 2011, 28, 1973–1983
- Kanai et al. 2008 Kanai, S.; Liu, J.; Patapoff, T. W.; Shire, S. J. Reversible self-association of a concentrated monoclonal antibody solution mediated by Fab–Fab interaction that impacts solution viscosity. Journal of pharmaceutical sciences 2008, 97, 4219–4227
- Salinas et al. 2010 Salinas, B. A.; Sathish, H. A.; Bishop, S. M.; Harn, N.; Carpenter, J. F.; Randolph, T. W. Understanding and modulating opalescence and viscosity in a monoclonal antibody formulation. Journal of pharmaceutical sciences 2010, 99, 82–93
- Yearley et al. 2014 Yearley, E. J.; Godfrin, P. D.; Perevozchikova, T.; Zhang, H.; Falus, P.; Porcar, L.; Nagao, M.; Curtis, J. E.; Gawande, P.; Taing, R., et al. Observation of small cluster formation in concentrated monoclonal antibody solutions and its implications to solution viscosity. Biophysical journal 2014, 106, 1763–1770
- Meyer et al. 2009 Meyer, B.; Hu, B.; Ionescu, R.; Hamm, C.; Wang, N.; Mach, H.; Kirchmeier, M.; Sweeney, J. Opalescence of an IgG1 monoclonal antibody formulation is mediated by ionic strength and excipients. BioPharm International 2009, 22, 36–47
- Neergaard et al. 2013 Neergaard, M. S.; Kalonia, D. S.; Parshad, H.; Nielsen, A. D.; Møller, E. H.; Van De Weert, M. Viscosity of high concentration protein formulations of monoclonal antibodies of the IgG1 and IgG4 subclass–Prediction of viscosity through protein–protein interaction measurements. European Journal of Pharmaceutical Sciences 2013, 49, 400–410
- Lilyestrom et al. 2013 Lilyestrom, W. G.; Yadav, S.; Shire, S. J.; Scherer, T. M. Monoclonal antibody self-association, cluster formation, and rheology at high concentrations. The Journal of Physical Chemistry B 2013, 117, 6373–6384