contact email: 11email: michal.bujak@doctoral.uj.edu.pl
Exploring shareability networks of probabilistic ride-pooling problems
Abstract
Travellers sharing rides in ride-pooling systems form various kinds of networks. While the notions of the so-called shareability graphs, has been in the core of many ride-pooling algorithms, so far they have not been explicitly analysed. Here, we introduce and examine four kinds of networks resulting from ride-pooling problems.
We use 147 NYC taxi requests from 2016 pooled into attractive shared-rides with our utility based ExMAS algorithm and explore resulting shareability networks. To cover unknown individual properties of pooling travellers, we run 1000 replications of probabilistic pooling process, resulting in richer representation of weighted graphs instrumental to reveal complex network structures.
Our findings reveal substantial differences between network structures and topologies. Properties of ride-pooling networks may be further analysed to better understand and improve ride-pooling systems.
keywords:
ride-pooling, shareability graph, matching graph, structural properties1 Introduction
Ride-pooling, where travellers share a vehicle to reach their destinations, is becoming an increasingly popular urban mobility alternative. Thanks to pooling, co-travellers can reduce their travel costs, mobility platforms (like Uber and Lyft) can more efficiently utilise their fleets and cities can reduce congestion.
Naturally, travellers sharing their rides form a graph structures, already identified in the seminal works of Santi et al. (2014) and Alonso-Mora et al. (2017). While the so-called shareability networks are central to solve the ride-pooling problems they have not been hitherto explicitly analysed.
Ride-pooling, from the networks perspective, can be seen as linking two or more nodes. Node is a traveller, or more precisely her/his single trip request (tuple of origin, destination and request time). The link is formed at the two levels. First, when all the co-travellers agree to travel together (in our case this means that the ride is attractive for all the co-travellers). Second, when they actually travel together (when each traveller is uniquely assigned to a given ride). This two interpretations of links, yields two different network structures (second one being a subgraph of the first one). We will refer to the former representation as shareability, i.e. potential to travel together, and the latter as matching, i.e. actually travelling together. Moreover, the links can be formed twofold: first, when travellers (nodes) are linked directly, and second when we introduce a new kind of node: the ride, which can be seen as a vehicle trip during which co-travellers travel together. Linking co-travellers with a ride results in a bipartite network. We will denote the former as simple networks and latter as bipartite networks. This two levels of twofold distinctions yield four kinds of networks that we explore in this paper.
Moreover, to represent the probabilistic nature of underlying pooling decisions made by travellers, we propose the probabilistic version of pooling algorithm. By adding the random noise to the utility formulas of ride-pooling algorithm we introduce the behavioural non-determinism to the pooling problem. When replicated multiple times we obtain rich and meaningful structures of weighted graphs which well estimate probabilistic graphs. With those we can observe both the stable matches with strong links, as well as components where pooling compositions can vary substantially between replications.
Such weighted shareability graphs, consistent with the actual travel behaviour, can be useful not only for a deeper understand of the still challenging ride-pooling problems, but also to identify communities in ride-pooling networks, improve attractiveness of pooling services or control the virus spreading in ride-pooling networks (like in Kucharski et al. (2021)).
1.1 Background
The potential of ride-pooling to improve urban mobility has triggered a bursting stream of research (Agatz et al. (2011); Chan and Shaheen (2012); Furuhata et al. (2013); Tachet et al. (2017); Bischoff et al. (2017)), which led to an algorithmic breakthrough in the seminal works of Santi et al. (2014) and Alonso-Mora et al. (2017). First, in Santi et al. (2014), the so-called shareability network was introduced along with a methodology to match travellers in pairs. Further exploited in Alonso-Mora et al. (2017) with the complete algorithm to efficiently match incoming requests with available vehicles by sequentially adding new co-travellers into vehicles with empty seats and adjusting their routes. By applying cutoffs on maximal detours and delays the pooled rides are acceptable for travellers and by minimising the service costs (vehicle hours) in the matching the solution becomes optimal for the supply side (platform and/or drivers). In parallel, behavioural research has made advancements in better understanding users’ so-called willingness to share (Kang et al. (2021); Lavieri and Bhat (2019); Alonso-González et al. (2021); Lazarus et al. (2021)). Such, utility-driven approaches, not only put the traveller in the centre but also allow to incorporate inherent non-determinism of travellers’ decision processes.
Hitherto shareability and matching structures have been only introduced. We formalise and analyse different methods of presenting their topologies. Furthermore, we introduce random noise, hence the novel non-deterministic approach to ride-pooling. Based on replications, we introduce weighted graphs which estimate the probabilistic graphs. We analyse their evolution and stability.
2 Methodology
2.1 Ride-pooling algorithm
ExMAS (Kucharski and Cats, 2020) is an offline algorithm which matches the travellers into a shared ride if it is more attractive than travelling alone. More precisely, travellers are assigned to the shared rides if individual utility of the shared ride exceeds a non-shared ride utility for each of the co-travellers. Value of the utility depends on the individual- and system-dependent variables with the following formula, given as the difference between shared ride and non-shared ride:
| (1) |
where , , denote respectively utility gain due to sharing, utility of shared ride and utility of non-shared ride. stands for discount for sharing a ride and is controlled by the system operator. , , are the behavioural parameters: cost sensitivity, value of time, sharing discomfort and delay sensitivity, respectively. and stand for travel time of non-shared and shared ride, respectively, is a delay associated with pooling and is a random term.
We say that a group of travellers can share a ride, if for each of them the individually perceived utility of the ride is positive. Those rides contribute to the set of attractive (feasible) rides. ExMAS identifies such rides hierarchically, first exploring pairwise shareable trips, which are then extended to triples, quadruples, etc. until no cliques can be found in shareability networks. On the set of identified attractive shared rides we solve the assignment problem in which travellers are uniquely assigned to a rides, formulated as a matching on a bipartite graph aimed to minimise the total distance travelled. From now on, we will refer to the set of feasible, attractive rides identified with ExMAS as shareability and the optimal solution as a matching. Full details of ExMAS algorithm are available in Kucharski and Cats (2020).
Hitherto, the deterministic version of ExMAS has been used, with .Here, we decided to adopt a probabilistic model in which follows a normal distribution (probit model). Formally, probability that traveller wants to participate in ride is described as follows, , where stands for CDF of the normal distribution with mean and standard deviation . For the sake of simplicity, we omit in additional indexes, however keeping in mind that , and are individually calculated for each traveller for each ride. is a strictly increasing bijection, hence, we can write:
Aforementioned inequalities yield a simple way to draw values to estimate the distributions of non-deterministic ride-pooling. Each replication yields simulated values of the random term, hence giving explicit values of utility per each set of travellers.
2.2 Construction of networks
Both finding the shareability and the matching can be represented with networks. The most straightforward representation is a network, where travellers constitute nodes, linked when they share a ride (row one in tab. 1). In such shareability network (first column in tab.1), travellers are linked if they find it attractive, whereas in the matching network (second column) if the ride is part of the optimal solution. While the latter is the actual realisation of ride-pooling, i.e. linked travellers actually travel together, the former reflects the possibility to travel together (which may not be realised due to other constrains).
Such network representation is, however, incomplete. From the shareability graph, we cannot conclude if, for example, a triangle means that the three travellers can share a ride together or whether they are just pairwise shareable (Figure 1(a)). In order to avoid this information loss, an alternative representation if often proposed. Both a shareability and matching network can be formulated as bipartite graphs, where nodes are not only travellers but also the rides (vehicles). Traveller is connected to a ride in the bipartite shareability network if for her/him the ride is attractive (Figure 1(c)), in case of bipartite matching network travellers are linked only to rides being part of the optimal solution (Figure 1(d)). This leads to the four distinct network structures, as summarised in the Table 1 and illustrated with Figure 1.
| network | nodes | links |
|---|---|---|
| shareability | travellers | attractive pooling (between travellers) |
| matching | optimal matching (between travellers) | |
| bipartite shareability | travellers | attractive pooling (between travellers and rides) |
| bipartite matching | and rides | optimal matching (between travellers and rides) |


3 Experiment
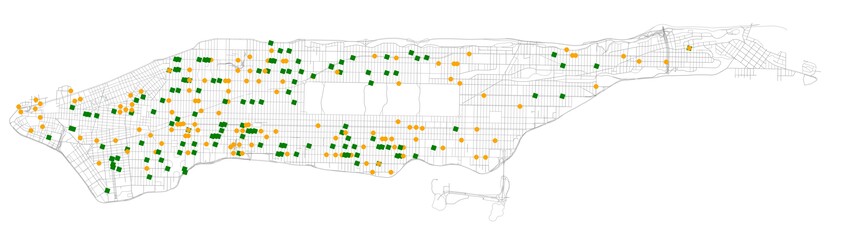
We experiment with trips actually requested within half an hour in New York City on January 2016. Each of 147 requests links origin with destination at a given time (as illustrated on Figure 2). We assumed the fare is $/km, sharing discount is , value of time $/h and willingness to share (most of which based either on empirical observations or actual system values). We set pooling parameters to be constant among all the replications (deterministic part) and assume the random term of utility to follow standard normal distribution.
It is important to note that even though we can explicitly calculate utility of a ride for any group of travellers hence probability of corresponding links, there is no easy way to determine probability in the matching. Thus, to observe different realisations of the random term , we have performed replications. For each, we have constructed networks such as shown in the Figure 1.
3.1 Results
First, we look at the properties of ride-pooling networks and their stability across the replications. Aggregated results are presented in the Table 2. Some of the networks’ properties remain constant by their definition. For example, the number of nodes in the simple networks is equal to the number of travellers. Similarly, the number of links in bipartite matching. However, investigating different structural characteristics reveals interesting patterns. Relatively big standard deviation in the number of nodes and edges in the bipartite shareability suggests that there is indeed a significant structural variance introduced by the random noise. Low deviation in the bipartite shareability network of the average degree of a ride suggests that introduced noise has a subsidiary impact on the average occupancy of vehicles among feasible rides. For the same type of network, average degree of traveller nodes has a significant deviation. The fact implies that there is a substantial group of rides which balance on the verge of attractiveness. Hence, minor disturbance introduced by the noise can have a significant impact on the number of feasible rides for a traveller. Furthermore, relating to the variance of average degree of nodes in the simple shareability network, we may conclude that noise is pronounced both in potential sharing between two travellers and for the higher degree rides. Relative size of the greatest component shows significant variance for the bipartite shareability network. Considering the fact that the maximal value is , while the average is , we can conclude that often the greatest component becomes much smaller. That may suggest forming at least two big components which are not always connected. Further investigation could prove communities presence within the components.
| nodes | edges | degree | deg.rides | deg.travellers | greatest component | |
|---|---|---|---|---|---|---|
| shareability | 147 (0) | 470 (47) | 6,394 (0,638) | 0,853 (0,027) | ||
| matching | 147 (0) | 61 (6) | 0,831 (0,082) | 0,030 (0,004) | ||
| bipartite shareability | 1164 (166) | 2306 (497) | 3,922 (0,287) | 2,249 (0,121) | 15,692 (3,384) | 0,961 (0,11) |
| bipartite matching | 250 (3) | 147 (0) | 1,175 (0,15) | 1 (0) | 1,425 (0,043) | 0,022 (0,002) |
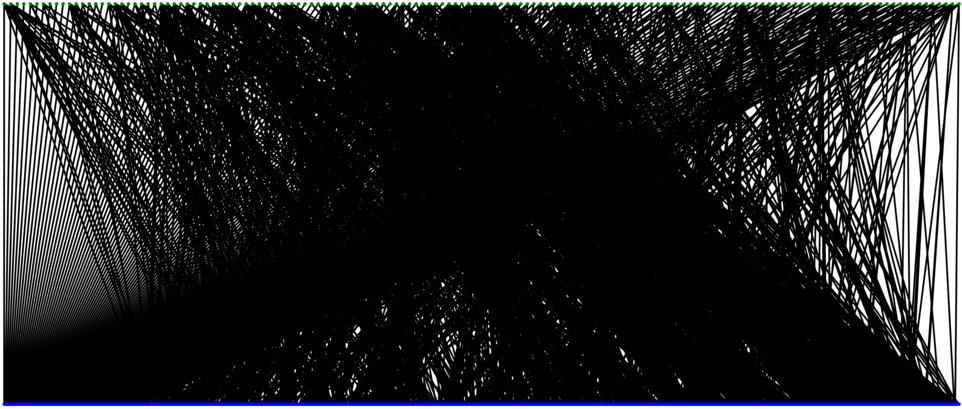
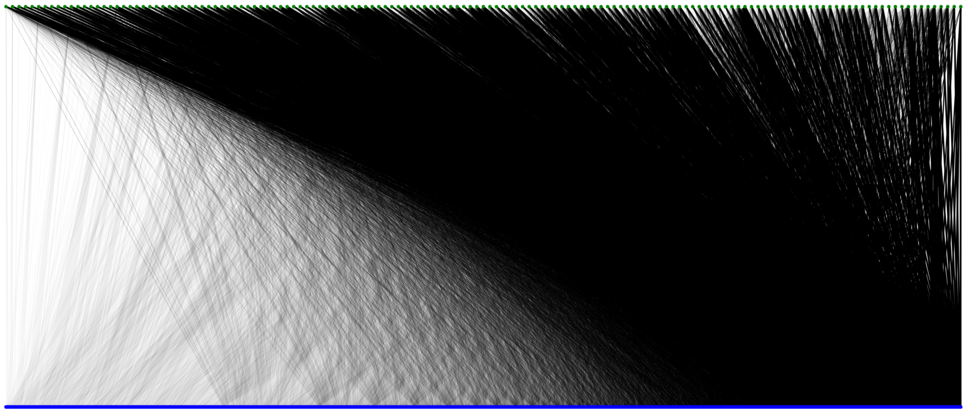
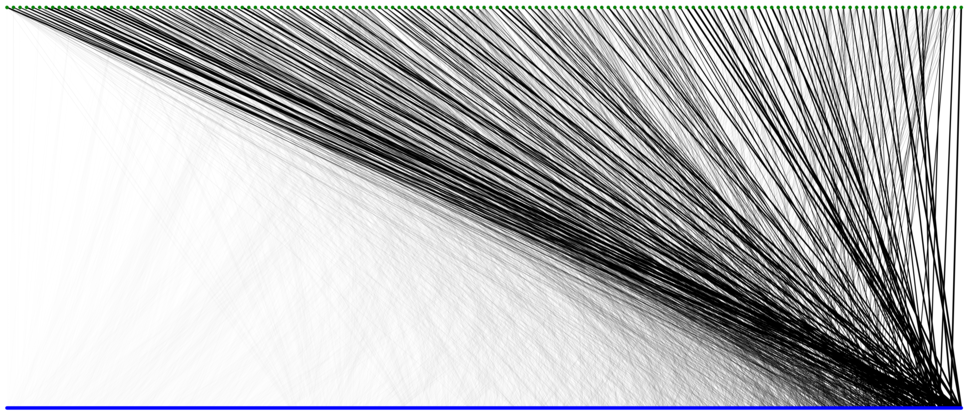
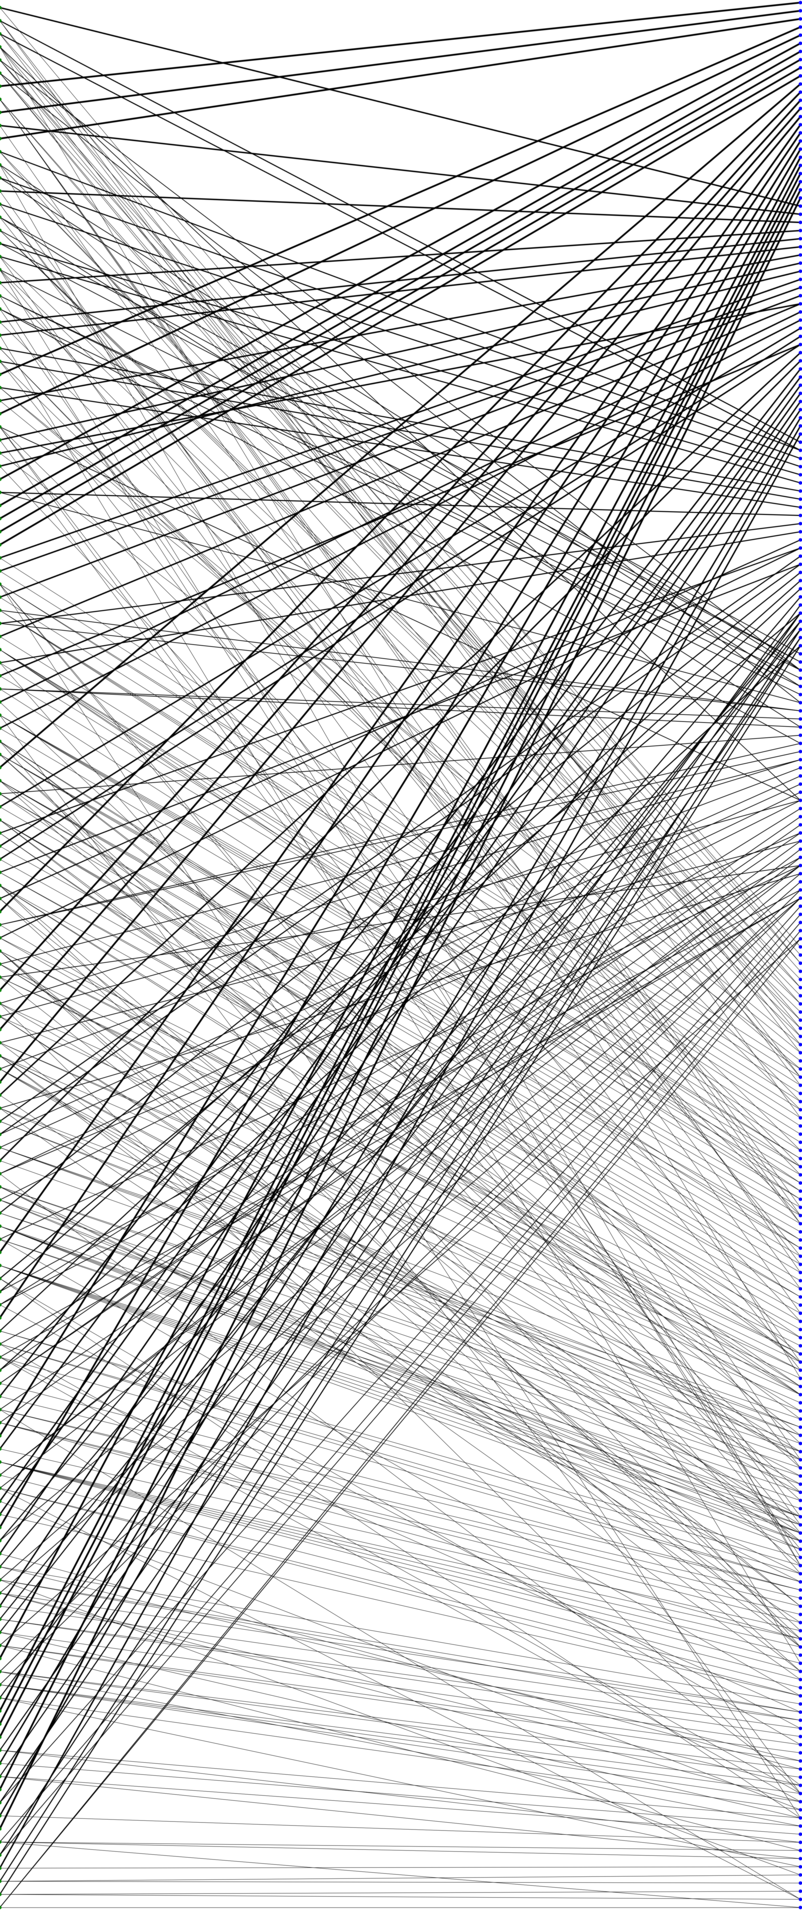
We can now introduce a weighted graphs which aggregate realisations of the probabilistic graph. For the simple networks, nodes remain constant. Hence, we link two nodes if for any of the replications they were connected. The weight of the link is exactly the number of occurrences of the link in the experiment. We can introduce bipartite networks in nearly the same way. The only difference is that for rides nodes, we must take union of all rides which occurred in any replication. The introduced graph structures are presented in the Figure 3. Width of the link proportionally depends on the weight.


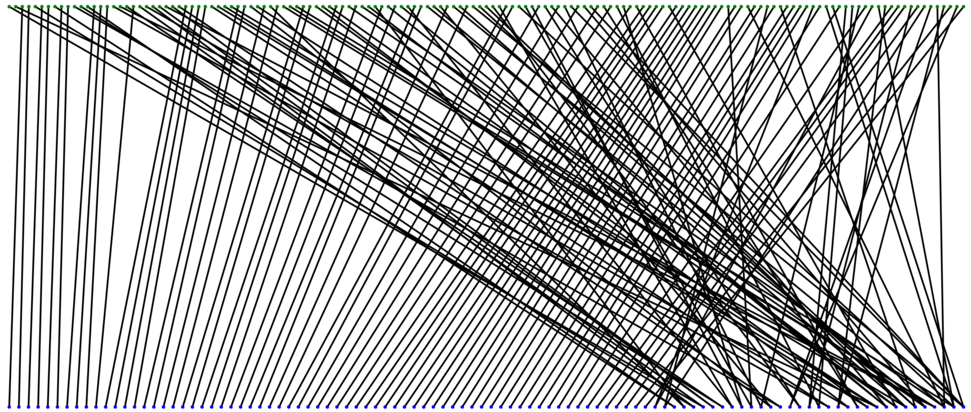
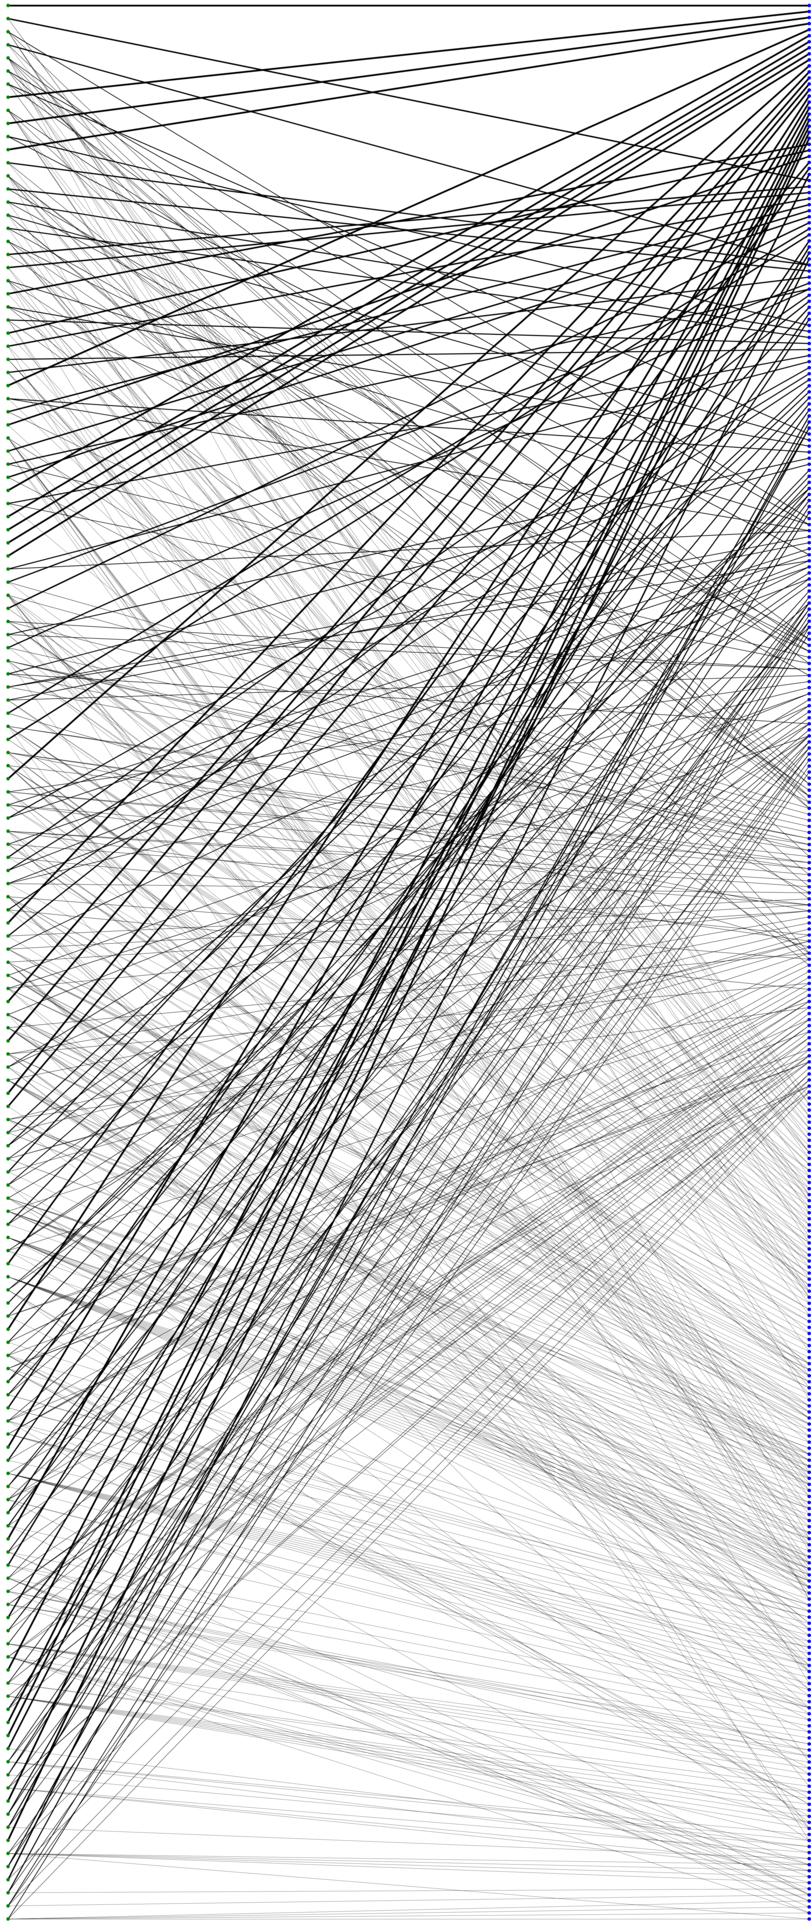
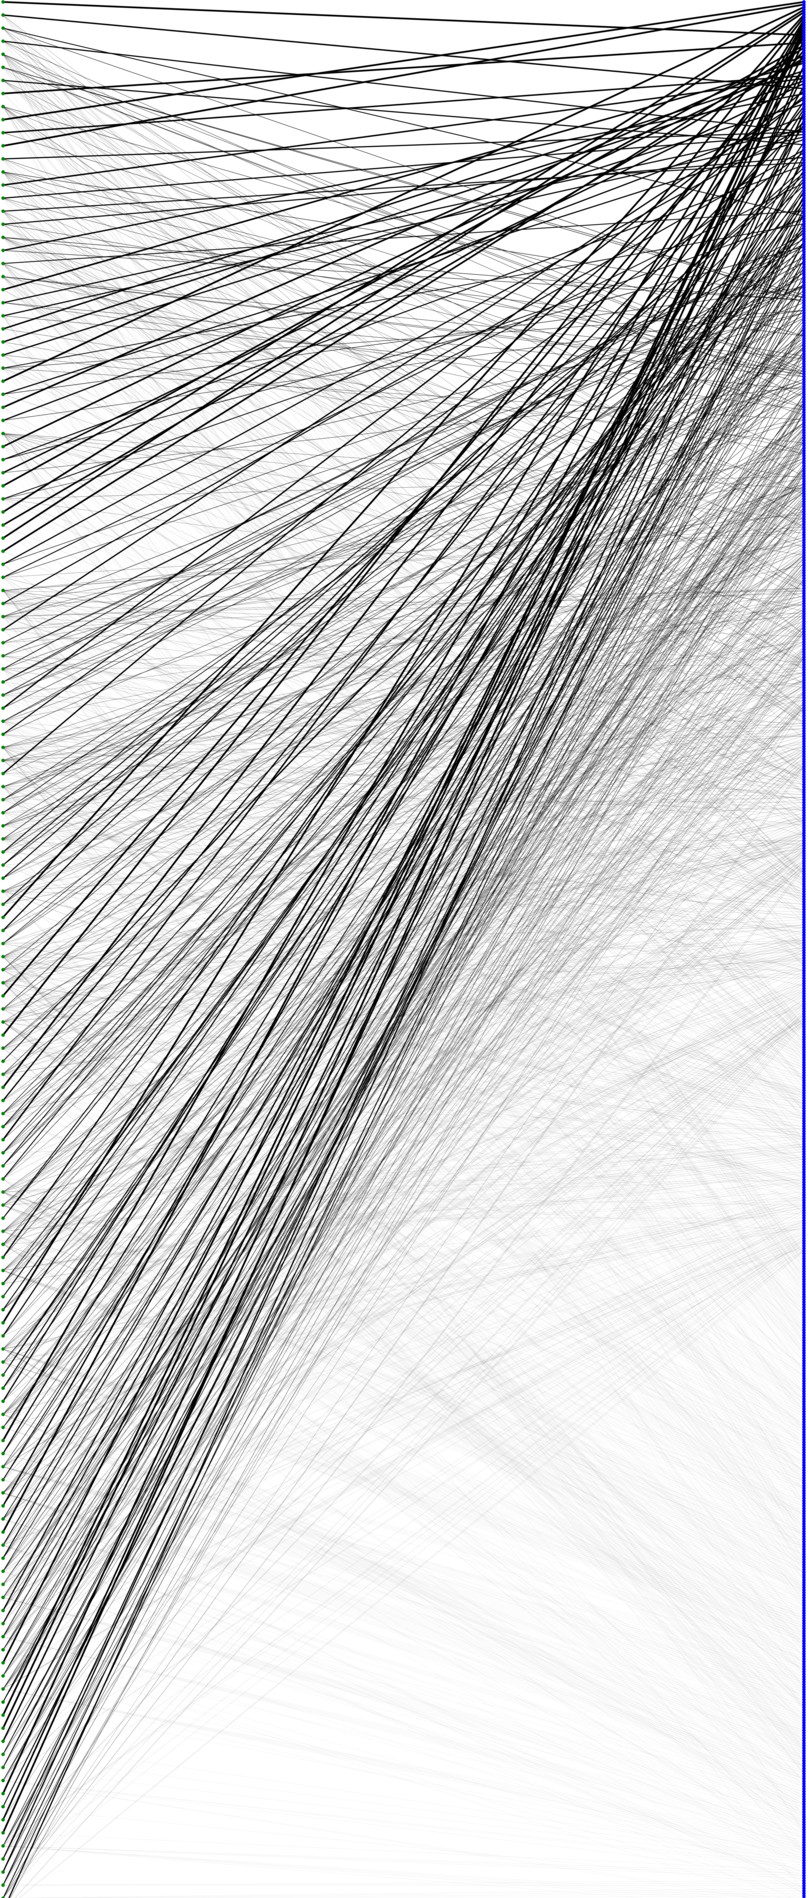
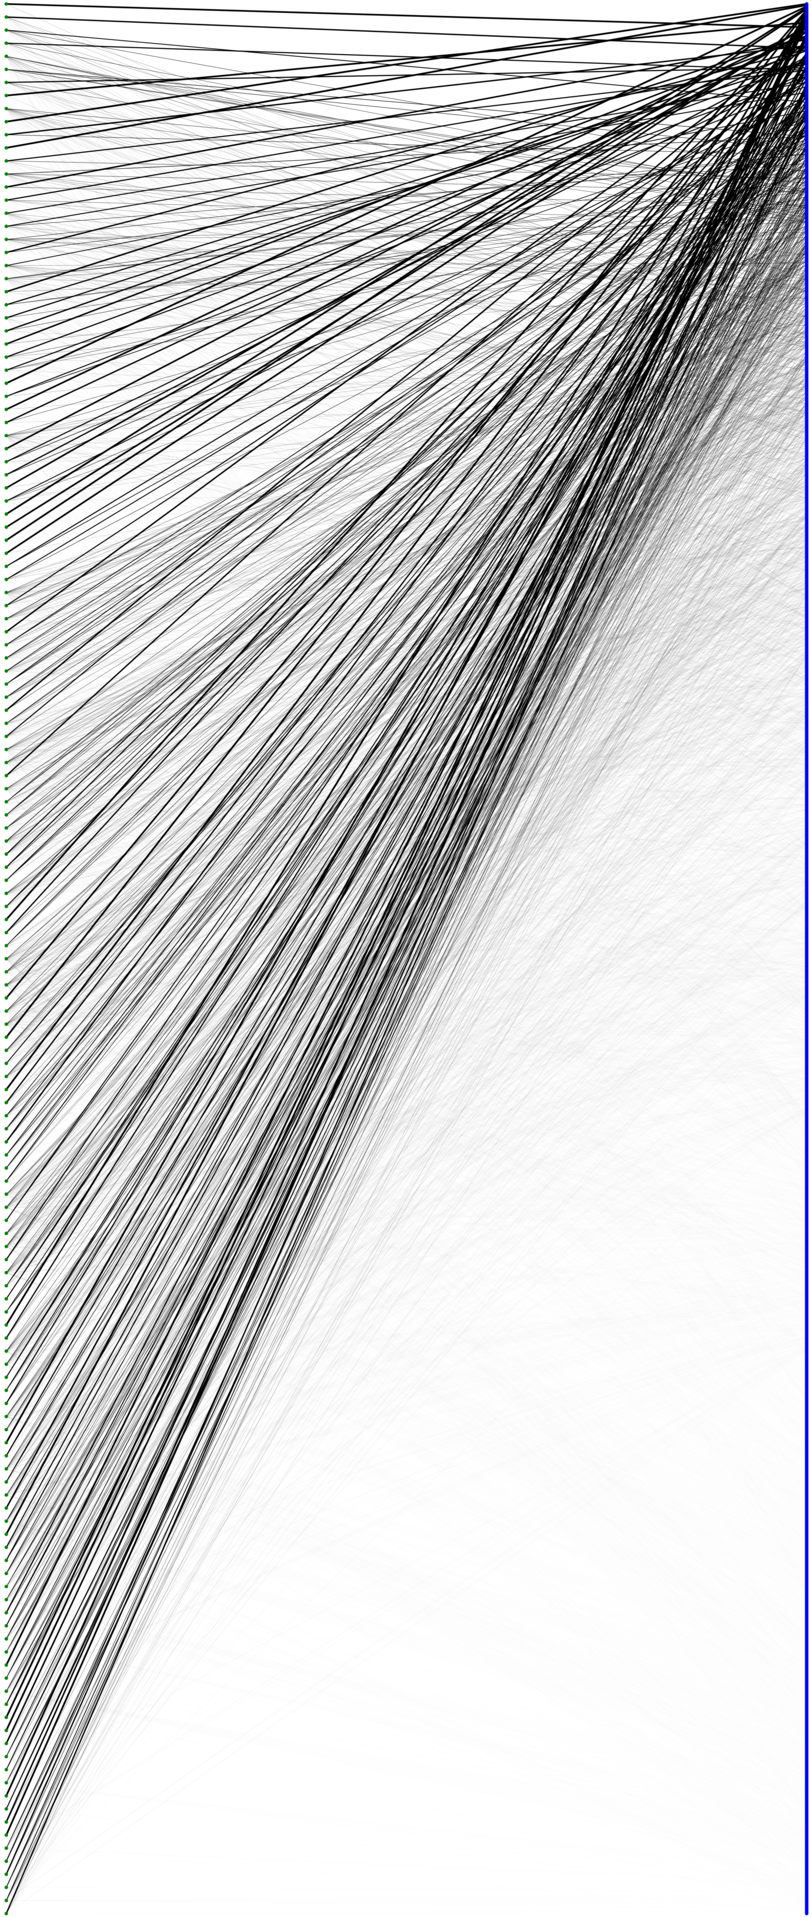
Intrigued by the structure of graphs in the Figure 3, we investigated the evolution of bipartite shareability networks. Figure 4 presents weighted graphs constructed after a certain part of the simulation. We have found that even in the latter replications, new ride nodes appeared. Those nodes usually correspond to high order rides, where travellers are matched thanks to positive realisations of the random noise. Considering the fact that the solution is optimal with respect to saved vehicle hours, attractive high order rides are likely to be assigned in the final matching. Nonetheless, we can see that there are certain rides which remain attractive and assigned in nearly every replication.

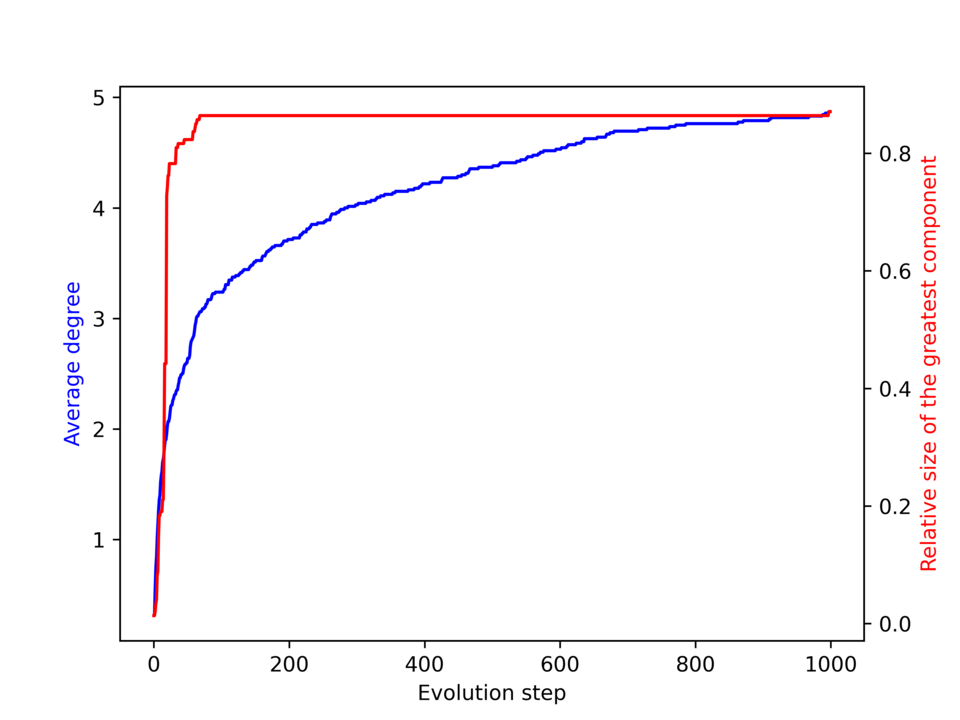
To gain more understanding of evolution in the Figure 4, we investigated properties of the (weakly) growing weighted matching graph in the non-bipartite form. Figure 5 resents how the average node degree and relative size of the greatest component grow. Those properties have a direct, physical interpretation and application. Average degree (blue) of the node reflects the average number of pairwise distinct co-travellers that a traveller meets within the realisations. Size of the greatest component (red) gives an upper boundary for spreading in the network starting in one point (to obtain exact results we should translate our partial results to temporal graph).
4 Conclusions
We have presented four ways to represent the networks resulting from ride-pooling problems. In the first type of the networks, each node corresponds to a traveller. Second representation incorporates also rides as nodes, enabling an exhaustive representation for the feasibility network.
Considering individual preferences not captured by a deterministic model, we introduce a random noise assigned to each traveller. As a result, within each replication we got different realisations of the random variables. We analyse the introduced variability in the context of structural properties of networks. Weighted graphs representing the estimated probability of occurrence of a link yield new form of networks in ride-pooling. Tracking evolution of the graphs gave us a better understating of the stability of the underlying structures. In future works, we plan to focus on the communities and analysing spreading patterns in the network.
Acknowledgements
This research was funded by National Science Centre in Poland program OPUS 19 (Grant Number 2020/37/B/HS4/01847).
References
- Agatz et al. (2011) Niels Agatz, Alan L Erera, Martin WP Savelsbergh, and Xing Wang. Dynamic ride-sharing: A simulation study in metro atlanta. Procedia-Social and Behavioral Sciences, 17:532–550, 2011.
- Alonso-González et al. (2021) María J Alonso-González, Oded Cats, Niels van Oort, Sascha Hoogendoorn-Lanser, and Serge Hoogendoorn. What are the determinants of the willingness to share rides in pooled on-demand services? Transportation, 48(4):1733–1765, 2021.
- Alonso-Mora et al. (2017) Javier Alonso-Mora, Samitha Samaranayake, Alex Wallar, Emilio Frazzoli, and Daniela Rus. On-demand high-capacity ride-sharing via dynamic trip-vehicle assignment. Proceedings of the National Academy of Sciences, 114(3):462–467, 2017.
- Bischoff et al. (2017) Joschka Bischoff, Michal Maciejewski, and Kai Nagel. City-wide shared taxis: A simulation study in berlin. In 2017 IEEE 20th international conference on intelligent transportation systems (ITSC), pages 275–280. IEEE, 2017.
- Chan and Shaheen (2012) Nelson D Chan and Susan A Shaheen. Ridesharing in north america: Past, present, and future. Transport reviews, 32(1):93–112, 2012.
- Furuhata et al. (2013) Masabumi Furuhata, Maged Dessouky, Fernando Ordóñez, Marc-Etienne Brunet, Xiaoqing Wang, and Sven Koenig. Ridesharing: The state-of-the-art and future directions. Transportation Research Part B: Methodological, 57:28–46, 2013.
- Kang et al. (2021) Shuqing Kang, Aupal Mondal, Aarti C Bhat, and Chandra R Bhat. Pooled versus private ride-hailing: A joint revealed and stated preference analysis recognizing psycho-social factors. Transportation Research Part C: Emerging Technologies, 124:102906, 2021.
- Kucharski and Cats (2020) Rafał Kucharski and Oded Cats. Exact matching of attractive shared rides (exmas) for system-wide strategic evaluations. Transportation Research Part B: Methodological, 139:285–310, 2020.
- Kucharski et al. (2021) Rafał Kucharski, Oded Cats, and Julian Sienkiewicz. Modelling virus spreading in ride-pooling networks. Scientific Reports, 11:1–11, 2021.
- Lavieri and Bhat (2019) Patrícia S Lavieri and Chandra R Bhat. Modeling individuals’ willingness to share trips with strangers in an autonomous vehicle future. Transportation research part A: policy and practice, 124:242–261, 2019.
- Lazarus et al. (2021) Jessica R Lazarus, Juan D Caicedo, Alexandre M Bayen, and Susan A Shaheen. To pool or not to pool? understanding opportunities, challenges, and equity considerations to expanding the market for pooling. Transportation Research Part A: Policy and Practice, 148:199–222, 2021.
- Santi et al. (2014) Paolo Santi, Giovanni Resta, Michael Szell, Stanislav Sobolevsky, Steven H Strogatz, and Carlo Ratti. Quantifying the benefits of vehicle pooling with shareability networks. Proceedings of the National Academy of Sciences, 111(37):13290–13294, 2014.
- Tachet et al. (2017) R Tachet, O Sagarra, P Santi, G Resta, M Szell, S H Strogatz, and C Ratti. Scaling Law of Urban Ride Sharing. Nature Publishing Group, pages 1–6, 2017. 10.1038/srep42868. URL http://dx.doi.org/10.1038/srep42868.