06304 Nice cedex 4, France
11email: he.zhao@oca.eu, mathias.schultheis@oca.eu 22institutetext: Purple Mountain Observatory, Chinese Academy of Sciences, Nanjing 210023, PR China 33institutetext: Faculty of Mathematics and Physics, University of Ljubljana, Jadranska 19, 1000 Ljubljana, Slovenia 44institutetext: Max Planck Institute for Astronomy, Königstuhl 17, 69117 Heidelberg, Germany 55institutetext: GEPI, Observatoire de Paris, Université PSL, CNRS, 5 Place Jules Janssen, 92190 Meudon, France 66institutetext: Mullard space science laboratory, University College London, Holmbury St Mary, Dorking, Surrey, RH5 6NT, United Kingdom 77institutetext: Royal Observatory of Belgium, 3 avenue circulaire, 1180 Brussels, Belgium 88institutetext: INAF - Osservatorio astronomico di Padova, Vicolo Osservatorio 5, 35122 Padova, Italy 99institutetext: INAF - Osservatorio Astrofisico di Torino, via Osservatorio 20, 10025 Pino Torinese (TO), Italy 1010institutetext: IRAP, Université de Toulouse, CNRS, UPS, CNES, 9 Av. colonel Roche, BP 44346, 31028 Toulouse Cedex 4, France 1111institutetext: CIGUS CITIC - Department of Computer Science and Information Technologies, University of A Coruña, Campus de Elviña s/n, A Coruña, 15071, Spain 1212institutetext: Université de Strasbourg, CNRS, Observatoire astronomique de Strasbourg, UMR 7550, 11 rue de l’Université, 67000 Strasbourg, France 1313institutetext: CNES Centre Spatial de Toulouse, 18 avenue Edouard Belin, 31401 Toulouse Cedex 9, France
Solid confirmation of the broad DIB around 864.8 nm using stacked Gaia–RVS spectra
Abstract
Context. Studies of the correlation between different diffuse interstellar bands (DIBs) are important for exploring their origins. However, the Gaia–RVS spectral window between 846 and 870 nm contains few DIBs, the strong DIB at 862 nm being the only convincingly confirmed one.
Aims. Here we attempt to confirm the existence of a broad DIB around 864.8 nm and estimate its characteristics using the stacked Gaia–RVS spectra of a large number of stars. We study the correlations between the two DIBs at 862 nm (862) and 864.8 nm (864.8), as well as the interstellar extinction.
Methods. We obtained spectra of the interstellar medium (ISM) absorption by subtracting the stellar components using templates constructed from real spectra at high Galactic latitudes with low extinctions. We then stacked the ISM spectra in Galactic coordinates () —pixelized by the HEALPix scheme— to measure the DIBs. The stacked spectrum is modeled by the profiles of the two DIBs, Gaussian for 862 and Lorentzian for 864.8, and a linear continuum. We report the fitted central depth (CD), central wavelength, equivalent width (EW), and their uncertainties for the two DIBs.
Results. We obtain 8458 stacked spectra in total, of which 1103 (13%) have reliable fitting results after applying numerous conservative filters. This work is the first of its kind to fit and measure 862 and 864.8 simultaneously in cool-star spectra. Based on these measurements, we find that the EWs and CDs of 862 and 864.8 are well correlated with each other, with Pearson coefficients () of 0.78 and 0.87, respectively. The full width at half maximum (FWHM) of 864.8 is estimated as nm which compares to nm for 862. We also measure the vacuum rest-frame wavelength of 864.8 to be nm, smaller than previous estimates.
Conclusions. We find solid confirmation of the existence of the DIB around 864.8 nm based on an exploration of its correlation with 862 and estimation of its FWHM. The DIB 864.8 is very broad and shallow. That at 862 correlates better with than 864.8. The profiles of the two DIBs could strongly overlap with each other, which contributes to the skew of the 862 profile.
Key Words.:
ISM: lines and bands1 Introduction
Diffuse interstellar bands (DIBs) are a set of absorption features with profiles that are much broader than those of the interstellar atomic lines (e.g., Na i lines). To date, over 600 DIBs have been identified at optical and near-infrared wavelengths (0.4–2.4 ; Galazutdinov et al. 2017, Fan et al. 2019). However, our knowledge about their origins is still very limited. So far, only has been confirmed as the carrier for five DIBs between 930 and 965 nm (see Linnartz et al. 2020 for a review). Gas-phase carbon-bearing molecules are thought to be the most probable DIB carriers (e.g., Snow 2014).
Despite the unknown nature of DIBs, absorption intensity maps have been built for several such features detected in large spectroscopic surveys (e.g., Kos et al. 2014; Zasowski et al. 2015; Baron et al. 2015b; Lan et al. 2015; Puspitarini et al. 2015) in order to explore the interstellar medium (ISM) and Galactic structure. Among them, the latest map was built for the DIB at 862 nm (DIB ) using data from the Gaia Radial Velocity Spectrometer (RVS; Gaia collaboration, Seabroke et al. 2022) in Data Release 3, which has the largest sky coverage to date (see Gaia collaboration, Schultheis et al. 2022 for more details). Their wavelengths and line widths are expressed in nanometers following the unit used in the Gaia analysis, while their strength is still expressed in Ångströms due to their small line depth (6%). The mentioned wavelengths in this paper are in the vacuum.
Studies of the correlation between different DIBs are important for identifying their origins (e.g., Friedman et al. 2011; Elyajouri et al. 2017). However, such studies are difficult for 862 because the RVS spectral window (846–870 nm) has very few DIBs. In the review of possible DIBs in this region by Munari et al. (2008), the most promising one was thought to be located around 864.8 nm (864.8) with a very shallow profile. 864.8 was first reported by Sanner et al. (1978) following positive support from Herbig & Leka (1991), Jenniskens & Desert (1994), and Wallerstein et al. (2007). This DIB was clearly seen in spectra of early-type stars, but its analysis is complex because of the wing of the hydrogen Paschen 13 line and other stellar components. On the other hand, this band was not reported by Fan et al. (2019). Krełowski et al. (2019) argued that this feature was of stellar origin (He i lines) as it did not correlate with dust extinction. However, Baron et al. (2015a) confirmed weak correlations between dust extinction and many DIBs, which weakens this argument. Furthermore, a position correlation with dust extinction could be seen around 865 nm in Fig. 2 in Baron et al. (2015a), strengthening the DIB hypothesis for this feature.
In this work, we use the unique set of Gaia–RVS spectra of cool stars observed over the whole sky which has just been published as part of the third Gaia data release (DR3; Gaia Collaboration et al. 2016; Gaia Collaboration, Vallenari et al. 2022). We aim to confirm 864.8 as a broad DIB rather than a stellar component by the use of stacked Gaia–RVS spectra to detect it and then analysis of its correlations with dust extinction and DIB 862.
2 Data
The Gaia–RVS spectra have a wavelength coverage of [] nm and a medium resolution of (Cropper et al. 2018). The stellar parameters and chemical abundances, including effective temperature (), surface gravity (), mean metallicity (), and individual abundances of up to 13 chemical species, are derived by the General Stellar Parametrizer from spectroscopy (GSP-Spec) module of the Astrophysical parameters inference system (Apsis, Gaia collaboration, Creevey et al. 2022; Gaia collaboration, Recio-Blanco et al. 2022). We refer to Gaia collaboration, Recio-Blanco et al. (2022) for detailed descriptions of the parametrization and a validation of the measurement of 862 in individual RVS spectra.
About one million Gaia–RVS spectra have been published in Gaia DR3. We use a sample of 648 944 spectra that meet the following criteria (given as an ADQL query example in Appendix A):
-
1.
Stellar parameters (, , ) and radial velocity () are not NaN values.
-
2.
K and dex.
-
3.
Stellar distances derived from parallax measurements () are within 6 kpc.
-
4.
The signal-to-noise ratios (S/N) of the observed spectra are greater than 20.
-
5.
The uncertainty of is smaller than 5 .
This work processes stars with K, defined as “cool stars”. The whole sample is separated into two parts: 75 941 “reference spectra” at high latitudes () and with low extinctions ( mag) are used to construct the stellar templates for the cool stars; the other 573 003 are the “target spectra” in which we attempt to fit and measure the two DIBs. The reddening used in this work was derived by the GSP-Phot module using their BPRP spectra (Gaia collaboration, Andrae et al. 2022). Our sample uses about one-tenth of the total RVS spectra processed by GSP-Spec (Gaia collaboration, Recio-Blanco et al. 2022). Kos et al. (2013) and Lan et al. (2015) made use of a similar number of spectra in their studies. Baron et al. (2015a, b) used over 1.5 million extragalactic spectra. The large samples enable us to measure very weak DIBs by binning the spectra in large numbers.
3 Method
This work is the first of its kind to fit and measure 862 and 864.8 simultaneously in cool-star spectra. To do so, first we derive the ISM spectrum for each target by subtracting their stellar components using the reference spectra. We then stack the ISM spectra of the targets according to their Galactic coordinates (), per HEALPix. Finally we fit and measure the two DIBs, and , in the stacked spectra.
The first step follows the main principles of Kos et al. (2013). For a given target, we find a set of reference spectra with similar parameters to the GSP-spec values of the target that have , dex, and dex. These ranges are arbitrary, but chosen to be larger than the parameter uncertainties (Kos et al. 2013). The constraints on the stellar parameters are not necessary but they can speed up the procedure. The similarity between the target spectrum and each reference spectrum is then calculated as the average absolute difference of their flux at all pixels, except a masked region of 860–868 nm where the two DIBs are located. When measuring the difference, the central regions of the Ca ii triplet are down-weighted to 30% because Ca ii lines dominate the whole Gaia–RVS spectra of cool stars whereas the similarity between Fe i lines (close to DIBs) is more important than between the Ca ii lines for constructing the templates (see examples in Contursi et al. 2021). In practice, the two Ca ii regions of concern are defined as 849.43–851.03 nm and 853.73–855.73 nm and are down-weighted. The Ca ii line near 866.5 nm is within the masked DIB region. Reference spectra with average differences of greater than the inverse of the square of the target S/N are discarded. For the rest, up to 500 (and at least 10) best-matching reference spectra are averaged and weighted by their S/N in order to build a stellar template. The target spectrum divided by the template then gives the ISM spectrum for this target. An illustration of this method can be found in Fig. 2 in Kos et al. (2013). Examples of RVS spectra and successful measurements of the DIB in individual RVS spectrum can be found in Gaia collaboration, Recio-Blanco et al. (2022).
In the second step, the ISM spectra are stacked according to their Galactic coordinates () to get a sufficiently high S/N for a reliable measurement of 864.8. The pixelation of the sky is done by the HEALPix111https://healpix.sourceforge.io (Górski et al. 2005) scheme. We choose level 5 (), corresponding to 12 288 pixels and a spatial resolution about . We note that 8458 HEALPix pixels (69% of the total) contain at least ten targets that have ISM spectra (). In each of these pixels, we stack all of the ISM spectra (54 on average with a maximum of 362) to generate one stacked spectrum. We stack the ISM spectra in each pixel by taking the median value of the fluxes in order to reduce the influence of outliers. The flux uncertainty of the stacked spectrum is the mean of the individual flux uncertainties divided by , which is the standard error in the mean. The S/N of the stacked spectra is calculated between 860.2 and 861.2 nm as . We have 8458 stacked spectra in total, one for each HEALPix pixel.
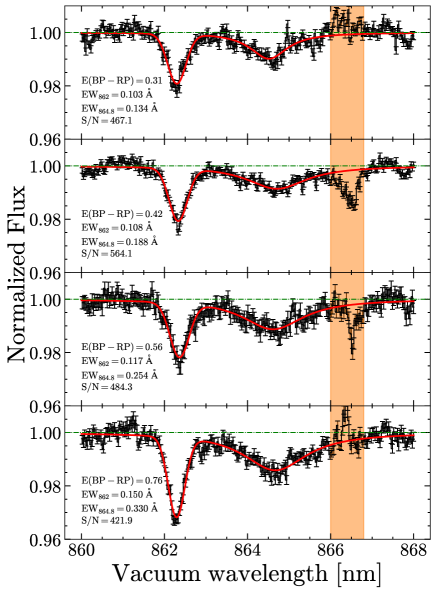
In the third and final step, a Markov chain Monte Carlo (MCMC) procedure (Foreman-Mackey et al. 2013) is used to fit each stacked spectrum between 860 and 868 nm (the DIB region) with a Gaussian function for the profile of 862, a Lorentzian function (better than Gaussian when considering the goodness of fit to the line wings) for the profile of 864.8, and a linear function for the continuum placement, masking 866–866.8 nm for the Ca ii line residuals. The best estimates and statistical uncertainties are taken in terms of the 50th, 16th, and 84th percentiles of the posterior distribution. We note that the Ca ii region slightly changes after the shifting to the heliocentric frame, considering that the radial velocities of most stars lie mainly within 50 , corresponding to nm at 866.5 nm. Furthermore, the wings of the Ca ii lines are better modeled than their central parts (Gaia collaboration, Creevey et al. 2022; Gaia collaboration, Recio-Blanco et al. 2022). Thus, our masked region can properly prevent contamination by the Ca ii residuals and consequently the 864.8 profile can be fitted well. Figure 1 shows four fitting examples sorted by the median in each HEALPix pixel. The fitting results for all stacked spectra are available online.
Besides the fitted central depth (CD) and central wavelength () of the DIB profiles, the full width at half maximum (FWHM) and equivalent width (EW) are also calculated. The EW errors are estimated by the span of the profile (3FWHM), the pixel resolution ( nmpixel), and the noise level of the line center (), as , similar to the formulas given by Vos et al. (2011) and Vollmann & Eversberg (2006).
4 Results
The aforementioned fit of the DIB was done for each of the 8458 stacked spectra (one per HEALPix pixel). To get reliable results, we only retain the stacked spectra that meet the following criteria, which leaves us with 1962 spectra:
-
•
S/N of the stacked ISM spectrum is greater than 100.
-
•
and .
-
•
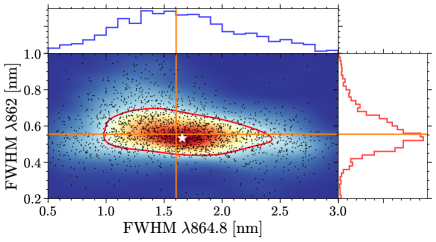
The FWHM of and are greater than 0.2 nm and 0.5 nm, respectively.
Figure 2 shows the distributions of the FWHM of and , as well as their joint distribution, for the 1962 stacked spectra. The FWHM of has a much wider distribution than that of 862, and both slightly deviate from a Gaussian. We apply a Gaussian kernel density estimation (KDE) to their joint distribution with a bandwidth of 0.2826 nm (automatically determined by the Python package scipy). The median FWHM is to the upper left of the peak density estimated by the KDE (white star in Fig. 2), which is caused by the fits to some very shallow profiles that result in broader 862 and narrower 864.8. The outliers in low-density regions are due to the noise in stacked spectra.
Therefore, we discard the points that lie in the region with a density of less than 1.2 (red line in Fig. 2), which is about one-third of the peak density. After this final filtering, our sample comprises 1103 reliable measurements of the two DIBs, about 13% of the total stacked spectra.
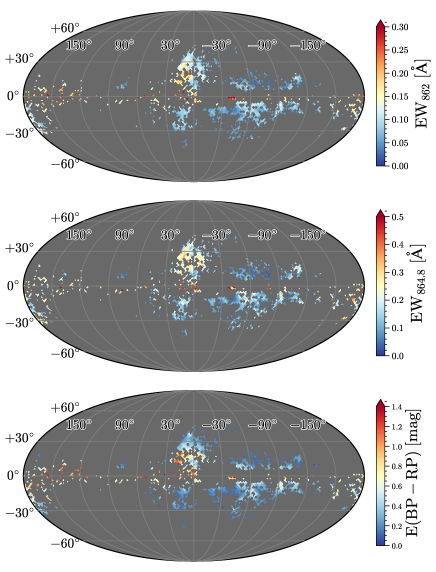
The two-dimensional intensity map of and as well as are shown in Galactic coordinates in Fig. 3. Limited by our sample, the spatial distributions of and cannot be well described. However, it is clear that large EWs for both and concentrate in the Galactic plane. Furthermore, decreasing and with latitude (up to ) can be found near Galactic center (GC, ), which are similar to each other and that of .
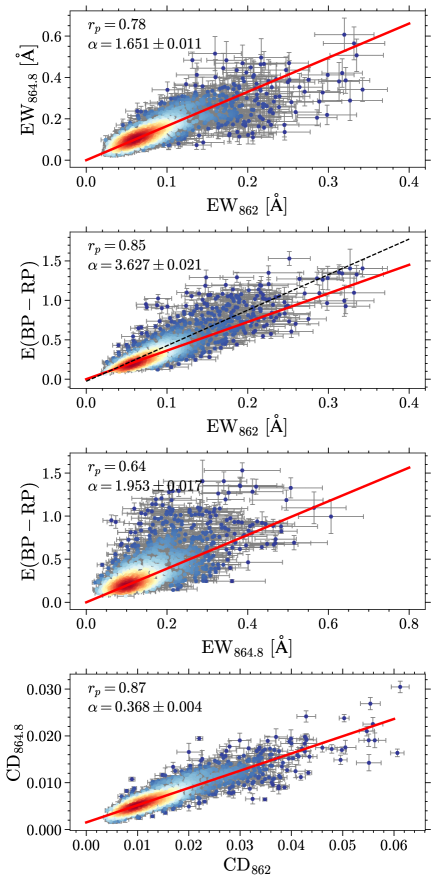
Intensity correlations between , , and are shown in Fig. 4. For , we use to represent its uncertainty in each HEALPix pixel. and are well correlated with each other with a Pearson coefficient of . A systematic deviation can be seen when Å. The cause of this is unclear: either it has a physical origin or is due to the FWHM dispersion seen in Fig. 2. To avoid this effect, we apply simple linear fits with 2 clipping and zero intercept for EWs and dust reddening, resulting in the following relations:
| (1) |
We also apply the linear fits without any clipping. For the two DIBs, the coefficient from the no-clipping fit becomes 6% lower () for their EWs and 5% lower () for their CDs, compared to the 2-clipped results. The relative strength between DIB and dust is 13% above for 862 () and 21% above for 864.8 (), respectively, when not clipping. This is not surprising, as significant scatter about the fit can be found around mag and Å. Similar scatter exists for 864.8 as well, but this latter is more significant. This scattering could be a result of the overestimation of as seen in Fig. 7 in Gaia collaboration, Schultheis et al. (2022). We prefer the 2-clipped results because the scattering is not only caused by the measurement uncertainties but may indicate a spatial disconnection between their carriers and dust grains. Thus, the fitted coefficients with a strong filtering would represent their mean relative strength in the regions where these ISM materials are well mixed.
Compared to EWs, the CDs of the two DIBs are better correlated with each other with and no systematic deviations. The depth of 864.8 is about 37% of that of 862, while its EW is over 1.6 times . We note that shows good correlation with with as expected, but their relative strength is about 20% below that derived from the DIB sample in Gaia–DR3 (, Gaia collaboration, Schultheis et al. 2022). The reason could be that different templates —from GSP-Spec and from reference spectra— would introduce differences in EW measurements (see e.g., Elyajouri & Lallement 2019). It should also be noted that fitted in this work with no clipping is closer to the result in Gaia collaboration, Schultheis et al. (2022, 9% difference) where the authors did not make any filtering either. Also, 864.8 does not correlate as well as 862 with showing a much smaller and a larger dispersion.
In a similar manner to Munari et al. (2008) and Zhao et al. (2021), in order to estimate the rest-frame wavelength () of 864.8, we assume that the median radial velocity in the Local Standard of Rest of the DIB carrier is zero toward the GC. There are 43 cases with , , and small uncertainties in (0.1 nm for 862 and 0.15 nm for 864.8). For 862, we derive a of nm, which is highly consistent with the result of nm in Gaia collaboration, Schultheis et al. (2022). For 864.8, we derive nm in the vacuum, corresponding to 864.29 nm for air wavelength. This result is smaller than the commonly suggested air wavelength measured in the spectra of early-type stars, such as 865.0 nm (Sanner et al. 1978), 864.9 nm (Herbig & Leka 1991), and 864.83 nm (Jenniskens & Desert 1994).
5 Discussion
Until now, the FWHM of the 864.8 feature has not been well determined. Sanner et al. (1978) noted that this DIB profile extends from 863 to 866 nm and its strength did not correlate with spectral type, but they did not measure its FWHM. We found two measurements of FWHM 864.8 in the literature that are dramatically different from each other: 1.4 nm by Herbig & Leka (1991) and 0.42 nm by Jenniskens & Desert (1994). The difficulty is that this band is shallow and superposed across several blended stellar lines, such as the He i line at 864.83 nm in early B-type supergiants (Herbig & Leka 1991). This may be the reason why a stellar origin has been claimed in the literature (Krełowski et al. 2019). In this work, we made use of the spectra of cool stars, and subtracted the stellar lines (mainly Fe i and Ca ii) using reference spectra. This makes our measurements more accurate than those previous works based on hot-star spectra. We find 864.8 to be a very broad and shallow DIB with a FWHM of nm, which is not significantly less than the strongest DIB at 442.8 nm (e.g., 1.7 nm; Galazutdinov et al. 2020). This provides strong evidence for the DIB interpretation of this line because no known stellar components or Doppler broadening (a velocity dispersion over 600 ) can explain such a large width. On the other hand, the derived FWHM of 862 in this work is nm, which is slightly larger than previously reported values such as 0.43 nm (Herbig & Leka 1991), 0.47 nm (Maíz Apellániz 2015), and 0.37 nm (Fan et al. 2019). The increase in FWHM could be explained by a Doppler broadening caused by our stacking strategy, with a velocity dispersion about 30–50 . This value is consistent with the average magnitude of the dispersion in each pixel (about 36 ) which can be treated as an upper limit to the velocity dispersion of the DIB clouds, because closer objects should have a smaller radial velocity than the background stars.
Although the DIB profile could be broadened due to the superposition effect, our stacking has only a very weak influence on EW measurements, because DIBs are weak spectral features and we are therefore in a linear regime where the EW produced by multiple DIB clouds can be simply added up (Munari & Zwitter 1997). The linear correlation between and provides good evidence for a DIB interpretation of this line, in spite of the superposition effect, because the stellar components or their residuals cannot have such a behavior with interstellar features. Another important point is that the profiles of the two DIBs could be overlapped with each other. Therefore, it is better to measure the two DIBs simultaneously; although this requires a very high S/N.
Limited by our sample and the conservative approach to filtering it, further analysis of the two DIBs —such as the kinematics of their carriers and the nature of the Lorentzian profile of 864.8— is not feasible. Nevertheless, it is significant to confirm a second DIB close to the strong one 862 in such a big spectroscopic survey, which enables us to use them as tracers of the ISM environment if they have different origins, or facilitates the study of their origin if they share a common carrier (with two DIBs, their relative strength and central wavelengths could provide clues as to their carrier). Dedicated research into these two DIBs will be carried out using all available RVS spectra and the results will be published in next Gaia data release.
6 Conclusions
Based on the measurements in 1103 stacked Gaia–RVS spectra, we provide solid confirmation of the DIB around 864.8 nm through its correlation with 862 and its clear and broad profile in the stacked spectra. 864.8 is a very broad and shallow DIB. The FWHM of 864.8 is estimated to be nm. Using 43 high-quality measurements toward GC (, ), the rest-frame wavelength of 864.8 is determined as nm in the vacuum, which is smaller than previous reported measurements. correlates better with than .
Our work shows the power of using a large set of cool-star spectra to study the DIBs in the ISM. The extremely small depth of these lines (%) and the ability to assess their properties is a clear demonstration of the quality of Gaia–RVS spectra as published in Gaia DR3.
Acknowledgements.
This work has made use of data from the European Space Agency (ESA) mission Gaia (https://www.cosmos.esa.int/gaia), processed by the Gaia Data Processing and Analysis Consortium (DPAC, https://www.cosmos.esa.int/web/gaia/dpac/consortium). Funding for the DPAC has been provided by national institutions, in particular the institutions participating in the Gaia Multilateral Agreement. This work was supported in part by: the German Aerospace Agency (DLR) grant 50 QG 2102; SFB 881 “The Milky Way System” of the German Research Foundation (DFG).References
- Baron et al. (2015a) Baron, D., Poznanski, D., Watson, D., et al. 2015a, MNRAS, 451, 332
- Baron et al. (2015b) Baron, D., Poznanski, D., Watson, D., Yao, Y., & Prochaska, J. X. 2015b, MNRAS, 447, 545
- Contursi et al. (2021) Contursi, G., de Laverny, P., Recio-Blanco, A., & Palicio, P. A. 2021, A&A, 654, A130
- Cropper et al. (2018) Cropper, M., Katz, D., Sartoretti, P., et al. 2018, A&A, 616, A5
- Elyajouri & Lallement (2019) Elyajouri, M. & Lallement, R. 2019, A&A, 628, A67
- Elyajouri et al. (2017) Elyajouri, M., Lallement, R., Monreal-Ibero, A., Capitanio, L., & Cox, N. L. J. 2017, A&A, 600, A129
- Fan et al. (2019) Fan, H., Hobbs, L. M., Dahlstrom, J. A., et al. 2019, ApJ, 878, 151
- Foreman-Mackey et al. (2013) Foreman-Mackey, D., Hogg, D. W., Lang, D., & Goodman, J. 2013, PASP, 125, 306
- Friedman et al. (2011) Friedman, S. D., York, D. G., McCall, B. J., et al. 2011, ApJ, 727, 33
- Gaia Collaboration et al. (2016) Gaia Collaboration, Prusti, T., de Bruijne, J. H. J., et al. 2016, A&A, 595, A1
- Gaia collaboration, Andrae et al. (2022) Gaia collaboration, Andrae, R., Fouesneau, M., Sordo, R., et al. 2022, arXiv e-prints, arXiv:2206.06138
- Gaia collaboration, Creevey et al. (2022) Gaia collaboration, Creevey, O. L., Sordo, R., Pailler, F., et al. 2022, arXiv e-prints, arXiv:2206.05864
- Gaia collaboration, Recio-Blanco et al. (2022) Gaia collaboration, Recio-Blanco, A., de Laverny, P., Palicio, P. A., et al. 2022, arXiv e-prints, arXiv:2206.05541
- Gaia collaboration, Schultheis et al. (2022) Gaia collaboration, Schultheis, M., Zhao, H., Zwitter, T., et al. 2022, arXiv e-prints, arXiv:2206.05536
- Gaia collaboration, Seabroke et al. (2022) Gaia collaboration, Seabroke et al. 2022, A&A
- Gaia Collaboration, Vallenari et al. (2022) Gaia Collaboration, Vallenari, A., Brown, A. G. A., Prusti, T., et al. 2022, arXiv e-prints, arXiv:2208.00211
- Galazutdinov et al. (2020) Galazutdinov, G., Bondar, A., Lee, B.-C., et al. 2020, AJ, 159, 113
- Galazutdinov et al. (2017) Galazutdinov, G. A., Lee, J.-J., Han, I., et al. 2017, MNRAS, 467, 3099
- Górski et al. (2005) Górski, K. M., Hivon, E., Banday, A. J., et al. 2005, ApJ, 622, 759
- Herbig & Leka (1991) Herbig, G. H. & Leka, K. D. 1991, ApJ, 382, 193
- Jenniskens & Desert (1994) Jenniskens, P. & Desert, F. X. 1994, A&AS, 106, 39
- Kos et al. (2013) Kos, J., Zwitter, T., Grebel, E. K., et al. 2013, ApJ, 778, 86
- Kos et al. (2014) Kos, J., Zwitter, T., Wyse, R., et al. 2014, Science, 345, 791
- Krełowski et al. (2019) Krełowski, J., Galazutdinov, G., Godunova, V., & Bondar, A. 2019, Acta Astron., 69, 159
- Lan et al. (2015) Lan, T.-W., Ménard, B., & Zhu, G. 2015, MNRAS, 452, 3629
- Linnartz et al. (2020) Linnartz, H., Cami, J., Cordiner, M., et al. 2020, Journal of Molecular Spectroscopy, 367, 111243
- Maíz Apellániz (2015) Maíz Apellániz, J. 2015, Mem. Soc. Astron. Italiana, 86, 553
- Munari et al. (2008) Munari, U., Tomasella, L., Fiorucci, M., et al. 2008, A&A, 488, 969
- Munari & Zwitter (1997) Munari, U. & Zwitter, T. 1997, A&A, 318, 269
- Puspitarini et al. (2015) Puspitarini, L., Lallement, R., Babusiaux, C., et al. 2015, A&A, 573, A35
- Sanner et al. (1978) Sanner, F., Snell, R., & vanden Bout, P. 1978, ApJ, 226, 460
- Snow (2014) Snow, T. P. 2014, in The Diffuse Interstellar Bands, ed. J. Cami & N. L. J. Cox, Vol. 297, 3–12
- Vollmann & Eversberg (2006) Vollmann, K. & Eversberg, T. 2006, Astronomische Nachrichten, 327, 862
- Vos et al. (2011) Vos, D. A. I., Cox, N. L. J., Kaper, L., Spaans, M., & Ehrenfreund, P. 2011, A&A, 533, A129
- Wallerstein et al. (2007) Wallerstein, G., Sandstrom, K., & Gredel, R. 2007, PASP, 119, 1268
- Zasowski et al. (2015) Zasowski, G., Ménard, B., Bizyaev, D., et al. 2015, ApJ, 798, 35
- Zhao et al. (2021) Zhao, H., Schultheis, M., Rojas-Arriagada, A., et al. 2021, A&A, 654, A116
Appendix A ADQL queries
SELECT *
FROM gaiadr3.astrophysical_parameters AS gaia
INNER JOIN gaiadr3.gaia_source AS xmatch
ON gaia.source_id = xmatch.source_id
WHERE (xmatch.has_rvs=’T’ AND gaia.teff_gspspec > 3500 AND gaia.teff_gspspec < 7500
AND gaia.logg_gspspec < 6 AND xmatch.parallax > 0.0 AND 1/xmatch.parallax < 6  AND
xmatch.radial_velocity_error < 5.0 AND  xmatch.rv_expected_sig_to_noise > 20.0 AND
gaia.mh_gspspec is NOT NULL)