11email: csanchez@cab.inta-csic.es 22institutetext: Observatorio Astronómico Nacional (IGN), Alfonso XII No 3, 28014 Madrid, Spain 33institutetext: Observatorio Astronómico Nacional (IGN), Ap 112, 28803 Alcalá de Henares, Madrid, Spain 44institutetext: Institut de Radioastronomie Millimetrique, 300 rue de la Piscine, 38406 Saint Martin d’Heres, France 55institutetext: Instituto de Fisica Fundamental (CSIC), C/ Serrano, 123, E-28006, Madrid, Spain
Dissecting the central regions of OH 231.84.2 with ALMA: a salty rotating disk at the base of a young bipolar outflow
We present Atacama Large Millimeter/submillimeter Array (ALMA) continuum and molecular line emission maps at 1 mm wavelength of OH 231.84.2, a well studied bipolar nebula around an Asymptotic Giant Branch (AGB) star, which is key to investigate the origin of the remarkable changes in nebular morphology and kinematics during the short transition from the AGB to the Planetary Nebula (PN) phase. The excellent angular resolution of our maps (20 mas 30 au) allows us to scrutinise the central nebular regions of OH 231.84.2, which hold the clues to unravel how this iconic object assembled its complex nebular architecture. We report, for the first time in this object and others of its kind (i.e. pre-PN with massive bipolar outflows), the discovery of a rotating circumbinary disk selectively traced by NaCl, KCl, and H2O emission lines. This represents the first detection of KCl in an oxygen-rich (O-rich) AGB circumstellar envelope (CSE). The rotating disk, of radius 30 au, lies at the base of a young bipolar wind traced by SiO and SiS emission (referred to as the SS-outflow), which also presents signs of rotation at its base. The NaCl equatorial structure is characterised by a mean rotation velocity of 4 km s-1 and extremely low expansion speeds, 3 km s-1. The SS-outflow has a predominantly expansive kinematics characterised by a constant radial velocity gradient of 65 km s-1 arcsec-1 at its base. Beyond 350 au, the gas in the SS-outflow continues radially flowing at a constant terminal speed of 16 km s-1. Our continuum maps reveal a spatially resolved dust disk-like structure perpendicular to the SS-outflow, with the NaCl, KCl and H2O emission arising from the disk’s surface layers. Within the disk, we also identify an unresolved point continuum source, which likely represents the central Mira-type star QX Pup enshrouded by a 3 component of hot (1400 K) freshly formed dust. The point source is slightly off-centered (by 6.6 mas) from the disk centroid, enabling us for the first time to place constraints to the orbital separation and period of the central binary system, 20 au and 55 yr, respectively. The formation of the dense rotating equatorial structure at the core of OH 231.84.2 is most likely the result of wind Roche lobe overflow (WRLOF) mass transfer from QX Pup to the main-sequence companion; this scenario is greatly favored by the extremely low AGB wind velocity, the relatively high mass of the companion, and the comparable sizes of the dust condensation radius and the Roche lobe radius deduced from our data. The kinematic pattern observed within the 350 au inner regions of the SS-outflow suggest that we are witnessing the active acceleration of the companion-perturbed wind from QX Pup as it flows through low-density polar regions.
Key Words.:
Stars: AGB and post-AGB – circumstellar matter – Stars: winds, outflows – Stars: mass-loss – Astrochemistry – Submillimeter: stars1 Introduction
The majority of stars (with initial masses 1-8 ) will become planetary nebulae (PNe) near the end of their lives. At these late stages, the slow (10-20 km s-1), roughly spherical stellar winds blown during the preceding asymptotic giant branch (AGB) phase transform into shining PNe with high-speed (100 km s-1) outflows and a puzzling variety of aspherical morphologies (see e.g. Balick and Frank, 2002, for a review). The rapid (1000 yr) evolution from (quasi-) spherical to bipolar or multipolar ejections is initiated prior to the PN stage, during the so-called pre-PN (pPN) or post-AGB (pAGB) phase, in which the most spectacular and extreme aspherical geometries are indeed observed (e.g. Meixner et al., 1999; Ueta et al., 2000; Sahai et al., 2007). Binarity is a widely accepted mechanism for producing fast collimated winds (jets) in dying stars and, in turn, these jets are potentially the primary agents for the breaking of the spherical symmetry during the AGB-to-PN transition (e.g. Sahai & Trauger, 1998; De Marco, 2009; Tafoya et al., 2020).
Rotating equatorial structures are expected to form associated with the presence of stellar or substellar companions to mass-losing stars (e.g. El Mellah et al., 2020; Chen et al., 2017; Zou et al., 2020), however, direct empirical confirmation and characterisation of such structures has proven to be difficult. To date, rotating circumbinary disks have been found in a population of binary post-AGB stars with near-infrared (NIR) excess, referred to as disk-prominent post-AGB (dpAGB) stars (van Winckel, 2017). The vast majority of dpAGB stars curiously lack of extended, prominent nebulosities and in all cases lack of massive fast outflows like those present in the majority of well-studied pPNe, which we then refer to as wind-prominent pPNe (wpPNe) (see e.g. Bujarrabal et al., 2013, 2001; Sánchez Contreras & Sahai, 2012, and references therein). Rotating circumbinary disks were spatially and kinematically resolved for the first time in the Red Rectangle, the best studied dpAGB star, by means of interferometric observations of the CO molecular emission (Bujarrabal et al., 2003). In recent years, molecular rotating disks have been identified and mapped in a few more dpAGB objects (Bujarrabal et al., 2015, 2017, 2018; Gallardo Cava et al., 2021) and also in the semiregular AGB stars L2Pup (Kervella et al., 2016; Homan et al., 2017) and, tentatively, R Dor and EP Aquarii (Homan et al., 2018a, b).
Detection of rotating structures in wpPNe has remained elusive to date, probably impeded by the large amount of gas and dust material in the central nebular regions, arranged in different, partially overlapping, structural components that are difficult to disentangle observationally. In this work, we report on the first confirmed detection of a rotating disk in a pPN with massive bipolar outflows.
OH 231.84.2 (hereafter OH 231.8) is a well known bipolar nebula around a mass-losing AGB star, QX Pup. QX Pup is a Mira-type variable that has prematurely developed a massive (1 ) pPN-like nebula with a spectacular bipolar morphology and very fast outflows, with velocities of up to a few hundred km s-1 that are reached at the tips of large-scale (0.1-0.2 pc-sized) bipolar lobes (Alcolea et al., 2001). As for most pPNe, the linear momentum of the fast, large-scale bipolar lobes of OH 231.8 notably exceeds that provided by radiation pressure on dust particles (Sánchez Contreras et al., 1997; Alcolea et al., 2001), which is believed to be the mechanism driving the winds of AGB stars (Höfner & Olofsson, 2018). This discrepancy, which is observed in most pPNe (Bujarrabal et al., 2001), indicates that a different mechanism for the release of kinetic momentum by the star must be at work. OH 231.8 is the best dying star’s example demonstrating that the onset of asymmetry and vigorous dynamics can begin while the central star is still on the AGB. QX Pup, with an M 9-10 III spectral type, is part of a binary system with (at least) one companion, an A0 main-sequence star (Sánchez Contreras et al., 2004), whose presence is probably at the root of the seemingly premature evolution of this object to the next pPN phase.
The structure and kinematics of the molecular envelope of OH 231.8 has been recently characterized with unprecedented detail based on 02-03-angular resolution continuum and molecular line maps obtained with the Atacama Large Millimeter/submillimeter Array (ALMA; Sánchez Contreras et al., 2018, hereafter SCetal18). These observations unveiled a nebular structure much more complex than previously thought, marking a before and after in our understanding of the mass-loss history and nebular shaping of this object. SCetal18 discovered an extravagant array of nested (but not always co-axial) small-to-large scale structures indicative of multiple non-spherical mass ejections. The main nebular components traced by the ALMA observations studied in SCetal18 are schematically depicted and listed in their Fig. 2 and Table 4, respectively. Below we summarize the main properties of those nebular components that are most relevant to this work.
The high-velocity, bipolar lobes (HV lobes) and the slowly-expanding, equatorially dense waist (large waist) from which the lobes emerge, both known from previous works, are highly structured, specially the former. In the large-waist the expansion velocity ranges from 3 km s-1 in the inner edge (at a radius of 250 au) to 25km s-1 in the outer boundary (at 2700 au). The spatio-kinematics of the large waist and the HV lobes indicate that they were both shaped nearly simultaneously about 800-900 yr ago.
In the central regions of the nebula, SCetal18 uncovered two main small-scale structures: ) a compact parcel of gas and dust that surrounds the mass-losing AGB star, referred to as clump S, which is selectively traced by certain species, including NaCl; and ) a compact bipolar outflow that emanates from clump S, which is selectively traced by SiO. The SiO-outflow is oriented similarly to the large-scale nebula but is significantly more symmetric, slower (20 km s-1), and younger (500 yr). Unexpectedly, SCetal18 found that clump S does not lie on the equatorial plane of the large-scale nebula but is off-centered by 06 to the south along the nebular axis, perhaps due to a combination of orbital-motion and recoil of the binary system after strong asymmetrical mass ejections.
SCetal18 also reported first detection of methanol (CH3OH) and sodium chloride (in the form of Na37Cl) in OH 231.8, adding to the long list of 30 species already detected toward this object (e.g. Morris et al., 1987; Sánchez Contreras et al., 2015; Velilla Prieto et al., 2015), which is the chemically richest envelope amongst O-rich AGB and post-AGB stars.
The pulsation layers of QX Pup (within a few au) were mapped with 1 milliarcsecond (mas) resolution in SiO maser emission by Sánchez Contreras et al. (2002) using the Very Long Baseline Array (VLBA). In contrast to normal AGB stars, with SiO maser spots distributed (nearly) spherically around the star, in OH 231.8 the SiO masers are found to trace an equatorial torus-like structure around QX Pup. The velocity gradient measured in the torus, with a radius of 6 au, indicates a composite velocity field with infall motions (attributed to the stellar pulsation) as well as rotation in these inner regions. Comparable infall and rotation velocities are found, both in the range 7-10 km s-1. The precise origin of the elongated, equatorially dense rotating structure traced by the SiO masers is unclear but it is probably rooted in the gravitational interaction of QX Pup with a companion.
OH 231.8 is a member of the 0.25 Gyr old cluster M 46 (Jura & Morris, 1985; Davidge, 2013) located at a distance of 1500 pc. The distance to OH 231.8 has been most accurately determined from a trigonometric parallax measurement of the H2O masers, leading to =1.54+0.02(-0.01) kpc (Choi et al., 2012). OH 231.8 has a total luminosity of 7000 that, considering an average stellar temperature of 2500 K, implies a stellar radius of 2.1 au.
In this work, we present a new study of the central nebular regions of OH 231.8 (down to linear scales of 30 au) based on high-angular resolution continuum and molecular line observations with ALMA. We focus on line emission maps of NaCl, KCl, H2O, SiS and SiO, which are some of the molecules that selectively trace the central clump S and the compact SiO-outflow (now, referred to as the SS-outflow). This paper is organized as follows. The observations and the data reduction are described in § 2. The continuum and the molecular line emission maps are presented in § 3 and § 4, respectively. The analysis of the NaCl line emission, including a rotational diagram analysis and a local thermal equilibrium (LTE) radiative transfer model, is presented in § 5. In § 6, we estimate the central binary’s orbital separation, and the central dynamical mass and angular momentum of the rotating disk. In § 7, we discuss our main findings and present our conclusions on the formation process of the two principal structures here under study, the rotating disk and the young SS-outflow. Finally, a summary of the points addressed in this work is provided in § 8.
2 Observations and data reduction
| Center | Bandwidth | Velocity resolution | Continuum Flux () |
|---|---|---|---|
| (GHz) | (km/s) | (km s-1) | (mJy) |
| OH231.8_a_06_TM1 (2017-Oct-15:20) | |||
| 261.240 | 537.9 | 0.562 | 34.0(4.1) |
| 260.336 | 539.8 | 0.562 | 33.0(4.1) |
| 258.988 | 135.7 | 0.283 | 32.0(5.1) |
| 258.684 | 135.8 | 0.283 | 33.0(4.1) |
| 258.272 | 136.0 | 0.283 | 33.0(4.1) |
| 257.232 | 136.6 | 0.285 | 31.0(4.0) |
| 244.913 | 2294.4 | 1.195 | 29.1(3.1) |
| 242.617 | 144.8 | 0.302 | 28.2(3.0) |
| 241.935 | 290.4 | 0.303 | 28.4(3.1) |
| 241.752 | 145.3 | 0.303 | 28.2(3.1) |
| OH231.8_b_06_TM1 (2017-Oct-16:18) | |||
| 234.219 | 299.5 | 0.312 | 26.7(2.0) |
| 232.665 | 301.4 | 0.314 | 26.1(2.0) |
| 231.880 | 606.2 | 1.263 | 26.5(2.0) |
| 231.484 | 607.2 | 1.265 | 26.3(2.0) |
| 231.199 | 607.7 | 1.266 | 26.0(2.0) |
| 230.517 | 609.6 | 1.270 | 25.8(2.0) |
| 219.778 | 319.7 | 0.666 | 23.7(2.0) |
| 219.540 | 319.7 | 0.666 | 24.2(2.0) |
| 218.961 | 320.6 | 0.668 | 23.5(3.0) |
| 218.202 | 321.6 | 0.670 | 23.4(2.0) |
| 217.921 | 160.8 | 0.335 | 23.5(2.0) |
| 217.798 | 161.3 | 0.336 | 23.2(3.0) |
| 217.085 | 161.8 | 0.337 | 23.4(4.0) |
| 216.718 | 161.8 | 0.337 | 32.0(12) |
This work is based on observations obtained with the ALMA 12 m interferometric array during cycle 5 as part of project 2017.1.00706.S (PI: Sánchez Contreras). Two frequency settings (OH231.8_a_06_TM1 and OH231.8_b_06_TM1) within band 6 (242-261 GHz and 217-234 GHz, respectively) were used to map the molecular line and continuum emission toward OH 231.8. In Table 1, we list the different spectral windows (SPWs) in our data set, a total of 24, with their central frequencies, bandwidths, and velocity resolutions (three first columns) as well as the observing dates of each frequency setting. Observations of OH231.8_a_06_TM1 and OH231.8_b_06_TM1 were done in three and two 1.7 hr-long different sessions or blocks, respectively, executed within a window of a few days. The data were obtained with 50-52 antennas with baselines ranging from 41.4 m to 16.2 km, resulting in a highest angular resolution of about 002. The maximum recoverable scale (MRS) is 03 and 04 for OH231.8_a_06_TM1 and OH231.8_b_06_TM1, respectively. Following the standard calibration procedure, a number of sources (J0750+123, J07301141, and J07461555) were observed as bandpass, complex gain, and flux calibrators. The flux density adopted for J0750+1231 is 0.7930.08 Jy at 217 GHz. We estimate the absolute flux calibration to be accurate to within 7%-15%, depending on the spectral window.
The calibration of the data was performed using the automated ALMA pipeline of the Common Astronomy Software Applications package (CASA111https://casa.nrao.edu; versions 5.1.1 and 5.4.0). We created continuum images for each of the 24 SPWs using line-free channels. These continuum images were used to measure the continuum fluxes from clump S for each of the SPWs observed (Table 1 and Fig. 2). Subsequently, self-calibration was performed on the strong continuum using the initial model of the source derived from the standard calibration to improve the fidelity of the continuum images. The line emission cubes, produced after subtracting the underlying continuum emission (using the SPW containing each line), have been obtained from the data with the initial standard calibration because, in contrast to the continuum, the noise in the line maps was not dominated by residual calibration errors and no improvement was achieved after applying self-calibration. Self-calibration of the continuum as well as the final image restoration and deconvolution was done using the GILDAS222http://www.iram.fr/IRAMFR/GILDAS software MAPPING.
The final line cubes and self-calibrated continuum images here presented were created using by default the Hogbom deconvolution method with a robust weighting scheme333We used a value of 0.56 for the threshold of the robust weighting in MAPPING., resulting in angular resolutions of 0016-0019, with a nearly circular beam. For an optimal comparison of all the maps with the same angular resolution, the final cubes have been created by imposing a circular restoring beam of 20 mas. Additionally, SiS maps have been also restored using natural weighting and tapering (with a tapering distance of 5700 m), resulting in a 60 mas beam, which offers a good compromise between sensitivity to smooth medium-size structures and angular resolution. For the continuum, we also analysed the distribution of clean components and used it to produce a higher angular resolution version of the continuum images by imposing a circular restoring beam of 10 mas, i.e. smaller than the nominal 20 mas beam. This 10 mas-resolution clean-components map has been used exclusively to better discern the two different emission components already inferred from the continuum maps with a nominal angular resolution of 20 mas and for a better determination of their relative positions (§ 3, Fig. 1).
The typical rms noise level per channel of our 20 mas-resolution spectral cubes is 0.5-0.6 mJy beam-1 at 2 km s-1 resolution. The rms noise level range in the 20 mas-continuum maps is 0.05-0.09 mJy beam-1 for the individual SPWs.
3 Continuum emission

3.1 Surface brightness distribution
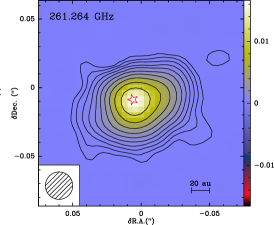
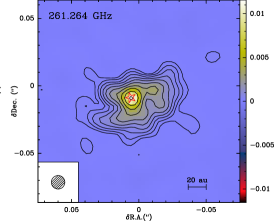
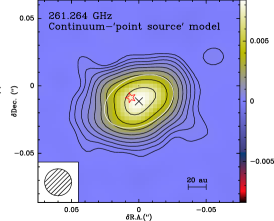
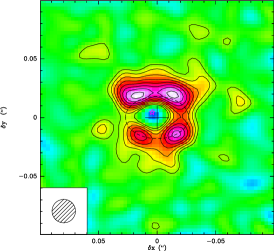
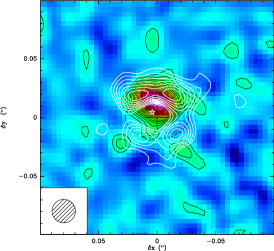
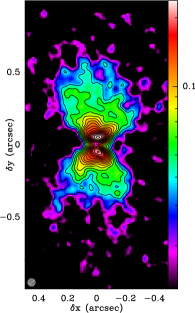
We have made ALMA continuum emission maps of OH 231.8 for the 24 SPWs observed in this project (within 217-232 GHz and 241-261 GHz – see Table 1). The surface brightness distribution of the continuum is very similar (within 3 errors) at all these frequencies. In Fig. 1, we show a representative continuum emission map at 261.3 GHz, the highest frequency observed in this work, with 20 mas and 10 mas restoring beams (left and middle panel, respectively).
As shown in SCetal18, the continuum emission of OH 231.8 at (sub)mm wavelengths is due to dust thermal emission from two major components: (1) a 8″4″ hourglass-like structure with optically thin cold (75 K) dust and (2) a bright compact (01) condensation with optically thin hotter (300-400 K) dust - referred to as clump S. For the ALMA configurations used in this project, the angular size of the largest smooth structure to which our observations are sensitive (or MRS) is 03-04. Therefore, as expected, the continuum emission from the 8″4″ hourglass-like structure is now filtered out almost completely. We note that this is not problematic since the focus of our high-angular resolution observations here presented is to dissect the small-scale structures discovered in the central regions of OH 231.8 (including clump S), which should offer clues as to how this iconic object assembled its complex nebular architecture at larger scales.
We spatially resolve the bright compact condensation of dust at the center of OH 231.8 referred to as clump S (SCetal18). Our maps reveal an elongated structure with its long axis oriented roughly perpendicular to the main symmetry axis of the bipolar lobes of OH 231.8. This suggests that this structure is an inclined disk. The emission peak of the continuum (marked with a starlike symbol in Fig. 1) appears to be slightly offset (toward the northeast) from the centroid of the extended, disk-like continuum emitting region. The offset becomes more clear in the 10 mas maps, where the strong continuum emission stands out very clearly as a point-like source on top of a more diffuse and extended emission component.
To confirm the presence of the point source and the disk-like emission components inferred above and to better constrain their positions and dimensions, we have fitted a double component model to the continuum data. To do that we used the GILDAS/MAPPING task uv_fit. The fitting has been done in two steps: first, a point-source model is fitted and subtracted to the continuum data and, after that, the residual emission is fitted again using a uniform elliptical disk model. To fit the point-source model we have used only the longest baselines (length 6000 m), which enables us to filter out partially the emission by the extended component and to better isolate the emission from the point source. The point-source model has been subtracted from the original data, after which a cleaned image of the residual continuum has been created, shown in the right panel of Fig. 1. The continuum data and the two fits (of the point-source and the extended disk) are shown in the Appendix in Fig. 15 together with a final residual map of the continuum after subtraction of the (point-source+extended-disk) model.
The position of the point-source deduced from the fit is R.A.=07h42m1691543 Dec.=14°42′500691 (J2000), with formal errors from the fit of 0.18 and 0.14 mas, respectively, and is marked by a starlike symbol in the continuum maps shown in Fig. 1. The continuum flux of the point-like source deduced from the fit is 9.10.1 mJy. As we show later in § 3.2 and § 4, the point-like continuum emission source marks the position of the central AGB star QX Pup.
By fitting a disk source model to the residual extended 261 GHz-continuum emission (25.60.2 mJy) we find that the dimensions and orientation of this structure are 52.6 mas34.0 mas (0.5 mas) and PA=1151.6°, respectively. The major-to-minor axis ratio found is consistent with a circular disk of radius 40 au with its plane inclined by 40° with respect to the line of sight, consistent with the inclination of the large-scale bipolar lobes of OH 231.8 with respect to the plane of the sky (35°, Bowers and Morris, 1984; Kastner et al., 1992; Shure et al., 1995). This suggests that the dust continuum disk and the bipolar lobes are indeed orthogonal as already suspected given their relative orientation (mutually perpendicular) in the plane of the sky. The upper limit to derived from the dimensions of the continuum disk arises because the disk may have a nonzero vertical thickness. In this case the minor axis of the projected geometrically thick disk would increase by with respect to the infinitesimally thin (=0) disk case. Adopting an inclination =30°, the dimensions of the continuum suggest a disk vertical thickness of 12-13 au.
As already guessed from a quick eye inspection of the continuum maps, the center of the disk (R.A.=07h42m1691500 and Dec.=14°42′500716, J20000) is offset by 6.10.3 mas and 2.50.2 mas toward the west and south, respectively, from the position of the central mass-losing star QX Pup. The offset between QX Pup and the centroid of the disk can be easily explained if the disk is circumbinary, in which case the disk centroid is expected to coincide with the center of mass of the binary system. We further develop this idea in § 6, where we use it to place constraints on the orbital separation based on the ‘QX Pup’-‘disk center’ relative offset observed (6.6 mas 10 au at =1500 pc).
3.2 Spectral energy distribution
The continuum flux measurements (Table 1), obtained integrating the surface brightness over the emitting region (i.e. within clump S), at the different frequencies observed in this project are shown in Fig. 2. The 242-261 GHz (band 6) continuum flux from clump S follows a frequency dependence, in agreement (within errors) with what was observed with ALMA at somewhat higher frequencies, 294-344 GHz (band 7), and with more compact configurations (SCetal18). The absolute continuum flux in band 6 measured in this work is 15%-20% lower than that expected by extrapolating the observed power-law of the continuum flux in band 7. Since absolute flux errors of up to 15% are possible in both bands, we confirm small (less than 15%-20%) interferometric continuum flux losses in our high-angular resolution continuum maps from clump S.
From our 242-261 GHz continuum maps obtained using the data for the individual observed spectral windows, we find no signs of significant deviations from a power-law (within errors) either for the point-like source at the location of QX Pup or for the extended disk-like component. However, the uncertainty in the spectral index determination for the individual (point-like and extended) components is very high and no further attempt to perform a separate analysis will be performed. For a reliable characterization of the spectral index distribution across the continuum-emitting region more sensitive and higher angular resolution multifrequency continuum maps are needed.) As discussed in SCetal18, the continuum distribution and the total flux measured from clump S suggests a dominant component of optically thin thermal-emission produced by large (100m-sized) dust grains with a flat emissivity law. In the following paragraphs, we show (1) that the photosphere of the AGB star QX Pup, also expected to follow a frequency dependence approximately consistent with black-body emission, is responsible for part (10%-20%) of the continuum emission from the point-like source, and (2) that the rest of the unresolved continuum source is probably hot (1400 K), freshly formed dust in the close vicinity (within 3-4) of QX Pup.
The contribution to the observed 261 GHz-continuum by the photosphere of QX Pup (2500 K and 2.1 au, § 1) in main-beam brightness temperature units is =2500 K()2=196 K, which is equivalent to 1 mJy (considering the ALMA beam=001001 and mJy-to-K=5.5 conversion factor at this frequency). This is notably smaller than the flux of the point-like continuum emission source (9 mJy, as derived from the -continuum data analysis, §3.1). The contribution to the continuum flux of the main-sequence companion (a factor 4 hotter but over 200 times smaller than QX Pup) is 104 times smaller than that by QX Pup and, thus, totally negligible.
Long-period variables, including Mira-type stars such as QX Pup, are thought to have radio photospheres near 2 (i.e. just inside the SiO-maser shell and dust formation zone) that can also in principle contribute to the mm-to-cm wavelength continuum emission (Reid & Menten, 1997, 2007). In the case of QX Pup, however, the radio photospheric emission at 261 GHz is expected to be only of 1 mJy according to equation (7) in Reid & Menten (1997), i.e. still far below the emission level of the point-like continuum source observed by us.
We conclude then that the excess continuum flux of the unresolved source (7-8 mJy, after subtracting the stellar photo-/radio-sphere) is dominated by thermal emission from a source other than the star, most likely due to hot dust within beam/27.5 au of QX Pup.
3.3 Continuum emission components
3.3.1 Emission from a compact hot-dust shell and a circumbinary warm-dust disk
The spectral index of the point-like continuum indicates that the dust emission is either optically thick or optically thin due to grains with emissivity index 0 (i.e. produced by large solid particles). In case of optically thick dust, the 261 GHz-continuum excess flux from the point-like source [7-8] mJy/5.5 K mJy-11350(150) K would imply a dust temperature of 1350(150)()2 K. (Errorbars in include absolute flux calibration uncertainties, which could be up to 15%, formal errors from the two-component -continuum fit, and errors in the estimate of QX Pup’s contribution to the observed continuum.) We believe that the radius of the compact, hot dust region around QX Pup is unlikely to be significantly smaller than 7.5 au because in that case the implied would exceed the grain condensation temperatures (1500 K, expected for condensates typical of O-rich CSEs), above which solid particles cannot form or survive (see § 3.3.2).
We have computed the mass of the compact hot-dust component in case of optically thin and thick thermal dust emission following the procedure and assumptions described in detail in SCetal18. For optically thin dust (with flat emissivity) at 1400 K, the mass of dust inside the compact region around QX Pup is 10-6-10-5 for a grain radius of =100-1000 m. For optically thick dust (and adopting more standard values for the grain radius and emissivity, Li & Draine 2001), we deduce a rather high value for the lower bound to the mass of 9() , which would imply a high amount of material of 0.01, using the canonical value of the gas-to-dust mass ratio, g/d160, for O-rich AGB stars (Knapp, 1985), or even up to one order of magnitude more if we use the larger values of g/d from most recent works (Ramstedt et al., 2008; Bladh et al., 2019). Assuming an expansion velocity 3 km s-1 (see § 4) for the 7.5 au inner layers of QX Pup’s wind, resulting in kinematical ages of only 10 yr, the previous value of the mass would imply an unrealistically high mass-loss rate of 10-3-10-2 yr-1, never observed before in AGB stars (typically 10-7-10-4 yr-1, e.g. Höfner & Olofsson, 2018).
According to this, we believe that the point-like hot dust emission is probably due to the emission of large 100-1000m grains, like the extended disk-like warm dust component. If this is the case, the observed value of 1350(150) K is a lower limit to the dust temperature. Since is already close to the largest temperatures that solid particles can survive to, the dust emission is probably not very optically thin. In the optically thin dust scenario, the mass-loss rate inferred for 100m grains, 10-5 yr-1, is in good agreement with the present-day mass-loss rate of OH 231.8 estimated from the analysis of SiO maser emission (Sánchez Contreras et al., 2002) and from a molecular line study of mid- to high- CO transitions observed with (Ramos-Medina et al., 2018).
We note that our estimates of the present-day mass-loss rate presented above, which are in any case uncertain, should be considered as average or mean values since we have assumed for simplicity that the hot dust is distributed in a (nearly) spherical expanding shell, which remains to be validated with higher angular resolution observations.
Across the extended disk-like component (which accounts for 80% of the total 261 GHz-continuum flux measured toward clump S), the main-beam brightness temperature ranges from 8 K (at the outer 3 layers) to 470 K at the center in our 10 mas-resolution maps. For an optically thin dusty disk, the observed range in is a lower limit to the dust temperature distribution across the disk. For an average dust temperature in the disk of 350 K (consistent with our initial rough estimate presented in SCetal18) and after subtracting the contribution by the point-like continuum emission flux (by QX Pup and the compact hot dust shell), the dust mass in the disk is 1.5-1.5 for a grain radius of =100-1000 m.
A rough estimate of the average H2 number density in the extended dust-disk of 108-109 cm-3 (assuming optically thin 100-1000 m-sized dust) and 1010 cm-3 (assuming optically thick dust) is obtained considering the gas masses derived above and the dimensions of the disk, with an outer radius of 40 au and thickness of 15 au (since it is not spatially resolved in the vertical direction).
Finally, we note that in any case, the dust (and gas) mass computed above in the optically thin scenario, for both the hot compact and warm disk-like dust components at the core of OH 231.8, have large uncertainties mainly due to the largely unknown properties (absorption coefficient) of the dust, particularly for big grains, and poorly constrained gas-to-dust mass ratios.
3.3.2 An Al2O3 compact shell around QX Pup?
The high dust temperature and small radius of the dust structure around QX Pup inferred above are most consistent with Al2O3 dust, which is the solid with the largest condensation temperature that is expected to form abundantly in the extended atmospheres (within 2-3) of O-rich AGB stars based on chemical equilibrium models (e.g. Höfner & Freytag, 2019; Agúndez et al., 2020, and references therein). Based on thermodynamic equilibrium (TE) chemical models, Al2O3 is indeed the first condensate (often referred to as seed particle) emerging in the atmospheres of O-rich AGB stars. The presence of hot (1400 K) Al2O3 dust at the inner boundaries (2) of the dust shells around Mira (O-rich AGB) stars is not only theoretically predicted but it has been empirically confirmed by spatially and spectrally resolved mid-infrared interferometric observations of characteristic dust features (e.g. Zhao-Geisler et al., 2012; Karovicova et al., 2013; Khouri et al., 2015). Observations presented by these authors are consistent with Al2O3 grains condensing in a thin gravitationally bound dust layer close to the stellar surface, co-located with the extended atmosphere and SiO maser emission.
The presence of a significant amount of amorphous Al2O3 in OH 231.8 has been previously proposed by Maldoni et al. (2004) to explain both the long-wavelength wing of the 10m silicate feature and to account for the enhanced opacity between the 10- and 18m silicate bands. We also note that the radius of the hot-dust component inferred from our continuum maps (7.5 au) is comparable to that of the torus-like SiO masing region around QX Pup (6 au, § 1), as expected in case of Al2O3 grains.
4 Molecular line emission maps: dissecting the core and the compact SiO/SiS-outflow
We have observed a large number of molecular transitions as part of this project. In this paper, we focus on a few species that have been found to selectively trace a number of small-scale nebular components at the core of OH 231.8, down to linear sizes of 20-30 au (10-15 ) from the central mass-losing star. In this section, we present the results from the observations of these species, namely, NaCl, KCl, H2O, SiO and SiS. KCl is a new detection in this object and also represents the first detection of this molecule in an O-rich AGB CSE. A list of the transitions reported in this work is given in table 2.
| Transition | Rest Frequency | Eu | Aul |
|---|---|---|---|
| (MHz) | (K) | (s) | |
| NaCl (=0, =18-17) | 234251.915 | 106.9 | 5.890 |
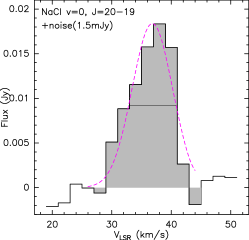
| NaCl (=0, =20-19) | 260223.117 | 131.2 | 8.108 |
| NaCl (=1, =17-16) | 219614.934 | 614.5 | 4.917 |
| NaCl (=1, =19-18) | 245400.990 | 637.5 | 6.881 |
| NaCl (=1, =20-19) | 258287.755 | 649.9 | 8.034 |
| NaCl (=2, =17-16) | 217980.229 | 1128.4 | 4.872 |
| NaCl (=3, =19-18) | 241758.920 | 1659.9 | 6.755 |
| Na37Cl (=0, =19-18) | 247239.646 | 118.7 | 6.940 |
| KCl (=0, =30-29) | 230320.560 | 171.5 | 7.377 |
| KCl (=0, =32-31) | 245623.530 | 194.7 | 8.956 |
| KCl (=1, =32-31) | 244114.520 | 592.7 | 8.895 |
| o-H2O (=1,55,0-64,3) | 232686.700 | 1133.2 | 4.630 |
| SiS (=0, =12-11) | 217817.473 | 68.0 | 1.738 |
| SiO (=1, =6-5) | 258707.324 | 1812.7 | 9.042 |
4.1 A salty and watery (brine) rotating disk inside clump S.
The first detection of Na37Cl in OH 231.8, with emission arising entirely from clump S, was reported by SCetal18. In this work, we present 20 mas-resolution emission maps of NaCl, which represent the first detection of the main isotopologue of sodium chloride (salt) in this object, and that enable us to spatially and spectrally resolve the close surroundings of QX Pup.
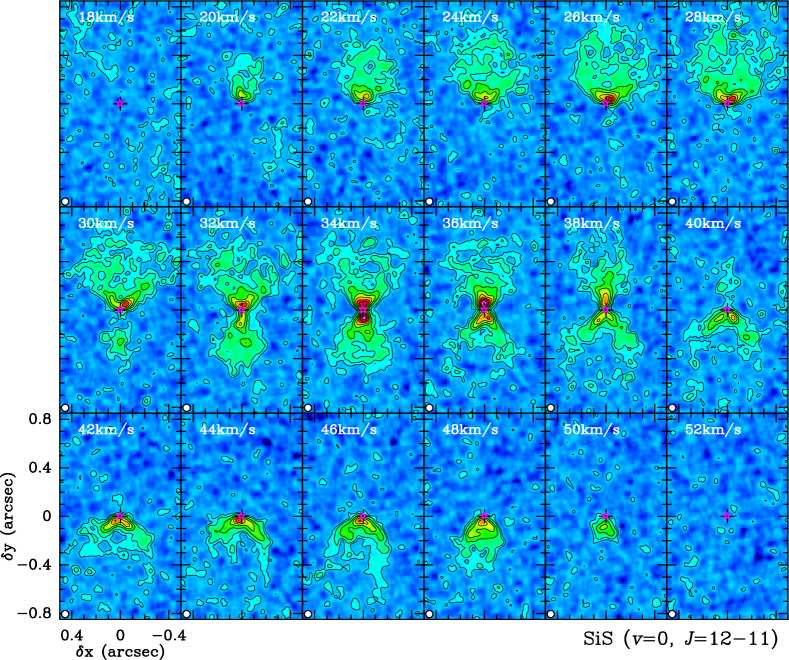
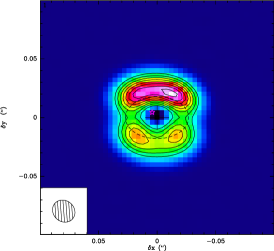
We have detected emission from seven NaCl and one Na37Cl rotational transitions in different =0, 1, 2, and, tentatively 3, vibrational levels (Table 2). Velocity-channel maps of the NaCl (=0, =20-19) transition, with the highest S/N amongst the observed NaCl lines, are shown in Fig. 16. Integrated intensity (zeroth moment) maps and 1d spectra (integrated over the emitting area) of all the lines detected are presented in Fig. 17. Although the emission is generally weak, specially for vibrationally excited lines, the surface brightness distribution of all transitions consistently appears as a hollow, squared region of dimensions 008008 (at the rms level) suggestive of a cylindrical shell-like structure surrounding or coating the dust disk traced by the continuum (illustrated by the dashed ellipse in the figures). All transitions show a clumpy/non-uniform surface brightness distribution with an overall depression near the equatorial plane, a dip at the center, and with the northern side being in general brighter than the southern.
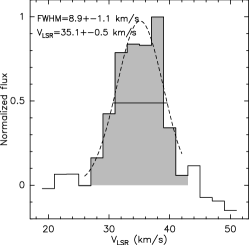
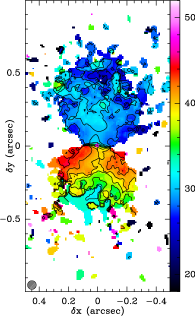
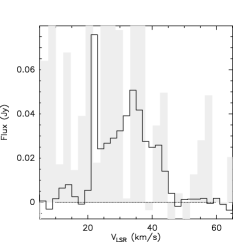
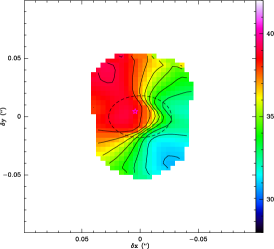
The NaCl emission spreads over a modest full velocity range of 12 km s-1. The centroid of the NaCl lines points to a systemic velocity near 35 km s-1 (LSR), as already deduced by SCetal18 based on a number of molecular lines with emission arising from clump S (including an additional Na37Cl transition) and from the compact SiO-outflow that emerges from clump S. The maps of all the individual NaCl transitions observed consistently show blue- (red-) shifted emission from the west (east) side of the compact, squarish emitting region (see e.g. Fig. 16).
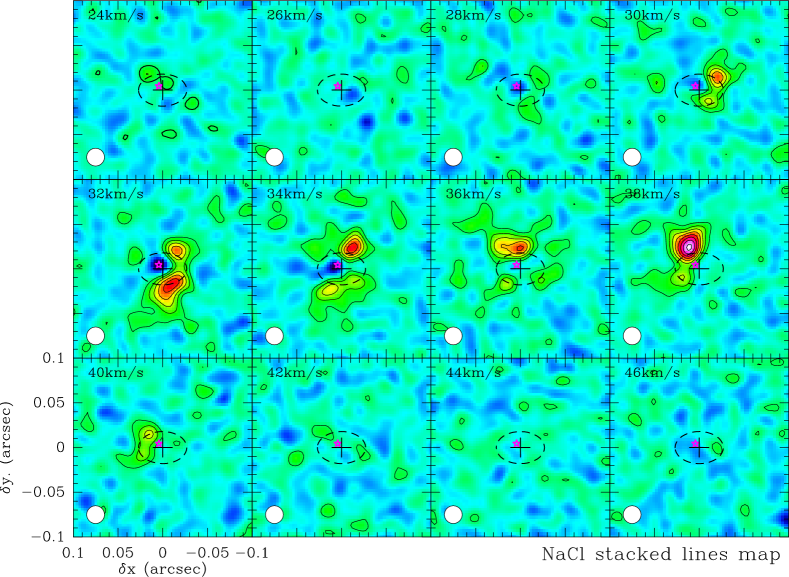
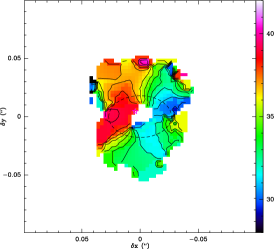
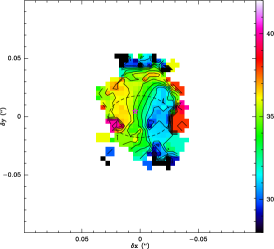
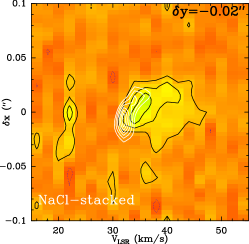
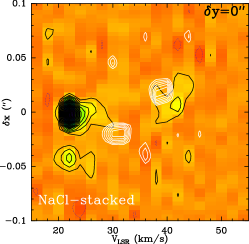
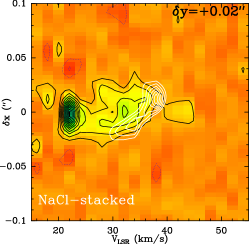
The data of the individual NaCl transitions have been combined to produce a unique NaCl line-stacked cube with improved S/N – see Fig. 3. Line stacking has been done in the plane (using the GILDAS task uv_merge); subsequent image reconstruction and cleaning has been done using standard GILDAS/MAPPING tasks as for the rest of the transitions reported (see § 2). The velocity-channel maps of the NaCl stacked lines corroborate the main spatial and kinematic characteristics of the emitting region guessed from the individual transitions. Our NaCl stacked-line maps clearly point to equatorial rotation in the central, inner regions of OH 231.8: the emission from the east (west) side of the cylindrical NaCl-emitting volume is systematically red- (blue-) shifted, which is indicative of receding (approaching) gas. This velocity gradient along the equatorial direction, i.e. orthogonal to that resultant from the dominant expansive kinematics of the bipolar lobes of OH 231.8, is a clear signature of equatorial rotation – this is can be also appreciated in the first moment maps shown in Fig. 3 (bottom-center). The west-to-east sense of the rotation derived from these maps coincides with that of the inner (3) SiO-maser torus (Sánchez Contreras et al., 2002).
The radius and the height (above or below the equatorial plane) of the hollow, shell-like cylindrical structure where the NaCl-emission arises are similar, which is the reason for the squarish appearance of the NaCl surface brightness distribution. The walls of the cylinder are unresolved and, thus, the wall-thickness is expected to be a small fraction of the radius. The centroid of both the velocity field and the overall surface brightness distribution of NaCl roughly coincides with the center of the dust disk probed by the mm-continuum, strongly suggesting that the rotating structure traced by NaCl is also circumbinary. This is also the most likely scenario based on previous observations, since all rotating structures spatially resolved to date around binary post-AGB stars, a.k.a. dpAGBs, are circumbinary (§ 1). The relative distribution of the emission from NaCl and the dust disk deduced from our ALMA maps suggest indeed that the salt emission arises in the surface layers of the disk, both then being part of the same equatorial structure rotating around the binary system at the center of OH 231.8.
The velocity-channel maps, show weak absorption below the continuum level near the nebula center, at velocities 32 km s-1; the absorption is appreciated in some of the individual NaCl transitions, particularly the =0 lines. This indicates that the line excitation temperature is smaller than that of the background source, the dust continuum, at that position (Fig. 16). As discussed in § 5.1, the presence of absorption enables constraining the rotational temperature and opacity of the NaCl lines observed.
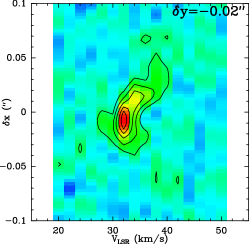
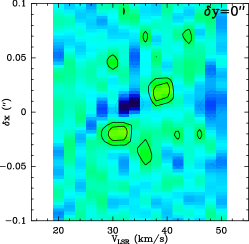
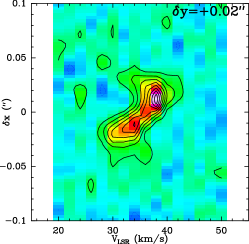
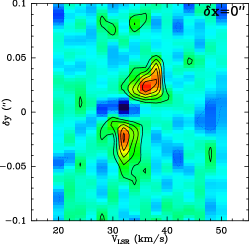
In Fig. 4, we show position-velocity (PV) cuts along the direction of the nebula equator (top) and along the axis (bottom) of the NaCl-stacked maps. The peak-to-peak velocity separation measured in the equatorial PV cut through the center (=0″) is 8 km s-1, implying a projected rotation velocity of about 4 km s-1. The relative separation between the red- and blue-peak emitting areas along the equator is 004 (60 au). The projected rotation velocity deduced at offsets 002 above and below the equatorial plane, i.e. coincident with the two brightest north and south regions, is slightly smaller than (but comparable to) that measured at =0″.
In addition to rotating, the gas in the NaCl-emitting structure is expanding. This is best seen in the PV cuts along the nebula axis through the center (Fig. 4-bottom panel) where the emission from the north and south surfaces of the NaCl cylinder is observed to be red- and blue-shifted, respectively. This axial velocity gradient is consistent with an inclined cylindrical structure in equatorial expansion with its north side pointing toward the observer, similarly to the orientation of the small- and large-scale bipolar outflows of the nebula. The projected expansion velocity deduced from the peak-to-peak velocity separation in the axial PV cut is very low, 3 km s-1. This value is a factor 5-10 smaller than the wind terminal velocity expected for a high mass-loss (10-4-10-5 yr-1) AGB star like QX Pup, specially considering that the NaCl emission traces the surface layers of the continuum disk, i.e., is present beyond the regions where dust has already been formed massively and, thus, where the stellar wind should have been strongly accelerated approaching its terminal velocity. We discuss this further in Sect. 7.1.
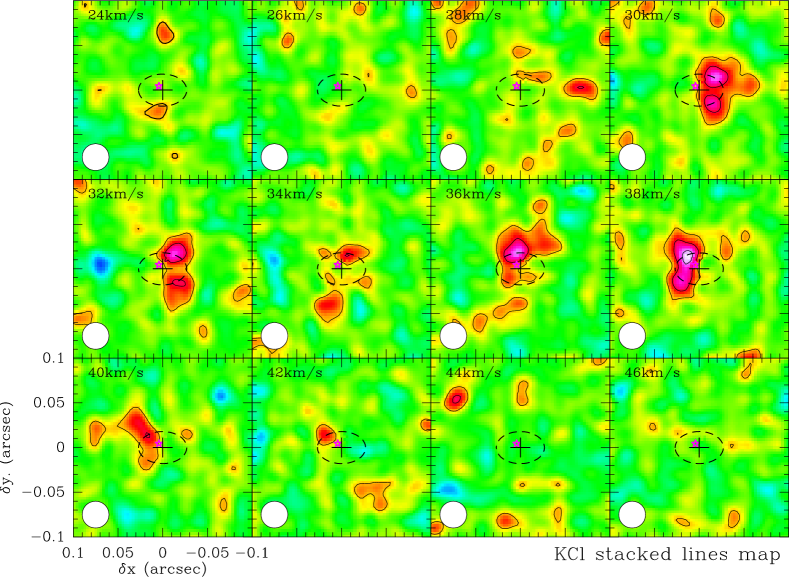
We have found two other molecular species that, apart from NaCl, selectively trace the rotating (and expanding) equatorial structure at the core of OH 231.8, namely, potassium chloride (KCl, i.e. another salt) and water (H2O). The detected transitions are listed in Table 2.
The emission from KCl is extremely weak, specially that of the =1 line (Fig. 18). As for NaCl, the data of the individual KCl lines have been combined to obtain maps with higher S/N. The KCl line-stacked cubes (Fig. 5) confirm a very similar spatial distribution and kinematics for the two salts, revealing themselves as optimal probes of the long-sought rotating disks in pPN candidates with massive bipolar outflows like OH 231.8.
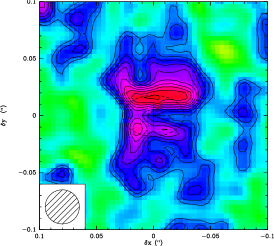
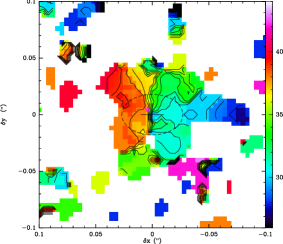
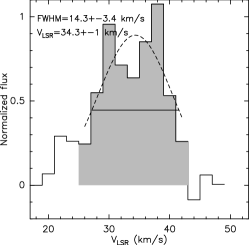
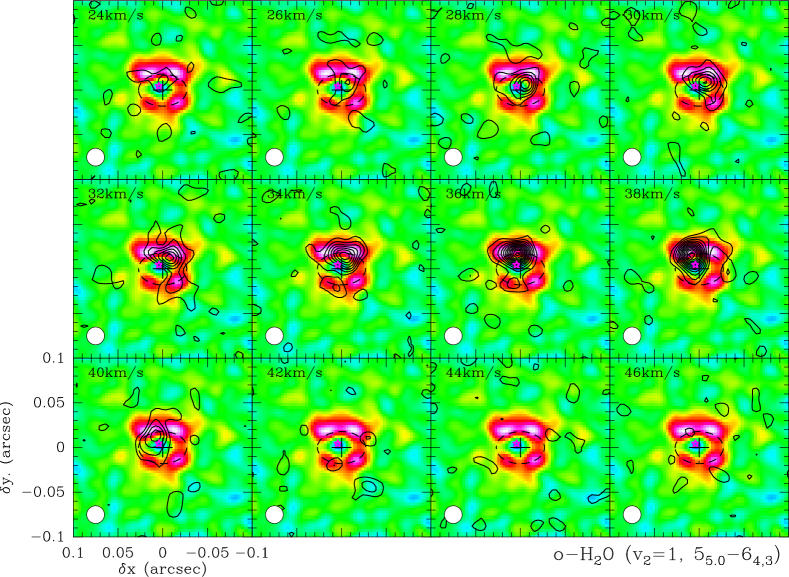
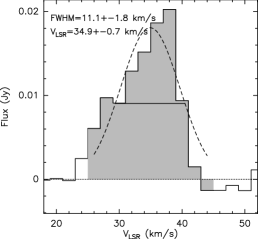
Our ALMA maps of the o-H2O (=1,55,0-64,3) transition (Fig. 6) reveal as well the presence of water in the surface layers of the rotating continuum disk traced by the salts, with the water emission being slightly more compact, i.e. probing regions slightly closer (in radius and height) to the center. The brightness contrast between the north and south surfaces of the water-emitting volume is much higher than for the salts, with the emission from the south being barely above our detection limit. The water emission spreads over a full velocity range slightly larger than the salts, with faint water emission detected in channels near =24-26 km s-1 close to the center, where the weaker NaCl and KCl transitions are not detected. This possibly denotes slightly larger rotation velocities at smaller distances to the center as expected for Keplerian or sub-Keplerian rotation.
4.2 The compact bipolar SiO/SiS-outflow
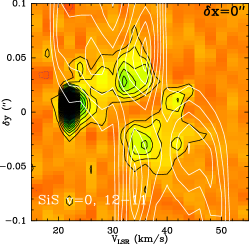
From these observations, we find that the compact (1″4″) bipolar outflow discovered in SCetal18 is traced by several rotational transitions in the =0 and =1 vibrational states of SiO and SiS (including some isotopologues). We refer to this component as the SiO/SiS-outflow (hereafter, SS-outflow). In this work, we concentrate exclusively on two transitions: the SiS =0, =12-11 line (§ 4.3), which best delineates the morphology and kinematics of the dense walls of the bipolar SS-outflow, and the vibrationally excited SiO =1, =6-5 line (§ 4.4), which traces the innermost layers of the SS-outflow (i.e. closer to the center) where the gas is exposed to a more intense infrared stellar radiation field (probably largely responsible for SiO =1 level pumping) and, also, is presumably denser and hotter. The line emission maps of additional Si-bearing molecules, particularly SiO =0, with more intense and opaque lines than SiS and that mainly trace the lobes interior, will be the focus of a dedicated publication in the future.
4.3 SiS =0
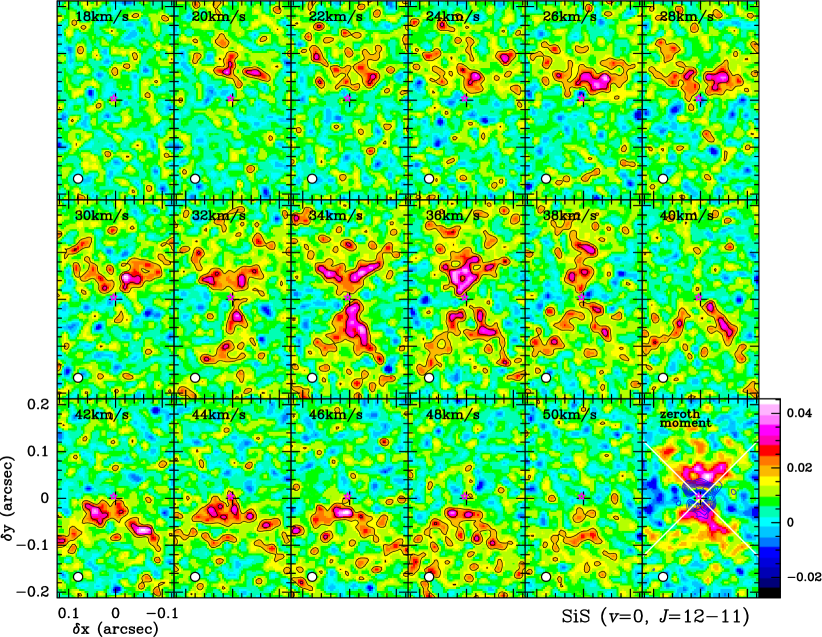
The SiS =0, =12-11 ALMA data are shown in Figs. 7-9. The SiS maps have been restored using natural weighting and tapering (with a tapering distance of 5700 m), resulting in a beam with HPBW=60 mas, which offers a good compromise between sensitivity to smooth medium-size (01-02) structures and angular resolution (Fig. 7). In order to have a sharper view of the inner regions of the SS-outflow, the SiS =0, =12-11 maps have been also restored using robust weighting, resulting in a HPBW=20 mas (Fig. 8).
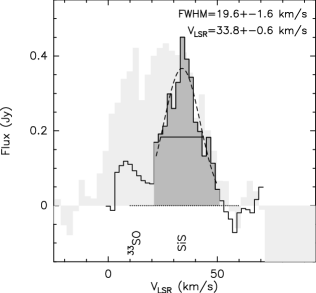
By comparing the SiS =0, =12-11 line profile obtained from our 60 mas-resolution maps with single-dish measurements (Fig. 7, bottom-right), we infer rather small interferometric flux losses, consistent with the SiS emission being mainly (or almost entirely) circumscribed to the compact SS-outflow. Note that, in contrast, the emission from 33SO that partially overlaps with that of SiS is significantly filtered out by the interferometer, consistent with most of the 33SO emission arising predominantly from the large-scale molecular outflow. This is also the case of many other species with intense single-dish emission, including CO, HCO+, HCN, CS, OCS, SO2, etc, observed in this project (but not discussed here).
Our SiS =0, =12-11 ALMA maps define rather precisely the shape of the SS-outflow, adding detailed information on its morphology due to the improved angular resolution over the discovery ALMA SiO emission maps (SCetal18). The compact SS-outflow is formed by two opposing lobes with a nearly conical geometry at their base and a rounded morphology at their ends, resulting in a characteristic flame-like or -like shape. The orientation of the SS-outflow’s symmetry axis in the plane of the sky is similar to that of the NaCl equatorial structure. The size of the lobes as seen in the SiS =0, =12-11 60 mas-resolution maps is 0608 (at a 3 level; Fig. 7). This is a lower limit to the full extent of the SS-outflow’ lobes, which appear to be somewhat larger along the axis in the SiO maps (Fig. 4 of SCetal18), due to partial flux losses of the SiS emission from these structures at medium angular scales (particularly at their outer regions) and due to the sensitivity limit of our maps. The shape of the lobes, which appear limb-brightened in our SiS maps indicating a dense-walled structure, is consistent with a wide-angle wind with an opening angle of 90° at its base.
The pinched-waist appearance of the integrated intensity maps of SiS =0, =12-11 (Fig. 7) partially results from a lack of emission in the equatorial plane. This is best seen in the 20 mas-resolution maps that show a 02-thick waist where no emission from SiS is detected (Fig. 8). We compare the distribution of the SiS =0, =12-11 integrated intensity emission (zeroth moment map) with that of NaCl in the last panel of this figure. As it can be clearly seen, the SS-outflow emerges immediately beyond the surface layers of the rotating equatorial disk at the center traced by NaCl. The SS-outflow runs almost perfectly through the diagonals of the squarish surface brightness distribution of NaCl, oriented at 45° from the nebula/disk axis. The relative distribution of the NaCl and SiS emission strongly suggests that both molecules probe adjacent layers of the same nebular structure at different scales or that the two underlying structures, the rotating disk and the SS-outflow, are very closely physically related.
The SiS emission is spread over the velocity range 18-50 km s-1, similar to the full velocity width of the SiO (=0, =7-6) emission mapped with 02 resolution by SCetal18. This confirms that the moderate flux losses in our 60 mas-resolution SiS =0, =12-11 maps do not result in any kinematic components of the SS-outflow to be missed but only to a partial filtering of the emission from smooth medium-size structures mainly within the central/outer regions of the flame-shaped lobes. The kinematics of the SS-outflow is predominantly expansive as denoted by the overall blue- (red-) shifted emission from the north (south) lobes, respectively (Fig. 7, bottom-center) given the inclination of the nebula, with the north lobe pointing toward the observer.
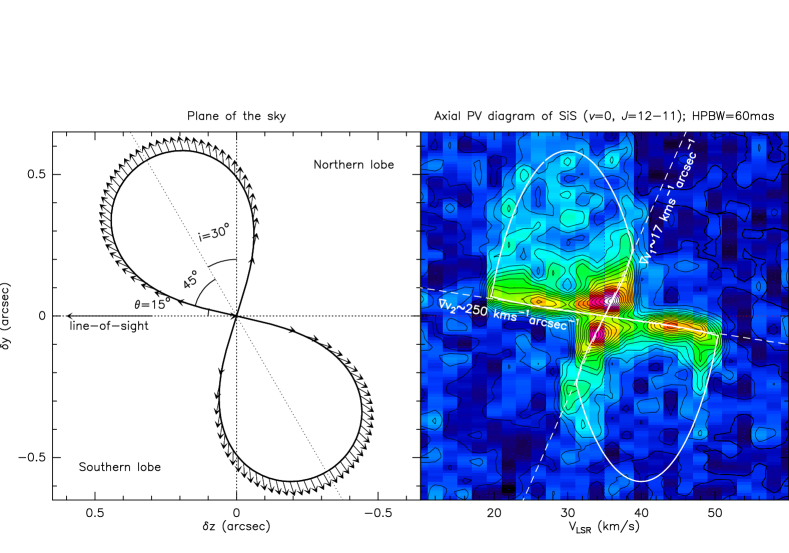
The outflow kinematics can be best constrained by further exploring the data using position-velocity (PV) cuts (Fig. 9). To guide the eye and to help the reader more quickly visualize the kinematic information contained in the axial-pv diagram described in the next paragraphs, we include in Fig. 9 a very simplistic spatio-kinematic model of the SS-outflow (left panel) and the axial-pv diagram resulting from the model (overplotted on the data, right panel).
The PV diagram of SiS =0, =12-11 along the major axis of the SS-outflow shows an easily recognisable X-shape in the central regions (within y02-025), where the emission is brightest. The X-shape is consistent with the conical geometry of the SS-outflow, inferred directly from the velocity-channel maps, and with an expansion velocity that increases (linearly or almost linearly) with the distance to the center (), i.e. with a constant velocity gradient along the walls of the SS-outflow at its base. This type of kinematics is common in the outflows of pPNe and yPNe and, indeed, is also observed in the medium-to-large scale nebular components of OH 231.8, namely, the large-scale CO outflow (including the high-velocity lobes and the large equatorial waist) and the so-called mini-hourglass that surrounds the SS-outflow (SCetal18).
The slope (or projected velocity gradients) of the two crossing straight lines that form the X-shaped SiS emission distribution in the axial-PV diagram (Fig. 9), can be used to derive the inclination of the SS-outflow’s axis using elementary maths and assuming a conical geometry with a semi-opening angle of 45° at the base (directly deduced from the velocity-channel maps). On the one hand, the smallest projected velocity gradient between the two SiS =0, =12-11 emission peaks (v117 km s-1 arcsec-1) results from the gas outflowing along the rear (front) side of the North (South) lobe, which is inclined by an angle 45°- with respect to the plane of the sky. On the other hand, the largest projected velocity gradient observed, v2250 km s-1 arcsec-1, results from the gas outflowing along the front (rear) side of the North (South) lobe, inclined by the same angle, =45°, but from the line-of-sight. For an axially symmetric conical flow and assuming that the deprojected velocity gradient is the same in both lobes, i.e. that v2tan()=v1/tan(), we derive 15°, implying that 451530° (see Fig. 9). This value of is in very good agreement with the inclination of the symmetry axis of the different nebular components identified so far in OH 231.8 from previous studies (§ 1) and from this work, including the dust continuum disk (§ 3) and the equatorial rotating structure traced by the salts and water (§ 4.1). The deprojected velocity gradient along the SS-outflow in regions close to its base is then v250tan(15°)17/tan(15°)65 km s-1 arcsec-1.
In the intermediate-to-outer regions of the SS-outflow lobes, where these acquire a rounded appearance, the distribution of the SiS emission in the axial-pv diagram indicates that the law is not sustained any longer, since otherwise much larger projected velocities would be observed at the lobe tips given their dimensions. As shown in Fig. 9, the axial-pv diagram is indeed consistent with rounded lobes radially expanding at a constant (terminal) speed of 15-17 km s-1 at radial distances from the center larger than 02-025 (350 au). Note that the limited angular resolution of the observations does not enable us to spatially resolve the compact region over which the velocity law changes from a gradual increase to a terminal constant value or to precisely determine the exact velocity law, not being possible to rule out, for example, a (quasi) -wind velocity profile (§ 7.1).
Rotation at the base of the SS-outflow is tentatively identified in our SiS =0, =12-11 maps: note the slightly curved shape of the iso-velocity contours at y=0″ in the first moment maps (Fig. 7, bottom-center). In these inner equatorial regions, however, there is a lack of strong SiS emission that, together with the limited angular resolution, precludes a reliable description of the velocity field from these maps. As we show in § 4.4, rotation at the base of the SS-outflow is confirmed in our SiO =1, =6-5 ALMA data and, thus, we defer to the next section for further developing on this.
4.4 SiO =1
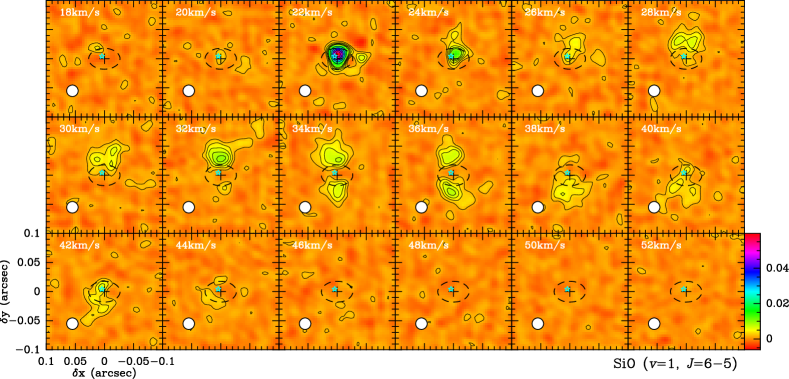
The SiO =6-5 emission in the first vibrationally excited state =1 (Eu1800 K, Fig. 10) arises from a central elongated region, of dimensions 006012 (at a 3 level), with the long axis oriented along PA25°, consistent with a bipolar wind running inside the hollow rotating disk traced by the salts and water. The distribution of the SiO =1, =6-5 emission overlaps (spatially and spectrally) with that of the SiS =0 transitions at the base of the SS-outflow, indicating that the =1 emission is selectively probing high-excitation regions of the SS-outflow closer to the center.
The kinematics of the SiO =1 emitting region is indeed consistent with an overall expansion (Fig. 10, bottom-center) closely following the velocity gradient of the SS-outflow at its base inferred from the SiS =0 ALMA maps. This is best seen in the axial-pv diagram (Fig. 11-bottom), where the SiO =1, =6-5 emission is clearly constrained to the 006 central regions of the SS-outflow with velocities spreading from 20 to 44 km s-1. The comparison with the axial-pv of the SiS =0, =12-11 transition, which best traces the walls of the SS-outflow, suggests that the SiO =1, =6-5 emission mainly arises from the interior of the lobes and very close to their base. In particular, the position of the two relative maxima of the SiO =1 seen in the axial-pv diagram, at =32 and 36 km s-1 at 30 mas ( 45 au) from the center, is consistent with brightening of the SiO =1 emission in regions close to the rear (front) side of the North (South) lobe due to a smaller velocity dispersion resulted from the bulk expansive motions being along (or near) the plane of the sky in these regions (also visible in the SiS =0, =12-11 axial-pv diagram, Fig. 9).
There is a very bright peak of SiO =1, =6-5 emission at 22 km s-1 arising from an unresolved clump near the center of the nebula (Fig. 10-top). The main-beam brightness temperature of this feature reaches Tmb2700 K, to be compared with the much lower values of Tmb200 K at other velocities. The spatial and spectral location of this bright feature suggests that it is produced by a parcel of gas located between the central dust-continuum source and the observer, plausibly in the front side of the approaching North lobe. (Absorption below the continuum level, i.e. toward the center, at this velocity is observed in several other transitions – not shown – corroborating this interpretation). The profile of the bright SiO =1, =6-5 feature is extremely narrow, with a FWHM2.2 km s-1. This, together with the remarkably high value of the main-beam brightness temperature observed, strongly suggest a certain degree of maser amplification of the background continuum. (We have also considered that this feature could be due to the emission of another molecular species, but no probable candidates at this frequency are found.) The broad profile and moderate values of Tmb of the SiO =1, =6-5 line at the rest of the velocities indicates predominantly thermal emission.
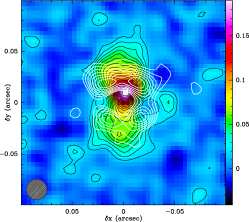
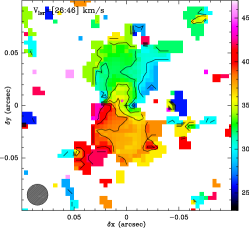
In addition to expansion, the base of the SS-outflow as traced by SiO =1, =6-5 emission is found to be rotating. This is clearly seen, for example, in the velocity (first moment) maps presented in Fig. 10 (bottom-center): the East (West) part of the lobes is observed to be Doppler-shifted to redder (bluer) velocities than the average systemic velocity of each lobe. The velocity gradient across the lobes is most apparent in the South lobe; this is partially due to overlap with the prominent blue-shifted maser spike of the SiO =1, =6-5 line, which arises from a very compact region in the front side of the North lobe that is primarily in expansion. For clarity, the first moment map show in Fig. 10 has been obtained excluding the affected channels where maser amplification is produced (24 km s-1).
Rotation can be also easily recognised in the SiO =1, =6-5 pv cuts along the direction of the equator, i.e. across the lobes (Fig. 11, top panels). In this figure, we show pv cuts through the center (y=0″) and through the base of the SS-outflow lobes (y=0″02) together with those obtained from the NaCl-line stacked cubes for comparison. In the y=002 equatorial pv cuts, the distribution of the SiO =1, =6-5 emission from regions with the x0″ (x0″), i.e. the east (west) side of the lobes, exhibits an overall shift toward the red (blue), consistent with rotation as observed also in the NaCl-line stacked pv diagrams. Rotation is perhaps more clearly appreciated in the South lobe (y=002 pv diagram).
The signature of rotation, a velocity gradient across the lobes, and expansion, a velocity gradient along the lobes, are simultaneously present in the SiO =1, =6-5 data, which partly makes it difficult to cleanly isolate/disentangle the two kinematic components. In the pv diagrams under discussion (Fig. 11), the SiO =1, =6-5 emission from y=+002 (y=002) is globally shifted to lower (higher) velocities compared to NaCl. This is reflecting moderately larger expansion velocities at the base of the SS-outflow than at the surface layers of the rotating disk, which makes it somewhat more difficult to identify rotation in the SiO =1, =6-5 data than in the NaCl (KCl and water) data.
The rotation velocity at the base of the SS-outflow (y=002) deduced from SiO =1, =6-5 is similar to, perhaps slightly smaller than, that derived from NaCl; the limited S/N of the data precludes a very accurate estimate of the rotation velocity and its spatial distribution in these inner regions, which are also compact compared with the angular resolution of our ALMA maps. At the nebula equator (y=0), the SiO =1, =6-5 emission is very weak, except for the dominant bright =22 km s-1 emission peak from the center; for this reason identifying and quantifying rotation in the SiO =1, =6-5 data at this zero latitude regions is problematic and obviously less clear than in the maps of the salts and water.
5 Analysis of the NaCl emission
5.1 Physical conditions in the rotating disk

We have performed a NaCl population diagram analysis in order to constrain the excitation temperature and optical depth of the observed transitions and, thus, to obtain a rough estimate of the physical conditions in the surface layers of the rotating, geometrically thick disk where the NaCl emission arises. The population diagram is a well-known and widely used analysis technique under the assumption of optically thin line emission and local thermal equilibrium (LTE). This method has been described in detail and discussed extensively by, e.g., Goldsmith & Langer (1999) and it has been successfully used in the analysis of molecular line emission of many evolved stars, including OH 231.8 (Sánchez Contreras et al., 2015; Velilla Prieto et al., 2015; Sánchez Contreras et al., 2018). Here, we use the approach presented in Ramos-Medina et al. (2018) where the total line fluxes integrated over the emitting area are used to ultimately derive the total number of molecules of NaCl ((NaCl)) and the excitation temperature in the emitting volume. The spectroscopic parameters of the rotational transitions used in this analysis, including the line frequencies (), Einstein coefficients (), and the rotational and vibrational partition functions ( and ) of NaCl are from MADEX (Cernicharo, 2012), which has been updated to include new laboratory dipole moment values and collisional rates for this species (Cabezas et al., 2016; Quintana-Lacaci et al., 2016).
The population (or Boltzmann) diagram for NaCl in OH 231.8 is shown in Fig. 12. The linear fit to the data including all transitions from =0 to =3 indicates a vibrational temperature of =1125160 K. The rotational temperature (), derived using rotational transitions within the same vibrational state, cannot be properly constrained from this diagram alone since a wide range of values, spanning from 40 K up to 1000 K, are consistent with the data; this is because of the large data errorbars, derived from the limited S/N of the individual lines, the small number of rotational transitions detected within the same vibrational level (two and three within =0 and =1, respectively), and the narrow range of Eu spanned between them (Eu≲ 35 K).
Fortunately, it is possible to obtain an estimate of directly from the velocity-channel maps of the NaCl (=0, =20-19) transition by taking advantage of the weak line absorption at the nebula center, around 32 km s-1 (Fig. 16). At this position, the brightness temperature of the line (after continuum subtraction) in the Rayleigh-Jeans limit555The Rayleigh-Jeans approximation is valid at these frequencies for the temperatures expected in these inner regions, of 100 K – see below. is given by
| (1) |
where is the brightness temperature of the continuum and is the line optical depth. The fact that the line is observed in absorption against the background dust continuum means that . The line intensity outside the continuum source, where the dominant background emission source is the 2.7 K cosmic microwave radiation, is given by
| (2) |
Combining Eq. 1 and 2 and taking into account the values of the line emission and absorption measured in the NaCl (=0, =20-19) maps as well as that of the continuum peak in the same spectral window666For a proper line-to-continuum comparison, we use the continuum maps of the same spectral window where the line was observed cleaned and restored exactly in the same manner and, thus, imaged with the same beam. (130 K, 150-200 K, and 730 K, e.g. Fig. 16), we deduce 400-450 K and 0.5-0.6. (Similar values are inferred from the NaCl (=0, =18-17) maps, not shown.)
As seen in Fig. 12, a value of 400-450 K is well within the range of temperatures consistent with the intra-=0 and =1 data points in the population diagram. More precisely, we find that 450 K is the value that best explains simultaneously the population diagram, the optical depth (around 0.5-0.6) and the mean line brightness temperature of the NaCl (=0, =20-19) transition outside the continuum source (150-200 K). A straight-line fit to the =0 data with a fixed slope of 1/1/450 K implies a total number of NaCl molecules in the =0 level of (NaCl,=0)1.3. To compute the corresponding column density, we have used the simplified equation: =/, where 30 au represents the characteristic radius of the region where the NaCl emission is produced projected in the sky. The resulting column density and NaCl (=0, =20-19) line opacity are (NaCl,=0)2 cm-2 and 0.6 (for a line FWHM10 km s-1), respectively.
The total number of NaCl molecules, also including the population of excited vibrational levels (¿0), has been computed as =(NaCl,=0)(1125K), where (1125K)3.6. The value obtained, implies a beam-averaged NaCl column density of (NaCl)7 cm-2 and a total mass of 1.7 in the emitting volume, adopting a fractional NaCl-to-H2 abundance of (NaCl)5 (Sánchez Contreras et al., 2018). A canonical opacity correction (=) can also be applied (following, e.g., Goldsmith & Langer (1999); Ramos-Medina et al. (2018)), which results in a mass-correction factor of 30%, thus implying (NaCl)8 cm-2 and a total mass of 2 . Considering the dimensions of the NaCl-emitting volume, we deduce an average H2 number density of 3 cm-3 in the surface layers of the rotating disk, as expected for these inner regions.
As we have seen before, the relative intensities of the different NaCl lines, including rotational transitions in the ground vibrational state and from excited vibrational levels, suggest different values for and . This is not unexpected as similarly values are found in other sources with NaCl detections, e.g. the red supergiant VY CMa (Alcolea et al., 2013; Kamiński et al., 2013) and the Orion SrcI’s disk (Ginsburg et al., 2019). The high values of here inferred suggest that the vibrationally excited levels of NaCl could be predominantly populated by IR pumping as a result of strong IR emission from dust grains in these central regions of the nebula. (Note that, unlike the rotational levels inside a given vibrational state, the vibrational ladders are radiatively connected by 30 m radiation).
The value of the derived from the NaCl population diagram in OH 231.8 is very similar to the typical gas kinetic temperatures observed at distances of a few tens of au (fewcm) in the envelopes of other evolved stars – see e.g. the compilation of temperature radial distributions in Ramos-Medina et al. (2018). This probably indicates that, in contrast to the vibrational levels, the rotational levels are predominantly populated by collisions and, thus, are thermalized or close to thermalization. This is in good agreement with the critical densities of the rotational transitions observed, few cm-3, which are much lower than the mean density in these regions of the rotating disk deduced from our population diagram analysis (109 cm-3). These results support the assumption of local thermodynamic equilibrium (LTE) adopted in the NaCl emission model presented in the next section.
5.2 Spatio-kinematic model
We have compared the ALMA NaCl maps with the predictions of a LTE radiative transfer model for this species. We have used a code that has been employed in numerous previous works by our team under the LTE or non-LTE approximation (e.g. most recently by Bujarrabal et al., 2021). Modeling has been done in two steps. First, the model is exclusively used to constrain the geometry and velocity field of the NaCl-emitting volume by comparison with the NaCl line-stacked maps, which have the largest S/N ratio and, thus, provide the best diagnostic of the nebular spatio-kinematics. Once the geometry and kinematics of the source have been established, we have used the model to reproduce the surface brightness emission of one of the individual transitions observed, in particular the NaCl (=0, =20-19) line, with the aim of further constraining the physical conditions (density and temperature) of the emitting region.
In order to compare the model predictions with the ALMA data in an optimum way, we have first built NaCl model data cubes using the same velocity resolution but a much better spatial resolution (and finer pixel sampling) than the observed data. Later on, these synthetic data cubes have been Fourier-transformed and sampled to mimic the original -data from the ALMA observation. This task has been done using the GILDAS procedure uv_fmodel. Then, the -data from the model are mapped and cleaned exactly in the same way we did for the -data from the observations. By doing so, we can directly compare the resulting clean images from ALMA and from our modeling: both with exactly the same spatial and spectral resolutions, similar MRSs and lost flux if any (not expected in this case), etc.
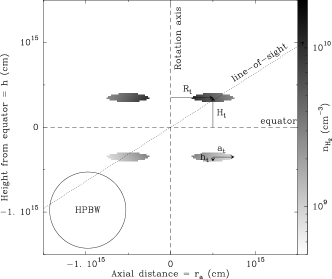
In light of our ALMA data, we have approximated the geometry of the NaCl-emitting volume as two co-axial tori displaced along the nebula axis from the continuum disk midplane, emulating the two (north and south) surface layers (above and below) the disk where the salts and water are detected. (This geometry can also be visualized as a unique hollow cylindrical structure with a lack of NaCl emission in the equatorial waist.). A value of =30-35° has been adopted for the line-of-sight inclination of the tori’s equatorial plane, meaning that the tori are roughly orthogonal to the bipolar nebula, as observed in the plane of the sky. The model-data fitting process indeed rules out values of the inclinations departing by more than 5° from this range.
The continuum emission source at the nebula center has been approximated by an elliptical Gaussian of radius 26 mas18 mas and a characteristic brightness temperature of 1200 K, as inferred from a 2d Gaussian fit to the continuum maps at 260 GHz, i.e., the spectral window in which NaCl (=0, =20-19) is observed. The continuum has been included in the model with the only purpose of reproducing the weak line absorption observed at 32 km s-1, which is partially responsible for the emission dip at the center of the integrated intensity maps of the NaCl-stacked data. For simplicity, the continuum source has been placed at the center of the NaCl-rotating structure. For an optically thin dust continuum source that is relatively compact compared with the line-emitting volume, the model predictions are expected to be adequate for our purposes. A proper radiative transfer model of the dust continuum disk is out of the scope of this paper and will be presented elsewhere.
A sketch of the geometry adopted in the NaCl model, as well as some views of the synthetic data, are shown in Fig. 13 (top and bottom, respectively). The parameters of the best-fit model are given in Table 3.
| Parameter | value |
|---|---|
| Distance () | 1500 pc |
| LSR Systemic velocity () | 35 km s-1 |
| Inclination () | 32.5° |
| Radius of the tori () | 5 cm |
| Height of the tori () | 3.5 cm |
| Semi-Major axis of the tori’s elliptical cross section () | 2.5 cm |
| Semi-Minor axis of the tori’s elliptical cross section () | 5 cm |
| Keplerian rotation () | 4.0 km s-1 |
| Equatorial expansion () | 3.5(/40 au) km s-1 |
| Turbulent velocity () | 2 km s-1 |
| Molecular hydrogen density () | 5()-2.0 cm-3 |
| Gas kinetic temperature () | 450()-0.6 K |
| NaCl-to-H2 abundance (X(NaCl)) | 5 |
The overall kinematics deduced from the ALMA maps is reasonably well described with a composite velocity field that includes rotation in the equatorial plane at 4 km s-1 (at a mean radial distance of 40 au) plus expansion, with equatorial expansion leading to slightly better data-model agreement than a radial velocity distribution. The average equatorial expansion velocity on the best-fit model is 3 km s-1. Since the cross section of the tori is small compared with the angular resolution of our data, a very accurate determination of the radial dependence of the velocity is not possible. In particular, we are not able to discern between Keplerian or sub-Keplerian rotation, although the presence of expansion in these regions makes the later more plausible based on the results obtained for a number of dpAGB objects with spatially resolved rotating and expanding circumbinary disks. A turbulent velocity of 2 km s-1 has been used in our model to reproduce the width of the line absorption feature at 32 km s-1, with values of 1 and 3 km s-1 giving in general less satisfactory results.
Adopting a uniform temperature of 400-500 K, as deduced in § 5.1, the densities of the model that best reproduce the flux and line profile of the NaCl (=0, =20-19) transition are of a few cm-3, also in agreement with the average densities derived from our analysis presented in § 5.1. For a (perhaps) more realistic model, radial power-laws of () and have been chosen for the best-fit model, although there are not significant differences in the synthetic maps compared with those obtained using uniform values of the density and temperature within the NaCl-emitting volume. In our simple model, we have adopted larger densities (by a factor of 3) for the North surface disk layer than for the South one to reproduce the larger surface brightness of the former observed in the data. Note, however, that the presence of a density contrast between the two layers of the disk cannot be accurately determined since the NaCl brightness asymmetry could also reflect different excitation conditions and/or different fractional NaCl abundances between the two layers above and below the dust disk. High S/N maps of several NaCl transitions would be needed for a more accurate description of the density and temperature conditions in these regions.
As we can see in Fig. 13, our model reproduces reasonably well the surface brightness distribution of NaCl, including the overall shape and size of the integrated intensity maps (and the velocity-channel maps) as well as the position of the four brightness peaks and the narrow equatorial waist. The model also produces a weak line absorption against the continuum, i.e. toward the center, near 32 km s-1, consistent with the observations. The predicted velocity distribution and the integrated line profile are in fair agreement with the data as well, with the data probably suggesting slightly larger velocities in regions close to the disk midplane than the model. We note however that the S/N of the NaCl maps at these low-latitude regions is particularly low and that the angular resolution is in any case moderate as to precisely describe the kinematics, which may involve velocity (radial or latitudinal) gradients, in these compact regions.
6 The central binary system
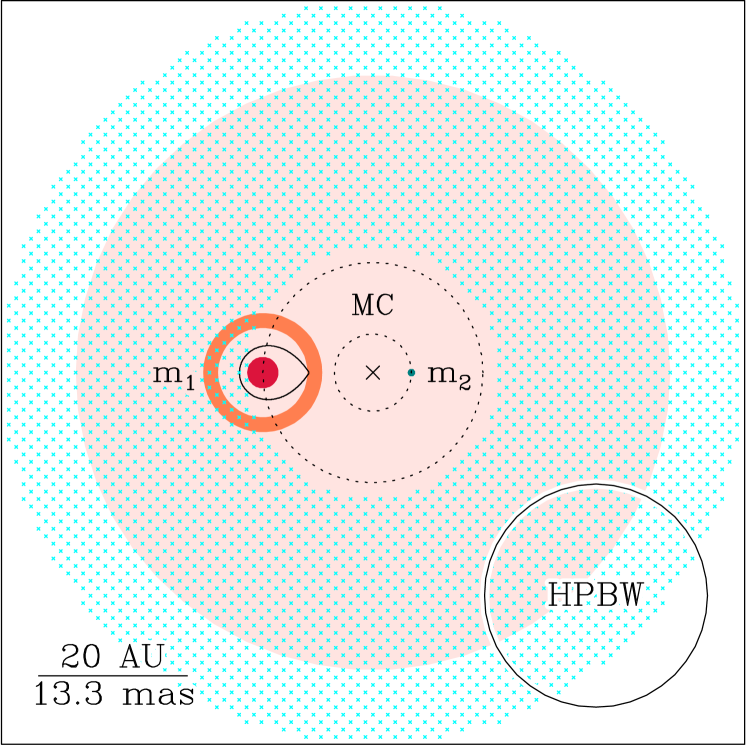
To date, the orbital parameters of the binary system at the core of OH 231.8, formed by the AGB star QX Pup and an A0 main-sequence companion (§ 1), have remained totally unconstrained. As shown in § 3, our ALMA continuum maps spatially resolve a disk-like structure at the center of OH 231.8 and a point-like source whose centers are not coincident, with offsets between the two along the major and minor axis of the disk of about 4.50.3 and 4.90.2 mas, respectively, leading to an absolute offset of 6.60.3 mas (100.5 au). As already discussed, the point-like source marks the position of the central AGB star QX Pup.
The relative offset between QX Pup and the center of the disk is expected if the disk is circumbinary because in that case the disk’s centroid would coincide with the center of mass (CM) of the binary system. If this is the case, and assuming for simplicity a circular binary orbit, the relative offset between the primary star QX Pup and the CM (a1) can be used to derive the orbital distance of the secondary (a2) as long as the stellar masses are known. After deprojection of the distance between QX Pup and the disk plane, considering a line-of-sight inclination for the disk plane of 30°-35°, we deduce a value for a1=-=10.8-9.6 mas16.2-14.4 au, that is, a1=151 au. Adopting a stellar mass for the companion and QX Pup of m22 and m10.7 , respectively (see Appendix § B), we deduce a value of a25 au, which results in a total (a=a1+a2) orbital separation of a20 au. A schematic representation of the central binary system and the dust and NaCl components found in this work is shown in Fig. 14.
The orbital separation deduced for the system (a20 au) implies an orbital period of 55 yr for the stellar masses adopted. The long orbital period and orbital velocity of QX Pup, 8cos(30°-35°)7 km s-1 (after deprojection) deduced are consistent with the variations of the centroid of the SiO maser profile observed toward OH 231.8 over the course of more than two decades, with mean velocity offsets relative to the systemic velocity ranging between 8 and 6 km s-1 as recently compiled by Kim et al. (2019) — see their Fig. 7d.
From the rotation velocity of the surface layers of the circumbinary disk, 4 km s-1 at a radial distance from the center of 40 au (Table 3), and adopting a purely Keplerian regime we deduce a value for the central mass of 0.7 . This value of the mass is clearly lower than the total mass of the binary system formed by the mass-losing AGB star QX Pup and the A0 main-sequence companion (mT=m1+m22.7 ). As already mentioned in the previous section, the expansive motions measured in the disk, with 3 km s-1, suggest sub-Keplerian rotation in which case the value of the central mass computed above has to be taken as a lower limit.
An upper limit to the central mass can be obtained from angular momentum conservation considerations using the following expression:
,
where is the central mass computed above in a purely Keplerian regime, and and are the radial distances from the rotating gas to the central mass observed at present (40 au) and when the disk started its expansion, respectively. Assuming that the disk started its expansion at the minimum radius that was possible, presumably a115 au, we derive an upper limit to the central mass of 2 . If we take to be roughly half of the current orbital separation (10 au), we derive an upper limit to the central mass of 2.8 . In spite of the vast uncertainties associated to the simplified assumptions used and unknown value of , the crude values just obtained are close to the total mass of the binary system inside OH 231.8.
A similar result is reached if we interpret that the gas we detect in NaCl emission comes from a disk formed of gas ejected by QX Pup that is then initially expanding and corrotating with it (i.e. sharing its orbital motion, 8 km s-1 at a115 au). If we suppose that the velocity modulus decreases with the distance to the disk axis, then we expect a rotation velocity of 8 km s-1 4 km s-1 in the NaCl-disk, coincident to what is observed and, thus, in support of a central mass of 2.7 . However, in this case the forces cannot be assumed to be exactly radial and the law of angular momentum conservation does not obviously hold. The sole purpose of these rough calculations is to show that the upper bound on the mass of the central system is probably not much larger than a few .
From our model of the NaCl emission, i.e. the gas density distribution and velocity field, we deduce a value for the angular momentum of the rotating disk of Jdisk0.24 au km s-1 (7.2 kg m/s). The lower limit arises because the NaCl emission does not probe the disk in its entirety but only its surface layers and within a certain range of radii. Obtaining a reliable estimate of the total angular momentum of the circumbinary disk is not possible, given the unknown density and velocity structure of the disk interior, but it is unlikely to be orders of magnitude larger than the lower limit given above taking into account the disk dimensions (inferred from the continuum data) relative to the NaCl-emitting volume (see Fig. 13). For comparison, we note that the angular momentum of the circumbinary disk of the Red Rectangle (a prototype dpAGB object), which is relatively massive (1.3 ) and significantly larger (Rdisk1500 au) than the disk in OH 231.8, is 9 au km s-1 (Bujarrabal et al., 2016). Therefore we believe the angular momentum of the circumbinary disk in OH 231.8 can be safely expected to be at most Jdiskfew1 au km s-1. This value is much smaller than the angular momentum contained at present within the orbit of the binary system formed by QX Pup and the A0 V companion, Jorb=115 au km s-1 (=3.4kg m2/s), assuming a circular orbit for simplicity. This implies that a small decrease in the orbital separation (of less than a few %) in the past could have accounted for the angular momentum of the circumbinary disk (under the reasonable assumption that the binary imparted angular momentum to the circumbinary disk).
7 Discussion
7.1 The locus and extremely slow expansion of the NaCl-emitting layers
It is well known that in normal AGB stars NaCl forms by equilibrium chemistry near the stellar photosphere and that this species, given its refractory character, disappears from the gas phase rapidly as it gets incorporated into dust grains (Milam et al., 2007; Mauron & Huggins, 2010). In OH 231.8, we observe NaCl on the surface layers of the dust disk, that is, beyond a region where dust has already formed massively and where, in principle, NaCl should then be significantly gas depleted as a consequence of condensation onto the grains. At the base of the SS-outflow, the NaCl emission is found to be co-spatial with that of SiO (§ 4.4 and Fig. 10), which is a well known shock tracer (Ginsburg et al., 2019). This suggests that shocks are probably efficiently extracting not only SiO but also NaCl from grains and returning it to the gas phase in these regions. We note that NaCl (or SiO) is not observed in the disk midplane, which could indicate that this molecule is absent (significantly gas depleted) in these dense and dusty, low-latitude regions that are most likely unaffected by shocks or, alternatively, that the emission is extremely faint due to excitation and radiative transfer effects (for example if the dust and gas temperatures are similar). In contrast to SiO, which is observed at high elevations throughout the SS-outflow, the salts emission is constrained to 20 au above and below the disk midplane. This is expected given the large dipole moment of NaCl and KCl, which results in these rare (low abundance) species being extremely good/selective tracers of high-density regions in contrast to the more abundant SiO, which is a better tracer of low-density regions (e.g. Quintana-Lacaci et al., 2016).
We believe that, although it is not impossible, processes like sublimation of NaCl produced by the stellar radiation of the companion or thermal desorption from the grain surfaces (e.g. Ginsburg et al., 2019) have some difficulties in explaining satisfactorily the locus of the salts in the outer layers of the disk (above 20 AU the midplane) since both processes are expected to have notable effects also in the inner regions of the disk, as the stellar radiation propagates inside out heating up the dust throughout the disk to its outer regions where the salts are observed.
Another surprising result from this work is the extremely low expansion velocity (3 km s-1) measured at the surface layers of the rotating disk, at relatively large radial distances from the center of 40 au6cm20 . At these distant regions, clearly beyond the massive dust condensation (wind acceleration) zone, the wind velocity of a normal O-rich AGB star should be close to the terminal velocity (see e.g. Decin et al., 2010), that is, close to 15-25 km s-1 for a high-mass loss rate AGB star like QX Pup. The very low expansion velocity observed around QX Pup implies an extremely slow acceleration of the wind within 40 au resulting indeed in the largest value of the index 8, for a classical -wind velocity profile , measured to date for an AGB star (Khouri et al., 2014, measured =5 for W Hydrae). Under the hypothesis of dust-driven wind, as for normal AGB stars, the inefficient wind acceleration in the close environment of QX Pup could be caused by the presence of very large grains or dust species that are inefficient as wind drivers.
7.2 Formation of an equatorial density enhanced (EDE) structure
Mass-transfer from the AGB star QX Pup to the main-sequence companion is a promising mechanism for the shaping of the dense equatorial rotating disk/torus discovered in this paper. As we show in this section, OH 231.8 brings together several favorable conditions for effective mass-transfer from QX Pup to the companion (at a separation of 20 au) in the so-called wind Roche lobe overflow (WRLOF) mode (Mohamed & Podsiadlowski, 2007). In this mode, the AGB wind material fills the Roche lobe of the giant (primary) and is transferred to the compact component (secondary), ultimately resulting the compression of the AGB wind on the orbital plane and in the subsequent formation of an equatorial density enhanced (EDE) structure that remains gravitationally bound to the binary system.
The mass-transfer efficiency of WRLOF has been explored by several authors using hydrodynamical simulations for a variety of parameters, including binary mass ratios, orbital separations and initial wind velocities (e.g. Jahanara et al., 2005; Chen et al., 2017; Saladino et al., 2019; El Mellah et al., 2020). These simulations indicate that the strength of the interaction and, thus, the final morphology and the pole-to-equator density contrast of the companion-perturbed outflow, mainly depend on the ratio of the wind velocity to the orbital velocity (=/), the primary-to-secondary mass ratio (=M1/M2), and the dust condensation radius filling factor (=/rL, where rL is the Roche lobe of the primary given by Eggleton, 1983). As shown in § 3, the dust condensation radius of OH 231.8 is found to be of about 7.5 au, that is, comparable to the Roche lobe radius, rL6 au, for an orbital separation of 20 au (§ 6). This together with the very low values of 3/80.4 and 0.35, make OH 231.8’s central system very prone to effective mass transfer from QX Pup to the companion and the eventual compression of the AGB wind on the orbital plane to form an EDE, as shown e.g. in the recent hydrodynamical modeling work by El Mellah et al. (2020) (see their Fig. 3).
In the context of WRLOF mass-transfer, it is not well known how long EDEs last once the donor AGB star stops losing mass. The presence of SiO masers at the core of OH 231.84.2 indicates that QX Pup is still undergoing mass-loss at present and, therefore, it is not possible to constrain the age of the rotating circumbinary disk from these type of considerations. However, it is reasonable to assume that the formation of the rotating disk has required at least a few orbits (e.g. Maes et al., 2021), implying that the equatorial disk could be 200 yr old (since 55 yr, § 6). On the other hand, given the rotation velocity and radius of the NaCl-disk, a particle on its surface completes a rotation in about 220 yr, which can also be taken as a lower limit to the age of the rotating disk since the later is observed to be complete.
Finally, we do not observe a central cavity in the dust equatorial disk traced by the continuum emission, which (if exists) would be difficult to discern and characterize due to the presence of the relatively bright point-like continuum source at the center (§ 3), and the (limited) angular resolution of the data. However, this is not inconsistent with the predictions by WRLOF binary interaction/mass-transfer models, which in general do not predict dense equatorial tori cleanly detached from the central binary system but complex density distributions also in regions interior to the binary orbit for cases in that the mass loss is still ongoing (e.g. El Mellah et al., 2020; Chen et al., 2017). Higher angular resolution observations of the central disk of OH 231.8 to be compared with WRLOF binary interaction hydrodynamical simulations specifically accounting for the properties of OH 231.8 and its central binary are needed to further constrain the formation history of the rotating disk discovered in this work.
7.3 The SS-outflow
In principle, given its low-velocity and wide opening angle, the SS-outflow could simply result from the confinement of the on-going AGB wind from QX Pup by the dense equatorial torus: the underlying stellar wind escapes through the low-density polar regions but is impeded along the dense equator of the companion-perturbed AGB-wind environment (as in the so-called Generalized Interacting Stellar Winds scenario of PN-shaping, Balick (1987)). There are, however, some properties of the SS-outflow that are not well understood in the simple scenario of a confined dust-driven AGB wind, for example, the radial velocity steady increase with the distance to the center (up to 16 km s-1 at 350 au) and, most importantly, the start of the wind acceleration beyond the region of massive dust formation (§ 4.2). These properties suggest that we may be witnessing the active acceleration and shaping process of the primary’s stellar wind (probably partially perturbed already by the companion) as it escapes through the poles of the circumbinary disk.
If this is the case, our data indicate that such acceleration process is acting on linear scales of up to 350 au, which is the region where the kinematic pattern is observed. Beyond this point, the SS-outflow reaches its terminal velocity (16 km s-1), suggesting that the acceleration mechanism is not active anymore or that the outward acceleration force is fully compensated by the ambient ram pressure. Under the hypothesis of a stellar wind that is currently being accelerated at a constant rate, the kinematic age of the SS-outflow can be computed as 2350 au/16 kms200 yr, or equivalently, using the inverse of the deprojected velocity gradient observed at its base as 21/v2/65 km s-1 arcsec-1220 yr (§ 4.3).
Alternatively, if we assume that the kinematic pattern is the result of ballistic (self-similar) expansion after a short acceleration (outburst-like) event that has already ended, the age of the SS-outflow would then be 1/v110 yr, and the duration of the acceleration burst event itself would then have been a small fraction of this, i.e. perhaps as short as a few years or a decade.
As already discussed in SCetal18, there are several evidences showing that the SS-outflow, in any case, is running into and carving out pre-existing circumstellar material, for example: the presence of shocks, demonstrated by the selective SiO emission from this component, as well as the dense-walled structure and rounded tips of its lobes, which naturally arise in a two-wind interaction scenario but are otherwise difficult to justify in case of a purely pristine (i.e. largely unaffected by wind interaction) stellar wind (see e.g. hydrodynamical simulations by Balick et al., 2017).
Our data show that the base of the SS-outflow and the surface layers of the disk (traced by the salts and water) overlap spatially and, in consequence, share a similar (rotation and expansion) kinematics. This could indicate that the SS-outflow is a disk wind, i.e. a wind launched from the surface layers of the circumbinary disk, or, alternatively, that the confined stellar wind is dragging along some of the material in the inner edge of the disk as it escapes through the low-density poles. We believe that the second hypothesis is more probable since putative disk-winds found to date in some dpAGBs objects are significantly more tenuous than the circumbinary disks from which they emerge and are constrained to low latitudes (Gallardo Cava et al., 2021, and references therein), in contrast to the SS-outflow in OH 231.8.
In a future publication we will carry out a deeper investigation and discussion of the origin of the SS-outflow, which requires a comprehensive analysis (by radiative transfer modeling) of multiple transitions of SiO to precisely determine its physical properties, dynamics and mass-loss rate. These are crucial parameters to determine, e.g., if the SS-outflow is consistent with acceleration due to radiation pressure or if, on the contrary, its linear momentum is far too large to be explained by this mechanism, as observed in the large-scale molecular outflow of OH 231.8 and many wpPNe (§ 1).
Regardless of the precise origin of the SS-outflow, which remains to be determined, it is clear from the absence of fast ejections (together with the lack of classical accretion indicators, such as H emission from the nucleus,e.g. Sánchez Contreras et al., 2004) that high-rate accretion and wind launching by a compact object is not happening at present: the low-velocity of the SS-outflow unequivocally indicates that the wind is not launched by a compact object because wind ejection speeds are typically of the same order of, but larger than, the escape velocity of the ejector (see e.g. Kwok, 2007). The situation was clearly different 800 yr ago, when the large-scale bipolar nebula was shaped and accelerated up to velocities of 400 km s-1, a process that necessarily required accretion on (and jet-launching from) a compact main-sequence companion (Sánchez Contreras et al., 2004). The marked differences between the SS-outflow and the fast large-scale lobes indicate that the binaries interaction mode and wind shaping process have changed over the course of the evolution of OH 231.8. Perhaps the accretion disk around the companion has been exhausted in recent times. Alternatively, as it was proposed by Sánchez Contreras et al. (2004), OH 231.8 could be at present in a low-rate accretion (or ‘quiescent’) state in which the disk around the companion is steadily building up its mass but there is no effective disk-to-companion accretion (and no jet launching). Indeed, other astrophysical systems, like FU Ori objects and symbiotic stars (Hartmann & Kenyon, 1996, and references there in), are known to experience a similar evolution, going through alternating accretion outburst and post-outburst (quiescent) states.
8 Summary
We have mapped with unprecedented angular resolution (down to 20 mas 30 au) the molecular line and dust continuum emission from the central regions of the wind-prominent pPN OH 231.84.2 (hereafter OH 231.8). Here we present the results from the dust continuum emission and a selection of molecular transitions observed in the range 216-261 GHz with the Atacama Large Millimeter/submillimeter Array (ALMA). We spatially resolve the close stellar environment around the central AGB star QX Pup (clump S) and the compact bipolar outflow that emerges from it (SS-outflow). A major result from this work is the discovery of a rotating circumbinary disk that is selectively traced by NaCl, KCl, and H2O. This is the first time that equatorial rotation is reported in this object and, more generally, in pPNe with massive bipolar outflows. We summary the main results from, and points addressed in, this work as follows:
-
-
The continuum emission from the compact region around QX Pup (clump S) is spatially resolved in two main components: an extended disk-like component, elongated in the direction perpendicular to the bipolar nebula, and an unresolved component. The properties of the extended component are consistent with a circular dusty disk of radius of 40 au inclined 40∘ with respect to the line of sight. The point-like continuum emission is consistent with being due to the stellar photosphere/radiosphere of QX Pup and to hot (1400 K) dust within a few stellar radii (7.5 au). We observe a small offset (6.6 mas) between the centroid of the extended disk and the position of the point-like source.
-
-
The continuum flux from clump S follows a frequency dependence, both for the extended disk-like and the point-like component, probably due to emission by large (mm-sized) dust grains with flat emissivity at mm-wavelengths. Under this assumption, the dust mass is about 1.5-1.5 in the extended disk and 10-6-10-5 in the hot-dust region around QX Pup.
-
-
We have detected a total of 8 different transitions of NaCl in different =0, 1, 2, and, tentatively 3, vibrational levels (Table 2), which have been combined to obtain a NaCl line-stacked emission cube. The NaCl emission is found to arise from the surface layers of the extended dust disk. These layers of the disk are in rotation, with the east (west) side receding from (approaching to) us. The rotation velocity deduced from the NaCl maps is about 4 km s-1 at a mean radial distance of 40 au. In addition to rotation, there are also expansive motions with a strikingly low expansion speed of 3 km s-1.
-
-
The spatio-kinematics and physical conditions (density and temperature) of the circumbinary disk have been estimated from a rotational diagram analysis of the individual NaCl transitions (§ 5.1) and from the comparison of the ALMA NaCl maps with the predictions of an LTE radiative transfer model (§ 5.2). The best-fit model parameters and synthetic maps are given in Table 3 and Fig. 13. We deduce an average rotational temperature of 400-500 K and H2 densities of 109 cm-3, resulting in a total mass of the disk’s surface layers of about 2 (for a fractional NaCl-to-H2 abundance of 5). The line-of-sight inclination of the disk’s plane is constrained to values of 30-35°.
-
-
In addition to NaCl, we have found two other molecular species that selectively trace the rotating equatorial structure at the core of OH 231.8, namely, potassium chloride (KCl, i.e. another salt) and water (H2O). KCl is a new detection in this object and also represents the first detection of this molecule in an O-rich AGB CSE.
-
-
The orbital separation of the central binary system of OH 231.8 have been estimated to be 20 au, given the relative offset between the locus of QX Pup and the centroid of the extended dust disk, under the plausible hypothesis that the disk is circumbinary. We derive an orbital period of 55 yr. From the, probably sub-Keplerian, rotation detected in the disk, we derive a lower limit to the present central mass of the binary system of 0.7 .
-
-
The SS-outflow, a compact (1′′4′′) bipolar outflow that emerges from clump S, is traced by several rotational transitions in the =0 and =1 vibrational states of SiO and SiS (including some isotopologues). Here, we focus our study on the ALMA maps of the SiS =0, =12-11 and SiO =1, =6-5 transitions.
-
-
The lobes of the SS-outflow have a conical geometry at their base, consistent with a wide opening angle (90∘) wind, and a more rounded morphology at their tips. The SS-outflow emerges from the surface layers of the rotating equatorial disk, where the SiS =0, =12-11 and NaCl emission partially overlap. We find a gradual outward acceleration of the gas along the lobes up to a terminal expansion speed of about 16 km s-1, reached at a radial distance of 350 au. The radial expansion continues at constant velocity beyond this point. We have constrained the inclination of the SS-outflow to values around 30∘ with respect to the plane of the sky.
-
-
The SiO =1, =6-5 transition is selective probing the high-excitation regions of the SS-outflow closer to the center (within 100 au). The kinematics at the base of the SS-outflow is predominantly expansive but the signature of rotation is also present, particularly in regions close to the equator (within 30 au).
-
-
Based on the presence of gas-phase SiO, a well known shock tracer, at the base of the SS-outflow and partially overlapping with the NaCl-emitting regions, we believe that shocks are the main agents efficiently extracting both NaCl and SiO (and probably other refractory/ice species) from dust grains and returning it to the gas phase.
-
-
The expansion velocity (3 km s-1) at the surface layers of the rotating disk at 40 au6cm20 is unexpectedly low. The reason for such an inefficient wind acceleration in OH 231.8 is unknown.
-
-
The circumbinary disk in OH 231.8 probably results from wind Roche Lobe OverFlow (WRLOF). Indeed, OH 231.8 brings together several favorable conditions for the formation of a dense equatorial structure under this scenario, namely: an extremely low expansion velocity (3 km s-1), a very massive companion (q=/0.41) and comparable sizes of the dust condensation radius (7.5 au) and the Roche lobe radius (rL6 au).
-
-
The angular momentum of the NaCl-emitting surface layers of the circumbinary disk of OH 231.8 is found to be Jdisk0.24 au km s-1 (7.2 kg m/s). The angular momentum of the circumbinary disk in its entreaty is probably at most Jdiskfew1 au km s-1, which is two orders of magnitude lower than the angular momentum contained at present within the orbit of the central binary. This implies that a few per cent decrease in the orbital separation can account for the angular momentum of the circumbinary disk.
-
-
The origin of the SS-outflow is unclear. The SS-outflow could represent the on-going companion-perturbed AGB wind escaping through the low-density poles of the circumbinary disk and running into the surrounding material. The kinematic pattern observed may indicate that the SS-outflow is undergoing acceleration (by a yet unknown mechanism) at linear scales of 350 au.
-
-
The age of the SS-outflow is between 100 yr (assuming that is ballistically expanding) and 200 yr (in the case of constant acceleration), to be compared with the 800 yr age of the large-scale CO outflow. A lower limit to the age of the rotating circumbinary disk of 200 yr is deduced.
-
-
Contrary to what probably happened 800 years ago, when the fast (100 km s-1) large-scale bipolar lobes of OH 231.8 where shaped, high-rate accretion and wind launching by a compact object is most likely not taking place at present. Therefore, the binary interaction mode and/or wind shaping process seem to have changed over the course of the evolution of this object.
Acknowledgements.
We thank the anonymous referee for very useful suggestions. This paper makes use of the following ALMA data: ADS/JAO.ALMA#2017.1.00706. ALMA is a partnership of ESO (representing its member states), NSF (USA) and NINS (Japan), together with NRC (Canada), NSC and ASIAA (Taiwan), and KASI (Republic of Korea), in cooperation with the Republic of Chile. The Joint ALMA Observatory is operated by ESO, auI/NRAO and NAOJ. The data here presented have been reduced by CASA (ALMA default calibration software; https://casa.nrao.edu); data analysis was made using the GILDAS software (http://www.iram.fr/IRAMFR/GILDAS). This work is part of the I+D+i projects PID2019-105203GB-C22, PID2019-105203GB-C21, and PID2020-117034RJ-I00 funded by the Spanish MCIN/AEI/10.13039/501100011033. This research has made use of the JPL Molecular Spectroscopy catalog, The Cologne Database for Molecular Spectroscopy, the SIMBAD database operated at CDS (Strasbourg, France), the NASA’s Astrophysics Data System and Aladin.References
- Agúndez et al. (2020) Agúndez, M., Martínez, J. I., de Andres, P. L., et al. 2020, A&A, 637, A59. doi:10.1051/0004-6361/202037496
- Alcolea et al. (2001) Alcolea, J., Bujarrabal, V., Sánchez Contreras, C., Neri, R., and Zweigle, J. 2001, A&A, 373, 932
- Alcolea et al. (2013) Alcolea, J., Bujarrabal, V., Planesas, P., et al. 2013, A&A, 559, A93. doi:10.1051/0004-6361/201321683
- Balick (1987) Balick, B. 1987, AJ, 94, 671
- Balick and Frank (2002) Balick, B., and Frank, A. 2002, ARA&A, 40, 439
- Balick et al. (2017) Balick, B., Frank, A., Liu, B., et al. 2017, ApJ, 843, 108. doi:10.3847/1538-4357/aa77f0
- Bladh et al. (2019) Bladh, S., Liljegren, S., Höfner, S., et al. 2019, A&A, 626, A100. doi:10.1051/0004-6361/201935366
- Bloecker (1995) Bloecker, T. 1995, A&A, 297, 727
- Bowers and Morris (1984) Bowers, P. F., and Morris, M. 1984, ApJ, 276, 646
- Bujarrabal et al. (2001) Bujarrabal, V., Castro-Carrizo, A., Alcolea, J., et al. 2001, A&A, 377, 868. doi:10.1051/0004-6361:20011090
- Bujarrabal et al. (2003) Bujarrabal, V., Neri, R., Alcolea, J., et al. 2003, A&A, 409, 573. doi:10.1051/0004-6361:20030981
- Bujarrabal et al. (2013) Bujarrabal, V., Alcolea, J., Van Winckel, H., et al. 2013, A&A, 557, A104.
- Bujarrabal et al. (2015) Bujarrabal, V., Castro-Carrizo, A., Alcolea, J., et al. 2015, A&A, 575, L7. doi:10.1051/0004-6361/201525742
- Bujarrabal et al. (2016) Bujarrabal, V., Castro-Carrizo, A., Alcolea, J., et al. 2016, A&A, 593, A92. doi:10.1051/0004-6361/201628546
- Bujarrabal et al. (2017) Bujarrabal, V., Castro-Carrizo, A., Alcolea, J., et al. 2017, A&A, 597, L5. doi:10.1051/0004-6361/201629317
- Bujarrabal et al. (2018) Bujarrabal, V., Castro-Carrizo, A., Van Winckel, H., et al. 2018, A&A, 614, A58. doi:10.1051/0004-6361/201732422
- Bujarrabal et al. (2021) Bujarrabal, V., Agúndez, M., Gómez-Garrido, M., et al. 2021, A&A, 651, A4. doi:10.1051/0004-6361/202141002
- Cabezas et al. (2016) Cabezas, C., Cernicharo, J., Quintana-Lacaci, G., et al. 2016, ApJ, 825, 150. doi:10.3847/0004-637X/825/2/150
- Cernicharo (2012) Cernicharo, J. 2012, EAS Publications Series, 58, 251. doi:10.1051/eas/1258040
- Chen et al. (2017) Chen, Z., Frank, A., Blackman, E. G., et al. 2017, MNRAS, 468, 4465. doi:10.1093/mnras/stx680
- Choi et al. (2012) Choi, Y. K., Brunthaler, A., Menten, K. M., and Reid, M. J. 2012, Iau Sympo sium, Volume 287, 407.
- Davidge (2013) Davidge, T. J. 2013, PASP, 125, 115. doi:10.1086/669823
- Decin et al. (2010) Decin, L., Justtanont, K., De Beck, E., et al. 2010, A&A, 521, L4. doi:10.1051/0004-6361/201015069
- De Marco (2009) De Marco, O. 2009, PASP, 121, 316. doi:10.1086/597765
- Eggleton (1983) Eggleton, P. P. 1983, ApJ, 268, 368
- El Mellah et al. (2020) El Mellah, I., Bolte, J., Decin, L., et al. 2020, A&A, 637, A91. doi:10.1051/0004-6361/202037492
- Gallardo Cava et al. (2021) Gallardo Cava, I., Gómez-Garrido, M., Bujarrabal, V., et al. 2021, A&A, 648, A93. doi:10.1051/0004-6361/202039604
- Ginsburg et al. (2019) Ginsburg, A., McGuire, B., Plambeck, R., et al. 2019, ApJ, 872, 54. doi:10.3847/1538-4357/aafb71
- Goldsmith & Langer (1999) Goldsmith, P. F. & Langer, W. D. 1999, ApJ, 517, 209. doi:10.1086/307195
- Hartmann & Kenyon (1996) Hartmann, L. & Kenyon, S. J. 1996, ARA&A, 34, 207
- Höfner & Olofsson (2018) Höfner, S. & Olofsson, H. 2018, A&A Rev., 26, 1. doi:10.1007/s00159-017-0106-5
- Höfner & Freytag (2019) Höfner, S. & Freytag, B. 2019, A&A, 623, A158. doi:10.1051/0004-6361/201834799
- Homan et al. (2017) Homan, W., Richards, A., Decin, L., et al. 2017, A&A, 601, A5. doi:10.1051/0004-6361/201630340
- Homan et al. (2018a) Homan, W., Danilovich, T., Decin, L., et al. 2018, A&A, 614, A113. doi:10.1051/0004-6361/201732246
- Homan et al. (2018b) Homan, W., Richards, A., Decin, L., et al. 2018, A&A, 616, A34. doi:10.1051/0004-6361/201832834
- Jahanara et al. (2005) Jahanara, B., Mitsumoto, M., Oka, K., et al. 2005, A&A, 441, 589. doi:10.1051/0004-6361:20052828
- Jura & Morris (1985) Jura, M. & Morris, M. 1985, ApJ, 292, 487. doi:10.1086/163180
- Kastner et al. (1992) Kastner, J. H., Weintraub, D. A., Zuckerman, B., et al. 1992, ApJ, 398, 552
- Kamiński et al. (2013) Kamiński, T., Gottlieb, C. A., Young, K. H., et al. 2013, ApJS, 209, 38. doi:10.1088/0067-0049/209/2/38
- Karovicova et al. (2013) Karovicova, I., Wittkowski, M., Ohnaka, K., et al. 2013, A&A, 560, A75. doi:10.1051/0004-6361/201322376
- Kervella et al. (2016) Kervella, P., Homan, W., Richards, A. M. S., et al. 2016, A&A, 596, A92. doi:10.1051/0004-6361/201629877
- Khouri et al. (2015) Khouri, T., Waters, L. B. F. M., de Koter, A., et al. 2015, A&A, 577, A114. doi:10.1051/0004-6361/201425092
- Khouri et al. (2014) Khouri, T., de Koter, A., Decin, L., et al. 2014, A&A, 561, A5. doi:10.1051/0004-6361/201322578
- Kim et al. (2019) Kim, J., Cho, S.-H., Bujarrabal, V., et al. 2019, MNRAS, 488, 1427. doi:10.1093/mnras/stz1830
- Knapp (1985) Knapp, G. R. 1985, ApJ, 293, 273
- Kwok (2007) Kwok, S. 2007, The Origin and Evolution of Planetary Nebulae, by Sun Kwok, Cambridge, UK: Cambridge University Press, 2007
- Leahy & Leahy (2015) Leahy, D. A. & Leahy, J. C. 2015, Computational Astrophysics and Cosmology, 2, 4. doi:10.1186/s40668- 015-0008-8
- Li & Draine (2001) Li, A. & Draine, B. T. 2001, ApJ, 554, 778. doi:10.1086/323147
- Quintana-Lacaci et al. (2016) Quintana-Lacaci, G., Cernicharo, J., Agúndez, M., et al. 2016, ApJ, 818, 192. doi:10.3847/0004-637X/818/2/192
- Maes et al. (2021) Maes, S., Homan, W., Malfait, J., et al. 2021, A&A, 653, A25. doi:10.1051/0004-6361/202140823
- Maldoni et al. (2004) Maldoni, M. M., Egan, M. P., Robinson, G., et al. 2004, MNRAS, 349, 665. doi:10.1111/j.1365-2966.2004.07532.x
- Mauron & Huggins (2010) Mauron, N. & Huggins, P. J. 2010, A&A, 513, A31. doi:10.1051/0004-6361/200913970
- Meixner et al. (1999) Meixner, M., Ueta, T., Dayal, A., et al. 1999, ApJS, 122, 221. doi:10.1086/313215
- Milam et al. (2007) Milam, S. N., Apponi, A. J., Woolf, N. J., et al. 2007, ApJ, 668, L131. doi:10.1086/522928
- Miller Bertolami (2016) Miller Bertolami, M. M. 2016, A&A, 588, A25. doi:10.1051/0004-6361/201526577
- Mohamed & Podsiadlowski (2007) Mohamed, S. & Podsiadlowski, P. 2007, 15th European Workshop on White Dwarfs, 372, 397
- Morris et al. (1987) Morris, M., Guilloteau, S., Lucas, R., and Omont, A. 1987, ApJ, 321, 888
- Müller et al. (2005) Müller, H. S. P., Schlöder, F., Stutzki, J., et al. 2005, Journal of Molecular Structure, 742, 215. doi:10.1016/j.molstruc.2005.01.027
- Reid & Menten (1997) Reid, M. J. & Menten, K. M. 1997, ApJ, 476, 327. doi:10.1086/303614
- Reid & Menten (2007) Reid, M. J. & Menten, K. M. 2007, ApJ, 671, 2068. doi:10.1086/523085
- Ramos-Medina et al. (2018) Ramos-Medina, J., Sánchez Contreras, C., García-Lario, P., et al. 2018, A&A, 619, C2. doi:10.1051/0004-6361/201833177e
- Ramstedt et al. (2008) Ramstedt, S., Schöier, F. L., Olofsson, H., et al. 2008, A&A, 487, 645. doi:10.1051/0004-6361:20078876
- Sahai & Trauger (1998) Sahai, R. & Trauger, J. T. 1998, AJ, 116, 1357. doi:10.1086/300504
- Sahai et al. (2007) Sahai, R., Morris, M., Sánchez Contreras, C., et al. 2007, AJ, 134, 2200. doi:10.1086/522944
- Sahai et al. (2011) Sahai, R., Morris, M. R., & Villar, G. G. 2011, AJ, 141, 134. doi:10.1088/0004-6256/141/4/134
- Saladino et al. (2019) Saladino, M. I., Pols, O. R., & Abate, C. 2019, A&A, 626, A68. doi:10.1051/0004-6361/201834598
- Sánchez Contreras et al. (1997) Sánchez Contreras, C., Bujarrabal, V., and Alcolea, J. 1997, A&A, 327, 689
- Sánchez Contreras et al. (2000) Sánchez Contreras, C., Bujarrabal, V., Miranda, L. F., and Fernández-Figueroa, M. J. 2000, A&A, 355, 1103
- Sánchez Contreras et al. (2002) Sánchez Contreras, C., Desmurs, J. F., Bujarrabal, V., Alcolea, J., and Colomer, F. 2002, A&A, 385, L1
- Sánchez Contreras et al. (2004) Sánchez Contreras, C., Gil de Paz, A., and Sahai, R. 2004, ApJ, 616, 519
- Sánchez Contreras & Sahai (2012) Sánchez Contreras, C. & Sahai, R. 2012, ApJS, 203, 16. doi:10.1088/0067-0049/203/1/16
- Sánchez Contreras et al. (2015) Sánchez Contreras, C., Velilla Prieto, L., Agúndez, M., et al. 2015, A&A, 577, A52
- Sánchez Contreras et al. (2018) Sánchez Contreras, C., Alcolea, J., Bujarrabal, V., et al. 2018, A&A, 618, A164. doi:10.1051/0004-6361/201833632
- Sánchez Contreras et al. (2019) Sánchez Contreras, C., Báez-Rubio, A., Alcolea, J., et al. 2019, A&A, 629, A136. doi:10.1051/0004-6361/201936057
- Sharma et al. (2006) Sharma, S., Pandey, A. K., Ogura, K., et al. 2006, AJ, 132, 1669. doi:10.1086/507094
- Shure et al. (1995) Shure, M., Sellgren, K., Jones, T. J., and Klebe, D. 1995, AJ, 109, 721
- Steffen et al. (1998) Steffen, M., Szczerba, R., & Schoenberner, D. 1998, A&A, 337, 149
- Tafoya et al. (2020) Tafoya, D., Imai, H., Gómez, J. F., et al. 2020, ApJ, 890, L14. doi:10.3847/2041-8213/ab70b8
- Ueta et al. (2000) Ueta, T., Meixner, M., & Bobrowsky, M. 2000, ApJ, 528, 861. doi:10.1086/308208
- Velilla Prieto et al. (2015) Velilla Prieto, L., Sánchez Contreras, C., Cernicharo, J., et al. 2015, A&A, 575, A84. doi:10.1051/0004-6361/201424768
- van Winckel (2017) van Winckel, H. 2017, Planetary Nebulae: Multi-Wavelength Probes of Stellar and Galactic Evolution, 323, 231.
- Zhao-Geisler et al. (2012) Zhao-Geisler, R., Quirrenbach, A., Köhler, R., et al. 2012, A&A, 545, A56. doi:10.1051/0004-6361/201118150
- Zou et al. (2020) Zou, Y., Frank, A., Chen, Z., et al. 2020, MNRAS, 497, 2855. doi:10.1093/mnras/staa2145
Appendix A Additional figures
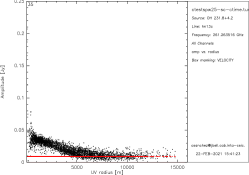
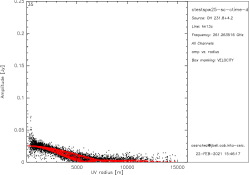
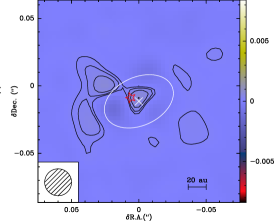
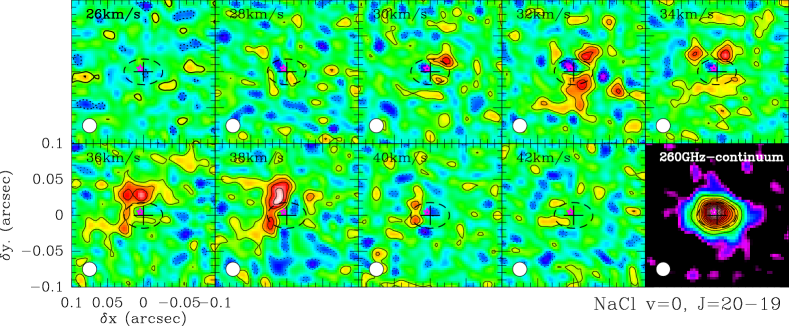
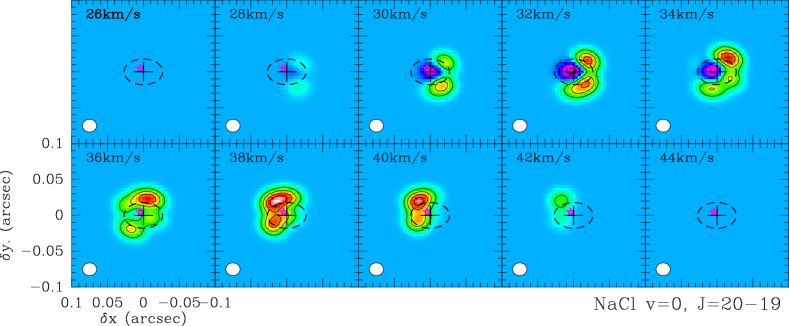
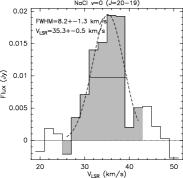
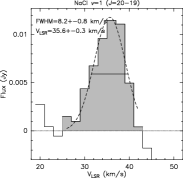
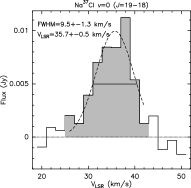
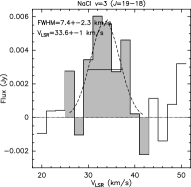
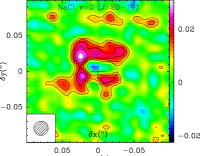
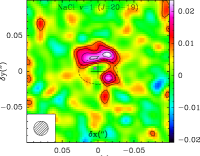
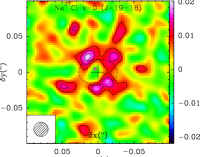
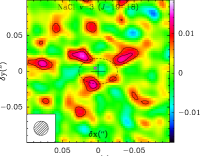
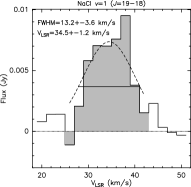
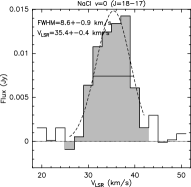
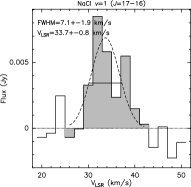
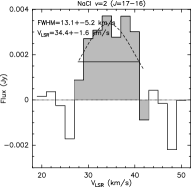

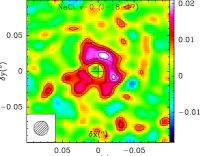
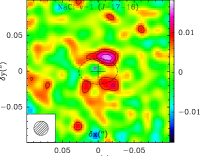
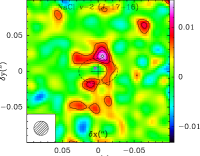
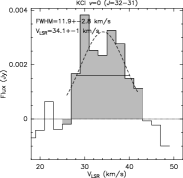
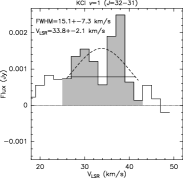
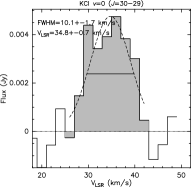
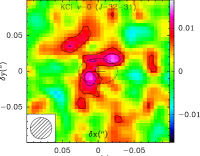
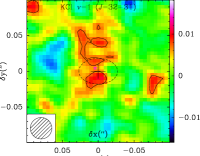

Appendix B The current mass of QX Pup
The mass of the Mira-type star QX Pup at the center of OH 231.8 is empirically poorly constrained. Sánchez Contreras et al. (2002) obtained a rough estimate of 1 from the analysis of the pulsation infall motion and rotation of the SiO-masing regions at 6 au from the star. The initial mass (in the main-sequence) of QX Pup was estimated to be 3 by Jura & Morris (1985) given OH 231.8’s probable membership to the Galactic open cluster M 46. More recently, the age of the cluster has been recomputed (Sharma et al., 2006; Davidge, 2013), resulting to be slightly younger, 225-250 Myr, than initially thought and hence suggesting a sightly larger initial mass of 3.5 for QX Pup (Miller Bertolami, 2016). The initial mass of QX Pup is, then, confirmed to be higher than the mass of the companion, A 0V (Sánchez Contreras et al., 2004), of about m22 , explaining the faster evolution of QX Pup: note that for a 3.5 star it takes 250 Myr to leave the main-sequence, while for a 2 star it takes 4 times longer (Miller Bertolami, 2016).
The empirically determined nebular mass of OH 231.8 is 1, including the mass in the large scale CO-outflow (which accounts for most, 99%, of the nebular mass), the NIR halo surrounding the central parts of the nebula (probably the relic of an ancient wind ejected at 10-6 yr-1, 0.01 ; Alcolea et al., 2001), and the ionized H-nebula (5 ; Sánchez Contreras et al., 2000) – see more details in § 1. If this was the only mass lost by QX Pup up to date, then its stellar mass at present would be 1 2.5 . However, according to the stellar evolutionary models of low to intermediate mass stars, in the later stages (i.e. last cycles) of the TP-AGB phase, stars like QX Pup are expected to have already lost about 80% of the initial mass, which would have occurred during the last 105 years. More specifically, conforming to theoretical AGB stellar tracks (Bloecker, 1995; Steffen et al., 1998, see their Fig. 2) a 3 star loses about 1 during the last 350-60 kyr before the last thermal-pulse and another 1 in the next 60-10 kyr. Therefore, in addition to the 1 mass most recently lost and that is visible in the large-scale 800 yr-old nebula, QX Pup has probably lost in much earlier times about 2 . However, for the most part, this very ancient 2 ejecta would remain undetectable due to strong dilution and photodissociation effects after being in expansion during 10-100 kyr: note, that the most extended and oldest haloes/envelopes around AGB stars or prePN/PN’s central stars ever detected are 20-50 kyr (e.g. Kwok, 2007).
In summary, current stellar evolutionary models predict that, at the tip of the AGB, the mass of an AGB star with 3.5 is 0.7 , which we then take as a probable value for the current mass of QX Pup.