Feature Representation Learning for Robust Retinal Disease Detection from Optical Coherence Tomography Images
Abstract
Ophthalmic images may contain identical-looking pathologies that can cause failure in automated techniques to distinguish different retinal degenerative diseases. Additionally, reliance on large annotated datasets and lack of knowledge distillation can restrict ML-based clinical support systems’ deployment in real-world environments. To improve the robustness and transferability of knowledge, an enhanced feature-learning module is required to extract meaningful spatial representations from the retinal subspace. Such a module, if used effectively, can detect unique disease traits and differentiate the severity of such retinal degenerative pathologies. In this work, we propose a robust disease detection architecture with three learning heads, i) A supervised encoder for retinal disease classification, ii) An unsupervised decoder for the reconstruction of disease-specific spatial information, and iii) A novel representation learning module for learning the similarity between encoder-decoder feature and enhancing the accuracy of the model. Our experimental results on two publicly available OCT datasets illustrate that the proposed model outperforms existing state-of-the-art models in terms of accuracy, interpretability, and robustness for out-of-distribution retinal disease detection.
Keywords:
Retinal Degeneration SD-OCT Deep Learning Optical Coherence Tomography Representation Learning1 Introduction
Diabetes affects up to 10.2% of the population globally, and it is projected to grow to 783 million people by 2045 [26]. With its prevalence, one-third of every diabetic patient develops Diabetic Retinopathy [27]. As the disease progresses, it can lead to Diabetic Macular Edema (DME), which is caused by damaged blood vessels which leak fluid and cause swelling, resulting in blurry vision. DME is a leading cause of vision loss among the working-age population of most developed countries [14] and affects approximately 750,000 people in the US. Even though, significant advancements in the anti-VEGF (vascular endothelial growth factor) therapy has provided patients with treatment options that can delay the progression of the degeneration [15], without early detection of this disease can result in permanent vision loss.
Optical Coherence Tomography (OCT) is an imaging procedure used where back-scattered light is projected for capturing and analyzing the sub-retinal layers and any deformities, aneurysms, or fluid build-up [24]. OCT images are manually examined by expert ophthalmologists to diagnose any underlying retinal degenerative diseases. Hence, miscategorization of diseases can happen due to human error while performing the differential diagnosis. The underlying reason is the stark similarity between DME and other retinal degenerative neuro-ocular diseases such as Age-related Macular Degeneration (AMD), choroidal neovascularization (CNV), or Drusen [31]. For instance, in wet-AMD leaky blood vessels grow under the retina and cause blurry vision similar to DME. On the other hand, in choroidal neovascularization (CNV), which is a late stage of AMD, new blood vessels grow from the Bruch membrane (BM) into the subretinal pigment epithelium (sub-RPE). Experts usually encounter problems while differentiating between DME and AMD.
Recently, with the advent of deep learning, many automated systems have been deployed for the early detection of retinal degenerative diseases. Also, these architectures are trained and tested on the same data distribution and resulting in high prediction accuracy in their respective tasks. However, if applied to the out-of-distribution datasets, the model fails to capture intrinsic features to accurately classify the underlying degenerative condition. So, the robustness and knowledge distillation of such systems are contentious. To address this problem, we propose a novel supervised-unsupervised representation learning module that can improve the accuracy of any retinal disease classification model on unseen data distribution. Moreover, this module can be attached to any pre-trained supervised image classification models. Our extensive qualitative and quantitative experiments illustrate the proposed module’s interpretability, robustness, and knowledge transferability.
2 Related Work
Many image processing techniques have been proposed to diagnose retinal degenerative diseases One proposed method is to segment, fuse and delineate multiple retinal boundaries to detect anomalies and diseases from Retinal OCT images [3]. Graph cuts and region-based delineation methods have also been proposed to detect different abnormalities and degeneration in the retinal subspace [28] and for diagnosing the thickness of the choroidal folds and neovascularization [1, 18]. Early approaches identified Diabetic Macular Edema (DME) with 75-80% sensitivity score [20, 4]. In contrast, segmentation-based approaches can help diagnose underlying causes of liquid buildup in the subretinal layers by detecting irregular retinal features and comparing the differences between healthy and the degenerated retinal tissue [16, 19, 13]. Even though segmentation approaches have shown success, it results in severe inaccuracies when applied to OCT images acquired from different OCT acquisition systems [7].
Deep convolutional neural networks (DCNNs) have recently received state-of-the-art results in identifying different retinal degenerative diseases [12]. For example, Fang et al. incorporated CNNs with graph search to simultaneously segment retinal layer boundaries and detect degeneration for patients having Age-related Macular Edema[5]. On the other hand, Xu et al. proposed a Dual-stage framework that utilizes CNNs to segment retinal pigment epithelium detachment [30]. Kamran et al. proposed a novel deep learning architecture called OpticNet-71 that achieved state-of-the-art accuracy in two OCT image benchmarks for identifying DME, AMD, CNV, etc[8]. Subsequent works have also utilized MobileNet-v2 [17], MobileNet-v3 [29] and VGG16 [11, 25] for retinal disease classification. Despite achieving high accuracy in their respective benchmarks, most of these architectures do not converge and lack robustness and knowledge transferability when evaluated on an out-of-distribution dataset, as reported in [9]. To alleviate this, the authors in [9] proposed a joint-attention network with a supervised classifier and unsupervised image reconstruction module. Adopting an adaptive loss function, the model achieved 1.8-9.0% improvement over three baseline state-of-the-art models, namely ResNet-50, MobileNet-v2, and OpticNet-71 on an out-of-distribution dataset. However, the model can perform poorly due to adaptive learning prioritizing image reconstruction over disease classification. Moreover, due to using non-learnable upsampling layers in the image reconstruction module, the model does not retain intrinsic features, hampering overall accuracy and robustness.
We propose a novel robust feature representation learning (RFRL) network that can be incorporated into any deep classification architecture for robust out-of-distribution retinal disease detection. Our module consists of 1) a supervised learning head for classifying diseases, 2) an unsupervised decoder head for disease-specific spatial image reconstruction, and 3) a novel representation learning head for finding similar features robustly from the encoder and decoder of the architecture. Furthermore, the proposed representation learning head incorporates a novel multi-stage feature similarity loss to boost the model’s accuracy on out-of-distribution samples. Our experiments confirm that the proposed RFRL network incorporated into baseline and state-of-the-art architectures significantly improves accuracy, sensitivity, and specificity for OOD datasets. Furthermore, we qualitatively evaluate its interpretability using GradCAM[22] and GradCAMv2[2] to prove its clinical significance. Expert ophthalmologists can leverage this module to improve disease detection from OCT b-scans on OOD datasets and avoid sub-par performance.
3 Methodology
3.1 Robust Feature Learning Architecture
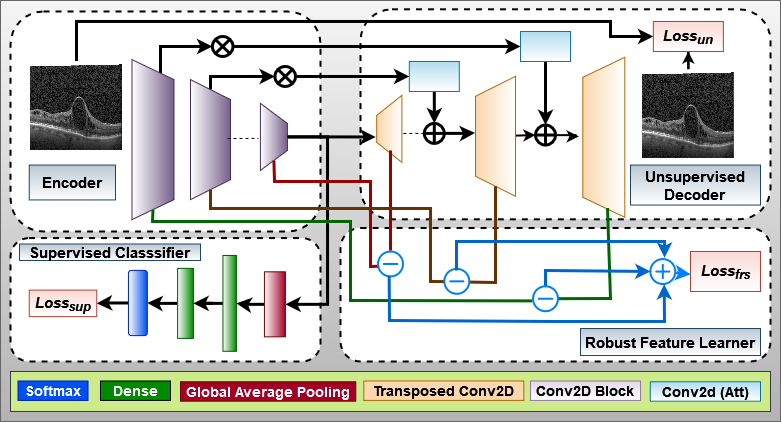
An image classification architecture consists of an encoder module with multiple learnable convolution layers (top left in Fig. 1) and a supervised downstream classification head with global average pooling and dense layers (bottom left in Fig. 1). In addition, we propose an unsupervised decoder head (top right in Fig. 1) for image reconstruction and a feature representation learning head between the encoder and decoder (bottom right in Fig. 1)to be incorporated with the architecture. The objective of the unsupervised module is to reconstruct the original image and learn its intrinsic spatial features. Moreover, we use skip-connections to retain disease-specific and domain-invariant spatial features that help in overall classification performance.
Joint-Attention Network [9] incorporated non-learnable bilinear upsampling layers in their unsupervised decoder. As a result, the spatial feature information was insufficient to reconstruct the original image with disease pathology. However, their experiment illustrated an improved overall accuracy over the baseline methods. To further improve upon this, we propose learnable transposed convolution layers for upsampling in our unsupervised decoder, as shown in Fig. 1. The transposed convolution consists of kernel size, , and stride, . Consequently, our method can retain class-specific and domain-independent spatial salient information, an essential missing feature in the low performance of the traditional encoder-based architectures in practice.
The improved decoder utilizes a mean-squared-error loss to learn original image features in an unsupervised manner without any ground truth or class labels. Outputs from each downsampling block in the encoder module are connected with each upsampling block in the decoder module with a skip connection. A convolution layer is used as an attention mechanism and element-wise summation of features between encoder and decoder module, as illustrated in Fig. 1. The output of the decoder can thus be defined by the Eq. (1):
| (1) |
where, are the output of each of the downsampling blocks, while symbolise the transposed convolution layers of the decoder. are the convolution operations of attention skip-connections for maintaining the same depth as the output of the corresponding up-sampling layer for element-wise summing.
3.2 Proposed Representation Learning Loss
In order to extract intrinsic and robust features, we propose a novel feature representation similarity loss, which is visualized in Fig. 1. The loss calculates the similarity between each of the down-sampling and up-sampling blocks successively, given in Eq. 2.
| (2) |
where is the input image, is the feature output of the downsampling blocks, and is the output of the upsampling blocks. The summation is divided with , which is the number of upsampling or downsampling layers for calculating the mean.
3.3 Final Objective Function
Our architecture incorporates two other loss schemes to make the learning robust and interpretable. First, for the classification of different retinal diseases, we use Categorical cross-entropy in the supervised classifier given by equation in Eq. (3). Secondly, for calculating the difference between real and reconstructed images, we use Mean-Squared Error (MSE) loss in the unsupervised decoder given by the in Eq. (4).
| (3) |
| (4) |
Here, in Eq. 3, signifies the ground truth label, symbolizes predicted output, is for the number of disease categories. In Eq. 4, is the input image, is the reconstructed output image, and is the number of pixels in the image.
| (5) |
Unlike the Joint-attention-Network [9] we do not utilize any weights to prioritize one or more of these losses. Instead, equal priority is given to all of them for robust feature learning and improved accuracy, sensitivity, and specificity.
4 Experiments
4.1 Data-set Processing
We evaluate our proposed architecture models on two separate data-sets, Srinivasan2014 [24] and OCT2017 [10]. The Srinivasan2014 dataset comprises 3,231 images, out of which 2,916 are for training and 5-fold cross-validation, and 315 are for testing. It has three categories of images, Normal, AMD, and DME. The model with the best validation result on the Srinivasan2014 dataset was used for further testing on the out-of-distribution (OOD) second dataset, i.e., OCT2017. The OCT2017 consists of four distinct categories of 1000 test images. We take 250 cases of Normal and DME (in total, 500 samples) for OOD testing. All images for training and testing were resized to resolution. Moreover, we incorporated random data augmentation techniques such as horizontal flip, rotation, zoom, width, and height shift for the training set.
4.2 Hyper-parameter Tuning
For training baseline methods and RFRL-Networks, we used Adam optimizer. Moreover, it was the same for both the supervised classifier and the unsupervised decoder. The initial learning rate, . We utilized a mini-batch of and trained all methods for 50 epochs. We reduced the learning rate by if the validation loss did not decrease for six epochs. he code repository is provided in this link.
4.3 Performance Metrics
We used three standard metrics for calculating the Accuracy, Sensitivity (True Positive Rate) and Specificity (True Negative Rate). The metrics are caclulated as follows, Accuracy , Sensitivity , and Specificity .
Architectures Year Accuracy Specificity Sensitivity ResNet50-v1 [23] 2018 94.92 97.46 94.92 OpticNet-71 [8] 2019 100.00 100.00 100.00 MobileNet-v2 [9, 17] 2020 97.46 98.73 97.46 VGG16 [25, 11] 2021 99.04 99.52 99.04 MobileNet-v3 [29] 2022 83.80 91.90 87.61 Joint-Attention-Network ResNet50-v1 [9] 2020 100 5.08 100.00 2.54 100.00 5.08 Joint-Attention-Network OpticNet-71 [9] 2020 99.68 0.32 99.84 0.16 99.68 0.32 Joint-Attention-Network MobileNet-v2 [9] 2020 99.36 1.90 99.68 0.95 99.36 1.90 RFRL-Network ResNet50-v1 2022 100 5.08 100.00 2.54 100.00 5.08 RFRL-Network OpticNet-71 2022 100.0 100.0 100.0 RFRL-Network MobileNet-v2 2022 99.68 2.22 99.84 1.11 99.52 2.06 RFRL-Network VGG16 2022 99.68 0.64 99.84 0.32 99.52 0.64 RFRL-Network MobileNet-v3 2022 99.36 15.56 99.68 7.78 99.52 11.91
4.4 Quantitative Evaluation
We worked with five baseline architectures across two distinct data sets to evaluate our model’s initial performance. Each of these methods have already been incorporated for retinal disease classification from OCT B-scans [23, 8, 17, 25, 29], out of which OpticNet-71 [8] has achieved state-of-the-art result on OCT2017 [10] and Srinavasan2014 [24] datasets. Subramaniam et al. proposed an architecture based on VGG16 [25] which achieved superior results on seven different pathologies, namely, AMD, CNV, DRUSEN, DMR, DR, MH, and CSR. Quite recently, Wang et al. proposed a model based on MobileNet-v3 [29] which achieved scores on par with Optic-Net on the OCT2017 dataset. For a fair comparison, we trained these five models from scratch on the Srinivasan2014 dataset with 5-fold cross validation. After choosing the best model, we tested on the data distribution familiar to the architecture, which is the Srinivasan2014 test set of 315 images. We then train, validate and test in the same manner with our proposed RFRL-network on the same data distribution. The quantitative comparison is given in Table. 1. As it can be seen, our method’s performance for the five models exceeds the baseline scores. Moreover, Joint-Attention-Network [9] also supersedes the baseline methods; however, both our methods for OpticNet-71 and MobileNet-v2 achieve better scores. For our next benchmark, we test the models on the out-of-distribution test set to evaluate their robustness and knowledge transferability. We use the 500 test images with Normal and DME categories from the OCT2017 data-set for this evaluation. As illustrated in Table. 2, our model retains intrinsic spatial information that helps it achieve higher accuracy than the baseline methods and Joint-Attention-Networks. It should be noted that none of the OCT2017 images were used for training or validating the models. The most significant improvement is seen in ResNet50-v1, with a 4.0% increase in accuracy over Joint-Attention-Network. Also, there was a slight specificity drop for MobileNet architectures. Still, it is negligible, as correctly classifying diseases (sensitivity) is more important than misclassifying patients without conditions (specificity). We only report test results for ResNet50-v1, OpticNet-71, MobileNet-v2 versions of the Joint-attention-network [9] as these were provided in the literature. Nonetheless, the proposed RFRL-network retains more robust and intrinsic features across different methods and evaluation settings.
Architectures Year Accuracy Specificity Sensitivity ResNet50-v1 [6] 2018 83.40 11.52 89.40 8.06 83.40 11.52 OpticNet-71 [8] 2019 74.40 25.60 85.60 14.40 74.40 25.60 MobileNet-v2 [21] 2020 93.80 3.66 96.70 2.03 93.80 3.66 VGG16 [25, 11] 2021 92.40 6.64 95.13 4.39 92.40 6.64 MobileNet-v3 [29] 2022 71.60 12.20 85.50 6.40 71.60 16.01 Joint-Attention-Network ResNet50-v1 [9] 2020 92.40 9.0 95.00 5.6 92.40 9.0 Joint-Attention-Network OpticNet-71 [9] 2020 77.40 3.0 89.00 3.4 77.40 3.0 Joint-Attention-Network MobileNet-v2 [9] 2020 95.60 1.8 97.1 0.4 95.60 1.8 RFRL-Network ResNet50-v1 2022 96.40 13.0 97.67 8.27 96.40 13.0 RFRL-Network OpticNet-71 2022 77.60 3.2 86.20 0.6 77.60 3.2 RFRL-Network MobileNet-v2 2022 95.80 2.0 95.80 0.9 95.80 2.0 RFRL-Network VGG16 2022 96.80 4.4 97.93 4.8 96.80 4.4 RFRL-Network MobileNet-v3 2022 74.60 3.0 84.06 1.44 74.60 3.0
4.5 Qualitative Evaluation
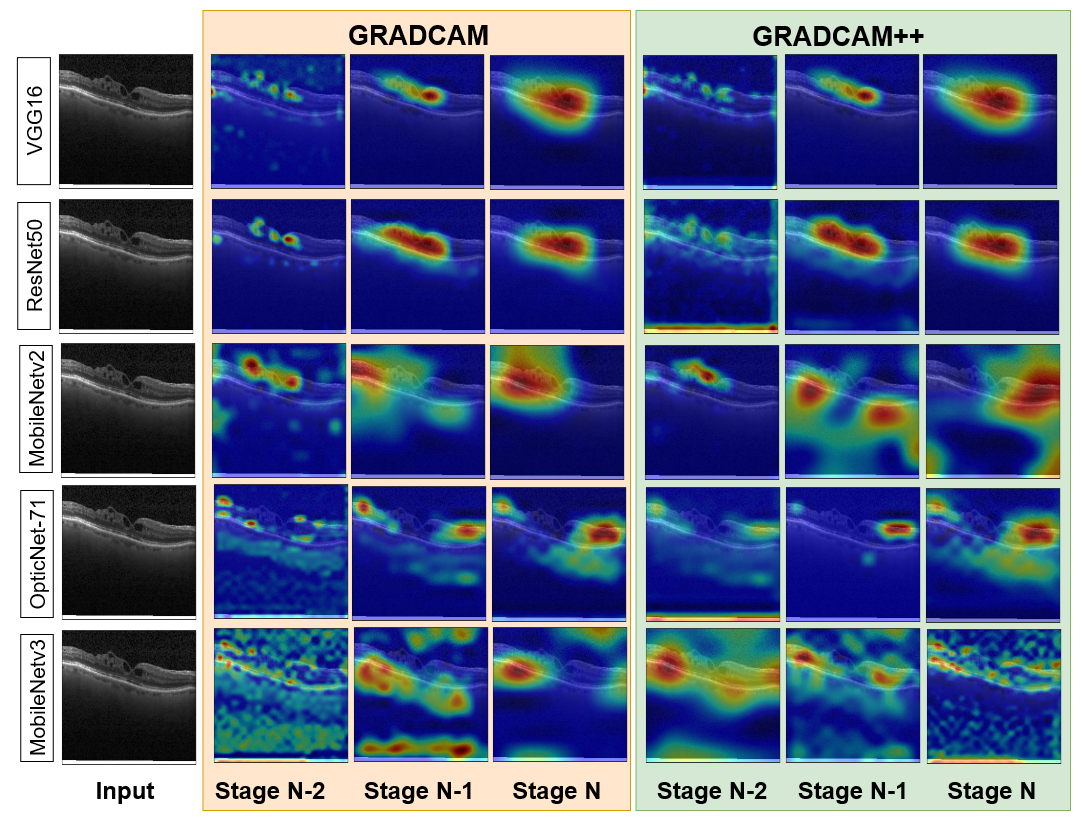
For producing "visual explanations" for judgments made by our CNN architectures for accurate classification, we use GRAD-CAM [22] and GRAD-CAM++ [2]. These methods use back-propagated gradients to visualize essential regions of the images of a specific layer, amplified for the classification decision’s maximum probability. In Fig. 2, we illustrate the differences in activations of three stages of the encoder layer for five of our methods on a DME image from OCT2017 [10] dataset. Stage N is the last convolution layer before the global average pooling, so it does not have any skip-connection with the unsupervised decoder. However, Stage N-1 and Stage N-2 are the previous encoder layers with attention skip-connections. Additionally, they are utilized for Feature Representation Similarity loss, . From Fig. 2, row 1-2, it is apparent that VGG16 and ResNet50-v1 got activated signals in regions with fluid buildup and hard exudates, explaining the identification of DME in different stages of the encoder. However, in rows 4-5, Optic-Net-71 and MobileNet-v3 got fewer activated signals and activations in the unimportant region, which helped classify the image as DME. The visualization also follows similar trends to standard metrics, where VGG16 achieves the highest to MobileNet-v3, achieving the lowest accuracy in performance. This qualitative visualization helps with our model’s overall explainability and knowledge transferability.
5 Conclusion and Future Work
In this paper, we propose RFRL-network that combines supervised, unsupervised, and feature representation learning to make the robust classifiers for out-of-distribution retinal degeneration detection. Moreover, by incorporating a novel feature representation learning loss, our architecture retains intrinsic and essential feature information that helps with knowledge transferability and explainability. In the future, we wish to extend our work to identifying other retinal degenerative conditions. This can help clinicians in conducting complex differential diagnoses.
References
- [1] Alonso-Caneiro, D., Read, S., Collins, M.: Automatic segmentation of choroidal thickness in optical coherence tomography. Biomed optics express 4(12), 2795–2812 (2013)
- [2] Chattopadhay, A., Sarkar, A., Howlader, P., Balasubramanian, V.N.: Grad-cam++: Generalized gradient-based visual explanations for deep convolutional networks. In: 2018 IEEE winter conference on applications of computer vision (WACV). pp. 839–847. IEEE (2018)
- [3] DeBuc, C.: A review of algorithms for segmentation of retinal image data using optical coherence tomography. Image Seg 1, 15–54 (2011)
- [4] Ege, B., Hejlesen, O., Larsen, O., Møller, K., Jennings, B., Kerr, D., Cavan, D.: Screening for diabetic retinopathy using computer based image analysis and statistical classification. Computer methods and programs in biomedicine 62(3), 165–175 (2000)
- [5] Fang, L., Cunefare, D., Wang, C., Guymer, R.H., Li, S., Farsiu, S.: Automatic segmentation of nine retinal layer boundaries in oct images of non-exudative amd patients using deep learning and graph search. Biomed optics express 8(5), 2732–2744 (2017)
- [6] He, K., Zhang, X., Ren, S., Sun, J.: Deep residual learning for image recognition. In: Proceedings of the IEEE conference on computer vision and pattern recognition. pp. 770–778 (2016)
- [7] Kafieh, R., Rabbani, H., Kermani, S.: A review of algorithms for segmentation of optical coherence tomography from retina. Journal of medical signals and sensors 3(1), 45 (2013)
- [8] Kamran, S.A., Saha, S., Sabbir, A.S., Tavakkoli, A.: Optic-net: A novel convolutional neural network for diagnosis of retinal diseases from optical tomography images. In: IEEE International Conference On Machine Learning And Applications. pp. 964–971 (2019)
- [9] Kamran, S.A., Tavakkoli, A., Zuckerbrod, S.L.: Improving robustness using joint attention network for detecting retinal degeneration from optical coherence tomography images. In: 2020 IEEE International Conference On Image Processing (ICIP). pp. 2476–2480. IEEE (2020)
- [10] Kermany, D.S., et al.: Identifying medical diagnoses and treatable diseases by image-based deep learning. Cell 172(5), 1122–1131 (2018)
- [11] Kim, J., Tran, L.: Retinal disease classification from oct images using deep learning algorithms. In: 2021 IEEE Conference on Computational Intelligence in Bioinformatics and Computational Biology (CIBCB). pp. 1–6. IEEE (2021)
- [12] Lee, C.S., Baughman, D.M., Lee, A.Y.: Deep learning is effective for classifying normal versus age-related macular degeneration oct images. Ophthalmology Retina 1(4), 322–327 (2017)
- [13] Lee, K., Niemeijer, M., Garvin, M.K., Kwon, Y.H., Sonka, M., Abramoff, M.D.: Segmentation of the optic disc in 3-d oct scans of the optic nerve head. IEEE transactions on medical imaging 29(1), 159–168 (2010)
- [14] Lee, R., Wong, T.Y., Sabanayagam, C.: Epidemiology of diabetic retinopathy, diabetic macular edema and related vision loss. Eye and vision 2(1), 1–25 (2015)
- [15] Lim, L.S., Mitchell, P., Seddon, J.M., Holz, F.G., Wong, T.Y.: Age-related macular degeneration. The Lancet 379(9827), 1728–1738 (2012)
- [16] MeindertNiemeijer, X., Lee, L.Z.K., Abràmoff, M., Sonka, M.: 3d segmentation of fluid-associated abnormalities in retinal oct: Probability constrained graph-search-graph-cut. IEEE Transactions on Medical Imaging 31(8), 1521–1531 (2012)
- [17] Nugroho, H.A., Nurfauzi, R.: Convolutional neural network for classifying retinal diseases from oct2017 dataset. In: 2021 4th International Conference on Information and Communications Technology (ICOIACT). pp. 295–298. IEEE (2021)
- [18] Philip, A.M., Gerendas, B.S., Zhang, L., Faatz, H., Podkowinski, D., Bogunovic, H., Abramoff, M.D., Hagmann, M., Leitner, R., Simader, C., et al.: Choroidal thickness maps from spectral domain and swept source optical coherence tomography: algorithmic versus ground truth annotation. British Journal of Ophthalmology 100(10), 1372–1376 (2016)
- [19] Quellec, G., Lee, K., Dolejsi, M., Garvin, M.K., Abramoff, M.D., Sonka, M.: Three-dimensional analysis of retinal layer texture: identification of fluid-filled regions in sd-oct of the macula. IEEE transactions on medical imaging 29(6), 1321–1330 (2010)
- [20] Sánchez, C.I., Hornero, R., Lopez, M., Poza, J.: Retinal image analysis to detect and quantify lesions associated with diabetic retinopathy. In: The 26th Annual International Conference of the IEEE Engineering in Medicine and Biology Society. pp. 1624–1627 (2004)
- [21] Sandler, M., Howard, A., Zhu, M., Zhmoginov, A., Chen, L.C.: Mobilenetv2: Inverted residuals and linear bottlenecks. In: Proceedings of the IEEE Conference on Computer Vision and Pattern Recognition. pp. 4510–4520 (2018)
- [22] Selvaraju, R.R., Cogswell, M., Das, A., Vedantam, R., Parikh, D., Batra, D.: Grad-cam: Visual explanations from deep networks via gradient-based localization. In: Proceedings of the IEEE international conference on computer vision. pp. 618–626 (2017)
- [23] Serener, A., Serte, S.: Dry and wet age-related macular degeneration classification using oct images and deep learning. In: 2019 Scientific Meeting on Electrical-Electronics & Biomedical Engineering and Computer Science (EBBT). pp. 1–4. IEEE (2019)
- [24] Srinivasan, P.P., Kim, L.A., Mettu, P.S., Cousins, S.W., Comer, G.M., Izatt, J.A., Farsiu, S.: Fully automated detection of diabetic macular edema and dry age-related macular degeneration from optical coherence tomography images. Biomed optics express 5(10), 3568–3577 (2014)
- [25] Subramanian, M., Shanmugavadivel, K., Naren, O.S., Premkumar, K., Rankish, K.: Classification of retinal oct images using deep learning. In: 2022 International Conference on Computer Communication and Informatics (ICCCI). pp. 1–7. IEEE (2022)
- [26] Sun, H., Saeedi, P., Karuranga, S., Pinkepank, M., Ogurtsova, K., Duncan, B.B., Stein, C., Basit, A., Chan, J.C., Mbanya, J.C., et al.: Idf diabetes atlas: Global, regional and country-level diabetes prevalence estimates for 2021 and projections for 2045. Diabetes research and clinical practice 183, 109119 (2022)
- [27] Ting, D.S.W., Cheung, G.C.M., Wong, T.Y.: Diabetic retinopathy: global prevalence, major risk factors, screening practices and public health challenges: a review. Clinical & experimental ophthalmology 44(4), 260–277 (2016)
- [28] Vermeer, K., Van derSchoot, J., Lemij, H., DeBoer, J.: Automated segmentation by pixel classification of retinal layers in ophthalmic oct images. Biomed optics express 2(6), 1743–1756 (2011)
- [29] Wang, X., Gu, Y.: Classification of macular abnormalities using a lightweight cnn-svm framework. Measurement Science and Technology 33(6), 065702 (2022)
- [30] Xu, Y., Yan, K., Kim, J., Wang, X., Li, C., Su, L., Yu, S., Xu, X., Feng, D.D.: Dual-stage deep learning framework for pigment epithelium detachment segmentation in polypoidal choroidal vasculopathy. Biomed optics express 8(9), 4061–4076 (2017)
- [31] Yau, J.W., Rogers, S.L., Kawasaki, R., Lamoureux, E.L., Kowalski, J.W., Bek, T., Chen, S.J., Dekker, J.M., Fletcher, A., Grauslund, J., et al.: Global prevalence and major risk factors of diabetic retinopathy. Diabetes care 35(3), 556–564 (2012)