Leverage Ratio: An empirical study of the European banking system
Abstract
This paper empirically analyzes a dataset published by the European Banking Authority. Our main aim was to study how the Leverage Ratio is affected by adverse financial scenarios. This was be followed by observing how Leverage Ratio exposures are correlated to various other financial variables and how various regression techniques can be used to explain the correlation.
Keywords: Leverage ratio; Financial variables; Correlation
1 Introduction
The 2008 financial crisis was exacerbated to a great extent by the acquisition of huge leverage (by the large investment banks), while still maintaining a robust risk-based capital requirements. Accordingly, in order to avoid the recurrence of this trigger (of the crisis), a non-risk based regulatory requirement in the form of the Leverage Ratio was incorporated, in addition to the risk based regulatory requirements, in the Basel-III framework [1]. Restrictions imposed in terms of the Leverage Ratio was put in place with the intent of inhibiting a built-up of over-leveraging within the banking setup. Specifically, the Basel-III regulations defined the Leverage Ratio (expressed in terms of percentage) as the ratio of “Capital Measure” to “Exposure Measure”, with the regulatory requirement being that the Leverage Ratio cannot exceed . It may be noted that the numerator is the risk-based Tier 1 capital requirement, and the denominator is the sum-total of various defined classes of the banks’ exposure (including off-balance-sheet items).
We begin with the question of whether the Leverage Ratio increases the stability of banks. A theoretical and empirical analysis of stability of banks in the context of Leverage Ratio is examined in [2]. A key observation from the micro-economic model was that the imposition of the Leverage Ratio requirement, while increasing the stability of a bank, can also act as an incentive for banks to adopt more risk taking practices, and this was observed to concur with the empirical analysis on a fairly large sample of banks in the European Union (EU), for the period of 2005-2014. The model described in [3] showed that in case of banks with more conservative (in terms of risk) lending practices, the Leverage Ratio requirement may act as an inducement for such banks to diversify into risky loan portfolios, while maintaining the Leverage Ratio requirement. This in turn could contribute to the overall instability of the banking sector. In conclusion, the authors recommended a much higher level of Leverage Ratio requirement, as compared to the existing levels. Blum [4], in his article, noted that limited supervisory authority (in terms of identification and punitive action) incentivizes under-reporting of risks by banks, and showed that Leverage Ratio would be more effective in eliciting truthful reporting of risks by the banks. An empirical examination of the impact of capital on the survival and market presence of banks, during a financial crisis is studied in [5]. The two key observations were that in case of smaller banks, capital helps in terms of survival, as well as market share (in all market conditions), and that capital helps medium and large banks in terms of survival and performance, even in a crisis situation.
Another aspect that merits examination is how the risk changes as a consequence of enhancement of Leverage Ratio, with several articles in literature asserting that risk taking practices can change as a result of increase in capital requirements. An empirical study concluded that a positive relation exists between changes in capital and risk [6]. Given this simultaneous behavior, most banks increase their risk exposure, concurrently with increase in capital requirement, and this holds even in case of banks which are over-capitalized. A different conclusion, was, however arrived at in a study for Swiss banks [7], wherein it was observed that while regulatory enforcement compels banks to (naturally) increase their capital holdings, but it does not result in concurrent increase in the level of risk. In case of a study [8] on the impact of the FDIC Improvement Act. (FDICIA), which required early intervention and prompt corrections, on capital requirements and credit risk, the authors concluded that increase in the capital ratios did not result in a concurrent increase in the risk. The relation between capital buffer and adjustment of portfolio risk is examined in [9], with the conclusion being that this relation is positive. Further, this risk adjustment of the portfolio was observed to be contingent on the extent of capitalization.
In this paper, we empirically analyze the dataset of the EU wide stress test conducted by European Banking Authority (EBA) in 2021, for 50 banks across 15 European Economic Area (EEA), to observe the dynamics of Leverage Ratio and Leverage Ratio exposures. The remainder of this paper is organized as follows. Section 2 presents a brief overview of the stress test dataset conducted by EBA. In Section 3, we empirically analyze the results of EU wide stress test to observe variations of Leverage Ratio for various banks across different European countries, during the period of 2020-23. Section 4 empirically analyzes the results of EU wide stress test, in order to observe co-relation of Leverage Ratio exposures with other financial variables, namely, Risk exposure for Credit, Market and Operational Risk, Profit or Loss for the year, Tier 1 Capital and Net Interest Income. Finally Section 5 presents the concluding remarks.
2 Dataset
The EBA conducted the stress test for 50 banks, pervading 15 EEA countries, encompassing of the assets held by the European banks [10]. The primary goal of the entire exercise was to test the resilience of the EU banking system, under two scenarios, namely, the baseline and the adverse, over a time window of three years, with a particular emphasis on taking into consideration the impact of the pandemic. The stress test conducted, identified December 2020 as the starting point of the three year time window. The first of the two cases considered in the test, namely the baseline scenario, emanating from the projections of the central banks, envisaged that the GDP of the EU will experience increases of , and for 2021, 2022 and 2023 respectively. For the latter case, namely, the adverse scenario (whose design was a collaborative exercise between the European Systemic Risk Board (ESRB) and the European Central Bank (ECB)) was driven primarily by the anticipation of a long-drawn pandemic, and assumed a real decrease in the GDP of , and for 2021, 2022 and 2023 respectively. The dataset published by the EBA comprises of the values of several financial variables, for the time window that is being considered, and was stored in two CSV files, including several considered variables for each bank. In addition, a data dictionary file is also available, and which can be used for the purpose of deciphering the information included in the datasets.
3 Empirical Analysis: Leverage Ratio in Baseline and Adverse Scenario
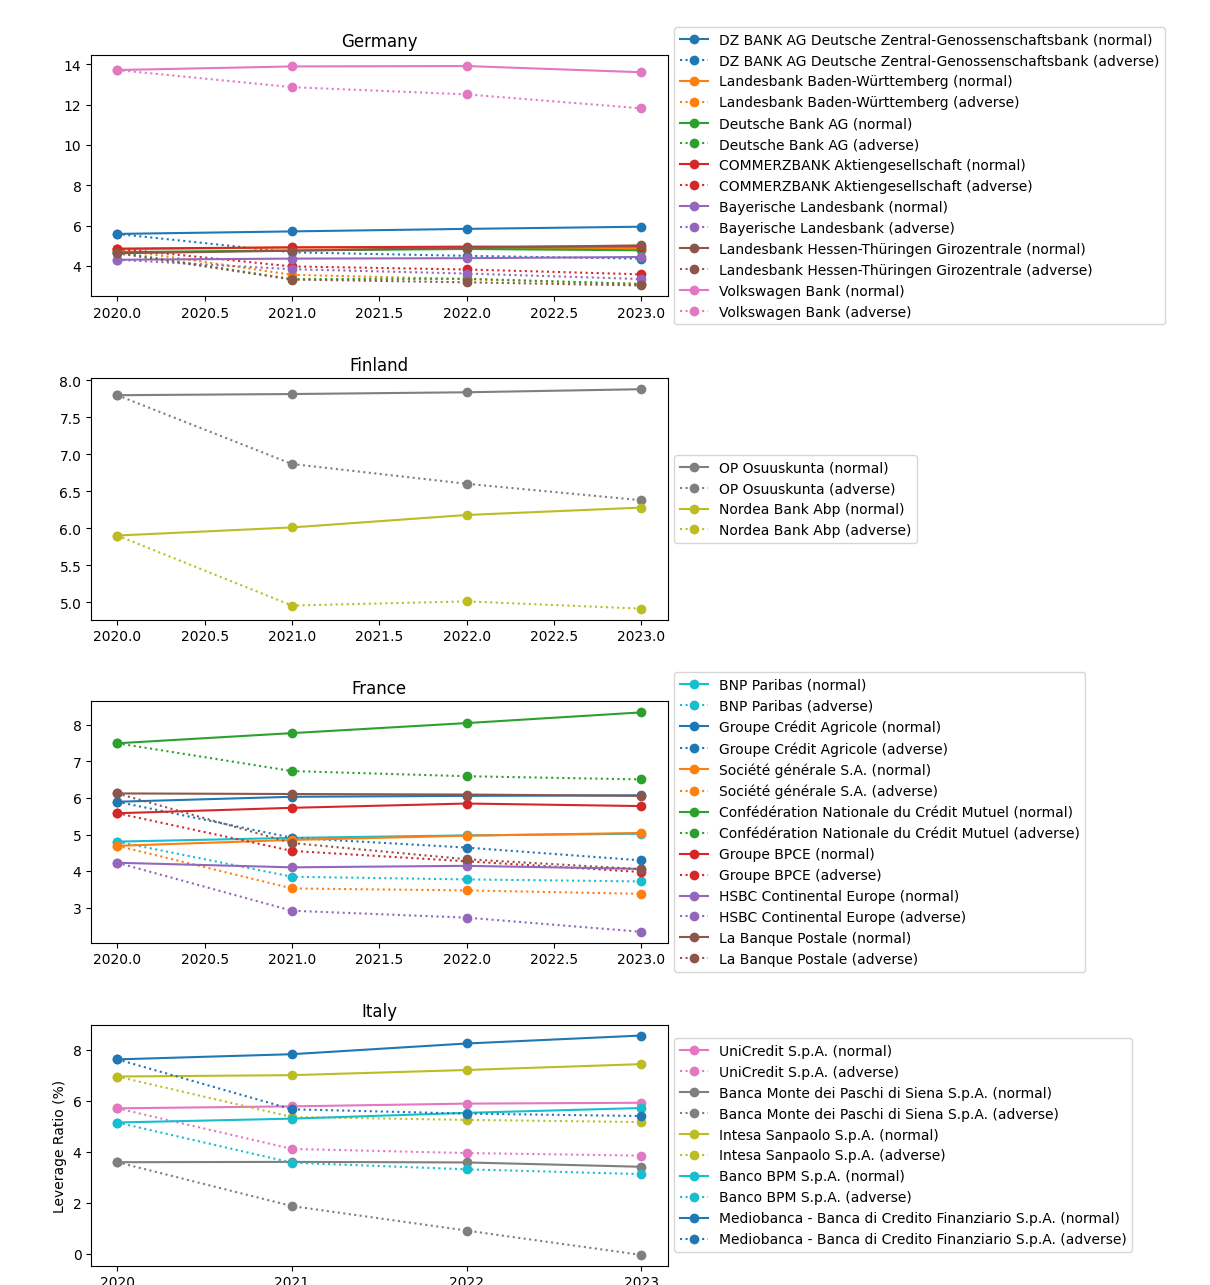
In this Section, we empirically analyze the results of the 2021 EU wide stress test, in order to observe the dynamics and variations of Leverage Ratio in case of both the baseline as well as the adverse scenario. We graphically observe the Leverage Ratio variations for various banks with each of the several European countries, for the dataset considered, during the period of 2020 to 2023. Figure 1 shows the Leverage Ratio variations for several banks across four different countries, namely, Germany, Finland, France and Italy. It is clear from Figure 1 that the Leverage Ratios maintained by the banks in an adverse scenario is significantly lower than the Leverage Ratio requirement in a baseline scenario, indicating that banks are more susceptible to failure in the case of an adverse scenario, as compared to the baseline scenario. Further, the Leverage Ratio also falls below the BCBS recommendation of , in case of few banks, in the adverse scenario. This can be attributed to the fact that the banks would hold lower capital in an adverse scenario.
4 Empirical Analysis: Correlation of Leverage Ratio Exposures with other Financial Variables
In this Section, we will empirically analyze the results of the 2021 EU wide stress test, in order to observe how the Leverage Ratio exposures vary with various other financial variables, namely, Risk exposure for Credit, Market and Operational Risk, Profit or Loss for the year, Tier 1 Capital and Net Interest Income. The financial variables correspond to Codes , , , , and , respectively, of the Item Codes of the data dictionary file.
The Leverage ratio exposure of a bank is measured as the sum-total of four kinds of exposures, namely, on-balance-sheet exposures, derivative exposures, securities financing transactions (SFT) exposure and off-balance sheet items [1]. This approach typically does not allow for consideration of collaterals, guarantees or other credit-risk mitigation measures adopted, to achieve any sort of reduction in the exposure measure. The on-balance sheet exposure includes all assets on the balance sheet, except derivatives and SFT assets on balance sheet, which, as already noted are considered separately. The former, namely exposure due to derivatives leads to exposures from the underlying of the derivative and exposure from Counterparty Credit Risk, while the latter, namely, the SFTs are an inseparable component of the leverage exposure, particularly securatized borrowing and lending through SFTs. Finally, the off-balance sheet items, in case of Leverage ratio were adopted from its definition incorporated in Basel II, and includes commitments, direct credit substitutes, acceptances and letter of credit (both standby and credit). Accordingly, in the following subsections, we present the results of the correlation between Leverage Ratio exposures and various other financial variables, as already identified in the preceding paragraph. The key metric for the analysis, is the coefficient of determination, , which measures how much variability can be explained using the regression.
4.1 Risk Exposure for Credit Risk
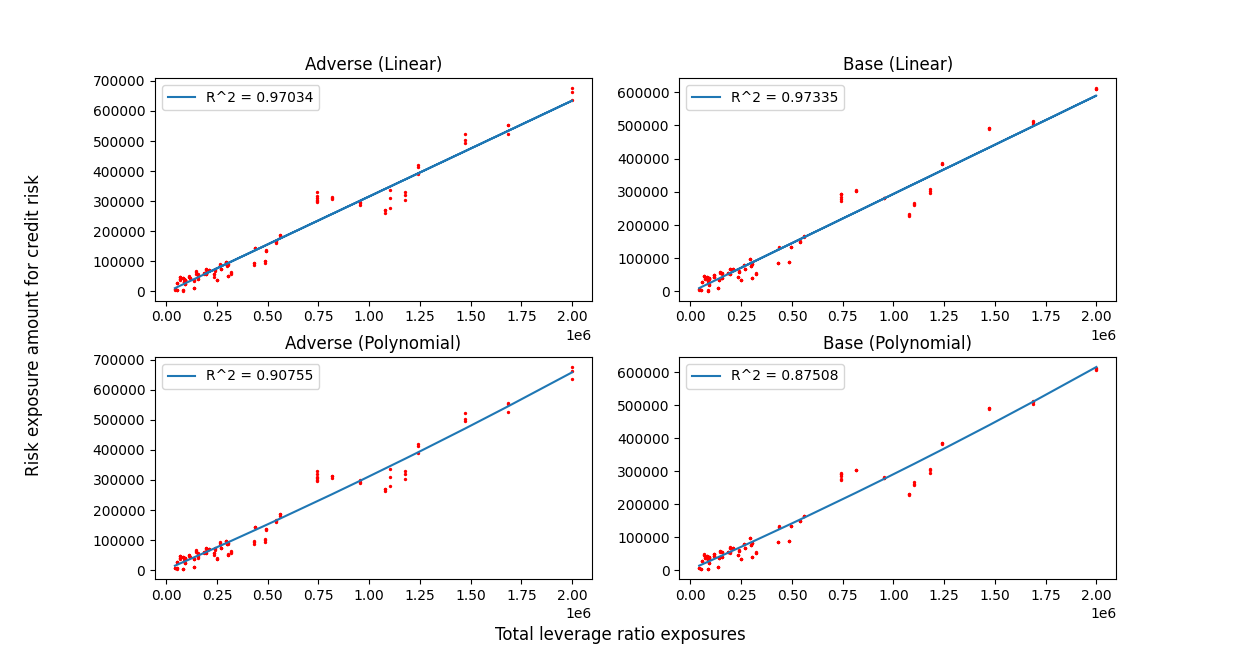
Credit risk is defined as the likelihood of losses faced by a creditor, in the event of failure to pay back the promised amount, by the debtor. These include scenarios where the borrower fails to repay the loan amount to the bank or a bond issuer fails to make coupon payments to the bond holder. Figure 2 shows how the Leverage Ratio exposures vary with risk exposure amount for credit risk. It is clear from the figure that both linear and polynomial regression can be used to fit dataset as both result in a high value of . It may be noted that risk exposure amount for credit risk increases with an increase in Leverage Ratio exposures.
4.2 Risk Exposure for Market Risk
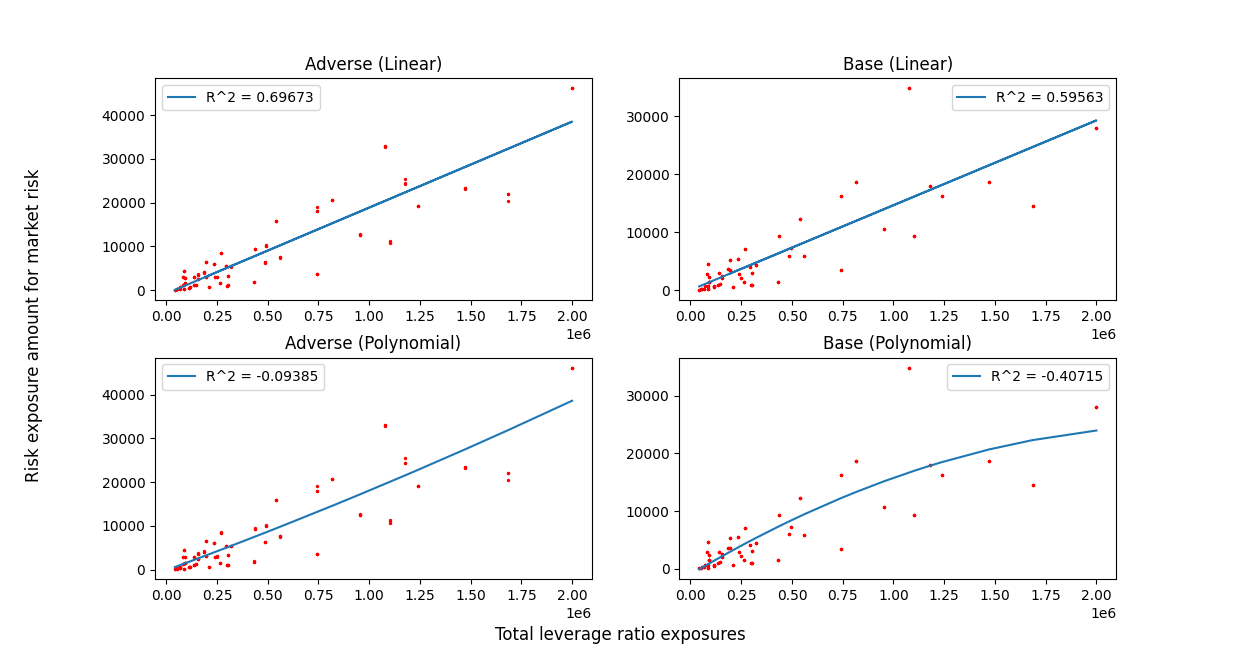
Market risk is the risk emanating from the factors that has repercussions across all kinds of investments across the market. Figure 3 shows how the Leverage Ratio exposures vary with risk exposure amount for market risk. It is clear from the figure that linear regression produces a high value of , which implies that the variation between the variables can be explained by the regression. So, it is better to use linear regression to fit the dataset.
4.3 Risk Exposure for Operational Risk
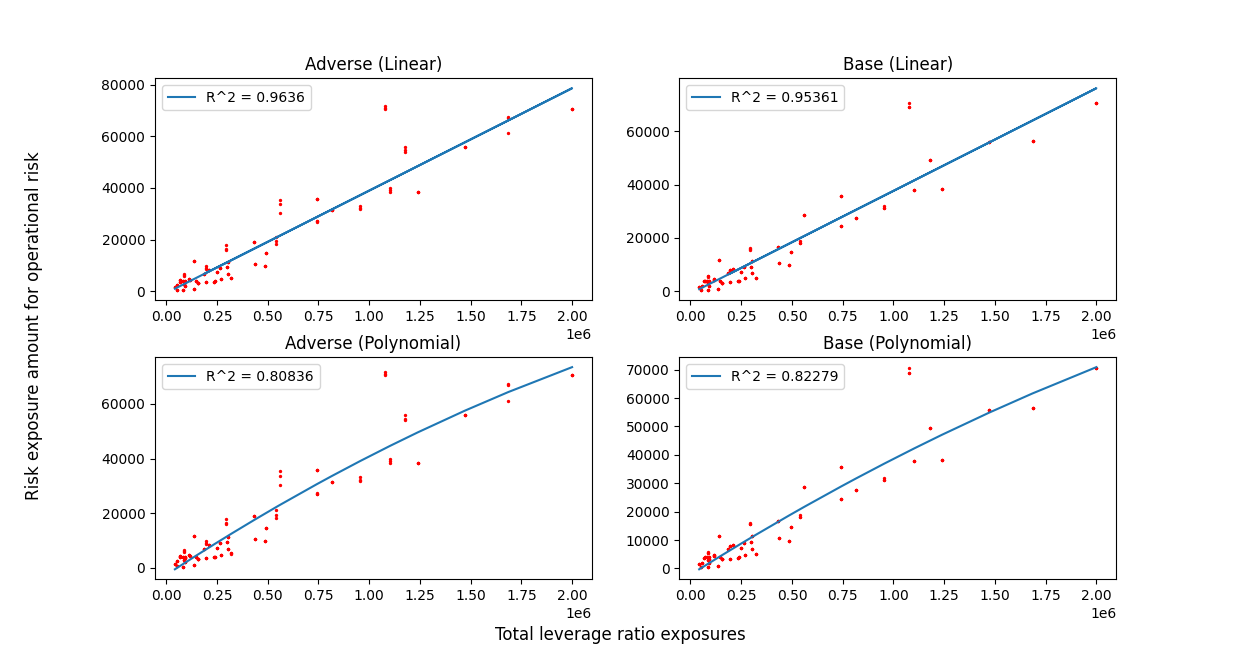
Finally, operational risk refers to the risk wherein the firm would loose money, typically resulting from failure of internal processes. Figure 4 shows how the Leverage Ratio exposures vary with risk exposure amount for Operational risk. It is clear from the figure that both linear and polynomial regression can be used to fit dataset as both produce a high value of .
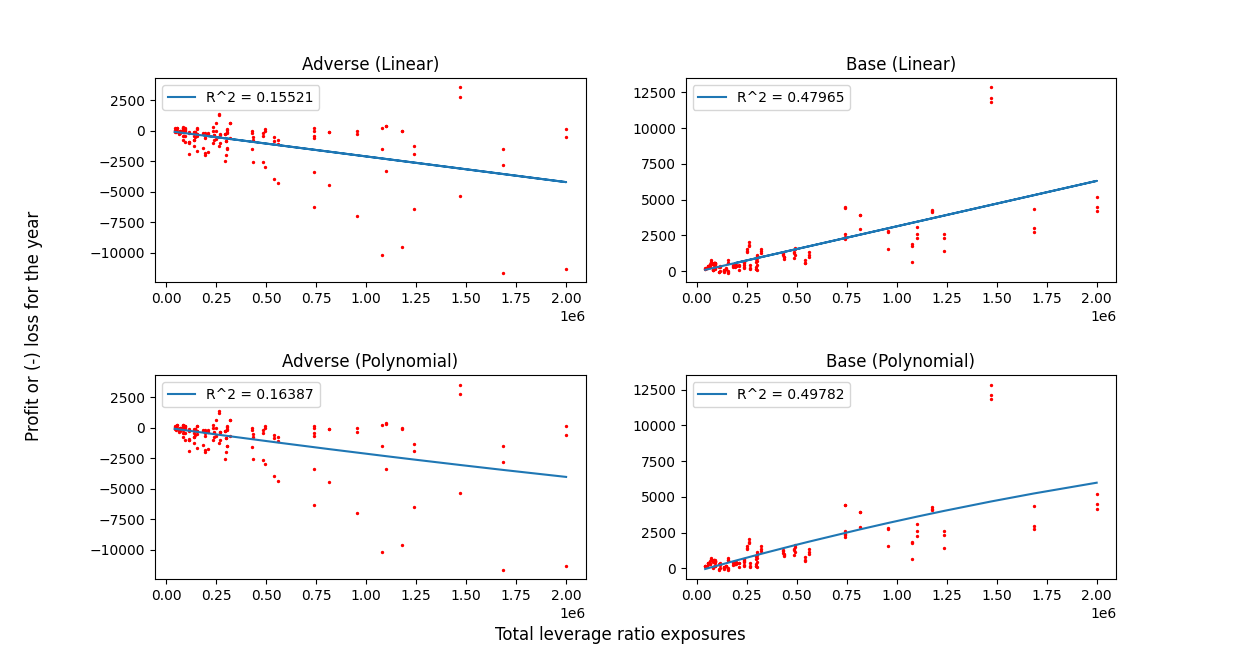
4.4 Profit or Loss for the Year
Profit and Loss statement is an accounting metric, reflecting the revenues, as well as costs/expenses over a time window (yearly in our case). Naturally this is indicative of the firm’s ability to enhance revenues and/or reducing costs/expenses. Specifically, Profit and Loss account quantifies the overall health of the firm in terms of reported “net-profit” earned or “net-loss” incurred, as the case might be. Figure 5 shows how the Leverage Ratio exposures vary with profit or loss for the year. In the baseline scenario, profit or loss for the year increase with increase in Leverage Ratio exposure, whereas we see inverse relation in case of the adverse scenario. The value of is high for baseline scenario and small for adverse scenario, which means regression technique can be used to fit dataset in only baseline scenario.
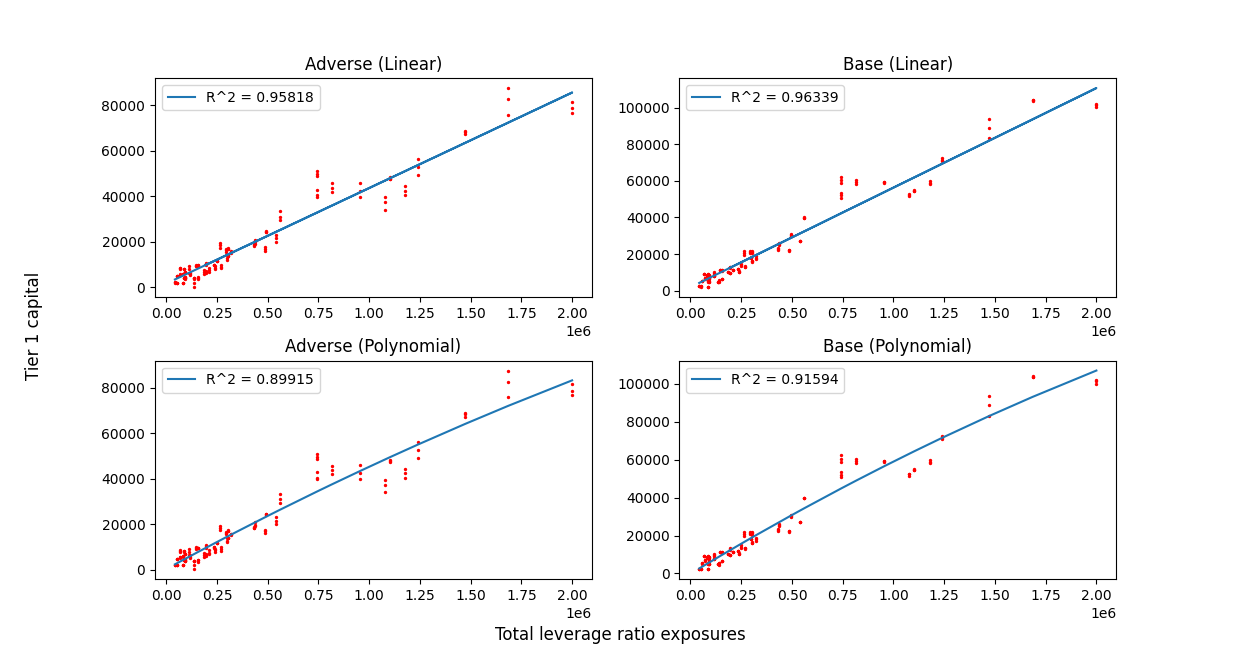
4.5 Tier 1 Capital
Tier 1 Capital represents the pivotal regulatory capital reserve that a bank must hold, and includes (among other things) sum-total of common shares and stock surplus and retained earnings. It’s strong relevance in the context of Leverage Ration stems from the fact that it appears in the numerator of its definition itself. Figure 6 shows how the Leverage Ratio exposures vary with Tier 1 Capital. In both scenarios, Tier 1 Capital increase with increase in Leverage Ratio exposures. Both regression techniques can be used to fit the dataset, as both have good values of .
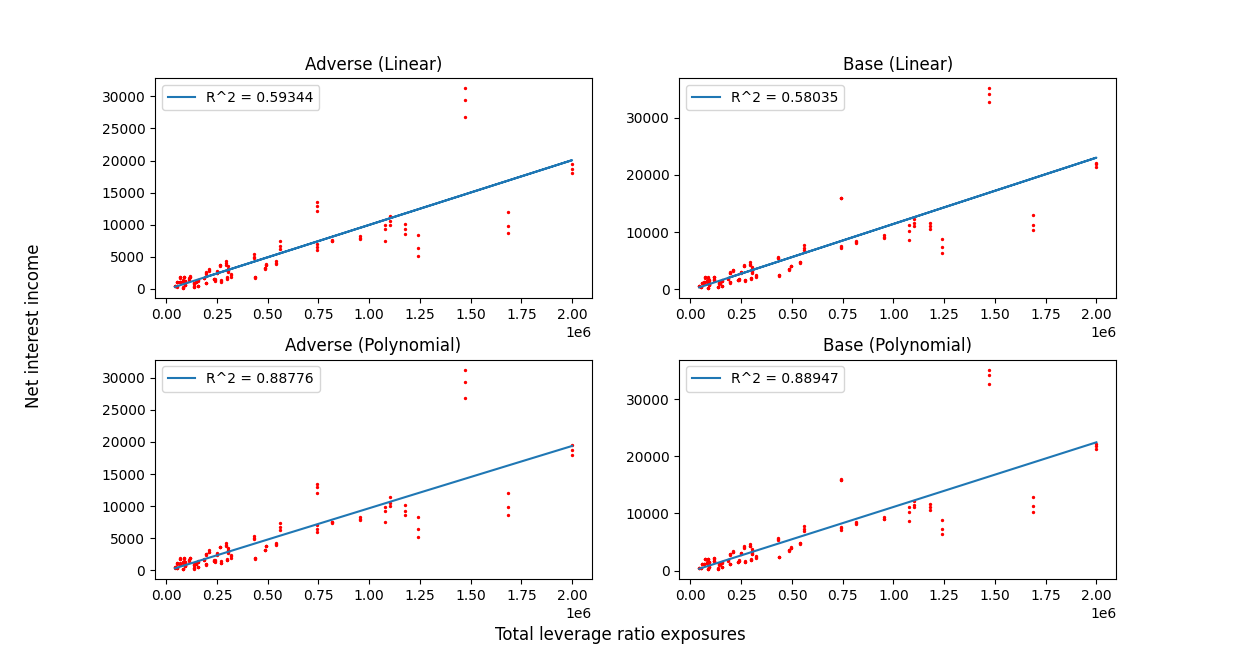
4.6 Net Interest Income
Net Interest Income, as the name suggests is the difference between the revenue from assets which generate interest and the payout on liabilities emanating from interest driven assets. Examples of the former includes outstanding personal and commercial loans, while the later primarily includes interest paid on bonds and deposits. It may be noted that having a floating interest rate, makes the bank’s Net Interest Income less susceptible to interest rate movements, as compared to fixed interest rates. Figure 7 shows how the Leverage Ratio exposures vary with Net Interest Income. In both the scenarios, Net Interest Income increase with increase in Leverage Ratio exposures. Polynomial regression should be used to fit the dataset, as it produces large value of as compared to linear regression.
4.7 Between Leverage Ratio Exposure and Other Variables
In this Subsection, we analyze how the Leverage Ratio exposures is correlated to various other financial variables considered, using different regression techniques, namely, linear, polynomial, decision tree, SVM and random forest regression. Tables 4.7 and 4.7 represents the (coefficient of determination) values in the baseline and the adverse scenario of the regression between Leverage Ratio exposures and financial variables discussed in previous sections, using different regression techniques. The value of is a measure of the effectiveness of the regression technique, and values close to reflects that the regression is able to predict the values with high accuracy.
The variable code in the Tables 4.7 and 4.7 correspond to the variable codes as found in [10]. The values for all the variables have been reported in the Appendix A.
\csvreader[
longtable = —p0.14—p0.14—p0.14—p0.14—p0.14—p0.14—,
table head= values in baseline scenario.
Variable Code Linear Polynomial SVM Random Forest Decision Tree
,
late after last line=
,
]r2_base2.csv\csvlinetotablerow
\csvreader[
longtable = —p0.14—p0.14—p0.14—p0.14—p0.14—p0.14—,
table head= values in adverse scenario.
Variable Code Linear Polynomial SVM Random Forest Decision Tree
,
late after last line=
,
]r2_adv2.csv\csvlinetotablerow
5 Conclusion
In this paper, we introduced the notion of Leverage Ratio as described in Basel-III, and discussed its importance in the context of stability of the banking system, as well as its repercussion on the risk-taking tendencies in the banking sector. Then we empirically analyzed the EU-wide stress test dataset to observe how Leverage Ratio varies in a baseline and an adverse scenario. We observed that Leverage Ratio maintained by banks is significantly lower in case of an adverse scenario, as compared to a normal scenario, implying that bank stability increases with an increase in Leverage Ratio. In the preceding section we studied the correlation of the Leverage Ratio with several identified financial variables, and used various regression techniques to find a correlation between Leverage Ratio and all other variables available in the EU-wide stress test dataset.
Appendix A Tables
[
longtable = —p0.14—p0.14—p0.14—p0.14—p0.14—p0.14—,
table head= values in baseline scenario.
Variable Code Linear Polynomial SVM Random Forest Decision Tree
,
late after last line=
,
]r2_base1.csv\csvlinetotablerow
\csvreader[
longtable = —p0.14—p0.14—p0.14—p0.14—p0.14—p0.14—,
table head= values in adverse scenario.
Variable Code Linear Polynomial SVM Random Forest Decision Tree
,
late after last line=
,
]r2_adv1.csv\csvlinetotablerow
References
- [1] Basel III leverage ratio framework and disclosure requirements, https://www.bis.org/publ/bcbs270.pdf, Accessed: 2022-06-20.
- [2] J. Acosta-Smith, M. Grill, J. H. Lang, The leverage ratio, risk-taking and bank stability, Journal of Financial Stability (2020) 100833.
- [3] I. Kiema, E. Jokivuolle, Does a leverage ratio requirement increase bank stability?, Journal of Banking & Finance 39 (2014) 240–254.
- [4] J. M. Blum, Why ‘Basel II’may need a leverage ratio restriction, Journal of Banking & Finance 32 (8) (2008) 1699–1707.
- [5] A. N. Berger, C. H. Bouwman, How does capital affect bank performance during financial crises?, Journal of Financial Economics 109 (1) (2013) 146–176.
- [6] R. E. Shrieves, D. Dahl, The relationship between risk and capital in commercial banks, Journal of Banking & Finance 16 (2) (1992) 439–457.
- [7] B. Rime, Capital requirements and bank behaviour: Empirical evidence for switzerland, Journal of Banking & Finance 25 (4) (2001) 789–805.
- [8] R. Aggarwal, K. T. Jacques, The impact of fdicia and prompt corrective action on bank capital and risk: Estimates using a simultaneous equations model, Journal of Banking & Finance 25 (6) (2001) 1139–1160.
- [9] T. Jokipii, A. Milne, Bank capital buffer and risk adjustment decisions, Journal of Financial Stability 7 (3) (2011) 165–178.
- [10] European Banking Authority: EU-wide stress testing, https://www.eba.europa.eu/risk-analysis-and-data/eu-wide-stress-testing, Accessed: 2022-01-10.
- [11] G. Dell’Ariccia, L. Laeven, R. Marquez, Real interest rates, leverage, and bank risk-taking, Journal of Economic Theory 149 (2014) 65–99.
- [12] J. Hull, Risk management and financial institutions,+ Web Site, Vol. 733, John Wiley & Sons, 2012.