A Flat-Spectrum Radio Transient at 122 Mpc consistent with an Emerging Pulsar Wind Nebula
Abstract
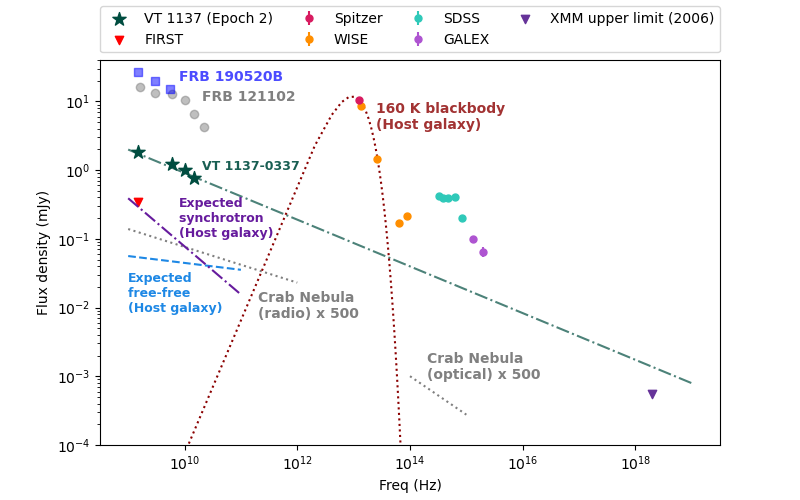
We report the discovery and follow-up observations of VT 1137-0337: an unusual radio transient found in our systematic search for extragalactic explosions in the VLA Sky Survey (VLASS). VT 1137-0337 is located in the brightest region of a dwarf starburst galaxy at a luminosity distance of 121.6 Mpc. Its 3 GHz luminosity is comparable to luminous radio supernovae associated with dense circumstellar interaction and relativistic outflows. However, its broadband radio spectrum - proportional to over a range of in frequency and fading at a rate of 5% per year - cannot be directly explained by the shock of a stellar explosion. Jets launched by various classes of accreting black holes also struggle to account for VT 1137-0337’s combination of observational properties. Instead, we propose that VT 1137-0337 is a decades old pulsar wind nebula that has recently emerged from within the free-free opacity of its surrounding supernova ejecta. If the nebula is powered by spindown, the central neutron star should have a surface dipole field of G and a present-day spin period of ms. Alternatively, the nebula may be powered by the release of magnetic energy from a magnetar. Magnetar nebulae have been proposed to explain the persistent radio sources associated with the repeating fast radio bursts FRB 121102 and FRB 190520B. These FRB persistent sources have not previously been observed as transients, but do bear a striking resemblance to VT 1137-0337 in their radio luminosity, spectral index, and host galaxy properties.
1 Introduction
Recent advances in hardware (Perley et al., 2011) and observing techniques (Mooley et al., 2019) used at the Jansky Very Large Array (VLA) have made it possible to efficiently survey large areas of the GHz radio sky at arcsecond resolution. These technologies are key components of the VLA Sky Survey (VLASS), which is observing the full sky north of declination over multiple epochs (Lacy et al., 2020). VLASS’s survey speed and wide field coverage (34,000 deg2) has led to a rapid uptick in the detection rate of slow radio transients, which typically peak on timescales of months to decades post explosion in the 2-4 GHz VLASS band. Previously, slow radio transients were primarily detected via follow-up observations of events identified at other wavelengths. With VLASS, new transients can be directly identified at radio frequencies at scale, enabling an exploration of the radio transient phase space unbiased by the detectability of emission at other wavelengths. This has facilitated the systematic discovery of representatives from both known and previously hypothetical transient classes (e.g., Metzger et al., 2015; Chevalier, 2012). Examples include a diversity of nuclear radio flares including tidal disruption events (Anderson et al., 2020; Ravi et al., 2021; Somalwar et al., 2021) and a population of newly launched jets from quasars (Nyland et al., 2020), a compelling candidate for an off-axis long gamma ray burst (Law et al., 2018), and the first known supernova set off by the merger of a compact object with a massive star (Dong et al., 2021).
Broadband radio spectra of a transient’s synchrotron emission are powerful diagnostic tools of the transient’s physical properties. Thus far, these spectra have primarily revealed spectral peaks, and/or steep power law tails where with . This is in line with predictions for synchrotron emission from electrons accelerated with diffusive shock acceleration (Blandford & Eichler, 1987; Jones & Ellison, 1991; Pelletier et al., 2017) modified by free-free/synchrotron self absorption (Condon & Ransom, 2016). The consistency is unsurprising, given that previously identified radio transient classes are associated with fast outflows that drive strong shocks in the surrounding gas.
In this paper, we present VLASS Transient J113706.19-033737.3 (hereafter VT 1137-0337), a new radio transient with a spectral index ( measured over more than a factor of 10 in frequency) that is inconsistent with diffusive shock acceleration. In Section 2, we discuss the discovery of VT 1137-0337 and its association with its host galaxy, a starbursting dwarf. We additionally estimate the rate of transients with similar observational properties. In Section 3, we present radio and optical follow up spectra at the location of the transient and discuss our procedure for fitting power-law and emission line models to these spectra. In Section 4, we use these observations to derive constraints on the emitting region and its surroundings. In Section 5, we assess the consistency of VT 1137-0337 with a wide range of transient, variable, and persistent radio source classes. In Section 6, we summarize our conclusions. Throughout this paper, we assume a flat CDM cosmology where km s-1 Mpc-1 (Bennett et al., 2014), implying a luminosity distance to the source of 121.6 Mpc and an angular diameter distance of 115.2 Mpc (Wright, 2006).
2 Discovery of VT 1137-0337
VT 1137-0337, located at RA = 11:37:06.19, Dec = -03:37:37.3, was discovered the source through a blind search of VLASS Epoch 1.1 (the first half-epoch of VLASS) for transients associated with galaxies within a distance of 200 Mpc. For this search, we chose the Faint Images of the Radio Sky at Twenty-cm (FIRST) survey (Becker et al., 1995) as our reference epoch for its comparable resolution and sensitivity over a large area of sky (6195 deg2 overlapping with Epoch 1.1). Our transient search methodology is summarized below.
We used the source extractor PyBDSF (Mohan & Rafferty, 2015) to assemble a catalog of all sources detected at 5 times the local RMS noise the Epoch 1.1 quicklook images111VLASS quicklook images are available at https://archive-new.nrao.edu/vlass/quicklook/ (Lacy et al., 2020). We used methods implemented in the astropy.skycoord class (Astropy Collaboration et al., 2013, 2018) to cross match these sources against the FIRST catalog (Becker et al., 1995), identifying all VLASS sources that are separated by 10” from the nearest known FIRST source as transient candidates. Through visual inspection, we rejected image artifacts, spatially resolved VLASS sources, and faint FIRST sources that fell under the 0.7mJy FIRST catalog threshold. After this process, we are left with 3000 point sources that are 0.7mJy in VLASS and 0.3-0.4 mJy in FIRST. Due to the slight frequency mismatch between the reference and detection epochs, some of these transient candidates are due to non varying or slowly varying active galactic nuclei (AGN) in background galaxies which have rising spectral indices between the 1.5 GHz FIRST band and the 3 GHz VLASS band. Because our search was focused on transients within the local universe, we cross matched the transient candidates against spectroscopically verified galaxies within 200 Mpc from the Sloan Digital Sky Survey Data Release 15 (SDSS DR15; Aguado et al., 2019), the Census of the Local Universe (CLU; Cook et al., 2019) galaxy catalog, and the NASA Extragalactic Database (NED)222The NASA/IPAC Extragalactic Database (NED) is operated by the Jet Propulsion Laboratory, California Institute of Technology, under contract with the National Aeronautics and Space Administration.. This process revealed 20 likely transients with statistically significant local universe galaxy associations. None of these likely transients show indications in multiwavelength data of being background sources.
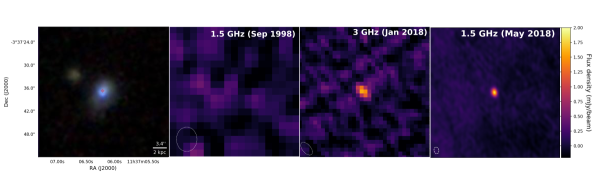
Among the 20 local universe sources, VT 1137-0337 stood out for its starbursting host galaxy (Section 4.1) and unusual flat spectrum (Sections 3.1, 4.2). It was detected in VLASS Epoch 1.1 with a 3 GHz flux of 1.7 0.4 mJy in January 2018, but is absent from FIRST with a 3 upper limit at 1.5 GHz of 0.35 mJy in September 1998. Three VLA followup observations taken in May 2018, March 2019, and February 2022 confirmed the presence of a new 1.5 GHz source that would have been easily detectable in FIRST (Section 3, Table 1). Figure 1 shows the reference, discovery, and a follow-up image of this source, which is located at a separation of 0.4 arcseconds from the cataloged position of the dwarf starburst galaxy SDSS J113706.18-033737.1’s nucleus (Aguado et al., 2019). Based on our highest resolution followup observation (taken at 10 GHz in the VLA’s A configuration; Section 3), we conservatively estimate that the localization uncertainity is arcsec (half the synthesized beam FWHM). This suggests that the source is slightly off-nuclear, though we note that the concept of a nucleus is somewhat ambiguous in this case since the host is a dwarf irregular galaxy with a nuclear position determined by the peak of a large star cluster.
In our searched catalogs, there are 70,000 galaxies within the 6195 deg2 VLASS/FIRST overlap. The fraction of the overlap area that falls within 0.4 arcseconds of one of their nuclei is 1.4 10-7. There are 3000 VLASS transient candidates that could have been located within this area. Thus, the expected number of coincidental associations within this sample is 4 10-4. Among the 20 galaxy-associated transients, we observed 12 that are within 0.4” of their host galaxy’s nucleus. The probability of one or more of these being falsely associated is 4 10-4 (formally, 1 - Poisson( = 4 10-4, = 0), where is the mean and is the number of false positive occurrences). Given the small false alarm probability, we conclude that VT 1137-0337 is not a foreground or background source, and is indeed associated with SDSS J113706.18-033737.1.
The variability at 1.5 GHz is inconsistent with refractive scintillation which, given the estimated critical frequency of 8.5 GHz at the location of the transient (Cordes & Lazio, 2002), would imply a typical point source modulation of 40% (Walker, 1998). If the source diameter is resolved on the scale of the scattering disk (corresponding to a diameter of cm at the distance to the host galaxy), the RMS modulation is further reduced by a factor of . Diffractive scintillation is suppressed at even smaller scales, being reduced by a factor of , where for our source cm. Additionally, the modulations would be decorrelated on a bandwidth of 6 MHz and would be substantially reduced by averaging over a single VLA spectral window. This implies that the variability of VT 1137-0337 between FIRST and VLASS is not primarily due to propagation effects in the Milky Way, and is instead intrinsic to the source itself or its immediate surroundings.
2.1 Implied detection rate
In our search of 6195 deg2 out to 200 Mpc, we detected no other transients similar to VT 1137-0337, which we define as having an optically thin spectral index flatter than and being located in a galaxy at or above the star forming main sequence. This suggests that (1) the phenomenon is rare, or (2) we have detected one of the easiest ones to detect, or (3) both. Here we present a rate estimate assuming that VT 1137-0337 is a representative example of the population from which it is drawn (option 1). If instead there are less luminous analogs or if they are predominantly located in faint galaxies, this estimate should be treated as a lower limit.
Based on VT 1137-0337’s 1.7 mJy flux in the detection epoch, we estimate that the transient would have been detectable in our search out to 190 Mpc. The host galaxy, which has a g band magnitude of 17.5, would have easily been detectable by SDSS out to that distance. The effective searched volume is (190 Mpc)3 Mpc3. Within this volume, Kulkarni et al. (2018) estimate that the overall redshift completeness of all NED galaxies is 60%. This fraction is lower for low mass galaxies but higher for star forming galaxies. If we use the host galaxy’s K band absolute magnitude (a proxy for mass), , but if we use its NUV flux (a proxy for star formation), . Given that the host galaxy is undergoing a starburst (Section 4.1), we adopt an intermediate value of for the redshift completeness, which is closer to the star-formation only value. Finally, VT 1137-0337 appeared in the radio sky on a timescale of 19.3 years, and persisted for 4.1 years (Table 1). We thus estimate that the volumetric birth rate for flat spectrum radio transients of similar radio luminosity in similar galaxies is (20 to 600) Gpc-3 yr-1.
In addition to astrophysical systematics (e.g., less luminous transients that are not detected in VLASS), the rate based on a sample of 1 should be regarded as having a large margin of error due to Poisson noise. Adopting a 95% confidence interval leads to a range of (1 - 3000) Gpc-3 yr-1 (Gehrels, 1986). For comparison, this corresponds to between 0.001% and 3% of the volumetric core collapse supernova (CCSN) rate (Taylor et al., 2014). The upper limit of this range is comparable to the rate of Ic broadline (Ic-BL) supernovae ( of the CCSN rate; Graham & Schady, 2016). The rate of low-luminosity GRBs is in the middle of the range ( of the CCSN rate; Soderberg et al., 2006), while the beaming-angle corrected rate of classical long GRBs is comparable within uncertainties to lower limit of the range ( of the CCSN rate; see Ho et al., 2020, and references therein for a discussion). The rate is also consistent with the estimated birth rate of FRB persistent source candidates ( Gpc-3 yr-1) found by Ofek (2017).
3 Observations and model fitting
We used a combination of follow-up and archival observations to characterize the observational properties of VT 1137-0337 and its surrounding environment. In this section, we describe the observations and associated data processing. We also discuss the model function used to fit the radio and optical follow-up spectra.
3.1 Radio follow up observations
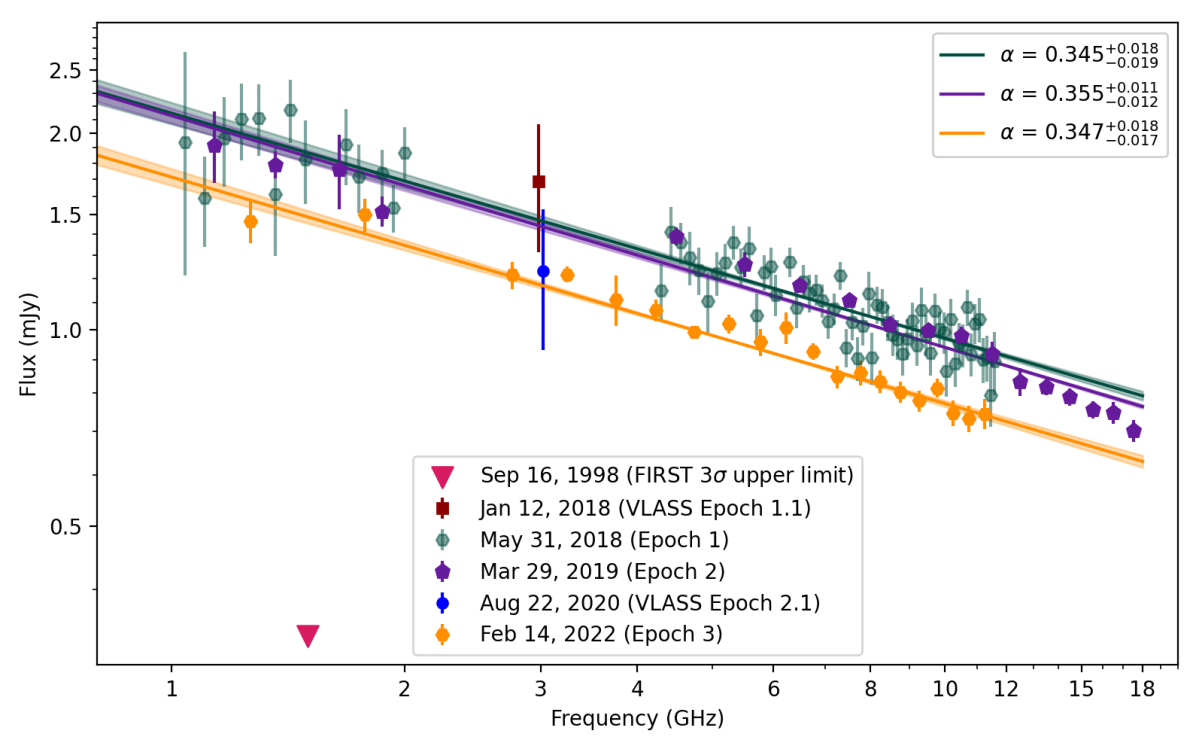
Four months after initial discovery in VLASS, we observed VT 1137-0337 with the VLA in its A configuration with the L, S, C, and X bands (1-12 GHz) under program 18A-481 (hereafter referred to as Epoch 1). We used 3C286 as the flux calibrator and J1150-0023 as the phase calibrator. We repeated these broadband radio observations at post-discovery epochs of 1.2 and 4.1 years with the VLA in the B and BnA configurations under programs 19A-422 (Epoch 2) and 21B-393 (Epoch 3). In the second epoch, we also observed in the Ku band (12-18 GHz). To calibrate and image the data, we used standard tasks from the Common Astronomical Software Applications (CASA) package (McMullin et al., 2007). In the first two epochs, we excluded the S band (2-4 GHz) observations which could not be reliably calibrated due to gain compression in the receivers. This is likely due to severe radio frequency interference from geosynchronous satellites in the Clarke Belt during the S band setup scans. For all other observations, we made single-band images of the target using the CASA implementation of CLEAN (Schwab, 1984). We additionally made sub-band images from groups of (or individual) independently calibrated 128 MHz spectral windows. In each image, we verified that the target location is not substantially contaminated by image artifacts. We then used the CASA task imstat to measure its flux, which is taken to be the value of the peak pixel. To avoid pixelation noise in this method of photometry, we chose a pixel scale that oversamples the beam size by a conservative margin () in all images. To estimate the uncertainty, we use the RMS pixel value in a nearby aperture with no sources or image artifacts. The single-band fluxes and uncertainties are listed in Table 1. The sub-band fluxes are used for model fitting, and are shown in Figure 3 along with the fluxes from VLASS observations and the FIRST nondetection.
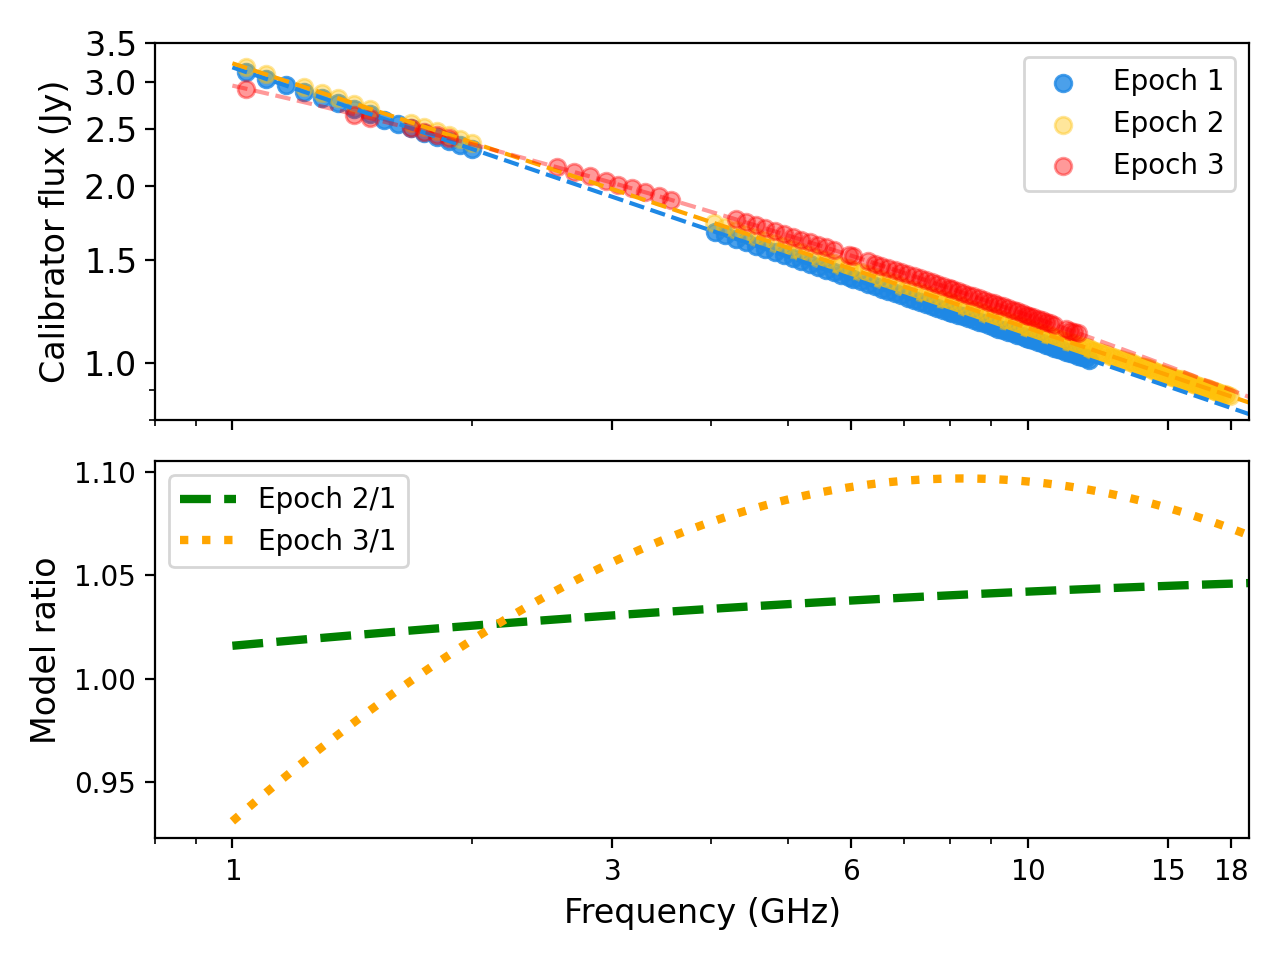
As a check on the calibration in our follow up observations, we made images of the phase calibrator J1150-0023 (a quasar seperated by 4.7 degrees from the target) in every VLA spectral window, representing frequency chunks of 128 MHz with independent phase, amplitude and bandpass calibrations. In standard VLA observations (including ours), the target flux is established by applying the fluxscale corrections derived for the phase calibrator (which suffers from nearly the same atmospheric and instrumental effects as the target) to the target. Any major issues in the calibration of the target spectrum should therefore show up as irregularities in the calibrated fluxes of the phase calibrator. As shown in the top panel of Figure 2, the calibrated phase calibrator spectrum in each epoch varies smoothly within and across all receiver bands. Since each receiver band contains 2-3 independent hardware basebands, this suggests that there are no substantial systematics due to the instrument. In the first two epochs, the phase calibrator spectrum is well described by a single power law. In Epoch 3, we measure some spectral curvature which is well described in log-space by a parabola. The bottom panel of Figure 2 shows that the flux measured in Epoch 2 is offset from the flux in Epoch 1 by 3% with marginal frequency structure. Due to the new spectral curvature, the phase calibrator is up to 5% dimmer and 10% brighter in Epoch 3 relative to Epoch 1 in our observed frequencies. We take this range to be an upper limit on the systematic fluxscale error introduced by calibration, though we suspect that the true error is smaller since (1) this level of variability is commonly observed in quasars (e.g., Liodakis et al., 2017) and (2) we independently measure the same spectral index for VT 1137-0337 in all 3 epochs (Section 3.2, Figure 3). By rerunning the fits described in Section 3.2 with fluxes scaled by the phase calibrator model ratio, we find that if the full difference between calibrator epochs were attributed to systematic calibration errors, Epoch 3’s best fit spectral index would change from to .
3.2 Modeling the radio spectra
In each epoch, we used the Markov Chain Monte Carlo code emcee (Foreman-Mackey et al., 2013) to fit the sub-band fluxes with a simple optically-thin synchrotron emission model:
| (1) |
where is the model flux at frequency , is the optically thin spectral index, and is the flux at 3 GHz. We used the following log likelihood function which assumes that the uncertainties are Gaussian:
| (2) |
where for the -th data point, and are the observed and model fluxes at the data point’s frequency , and is its uncertainty. In all epochs, we assumed top hat priors, with cutoffs of and . For Epoch 1, we found that the data are well described with the parameters = mJy, and = , where the central value and upper and lower uncertainties are taken from the 50th, 86th - 50th and 50th - 14th percentile values of their posterior distributions. For Epoch 2, the best fit power-law model is = mJy and = . For Epoch 3, we find that = mJy and = . The data and best fit models are plotted in Figure 3.
In Epochs 1 and 2, VT 1137-0337’s best fit radio spectra are consistent within 1 uncertainties in each parameter, indicating slow evolution (or a lack thereof) over the 1 year between epochs. The implied fade rate from the first two epochs is (2.3 2.8)% per year. In Epoch 3, its spectral index remains constant but the spectrum’s overall amplitude is fainter than that of Epoch 1 by a margin of ( = (20 2)%, corresponding to a fade rate of (5.3 0.4)% per year. If we attribute the full difference in the phase calibrator’s spectrum to systematic calibration errors, the overall level of fading increases to (25 2)%, or (6.9 0.4)% per year.
| Date | t | S | S | S | S | S | Epoch |
|---|---|---|---|---|---|---|---|
| Years | mJy | mJy | mJy | mJy | mJy | ||
| Sep 16, 1998 | -19.3 | 0.34 | FIRST (3) | ||||
| Jan 12, 2018 | 0 | 1.69 0.14 | VLASS 1.1 | ||||
| May 31, 2018 | 0.38 | 1.86 0.06 | 1.21 0.02 | 1.01 0.01 | Epoch 1 | ||
| Mar 29, 2019 | 1.21 | 1.86 0.14 | 1.23 0.03 | 0.99 0.01 | 0.77 0.01 | Epoch 2 | |
| Aug 22, 2020 | 2.61 | 1.23 0.14 | VLASS 2.1 | ||||
| Feb 14, 2022 | 4.09 | 1.41 0.10 | 1.19 0.03 | 0.914 0.02 | 0.75 0.01 | Epoch 3 |
Note. — Fluxes from single-band imaging of VT 1137-0337. As in the text, Epochs 1, 2, and 3 refer to follow-up epochs taken with the VLA rather than epochs of VLASS. Uncertainties are estimated using the RMS in a region of the image free of sources. There is an additional 5% systematic fluxscale uncertainty in imaging of followup epochs (Perley & Butler, 2017), and a 20% systematic error in fluxes derived from VLASS quicklook images.
3.3 Optical spectra
The host galaxy of VT 1137-0337 was observed as part of the SDSS Legacy Survey on January 20, 2002 (3.35 years after nondetection in FIRST and 16 years before first detection in VLASS). The SDSS spectrum has a spectral resolution of 2000, and detects numerous emission lines characteristic of star formation. It is sensitive to a 3” diameter region encompassing the location of the radio transient.
To check for any spectral evolution or new spectrally resolved features, we took a follow-up spectrum with the Keck Low Resolution Imaging Spectrograph (LRIS) (Oke et al., 1995) on Feb 13, 2021 (3 years after first detection). We used the 1 arcsecond-wide longslit setup with the 400/3400 grism on the blue arm and the 400/8500 grating on the red arm with a central wavelength of 7830 Å. These settings correspond to a wavelength coverage of 3100 - 10,000 Å at a FWHM spectral resolution of 1000. To acquire the target, we applied a blind offset from a nearby star, resulting in a spectrum of the region around the radio transient of order the slit width (1.0”). We exposed for 20 minutes in both arms, resulting in a typical per-pixel 1 noise of 10-18 erg/s/cm2. We processed the optical spectra using the LRIS data reduction pipeline LPIPE (Perley, 2019).
3.4 Fitting the optical emission features
We used emcee to fit the H, H, NII 6548/6584Å, SII 6716/6730Å, OIII 4363/4959/5007Å, OII 7320/7330Å, and OI 6300Å emission features in both the LRIS and SDSS spectra. We fit these features in six separate wavelength chunks: 6490-6630Å (H/NII), 4750-5200Å (OIII 4959+5007/H), 4350-4380Å (OIII 4363), 6700-6750Å (SII 6716/6730), 7300-7350Å (OII 7320/7330), and 6270-6350Å (OI 6300). We modeled each emission feature as a single-component Gaussian where the amplitude and width are allowed to vary freely (with both constrained to be positive and less than a large value for the purposes of convergence). Within each complex, we marginalized over three additional nuisance parameters: a linear slope and flux offset for the underlying continuum, and a wavelength shift to correct for wavelength calibration errors. We used a uniform prior that loosely constrains the slope and offset to within an order of magnitude of an initial guess from a least-squares fit to the data with the emission lines masked. The wavelength shift was limited to 1Å.
The best fit fluxes and their uncertainties listed in Table 2, and the gas properties inferred from these features are discussed in Section 4.1. No features are spectrally resolved in either observation. We find that despite the 20 year gap and the difference in spatial scales, the fluxes are similar in all measured lines. The 5% higher fluxes in the SDSS spectrum are easily explained by either systematic flux calibration uncertainties, or the larger effective aperture of the SDSS fiber. Thus, on the scale of 1”, corresponding to 550 pc at the distance to the host galaxy, we do not detect any significant evolution in the optical spectrum at the location of the transient between 2002 (3 years after nondetection in FIRST) and 2021 (22 years after nondetection in FIRST and 3 years after first detection in VLASS).
We additionally checked for emission from the high ionization potential [Fe X] line at 6374Å, used in a search for AGN in dwarf galaxies by Molina et al. (2021b). We do not detect this line in either spectrum above the local noise.
| Line | Flux (SDSS) | Flux (LRIS) | |
|---|---|---|---|
| (Å) | (10-16 erg s-1 cm-2) | (10-16 erg s-1 cm-2) | |
| H | 6562.8 | 387.7 | 357.6 |
| H | 4861.4 | 112.6 | 107.8 |
| NII | 6548.0 | 5.8 | 5.0 |
| NII | 6583.5 | 18.6 | 17.2 |
| OIII | 4363.2 | 5.7 | 5.5 |
| OIII | 4958.9 | 176.7 | 174.0 |
| OIII | 5006.8 | 519.3 | 499.8 |
| OI | 6300.3 | 5.2 | 4.6 |
| SII | 6716.4 | 28.9 | 26.6 |
| SII | 6730.8 | 21.9 | 19.9 |
| OII | 7320.1 | 4.1 | 3.0 |
| OII | 7330.2 | 2.7 | 3.0 |
Note. — The reported uncertainties are statistical, reflecting the 86th-50th and 50th-16th percentiles of the posterior distributions. There is an additional relative systematic uncertainty between the two spectra due to the different apertures as well as an absolute systematic uncertainty in the spectrophotometric flux calibration in each epoch.
3.5 X-ray upper limit from 2006
VT 1137-0337 is located near the edge of an archival XMM-Newton image (observation ID 0305801101; PI Ponman) observed with the European Photon Imaging Camera (EPIC) PN CCD for 21.8 kiloseconds on June 10, 2006. It is not significantly detected in the image. Assuming a galactic HI column of 3 1020 cm2 and a power law model with photon index of 1.34 (equal to the radio spectral index), one count corresponds to 3.7 10-12 erg s-1 cm-2 as calculated with the WebPIMMS tool, or a luminosity of 6.5 1042 erg/s at the distance to VT 1137-0337. Assuming a Poisson distribution in counts, this nondetection rules out a 0.1 - 15 keV source (or set of sources within a 4.1” region) active in 2006 with a luminosity of erg s-1 at the level. We caution, however, that the radio emission first appeared sometime between September 1998 and January 2018 (Table 1). If the radio emission predates June 2006 and was at the same flux or brighter, then the X-ray / radio luminosity ratio was 105 at that time. If not, this is an upper limit on the quiescent X-ray luminosity of the galaxy. We note that this ratio is not constraining for many astrophysical source classes. In particular, pulsar wind nebulae are generally observed (and expected) to have ratios (e.g., Reynolds & Chevalier, 1984).
3.6 Nondetection of archival transient counterparts
We searched a variety of archival catalogs for potential transient counterparts to VT 1137-0337. These included the CHIME FRB catalog (The CHIME/FRB Collaboration et al., 2021), the Open Supernova Catalog Guillochon et al. (2017), the MAXI (Serino et al., 2014), INTEGRAL (Rau et al., 2005), and Swift (Lien et al., 2016) GRB catalogs, and the Transient Name Server333The Transient Name Server (TNS) is the official IAU repository for reporting transients and can be found at https://www.wis-tns.org/. We found no significant matches. We additionally used the ASASSN lightcurve service (Kochanek et al., 2017; Shappee et al., 2014) to check for optical variability at this location, and found no significant increase in the optical flux beyond the typical ASASSN V band detection limit of 17 (corresponding to an absolute magnitude of -18.4). This rules out association with superluminous supernovae that exploded after the first ASASSN observation on Jan 29, 2012 (Gal-Yam, 2019), but does not rule out the majority of core collapse supernovae (e.g., Taddia et al., 2013, 2018; Hicken et al., 2017). A similar constraint can be inferred from the lack of an apparent point source in the SDSS image of the host galaxy, which rules out a superluminous supernova in the years before the observation date (Jan 6, 2006).
4 Properties of the transient and its environment
In this section we explore the physical conditions that can produce the observed features of VT 1137-0337 and its environment, and in Section 5, we discuss possible astrophysical scenarios that can give rise to these conditions.
4.1 Properties of the surrounding starburst
One contextual clue to the origin of VT 1137-0337 comes from the properties of the host galaxy and the local region surrounding the radio transient. We can diagnose the state of the ionized gas near the transient using the optical emission lines discussed in Section 3.4. We use the LRIS flux values due to the tighter spatial area probed around the transient. The quantities presented are averaged over the 1” LRIS slit width, corresponding to a linear diameter of 560 pc. The region directly influenced by the transient is much smaller (pc; Section 4.3), and may have different properties.
The H/H ratio can be used to estimate the extinction due to dust along the line of sight. We measure a ratio of 3.32 0.02, corresponding to a reddening of E(B-V) 0.13 (Domínguez et al., 2013). This reddening corresponds to an extinction of 0.42 mag for the H line (Calzetti et al., 2000).
The [SII] 6717Å /6731Å ratio is sensitive to the density of the emitting region, with a small dependence on the metallicity. We measure a ratio of 1.34 0.02, corresponding to an electron density of 60 cm-3 (Kewley et al., 2019).
The faint OIII 4363Å line allows us to directly measure the temperature of electrons in the ionized gas producing the emission lines. Since the inferred density is well within the limit where collisional de-excitation is negligible, the temperature can be determined by the ratio of oxygen lines using the relation from Osterbrock & Ferland (2006):
| (3) |
We measure a line ratio of 122 7, corresponding to a temperature of 12,000 K.
The density and temperature of the surrounding region is consistent with values commonly observed in star forming regions (Draine, 2011). The electron temperature can be used to measure the metallicity of the region to a typical intrinsic scatter of 0.1 dex (Kewley &
Ellison, 2008). To do so, we adopt the calibration of Izotov et al. (2006) assuming that the total oxygen abundance is the sum of the O+ and O++ abundances (Kewley &
Ellison, 2008). We find that 12 + log O+/H = 7.68 and 12 + log O++/H = 7.99, for a total metallicity of 12 + log O/H = 8.16. This metallicity is 30% of the solar value (12 + log O/H = 8.69; Asplund et al., 2009).
To check for signs of AGN activity and to further diagnose the state of the interstellar medium (ISM), we plotted the nucleus of the galaxy on the classical Baldwin, Phillips, and Terlevich diagram (BPT; Baldwin et al., 1981). As shown in Figure 4, the source lies on the star forming side, indicating that any AGN activity is not apparent in optical diagnostics. The position of SDSS J113706.18-033737.1 on the left side of the star forming sequence (log OIII 5007/H = 0.66, log NII 6584/H = -1.32) indicates that the overall star forming complex is irradiated by a hard ionizing photon spectrum (e.g., Richardson et al., 2016). At the metallicity inferred above, both line ratios are higher than expected for the highest ionization parameter model presented in Figure 1 of (Kewley et al., 2013). This suggests that the ionization parameter exceeds cm/s, which is substantially harder than the range measured in both local HII regions (Dopita et al., 2000) and star forming galaxies (Moustakas et al., 2010). This suggests that the transient is surrounded by young, massive, hot stars (e.g. O stars and Wolf-Rayet stars) (Kewley et al., 2013).
Another indication of a young starburst comes from the high extinction corrected H luminosity of 9.3 1040 erg/s measured in the 1 arcsecond region around VT 1137-0337. Adopting the calibration of Murphy et al. (2011), this corresponds to a star formation rate (SFR) of 0.5 /yr. If the star formation were to continue at a constant rate, the galaxy (of stellar mass 10; Salim et al., 2018) would double its stellar mass in the next 1 Gyr. Nearly all of the star formation is concentrated in the 280 pc radius region surrounding VT 1137-0337, as evidenced by the similar H fluxes in the LRIS and SDSS spectra which probe radii of 280 pc and 840 pc respectively. The star formation surface density within a circle of radius pc is 6 M⊙ yr-1 kpc-2. This value is in the high star formation density tail of blue compact star forming galaxies measured by Pérez-González et al. (2003) and luminous circumnuclear star forming regions (Kormendy & Kennicutt, 2004; Kennicutt & Evans, 2012). The surrounding HII region would be among the most H luminous of the 18,000 star forming regions compiled by Bradley et al. (2006). This H flux traces ionizing photons from O and B stars, with disproportionate contributions from the youngest, most massive stars. As these stars explode in supernovae over the course of a few Myr, the H flux is expected to fade rapidly as the gas recombines. The high observed H luminosity therefore indicates that massive stars were recently formed in the region surrounding VT 1137-0337. In particular, the H flux of a Salpeter (1955) initial mass function of stars formed at any given time is expected to fade by 2 orders of magnitude after 10 Myr (Leitherer et al., 1999). If the present-day massive stars are relics of an earlier generation, the star formation rate and surface density at that the time of formation would have been 2 orders of magnitude more extreme than what we have already observed. This is not likely, so we infer that the massive stars powering the high H luminosity surrounding VT 1137-0337 must be younger than a few Myr.
| Description | Symbol | Value |
|---|---|---|
| Galaxy center RA | 11:37:06.18 | |
| Transient RA | 11:37:06.19 | |
| Galaxy center Dec | -03:37:37.16 | |
| Transient Dec | -03:37:37.29 | |
| Galaxy stellar mass | M∗ | 10 |
| Electron temperature | Te | 12000 K |
| Electron density | ne | 60 cm-3 |
| Reddening | E(B-V) | 0.13 mag |
| H extinction | A(H) | 0.42 mag |
| Metallicity | Z | 0.3 Z⊙ |
| Star formation rate | SFR | 0.5 M⊙ yr-1 |
Note. — The host galaxy mass is from SED fitting reported in the GALEX-SDSS-WISE Legacy Catalog (GSWLC; Salim et al., 2018). The SFR is from the extinction corrected H flux, and is consistent with the GSWLC value /yr. The transient position is fitted from a 10 GHz VLA follow-up observation. All other quantities are derived from a Keck I/LRIS spectrum and are representative of a 280 pc radius region surrounding VT 1137-0337.
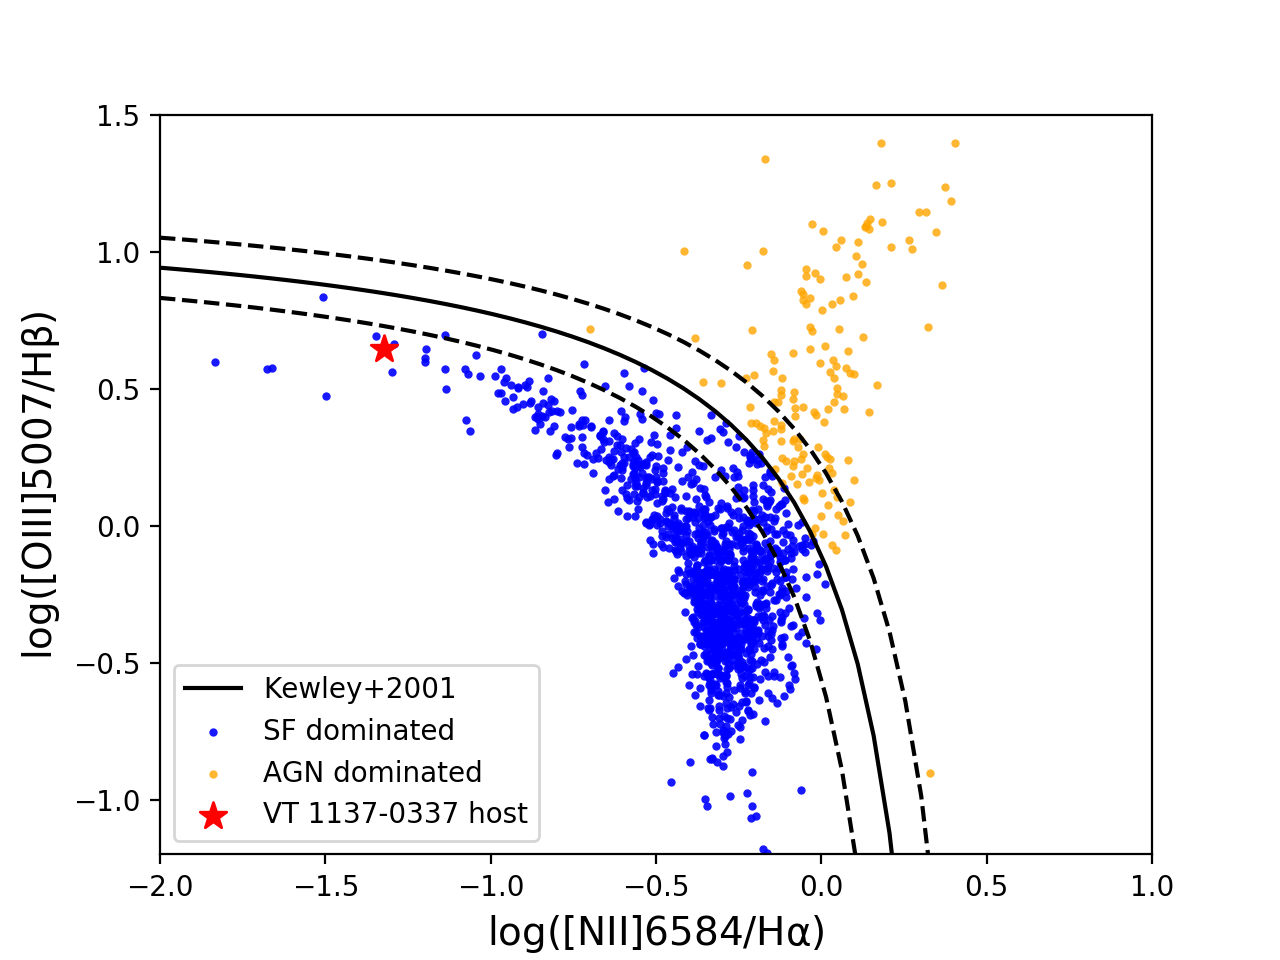
) on a BPT diagram (Baldwin et al., 1981). The dividing line between AGN and star formation dominated galaxy spectra from Kewley et al. (2001) is shown with 1 uncertainties (dotted lines). Blue and orange dots show SDSS galaxies classified respectively as star forming or AGN according to this scheme by Vanderplas et al. (2012).
4.2 Flat-spectrum radio emission mechanisms
Broadband emission at GHz frequencies from extragalactic sources is typically thought to originate from either free-free or synchrotron emission. In Section 4.2.1 we outline why VT 1137-0337’s luminosity and variability timescale are not consistent with having a substantial free-free emission fraction. A full argument is presented in Appendix A. In Section 4.2.2, we discuss how synchrotron emission is consistent with the observations, though the flat spectrum is unlike typical synchrotron transients in that it cannot be explained with a single shock-accelerated particle distribution.
4.2.1 Free-free emission
Free-free emission is a tempting explanation for the radio emission of VT 1137-0337, given that its natural flat spectrum (; Draine (2011)) can add on to a steeper spectrum component to create a power law similar to what we observe. This combination is commonly observed in extragalactic star forming regions (e.g., Linden et al., 2020). However, with reasonable temperatures and densities, high luminosities of 1028 erg/s/Hz can only be produced via free-free emission from a region hundreds of parsecs in size. The required size is not compatible with transient emission appearing on human timescales. In Appendix A, we show that the conditions required to produce VT 1137-0337’s luminosity within the upper limit on size set by causality ( (20 years) = 6.1 pc) are extreme: a temperature K and a thermal energy erg. We conclude that the fraction of VT 1137-0337’s observed radio luminosity due to free-free emission is 1. We also note that the expected 3 GHz flux due to free-free emission from star formation in the host galaxy is Jy (Murphy et al., 2011, Figure 9), far lower than the 1.5 mJy we observe.
4.2.2 Synchrotron emission
Having ruled out free-free emission, we are left with synchrotron emission as the likely source of VT 1137-0337. However, its spectral index of (Section 3.2), is much flatter than other synchrotron transients and most synchrotron sources in general and requires further explanation. As we discuss below, the flat spectrum cannot be produced by an ordinary shock and instead requires an alternate model.
The simplest model for a power law synchrotron spectrum is a single population of emitting electrons with a power law energy distribution . At frequencies below the synchrotron cooling spectral break, the spectral index is related to the energy index by . Above the cooling break, the spectral index steepens by 0.5 to . The single population model implies an energy index , which is too hard to be produced by diffusive shock acceleration (DSA), the mechanism thought to be responsible for most synchrotron transients. In non relativistic shocks, DSA predicts that , where is the ratio by which the shocked gas is compressed (e.g., Blandford & Eichler, 1987). The compression ratio is given by the shock jump conditions: , where is the Mach number (the ratio of the shock speed to the sound speed in the pre-shock gas), and is the adiabatic index, equal to 5/3 for a monatomic gas. In the limit of a strong shock () in a monatomic gas, , and thus = 2. Nonlinear factors such as the dynamical effect on the shock of the accelerated particles themselves can steepen the energy distribution to (Jones & Ellison, 1991), a range of values often seen in astrophysical sources. If the shock is relativistic, there are further complications due to e.g. particles being unable to return to the shock front after first crossing. In these conditions, the limiting steepness is estimated to be p 2.3 (Pelletier et al., 2017). In all cases, ordinary shocks are expected to produce substantially steeper spectra than what we observe.
A variety of astrophysical source classes do display power law spectra that are flatter (over a large bandwidth) than , the spectral index corresponding to the DSA limit. These include pulsar wind nebulae, X-ray binaries in the low/hard state, and a subset of AGN which tend to have jets pointed along our line of sight. Theoretical explanations for their flat spectra often invoke one or more of the following: (1) an alternate particle acceleration mechanism capable of producing an intrinsically hard electron energy distribution, (2) a regular electron energy distribution with a flattened spectrum due to propagation in a non uniform magnetic field, or (3) a flat spectrum constructed from the (discrete or continuous) sum of ordinary self-absorbed synchrotron spectral components. We discuss these mechanisms further in Section 6, where we consider the possible astrophysical sources that may be powering VT 1137-0337.
4.3 Constraints on the emitting region
Even with a possibly multi-component synchrotron spectrum where we do not know the value of , we can still derive useful constraints from the overall luminosity of the emission and upper limits on the synchrotron self-absorption and free-free absorption frequencies. In this section, we use these properties to roughly constrain the size and magnetic field of the emitting region, the cooling timescale of the emitting electrons, and the line-of-sight column density of ionized gas. For simplicity, we assume that the emission is from a single hard distribution of electrons with . These arguments depend only weakly on . Likewise, if the emission is the sum of components at different optical depth, the arguments should still be applicable to the lowest frequency component observed, which would comprise a large fraction of the total luminosity. In all cases, we stress that the results presented in this section should be regarded as order of magnitude estimates.
From the lack of an observed peak in our follow up observations, we infer that the frequencies for synchrotron self-absorption () and free-free absorption () are both 1 GHz. The upper limit GHz allows us to set a lower limit on the size of the nebula producing the synchrotron emission. If we assume energy equipartition between the radiating particles and the magnetic field, the angular diameter of the emitting source is 0.2 mas (Scott & Readhead, 1977). At the 115 Mpc angular diameter distance to the source, this corresponds to 0.1 pc. The lower limit on the source size corresponds to a volume: cm3. From the 20 year separation between FIRST and Epoch 1, light travel time arguments require that the region responsible for the excess emission is 6.1 pc in size.
We can use this limit on the source size along with classical energy minimization arguments (Burbidge & Burbidge, 1957; Scott & Readhead, 1977) to estimate the typical strength of the magnetic field in the emitting region. To do so, we note that the energy stored in the magnetic field is for a spherical emitting region of radius . Meanwhile, the energy in particles is (Scott & Readhead, 1977), where is a constant equal to in cgs units, is the region’s synchrotron luminosity in the range from to (in units of Hz), is the spectral index in the convention of Equation 4, and is a quantity from an integral over the electron energy distribution that encapsulates the dependency on frequency range and spectral index:
| (4) |
The two energies and have opposite dependencies on . Thus, there is a value that minimizes the total energy , which can be found by setting . The solution is
| (5) |
To estimate the value of for VT 1137-0337, we integrate over our observed epoch 2 spectrum (from Hz to Hz), resulting in erg s-1. Over this frequency range g() = 1.3 10-5. For the minimum emitting region size of cm, we then have G. If is greater, decreases as , to a minimum value of 6 10-4 G at the causality limit of pc.
The quantity is a reasonable order-of-magnitude estimate for the true magnetic field . If , then the total energy must increase by . Likewise, if , the total energy must again increase by . Perturbations of more than an order of magnitude will thus lead to large increases in the energy. Such an increase may be difficult to explain when considering the energy already required in the emitting region. At the lower limit of cm, the minimum energy in the magnetic field alone is erg, comparable to the magnetic energy in an energetic supernova-driven shock (e.g., Ho et al., 2019). If is greater, then the energy scales as , up to erg at pc.
One consequence of our magnetic field estimate is that the spectral break frequency associated with synchrotron cooling is not likely to be 1 GHz. The timescale for synchrotron cooling is
| (6) |
and the maximum value of with our radius constraints is 0.04 G. This implies that the minimum synchrotron cooling time at 1 GHz is years. At our highest observed frequency of 18 GHz, years. Both timescales are longer than the 20 year span over which the new emission appeared. If the electrons radiating at those frequencies were accelerated after the FIRST nondetection in 1998, they have not yet had enough time to cool. In the case of a single-component nonthermal electron energy distribution, this implies that our observed spectrum of maps to rather than .
Finally, the lack of free-free absorption along the line of sight at 1 GHz () implies either a low column density of ionized electrons along the line of sight, or a high temperature for those electrons. We first check that this is the case for a source embedded in the HII region surrounding VT 1137-0337. From the density and temperature in Section 4.1, and equation A4, the optical depth to free-free absorption at 1 GHz is , where is the distance that the radio photons must travel through the ionized gas. The effective size of the ionized region is of order the size of a Strômgren sphere with the ionizing photon production rate implied by the extinction corrected H emission s-1 (Murphy et al., 2011), which is 90 pc (Draine, 2011). Thus, the surrounding HII region should not contribute substantially to the free-free absorption, though if the source were embedded at its center, it may become a factor for observations at frequencies of a few hundred MHz. However, a high density ionized shell at a typical HII region temperature is excluded. From Equation A4, the limit at GHz indicates that at a temperature of T = 104 K, the quantity , where is the average density of ionized gas and is the thickness of the ionized region. If a hypothetical shell has thickness cm, the density cm-3. If it is more extended, the density constraint becomes more stringent. This excludes the densest winds that have been observed around some supergiant stars (Smith, 2014), though we note that the constraint applies only along the line of sight and dense but asymmetric gas from e.g. binary interaction is allowed (Dong et al., 2021).
5 Astrophysical analogues and possible models
As discussed in Section 3, VT 1137-0337 is characterized by the following observational properties:
-
•
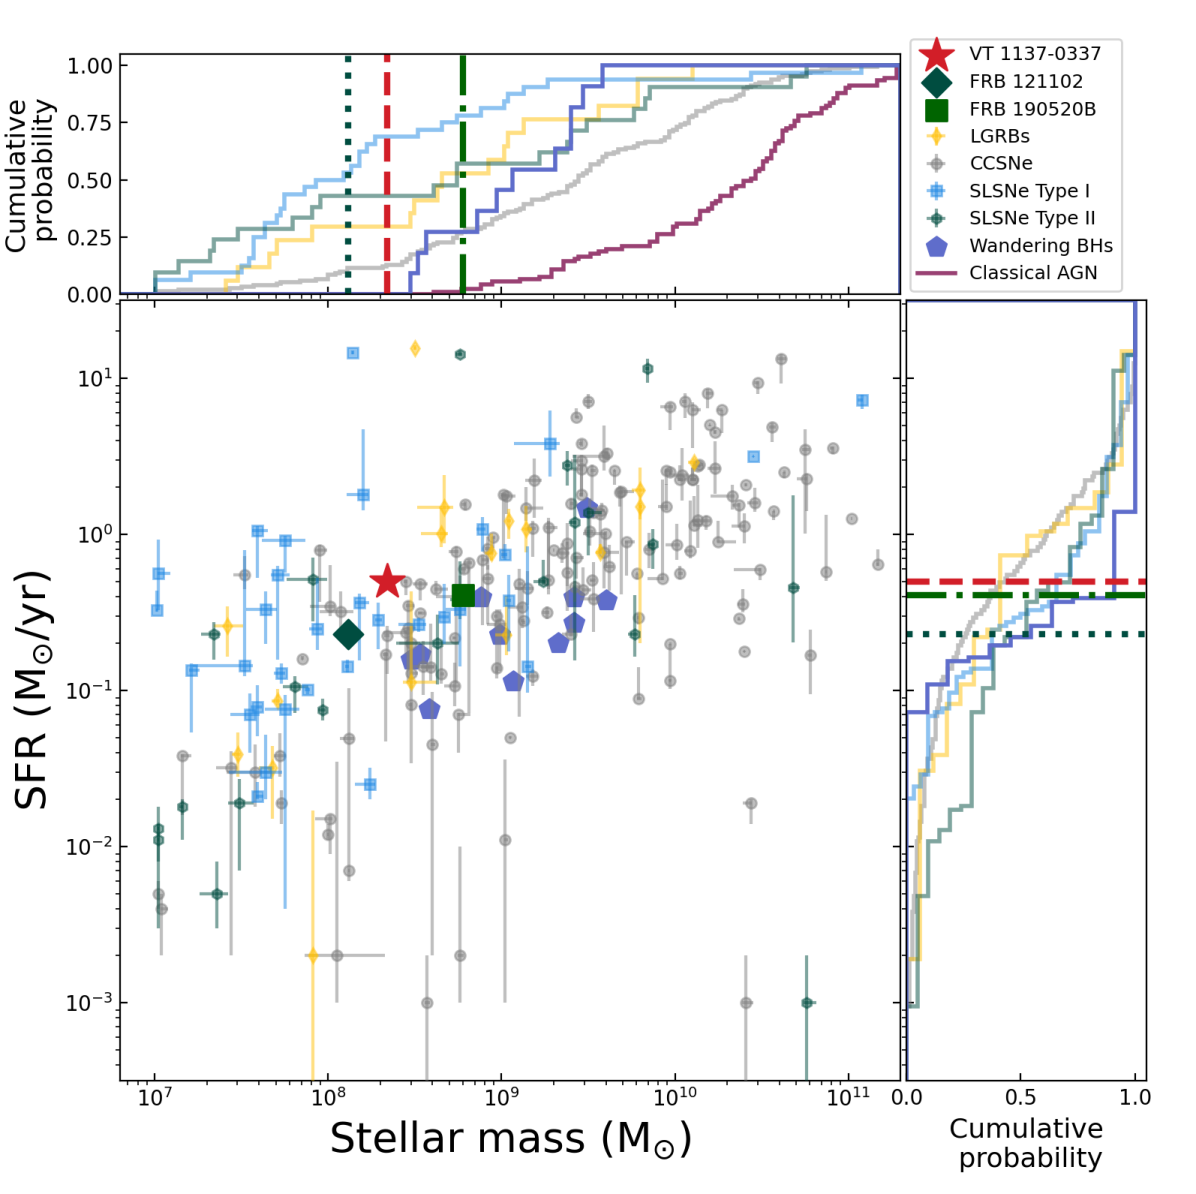
Located near the nucleus of a dwarf galaxy of stellar mass 10 at redshift at z = 0.02764
-
•
A flat radio spectrum with no observed peak between 1 to 15 GHz
-
•
A high radio luminosity of L erg/s/Hz, and a luminosity of 2 1038 erg s-1 at our highest observed frequency (15 GHz)
-
•
Transient-like behavior (an increase of in luminosity at 1.5 GHz) on the timescale of 2 decades
-
•
Slow, broadband fading (20%) at 1-12 GHz over 4 years with a constant spectral index
In Section 4, we used these features to argue that VT 1137-0337 is:
-
•
Surrounded by massive stars that have formed in the past few Myr with no indications of AGN activity in the BPT diagram (Section 4.1)
-
•
Characterized by a synchrotron spectrum that cannot be explained by a single shock under standard magnetic conditions (Section 4.2).
-
•
Produced by an emitting region of present-day radius pc and pc, where the synchrotron cooling time is decades at the GHz frequencies observed. This region contains a magnetic energy that is comparable to or greater than radio-luminous supernovae, and is not presently obscured by a high density ionized shell or wind (Section 4.3).
In this section, we discuss astrophysical source classes known to produce luminous and variable and/or flat-spectrum radio emission. We assess whether they are consistent with the properties summarized above.
5.1 Exploding stars: radio SNe and long GRBs
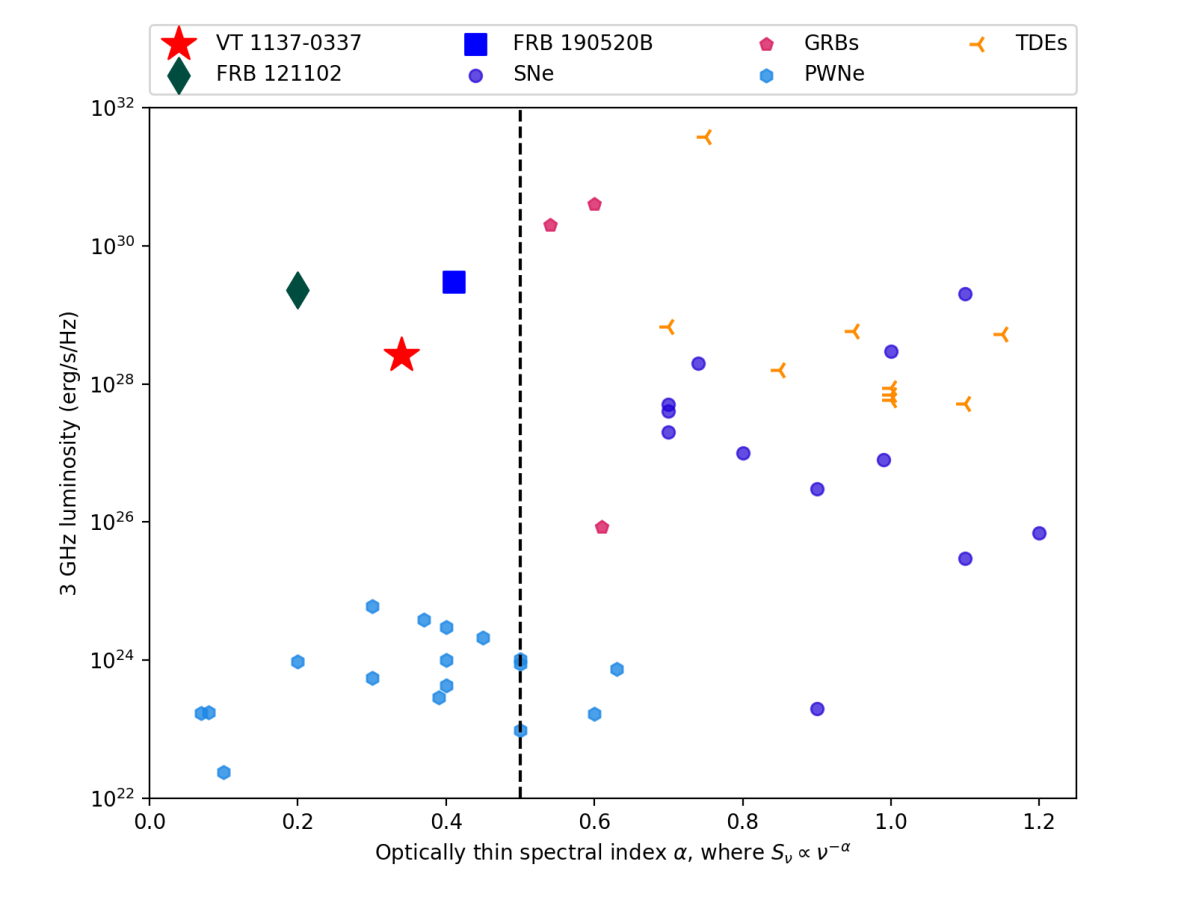
VT 1137-0337 is located in the midst of a young starburst which, from its star formation rate (SFR) of 0.5 / yr, is expected to produce a core collapse supernova (SN) every 2 centuries. A small fraction of these explosions are expected to reach our observed luminosity of 1028 erg s-1 Hz-1, either through interaction with a dense shell in the circumstellar medium (CSM) or by harboring a relativistic outflow such as a gamma ray burst (GRB). The slow evolution and low frequency peak of the radio spectrum can potentially be explained if the explosion were caught at a late epoch (years for CSM interaction and 1 decade for a GRB). However, the flat radio spectrum is unlike any SN or GRB that has been previously observed. Figure 5 shows a compilation of radio SNe and GRBs with published optically thin spectral indices. As can be seen in the figure, the spectral indices are in each case, consistent with DSA under standard conditions.
If VT 1137-0337 is indeed a supernova or GRB, we would likely need to invoke a model such as unusual magnetic conditions in the shock (e.g., Schlickeiser &
Fuerst, 1989; Fleishman, 2006) to explain its flat spectrum. This has not been observed before in the sample of SNe and GRBs discovered in optical and high energy transient surveys. Though we cannot rule out that VT 1137-0337 is drawn from a new class of volumetrically rare flat spectrum stellar explosions discovered at radio wavelengths, the lack of flat spectrum analogs leads us to believe that a SN or GRB is an unlikely explanation. Instead, as discussed in Section 5.3, VT 1137-0337 may be associated with the compact remnant of a stellar explosion, rather than the shock.
5.2 Black hole jets: XRBs, ULXs, TDEs, and AGN
Synchrotron emission from a black hole (BH) jet is a potential explanation for the flat spectrum and variability of VT 1137-0337. Flat radio spectra spanning orders of magnitude in bandwidth have been observed from BHs with a wide range of masses, from stellar mass BHs in X-ray binaries (XRBs) (e.g., Fender et al., 2000) to supermassive BHs in active galactic nuclei (AGN) (e.g., Kellermann & Pauliny-Toth, 1981). The classical model of Blandford & Königl (1979) interprets flat AGN spectra as emission from relativistic electrons that are continuously accelerated by compact conical jets. In this model, the effective area of the emitting region varies with frequency in a way that cancels out the intrinsic optically thick spectral index. This optical depth effect, which can be understood as a continuous superposition of synchrotron components, results in an overall flat spectrum. This general picture is supported by very long baseline interferometry (VLBI) observations of flat spectrum AGN cores, which in some cases directly resolve the roughly conical jets (e.g., Asada & Nakamura, 2012), and in others, show a core shift towards the black hole at high frequencies (e.g., Plavin et al., 2019), which are both predictions of the model. A similar model from Hjellming &
Johnston (1988), where the jet has a hollow conical geometry due to jet precession or orbital motion of the binary, is often invoked to explain the flat spectrum radio emission from XRBs.
In addition to producing flat spectra, BH jets are both theoretically expected and observed to be variable. In jets that are pointed within a few degrees of our line of sight, small changes in either the jet angle or jet power can lead to substantial changes in the flux due to relativistic beaming (Blandford & Königl, 1979; Lister, 2001). Stochastic radio variability on timescales of days to months at the 10 to 40% level is often observed in blazars and flat spectrum radio quasars, which both have nearly on-axis jets. In some cases, their moving average flux density can change by factors of a few on timescales of years (Liodakis et al., 2017). BHs can also brighten substantially due to new jets being launched. During state changes, XRBs have been observed to brighten by orders of magnitude at radio frequencies while displaying flat radio spectra (Yao et al., 2020; Egron et al., 2021). Quasars have also recently been observed to launch new jets, brightening by 2 to 25 on decade timescales, albeit with peaked rather than flat spectra (Nyland et al., 2020).
To assess the viability of a BH jet model in explaining the specific observational properties of VT 1137-0337, we consider BHs in three mass ranges that may exist in its host galaxy: stellar mass BHs (), intermediate mass BHs (), and supermassive BHs (). Where possible, we draw analogies to known phenomena from these BH classes in the Milky Way and other galaxies.
Stellar mass BHs are expected to exist in large numbers in all galaxies of appreciable mass. While the majority of these BHs are likely isolated and do not emit strongly, a fraction will reside in rapidly accreting systems such as XRBs that could in principle be detected (Wiktorowicz et al., 2019). There are, however, a number of orders-of-magnitude mismatches between VT 1137-0337’s properties and those of known XRBs. VT 1137-0337’s radio luminosity of erg s-1 Hz-1 is 4 orders of magnitude higher than even extreme flares from Galactic XRBs (e.g., Corbel et al., 2012). Likewise, its slow fading and lack of spectral index evolution over 4 years stands in sharp contrast with the large changes in luminosity and spectral shape observed in flaring XRBs over the span of hours to weeks (e.g., Pietka et al., 2015; Yao et al., 2020). These issues of scale arise because black holes in this mass range have relatively short dynamical times and are limited in the rate at which they can accrete. In particular, the radio power - jet power relation from Cavagnolo et al. (2010) (which contains radio sources of similar luminosity to VT 1137-0337 in its calibration set) predicts that the jet power corresponding to the luminosity we observe is erg s-1 with a scatter of 0.7 dex. This jet power is comparable to the Eddington luminosity of a BH, given by erg s-1. This suggests that to explain VT 1137-0337, a jet from stellar mass BH would need to suddenly increase in power over 20 years by a factor of 5 to 100 to 1000 times its Eddington luminosity, and it would need to maintain this new power level for at least the 4 years over which we have observed the source.
The rate of mass siphoned from a close binary can substantially exceed the Eddington accretion rate of the accreting BH. Though the vast majority of this mass is lost through disk winds, the accretion rate onto the BH can itself exceed due to photon trapping within the accretion flow. This is thought to occur in most ultra-luminous X-ray sources (ULXs; e.g, Sutton et al., 2013). Using 3D general relativistic radiation-MHD simulations, Sądowski &
Narayan (2016) predict that a rapidly rotating black hole accreting in the super-Eddington regime can launch a jet with a power of a few percent of via the Blandford & Znajek (1977) process. In order to explain VT 1137-0337 with such a super-Eddington jet, should be 2 to 3 orders of magnitude higher than Eddington requiring to be a few orders of magnitude higher still.
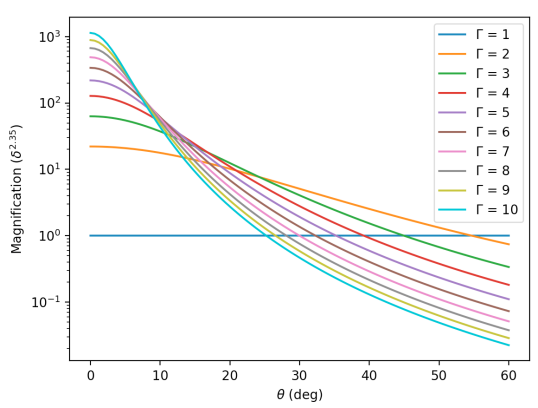
An alternate explanation for the high radio luminosity is relativistic beaming. For a jet with a velocity oriented at an angle from our line of sight, the Doppler factor is defined as , where is the bulk Lorenz factor. The jet’s luminosity is magnified (or demagnified) by a factor of , where the exponent depends on a number of factors including the spectral index of the emission, the structure of the jet, and (if relevant) the lifetime of the emitting blob (see Appendix B of Urry & Padovani (1995) for a discussion). For a steady, uniform jet, where is the spectral index (equal to +0.35 for VT 1137-0337). If the emission arises from a discrete blob of plasma travelling down the jet (i.e. a flare), it will be enhanced by a further factor of due to time dilation, making . In either case, beaming can magnify the radio luminosity by a large factor. For a steady jet pointed at , the magnification is a factor of 10 depending on (see Figure 7). At , the luminosity is magnified by a factor of 100, and for jets pointed at , beaming can enhance the luminosity by a factor of . In Galactic XRBs, has been measured to be in the range 1.3 - 3.5 (Saikia et al., 2019), a range in which the maximum magnification for a steady jet is 100 even if it is completely on-axis ().
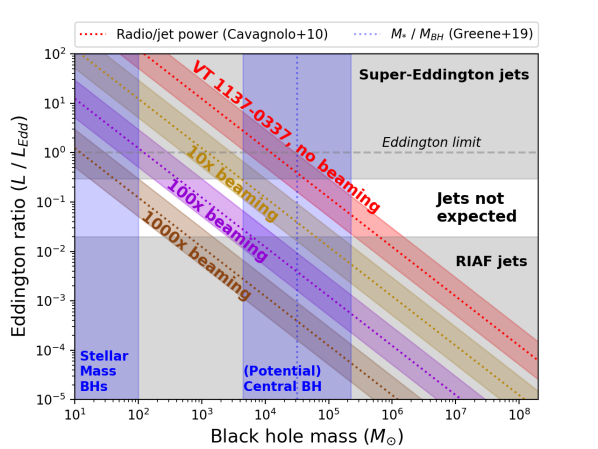
Figure 8 shows the Eddington luminosity fraction required to explain VT 1137-0337’s inferred jet power for various BH masses and under varying levels of beaming. For stellar mass BHs, highly super-Eddington accretion, strong beaming, or a combination of the two are required to explain the jet power we infer. These scenarios may be difficult to reconcile with the rapid transient behavior between FIRST and VLASS and subsequent slow fading. A large increase in the beaming magnification can occur if the the jet precesses into our line of sight. However, the timescale of this precession should be comparable to the orbital timescale of the binary which, given the high accretion rates, should be weeks. Depending on the degree of beaming, the issue of timescales is compounded by time dilation, since the timescale in the jet’s rest frame is longer by a factor of than the time we measure on Earth. Alternatively, a sudden increase in the instantaneous jet power may occur if increases rapidly. Such increases are observed in XRBs as they transition between the high-soft and low-hard states. However, this increased accretion rate typically happens on a timescale of order the disk dynamical time, which is again much shorter than the 4 years over which we have observed slow fading. Overall, though it may be possible to explain VT 1137-0337’s radio luminosity with the direct emission from a stellar mass BH jet, the characteristic timescales of such systems are not conducive to explaining the broadband lightcurve we observe.
We now consider the possibility of an intermediate mass BH (IMBH) in the mass range . To date, no examples of IMBHs have been conclusively established, though there are some promising candidates, particularly at masses 10 (see Greene et al., 2020, and references therein). In the lower half of the mass range , many of the same arguments regarding stellar mass BHs apply. Beaming is still required if the accretion flow is sub or near-Eddington, though for near-Eddington accretion, the required magnification is only 10, corresponding to for . If the near-Eddington accretion is due to a close binary companion, the orbital timescale will still be of order weeks, so the orbital plane would still have to be aligned close to face-on to avoid precessing the jet by more than a few degrees. A flare would need to span years 1 decade in its rest frame and would be more akin to a new jet turning on. It is again unclear what could cause the sudden but sustained change in accretion required to power such a flare. Tidal disruption events (TDEs) can launch jets and drive super-Eddington accretion (Zauderer et al., 2011), but the mass fallback rate is expected to decline steeply over time (canonically as ; Phinney (1989)) and the jet’s characteristic fading timescale would be months, not decades (Tchekhovskoy et al., 2014). Likewise, accretion disk instabilities will operate on timescales far too short to explain our observations.
The upper half of the IMBH mass range is more plausible, and is particularly important to consider given the potential presence of a central black hole in VT 1137-0337’s host galaxy. Due to selection bias in traditional AGN diagnostics, central black hole detections have historically been limited to galaxies with stellar mass (e.g., Reines &
Volonteri, 2015), where typically . However, there is strong evidence of 10 BHs in 10 galaxies (e.g., Nyland et al., 2017; Davis et al., 2020) and simulations suggest that the BH occupation fraction should be in galaxies (Bellovary et al., 2019). Additionally, new selection methods based on luminous radio emission (Reines et al., 2020) and the high ionization potential [FeX] line (Molina et al., 2021a, b) have identified promising AGN candidates in dwarf galaxies as low mass as . For VT 1137-0337’s host galaxy, a slight extrapolation of the most recent stellar mass - BH mass relation (Greene et al., 2020) predicts a central BH mass of 10 when considering all galaxy types, or 10 when considering only late-type galaxies.
There are some additional complications that are particularly relevant for jet models in the predicted central BH mass range. First, there is a range of Eddington ratios between a few percent and 30% for which jets are not observed or theoretically predicted. In this range, the accretion disk is expected to be geometrically thin and incapable of supporting the vertical magnetic fields required to collimate jets (Meier, 2001). This jet quenching effect has been observed in XRBs (e.g., Fender et al., 2004), and has been used to explain the abrupt drop in the X-ray flux from the jetted TDE Swift J1644+57 (Tchekhovskoy et al., 2014). The quenched jet zone excludes a substantial part of the BH mass - Eddington ratio parameter space relevant to higher mass IMBHs (Figure 8). Second, the optical emission lines in the 280 pc radius region surrounding VT 1137-0337 have intensity ratios that are very far from the region typically associated with AGN (Figure 4), and all of the lines are spectrally unresolved at the 150 km/s level. This is likely ok for lower mass BHs or those accreting at low Eddington ratios, since sub-Eddington BHs with masses are predicted to have weak narrow lines with ratios consistent with star formation, (albeit in a different region of the BPT diagram than VT 1137-0337’s host) (Cann et al., 2019). However, for near-Eddington BHs with mass 10, the expected narrow line luminosity is comparable to what we observe, and their intensity ratios are inconsistent with the ones we measure.
At the lower end of the predicted mass range (10), avoiding the quenched jet zone requires either near-Eddington accretion and little to no beaming, or very strong beaming and accretion in the radiatively inefficient accretion flow (RIAF) regime (an Eddington ratio of a few percent). If the accretion rate is near Eddington, it is once again difficult to explain the sudden and sustained accretion. If instead the emission is highly beamed, the slow variability is again problematic given time dilation and the expected variability timescale (months) for sources in this luminosity range (e.g., Pietka et al., 2015).
At the high end of the predicted mass range (10), the two scenarios are demagnification from beaming and near-Eddington accretion, or moderate beaming and accretion in the RIAF regime. As discussed above, the near-Eddington scenario is disfavored by the lack of AGN-like emission ratios in addition to issues with fueling the BH at the right rate on the right timescales. In the RIAF scenario, the power requirement for the jet is more easily satisified, so we investigate it in more detail. If a 10 BH experienced an increase in its accretion rate to a few percent of Eddington and subsequently launched a flat spectrum jet at an angle where it is magnified by 10 by beaming, that could potentially explain the appearance of VT 1137-0337 between FIRST and VLASS. However, in order to explain the slowly fading flat spectrum, the jet would need to maintain a nearly constant luminosity on scales of 10 pc (the linear scales corresponding to synchrotron self-absorption frequencies of 15 GHz to 1 GHz at the luminosity of VT 1137-0337; Scott & Readhead, 1977) for an observer-frame timescale of 4 years. Plasma moving at relativistic velocities in the jet will cycle through these length scales on timescales of days to weeks. Thus, the jet would have to maintain a stable power on all scales probed over tens to thousands of plasma crossing times. This type of stability is not observed in AGN dominated by their flat spectrum cores. For scale, the 15 GHz length scale for a 1 Jy flat spectrum AGN at a distance of 100 pc is 0.07 pc, corresponding to a plasma crossing time of 80 days. Maintaining a constant flux for 1000 crossing times would be analogous to having that flat-spectrum radio quasar or blazar be stable for 2 centuries, which is far longer than the typical variability timescale of months (Liodakis et al., 2017). Additionally, to avoid spectral index evolution and sharp variability due to changes in beaming, the jet orientation would need to remain stable, excluding models involving a pre-existing jet that precessed into our line of sight. We do not consider any of the above scenarios to be likely.
Finally, we consider the possibility of a jet from a supermassive BH. Black holes with mass are not generally expected to exist in VT 1137-0337’s dwarf host galaxy, though ones in the range 10 are within the scatter of the stellar mass - BH mass relation. Many of the same arguments against 10 BHs apply in this mass range. While fueling the jet power is no longer an issue, maintaining a low-luminosity flat-spectrum core with only 20% variability over 4 years and no change in the spectral index is once again difficult due to the size scales involved.
In summary, BH jet models at all mass scales face substantial challenges when attempting to explain VT 1137-0337’s luminosity, variability properties, and flat spectrum. Stellar mass BHs would require extreme and rapidly changing accretion rates or heavy beaming to produce the required luminosity. Such jets would most likely appear as fast transients (flickering on and off on timescales of days) rather than the relatively stable one that we have observed. An IMBH, particularly one towards the higher mass end (), is potentially expected to exist in VT 1137-0337’s host galaxy and would be able to accrete at a rate that could power the luminosity we observe. However such a BH cannot explain the flat spectrum and slow variability, since the length scales responsible for emitting at each of our observed frequencies would have been traversed by tens to thousands of separate blobs of relativistic plasma over the course of 4 years. The modest () and consistent variability we have observed at all frequencies would require any stochastic jet-power process to be auto-correlated over unrealistic timescales. Supermassive BHs are ruled out by the same argument, and are furthermore not expected to exist in such a low mass galaxy. These arguments, though approximate in nature, show that the specific properties of VT 1137-0337 (particularly its sudden appearance, flat spectrum, and slow fading, which have not been observed for other BHs or BH candidates) are not easily explained by a BH jet. Instead, we believe that there is a more compelling explanation: a young and energetic pulsar wind nebula. We discuss this in the next section.
5.3 Neutron star nebulae: pulsar winds and magnetar field decay
The most distinctive feature of VT 1137-0337 is its flat and slowly evolving radio spectrum. Pulsar wind nebulae (PWNe) are one of the only well-observed source classes with this type of spectrum. The vast majority of known PWNe are observed to have spectra flatter than the Fermi acceleration limit (Kaspi et al., 2006; Gaensler & Slane, 2006; Green, 2019) that evolve very slowly on human timescales. As an example, the Crab Nebula has a power law spectrum with no radio-frequency substructure, which fades by only 0.167 0.015 percent per year (Aller & Reynolds, 1985). Its spectral index was measured in the 1960s to be (Baars et al., 1977), and least squares fitting of a compilation of measurements from the 1970s to the early 2000s gives (Macías-Pérez et al., 2010).
Many theoretical mechanisms have been proposed to explain the flat spectra of PWNe. Unlike in BH jets, where the time-variable flat spectra are typically explained with optical depth effects that can change rapidly, most PWN theories invoke an intrinsically hard spectrum with an electron energy index . Atoyan (1999) proposes that the hard energy distribution is assembled over time from electrons injected at high energy that cool rapidly and pile up at the synchrotron cooling break. As the PWN expands and its magnetic field weakens, the break drifts upwards in energy, freezing in the old low energy electrons and piling up new ones to fill out the higher energy parts of the spectrum. This model ties the spectral index to the evolution of the PWN in a way that reproduces the observed flat spectra for standard energy injection via spindown. It predicts that the current radio-producing electrons in the Crab Nebula were injected at a very early time (decades). If this were the case, the Crab Pulsar may have had a spin period of a few milliseconds at birth rather than the ms inferred from tracing back its spindown from parameters measured in the present day (e.g., Kou & Tong, 2015).
There is, however, evidence that radio-emitting electrons in the Crab Nebula are still being accelerated today, given the morphological similarity of radio wisps with much shorter lived optical wisps (Bietenholz et al., 2001). In that case, the hard distribution may instead be produced at the acceleration site. Schlickeiser &
Fuerst (1989) propose that in extremely magnetic dominated shocks, due to second-order Fermi acceleration. By their analytic estimates, reducing to 1.7 requires that the magnetic energy dominates over the thermal energy by over an order of magnitude (a plasma of 0.05). Alternatively, simulations of particles accelerated by relativistic magnetic reconnection are consistently able to produce distributions with with Lorentz factors appropriate for GHz radio emission (e.g., Kagan et al., 2018). This too requires a highly magnetized plasma at the acceleration site. Werner et al. (2016) found that when (the ratio of the magnetic to relativistic energy density) is 8. Reconnection-driven acceleration can potentially occur at the termination shock of the highly magnetized and relativistic pulsar wind (Sironi &
Spitkovsky, 2011) or within the bulk of the nebula itself (Lyutikov et al., 2019).
Flat spectra can potentially be produced even without a hard electron distribution if the electrons are propagating within a magnetic field that, due to turbulence, is randomly oriented on scales smaller than the particles’ orbits. In this scenario, there is a frequency range where , where is the index of the turbulent power spectrum (Fleishman &
Bietenholz, 2007). Intriguingly, Kolmogorov (1941) turbulence has = 5/3, which implies a spectral index of similar to our observed value of . This mechanism has also been proposed to explain the Crab Nebula’s flat radio spectrum (Tanaka &
Asano, 2017). Recent particle in cell simulations have also shown that particles accelerated (typically by magnetic reconnection) within turbulent plasmas have an energy-dependent anisotropy, which for most viewing orientations would also lead to hard spectra to 0.5 (Comisso et al., 2020)
At the moment, the theory of PWNe spectra is an evolving field with new ideas being put forward regularly. We therefore remain agnostic to the mechanism and instead point out that VT 1137-0337’s flat spectrum and slow fading are empirically very similar to what’s observed for PWNe. The biggest differences to be explained are that (1) VT 1137-0337 appears as a transient (on a timescale of 20 years), (2) it is fading at a moderate rate (5% per year, much faster than the Crab’s 0.17% per year), and (3) it is far more radio luminous than any known PWN ( the Crab’s luminosity).
All three of these differences are, at least qualitatively, expected for a PWN if the central neutron star (NS) is young. VT 1137-0337’s starbursting host galaxy is expected to produce young NSs via core collapse supernovae at a relatively high rate. Shortly after birth, a NS will start to spin down, launching a relativistic wind of particles and Poynting flux through the rapid rotation of its magnetic field (Goldreich & Julian, 1969). For the most strongly magnetized NSs, there may be a non-negligible or even dominant component of the wind powered by the direct decay of the internal magnetic field, possibly in discrete flares (e.g., Beloborodov, 2017; Margalit & Metzger, 2018). Regardless of the power source, the wind will deposit its energy in a termination shock, inflating a bubble within the surrounding supernova ejecta and forming a PWN. After some time, the ejecta will expand and dilute to the point where it becomes optically thin to free-free absorption. At that point, the PWN will suddenly appear as a radio transient (Chevalier & Fransson, 1992). Young PWNe are expected to reach their peak luminosity after just a few years (with the rise time generally occurring while they are still obscured). Those powered by neutron stars with fast periods or high magnetic fields could be orders of magnitude more luminous at early times than the centuries to millenia-old PWNe observed in the Milky Way. Such young nebulae are also expected to fade at their fastest per-year rate (Reynolds &
Chevalier, 1984). Together, these qualities make a young, energetic PWN an intriguing potential explanation for VT 1137-0337. In the remainder of this section, we describe some order-of-magnitude properties of PWN models embedded in supernova ejecta, and check whether they are able to explain VT 1137-0337’s observed properties.
5.3.1 Age constraints
We begin by constraining the range of PWN ages () consistent with VT 1137-0337’s observables, under the assumption that it was born in a supernova. There are thought to be other ways of forming young neutron stars (such as the accretion induced collapse of a white dwarf), but VT 1137-0337’s location within an extreme starburst suggests that a supernova would be the most likely channel. The age constraints will be applicable regardless of the nebula’s power source.
To start, there is a hard lower limit of years in February 2022 based on the duration that we have observed the source. This minimum age is pulled upwards by two requirements: (1) that the supernova ejecta must expand to the point where it is optically thin to free-free absorption, and (2) that the nebula has time to grow to a size cm, as we inferred in Section 4.3. The time for the ejecta to become transparent to free-free absorption is given by Metzger et al. (2017):
| (7) |
where is the ionization fraction of the ejecta, is the ejecta temperature in units of 104K, is the ejecta mass in units of 10, is the ejecta velocity in units of 104 km/s, and is the observing frequency in GHz. Even for a high intensity of ionizing radiation from the nebula, is expected to be 0.25 on a timescale of decades, with full ionization occurring on a timescale of centuries (Metzger et al., 2017). For typical supernova kinetic energies and ejecta masses (e.g., Nicholl et al., 2015; Taddia et al., 2015; Barbarino et al., 2020; Martinez et al., 2022), the quantity is for Ic broadline supernovae, for superluminous supernovae, for stripped envelope (type Ib/c) supernovae, and for type II supernovae. For these various classes, 1 to 4 decades for our lowest observed frequencies of 1 GHz.
Next, the radius of a PWN expanding within supernova ejecta is given by Chevalier (2004):
| (8) |
where is the rate of energy injection into the PWN in units of 1042 erg s-1, is the energy of the supernova in units of 1051 erg, and is the age normalized to 20 years. For the various supernova types, the quantity to . For reasonable values of discussed in the sections below, . The timescale years is sufficient to expand the nebula to cm for fiducial values, though less energetic supernovae with higher ejecta masses will require longer to reach this radius. Adding the duration that we have observed the source to , we adopt a fiducial lower limit to the nebula’s age in 2022 of years.
We note that at an age of years, the shock emission from most (but not all) supernovae should be orders of magnitude fainter than what we can detect. VT 1137-0337 has a radio spectral luminosity of 1028 erg s Hz-1, which is 2.5 orders of magnitude more luminous than the median peak of supernova radio lightcurves. These peaks tend to occur at an epoch of months to years after explosion (Bietenholz et al., 2021). At an epoch of decades, typical supernovae will be one or more orders of magnitude fainter yet (Chevalier, 1998). We also note that for typical NS kick velocities, the radius of the nebula should be larger than the distance the NS has travelled, given by cm, where is the kick velocity in units of 300 km/s. Even for the largest kick velocities of 1000 km/s, the NS should still be embedded within the nebula, though the distance travelled and the implied asymmetry of the ejecta would contribute to the nebula partially breaking out at a slightly earlier time. Thus, supernova shocks and neutron star kicks should not be issues for the general picture presented here.
An upper limit to the age of the nebula can be inferred from the fact that VT 1137-0337 was detected as a transient. If years is the time that it takes for the ejecta to become transparent at 1 GHz, the upper limit to the age in 2018 is years, since if VT 1137-0337 were older than that, it should have been clearly detected in FIRST. Our estimate of decades, therefore suggests that the source is no more than 6 decades old.
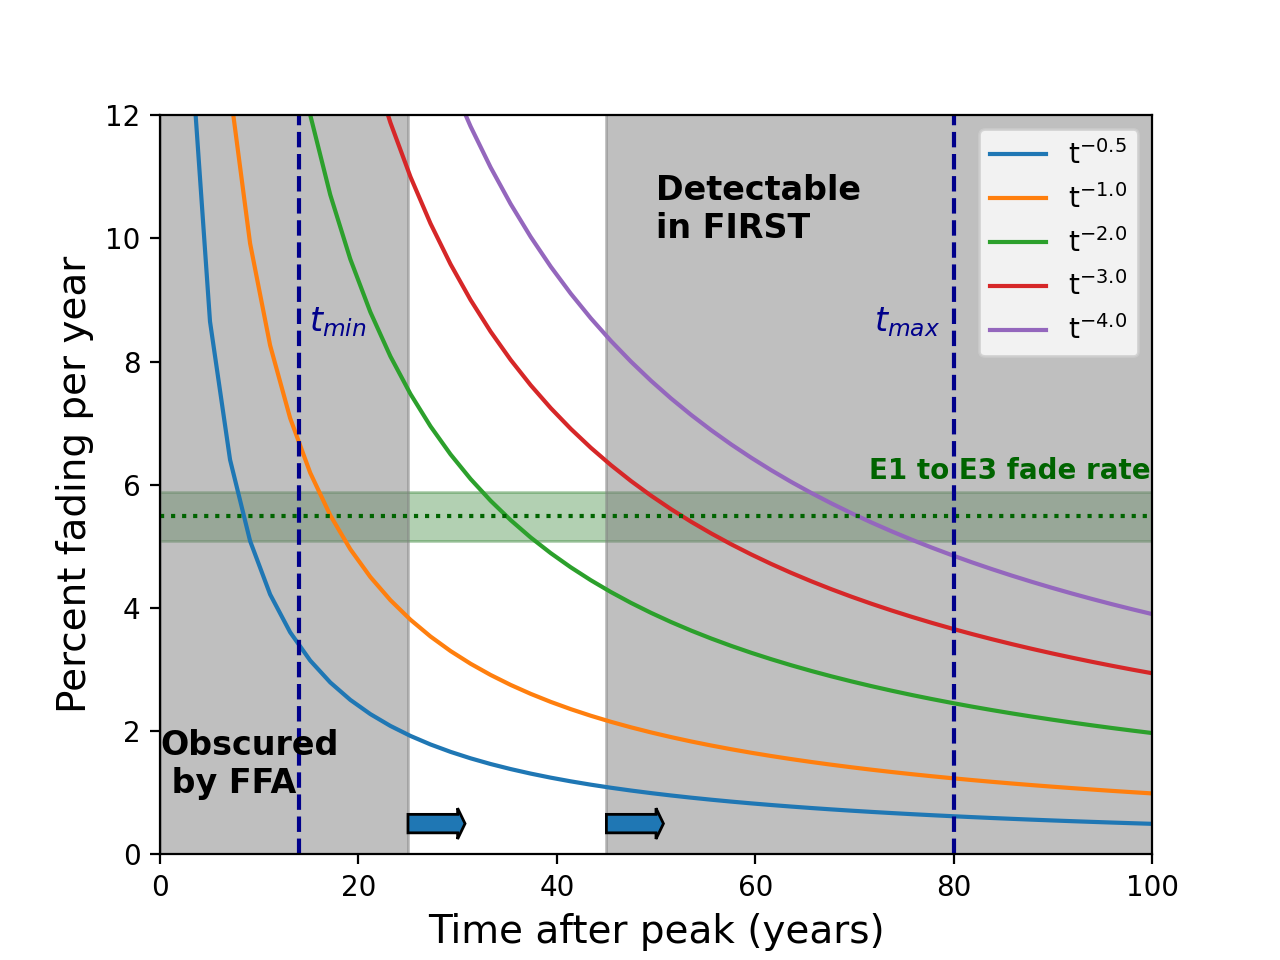
A complementary upper limit comes from the 5.5% per year fading that we measure between Epoch 2 and Epoch 3. In both spindown and magnetar models, the rate of fading can be approximated with a power law that at early times is generally not steeper than t-4 (e.g., Reynolds &
Chevalier, 1984; Margalit & Metzger, 2018). Figure 10 shows the observed fade rate in comparison with power laws of various steepness. Past an age of 80 years, even a fade rate of t-4 will be slower than the rate that we measure.
Altogether, the allowable age range for VT 1137-0337 is a 20 year window with the lower edge set by (Figure 10). Different values of also correspond to different power-law rates of fading when combined with the observed per-year fade rate. In the next section, we use this to constrain the allowable parameter space in the diagram for a spindown model.
5.3.2 Spindown implies a strongly magnetized NS
We now consider a nebula powered by the spindown of a central NS, the mechanism thought to power most Galactic PWNe. In standard spindown models, the rate of energy input to the nebula is assumed to be equal to the rate of rotational energy dissipation (the spindown luminosity ), which can be expressed as a function of the NS’s rotational period and its time derivative :
| (9) |
Here, is the NS moment of inertia in units of 1045 g cm2 (equal to 1.1 for a constant-density 1.4 M⊙ sphere of radius km), is the period derivative in units of 10-11 seconds per second, and is the period in units of 10 ms. As the NS’s magnetic field rotates, it emits magnetic dipole radiation with a luminosity of
| (10) |
where is the strength of the surface dipole field in units of 1013 G. By equating with , we can get an expression for (where we have dropped a constant within a few percent of unity):
| (11) |
The spindown luminosity evolves over time (Gaensler & Slane, 2006):
| (12) |
where is the initial value of , = 2 to 3 is the braking index, and is the initial spindown time:
| (13) |
At early times , will be nearly constant. Later, when , will decrease as a power law to . By combining Equations 11 and 13 and assuming , the spindown time can also be recast in terms of the dipole field:
| (14) |
From this, we can see that the initial spindown time depends strongly on both the initial period and the magnetic field. We will return to this later in this section and the next, but first, we attempt to constrain the values of and consistent with VT 1137-0337’s radio luminosity and lightcurve.
In Galactic PWNe, the spindown luminosity can be measured precisely through pulsar timing. However, for our model, the best we can do is to estimate what it should be from the radio luminosity. The conversion between radio and spindown luminosity is often expressed with the fraction . For well-characterized radio PWNe in the Green (2019) catalog, the median value of is , with a scatter of dex, where we have taken properties of the corresponding pulsars from psrcat (Manchester et al., 2005). This is in agreement with results in the literature (e.g., Frail &
Scharringhausen, 1997; Gaensler et al., 2000), who find for young and energetic pulsars, though some older pulsars with undetected nebulae have values .
The value of is expected to evolve over time as the NS spins down ( decreases, as described above) and its PWN fades ( decreases). The behavior of the radio lightcurve depends on , the adiabatic cooling of the radio-emitting electrons and the evolution of the magnetic field in the nebula. An analytic model for the lightcurve of a spindown powered PWN expanding within spherically symmetric supernova ejecta undergoing homologous expansion can be found in Reynolds &
Chevalier (1984). Their model predicts that for , a single injected electron energy distribution of , and an observing frequency below the synchrotron cooling break, should fade approximately as a power law of to , depending on the degree to which the PWN has swept up the ejecta. After , when the spindown luminosity begins to drop, the radio lightcurve fades much more steeply, as for . Later, after the PWN is compressed by the passage of the reverse shock, the luminosity will undergo a sharp enhancement followed by a slow decline . This occurs at a time years for a thin wind or an ISM-like density, though may occur much sooner if there is a dense shell of circumstellar material around the supernova. The net result is that before the reverse shock sweeps through (both before and after ), should very roughly decrease as to . After the reverse shock, should increase as to .
In Section 4.3, we argued that VT 1137-0337 is not surrounded by a dense shell (so the reverse shock is not relevant at our inferred of decades), and that our radio observations likely lie below the cooling break. We therefore expect that should be decreasing with time, and that the value of of in Galactic PWNe is likely an underestimate. Extrapolating backwards from the youngest known PWNe (including the Crab Nebula) which have characteristic ages 1000 years and , we estimate that a reasonable range of values for a PWN with an age of a few decades is . For VT 1137-0337’s radio luminosity of erg s-1, the corresponding spindown luminosity range is to 1041 erg s-1.
Using the age constraints in Section 5.3.1, we can separately constrain the value of the initial spindown time . As can be seen in Figure 10, if the true age of the nebula were close to the minimum age years, the measured per-year rate of fading corresponds to a rather shallow power law . In the framework of Reynolds &
Chevalier (1984), this would imply that the NS has not yet appreciably spun down, so years. Alternatively, if is closer to the maximum value years, we would require a steep power law to reach the 5% per-year fading we observe. Such a steep power law would imply that the NS has already begun to spin down substantially, and so years . Intermediate values of correspond to power laws of intermediate steepness that would appear when . This implies that for a spindown powered nebula, is between 14 to 80 years.
As shown in Figure 11 the constraints on and combine to form a rather tight region in the classic pulsar parameter space of P and . The allowed region corresponds to a dipole field of slightly less than 1013 G to a few 1014 G, roughly an order of magnitude stronger than that of the Crab Pulsar ( G). Such strongly magnetized neutron stars should spin down rapidly (Equation 14). Within 100 years, will have decreased by and, due to the expected drop in , the radio luminosity will have decreased by an even larger margin. Within a few thousand years, the central NS should fall within the distribution observed in the Milky Way. If the magnetic field is G, the NS may eventually resemble the population of Galactic magnetars (Kaspi &
Beloborodov, 2017). If instead is closer to 1013 G, it might eventually resemble a highly magnetized pulsar, similar to the NS at the center of the composite supernova remnant Kes 75 (e.g., Gavriil et al., 2008; Reynolds et al., 2018).
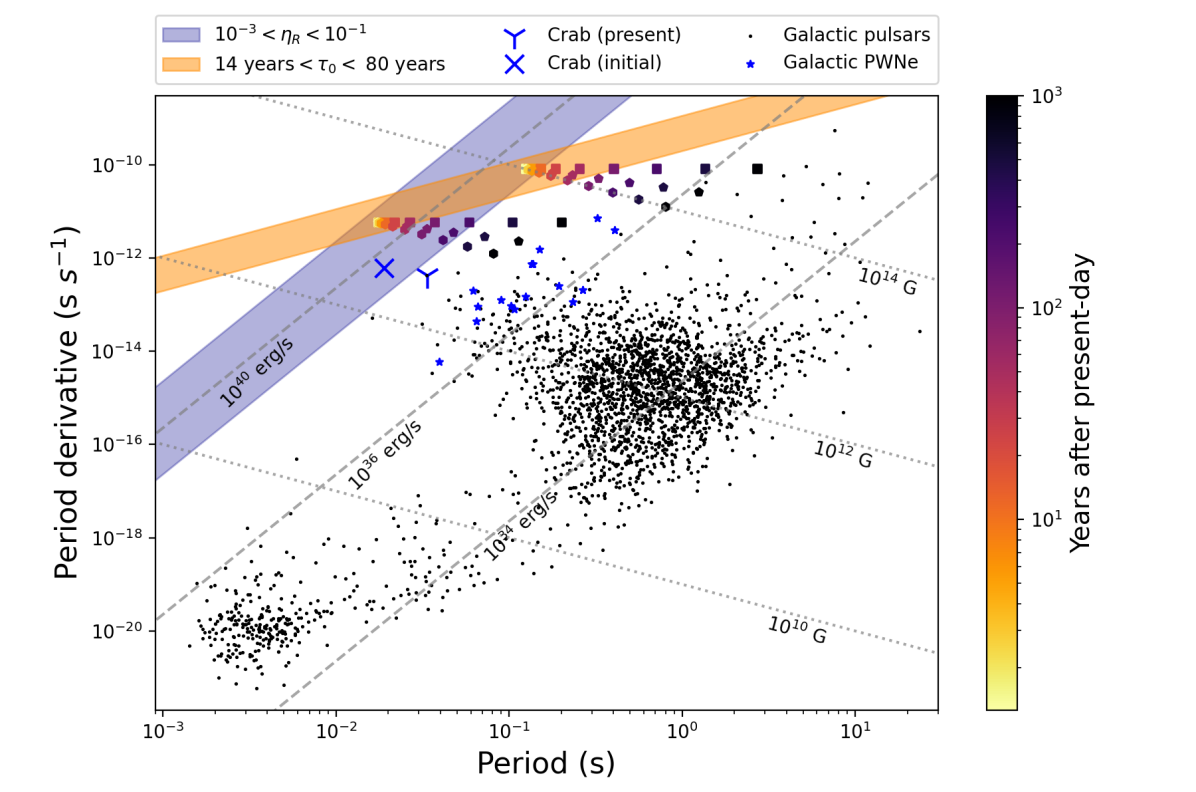
5.3.3 Magnetar activity as an alternate power source
As discussed above, VT 1137-0337’s luminosity and lightcurve are consistent with a decades old PWN powered by spindown. However, the only part of the argument that depends specifically on spindown is the evolution of . In principle, any source of power that can approximately reproduce (and also satisfy one of the mechanisms for producing a flat spectrum) would suffice. A change in the time-dependence of would change the PWN’s lightcurve, but as shown in Figure 10, our per-year fading measurement can be reconciled with a broad range of power-law fade rates from to simply by changing . This leads us to consider a different energy source often used in modeling magnetars: the direct decay of the NS’s magnetic field.
Galactic magnetars typically have spindown-inferred surface dipole fields of G (Kaspi &
Beloborodov, 2017). Their total surface fields may be even stronger if a large fraction is “hiding" in higher order multipoles (those components fall off more rapidly with radius and make only marginal contributions to the torque at the light cylinder radius where the pulsar wind is launched; Cordes et al., 2021). Fields within the NS should be even stronger. Galactic magnetars maintain high blackbody temperatures for much longer than their initial neutrino cooling timescale, suggesting that their internal fields (which heat the NS through their decay) can be as strong as G. The strong internal field corresponds to a large energy reservoir erg. This reservoir is primarily released via ambipolar diffusion on a characteristic timescale of roughly years, where is normalized to 1016 G, and in kilometers is the length scale of magnetic field fluctuations being dissipated in the core (Beloborodov & Li, 2016). The corresponding average luminosity is roughly
| (15) |
which scales sharply with the internal magnetic field, and should be able to power VT 1137-0337 (i.e. produce erg s-1) provided that G.
The energy released by ambipolar diffusion should on average decline as a power law with time as the length scale grows from small scales to the radius of the NS and the internal magnetic field decays (Beloborodov & Li, 2016). Though on short timescales the energy may be released in discrete magnetar flares, these flares should combine to form a variable or intermittent wind which also gets decelerated in a termination shock and transfers its energy to particles in the nebula through wave heating (Beloborodov, 2017). The evolution of a magnetar wind nebula with a power law energy input where the magnetar switches on at a time and injects relativistic electrons through its flares has been modeled semi-analytically by Margalit & Metzger (2018). They find that at an age of decades, nearly all of the properties of the persistent radio source associated with the repeating fast radio burst FRB 121102 (including its radio luminosity, which is that of VT 1137-0337; Chatterjee et al., 2017) can be reproduced with erg, 1.3, and years. By changing the parameters slightly, they are able to scale the luminosity upwards or downwards by an order of magnitude, including to the luminosity of VT 1137-0337. At frequencies below the synchrotron cooling break, their model predicts that the nebula’s lightcurve should decrease as to for to 2. This range of fade rates is consistent with the range inferred for VT 1137-0337 for years.
These order-of-magnitude considerations suggest that the decay of a young magnetar’s internal field is a plausible alternative to spindown for explaining VT 1137-0337’s luminosity and lightcurve. If this is the case, then the field decay should be the nebula’s primary power source in the present day, since NSs born with strong enough magnetic fields should have long since spun down. When normalized to a surface dipole field G (a reasonable value for the strong required internal fields), the initial spindown time (Equation 14) becomes hours. For a braking index , the age at which the spindown luminosity drops below the level required to power a radio luminosity is roughly
| (16) |
where = erg s-1. For initial periods ms and G, years is much less than decades. If the initial period is much longer, the spindown luminosity never reaches the level required to power the nebula (Figure 11), and if is closer to 2, spindown occurs even more rapidly.
At early times, the energy released by a magnetar’s spindown could influence the expansion of the nebula and the luminosity of the supernova. If G, a large fraction of the NS’s rotational energy will have been released while the ejecta is still coupled to the internal radiation via electron scattering. If the magnetar has an initial period a few to a few 10s of milliseconds, its rotational energy would be erg, which is enough to power a superluminous supernova when released at this early time (Kasen & Bildsten, 2010). Such rapid rotation may be related to the generation of the strong fields (Raynaud et al., 2020), and due to the age of VT 1137-0337, such a luminous explosion is not ruled out by the lack of an archival supernova detection (Section 3.6). In this scenario, the radius of the nebula might be larger than expected for its age due to the additional energy imparted to the ejecta and the increase in (Equation 8). If instead 100 ms, the total rotational energy would be closer to 10 erg. In this case, the early spindown luminosity (comparable to ) would have a small effect on the initial expansion of the nebula, and a negligible effect on the supernova.
5.4 Comparison with FRB persistent sources
Much of the recent work on luminous magnetar wind nebulae has been done in the context of persistent radio sources (PRSs) associated with repeating fast radio bursts (FRBs) (e.g., Murase et al., 2016; Beloborodov, 2017; Margalit & Metzger, 2018), a connection that has recently been strengthened by the detection of a low-luminosity FRB from the Galactic magnetar SGR 1935+2154 (Bochenek et al., 2020; CHIME/FRB Collaboration et al., 2020), though see Sridhar & Metzger (2022) for an alternative model involving a highly super-Eddington stellar mass black hole. There are a number of observational similarities between VT 1137-0337 and PRSs. The two PRSs identified to date are associated with FRB 121102 (Chatterjee et al., 2017) and FRB 190520B (Niu et al., 2021). Both of the PRSs have comparably flat spectral indices at frequencies of a few GHz and radio luminosities higher than that of VT 1137-0337 (Figure 5). Both PRSs are hosted by starbursting dwarf galaxies of stellar mass and star formation rate yr (Figure 6). These galaxies have specific star formation rates (SSFRs) comparable to the hosts of long GRBs and superluminous supernovae, but there is considerable overlap with the SSFRs of ordinary core collapse supernova hosts (Figure 6, Taggart & Perley, 2019). Neither PRS has thus far been observed to fade, but the measurement uncertainties for these faint sources (Jy at 1.5 GHz in both cases) do not preclude fading at the level that we have observed. Likewise, neither PRS has been observed to appear as a transient, but the lack of sufficiently deep reference epochs does not exclude this scenario. Some of the best available constraints come from the the NRAO VLA Sky Survey (NVSS), which gives 1.5 GHz 3 upper limits at both PRS locations of 1.5 mJy roughly two decades before detection (Condon et al., 1998), suggesting that the average fade rate of these sources on 2 decade timescales is per year.
One feature of the FRB 121102 PRS not present in VT 1137-0337 is the break at 10 GHz where the spectrum steepens from to (Chatterjee et al., 2017). This break is confirmed by Chen et al. (2022) who find a low variability amplitude at 15 and 22 GHz, suggesting that the break is intrinsic rather than a chromatic artifact of refractive scintillation. A potential break at the same frequency is unconstrained by currently available observations of FRB 190520B, which span 1 - 6 GHz (Niu et al., 2021). The origin of the FRB 121102 break is still somewhat unclear. The most straightforward explanation might be synchrotron cooling, which is generically expected to deplete high-energy electrons radiating at high frequencies where cooling is efficient, piling them up at a lower energy and creating a spectral break at the corresponding cooling frequency . However, cooling of a single electron population predicts a steepening from for to for for a difference , less than the observed value . One potential solution is if more electrons are injected at early times where the magnetic field is stronger and the cooling frequency lower. As discussed in Atoyan (1999), this would flatten the spectrum at frequencies lower than , thus alleviating the tension in . It is likely, however, that other solutions exist.
Regardless of the mechanism, if the break were caused by a cooling frequency, the lack of a detected break in VT 1137-0337 is unsurprising given its lower radio luminosity, which suggests an older age, a lower , or both. Either of these differences could lead to the cooling break being located at a higher frequency than the range we have observed. For electrons with age and a nebula with field strength , the cooling frequency scales as . In young nebulae, the weakening of the magnetic field (which is primarily driven by adiabatic cooling as the nebula expands) should be the dominant factor, causing the cooling frequency to rise rapidly with time. In the case of spindown, to , so to (Reynolds &
Chevalier, 1984). For a power law magnetic energy injection and a nebula radius (Equation 8), integrating Equation 11 from Margalit & Metzger (2018) yields to for and to 2. This leads to a similar evolution for the cooling break: to . Even for the shallowest power laws, raising from 10 GHz to GHz (beyond our observing frequencies) would only require that VT 1137-0337 is older than FRB 121102. For a fixed nebula age, the value of could also be lowered by reducing , though this effect is weaker than that of aging. Roughly, , where is the magnetic energy in the nebula and the nebula radius is a weak function of , scaling as (Equation 8). If we neglect the differential adiabatic cooling due to the slightly different expansion rate, for fixed age. Altogether, this leads to , implying . If we assume that a 10 smaller radio luminosity corresponds to a 10 lower , this would lead to a higher at the same age. This too would be enough to explain the lack of a cooling break at GHz.
Overall, we find the two FRB persistent sources to be intriguing possible analogues for VT 1137-0337, given the theoretical connections to magnetar wind nebulae and the observational similarities. However, a link between the two cannot be firmly established without the detection of associated FRBs. The best publicly available constraints come from the first CHIME data release, which does not report any detections consistent with VT 1137-0337 between July 2018 and July 2019 (The CHIME/FRB Collaboration et al., 2021). The lack of detections is not particularly constraining however, since VT 1137-0337 is located close to CHIME’s southern declination limit () where their observations are likely not as sensitive and since our observations do not constrain the free-free opacity at CHIME’s observing frequencies (400 - 800 MHz). From Figure 4 of The CHIME/FRB Collaboration et al. (2021), CHIME’s total integration time at VT 1137-0337’s location in the reported span was hours, and depending on the exact configuration of their synthesized beams, the actual effective integration time may have been much less. In the most tightly constrained scenario, this implies that VT 1137-0337 is not much more active than FRB 121102, which had one detection by CHIME in a total integration time of 11.3 hours (Josephy et al., 2019). It remains to be seen whether there are fast timescale bursts detectable from VT 1137-0337. We have started to monitor the source for bursts and will report on our results in a future paper.
6 Summary and Conclusions
We have discovered VT 1137-0337, a luminous, flat spectrum radio transient in a dwarf starburst galaxy at redshift z = 0.02764 with mass , star formation rate yr-1, and metallicity . The transient source became detectable at radio frequencies some time between 1998 and 2018, brightening by 550% at 1.5 GHz. Between 2018 and 2022, it has faded at an average rate of 5% per year while maintaining a stable power-law spectrum from to 15 GHz (Sections 2, 3).
VT 1137-0337 is surrounded by massive young stars that have formed in the past few Myr, suggesting an association with the massive stars or their remnants. The lack of a self-absorption break in its synchrotron spectrum implies an emitting region larger than cm and causality requires an emitting region smaller than pc. Its luminosity implies a magnetic energy similar to the shocks of radio-luminous supernovae. However, its flat spectrum and slow fading is unique among known radio transients of similar luminosity and cannot be explained by diffusive shock acceleration under standard conditions (Section 4).
We considered several possible origins for this transient (Section 5), summarized by the following:
-
•
Shocks from stellar explosions such as supernovae and gamma ray bursts have not been observed to (and are generally not expected to) have a flat spectrum. In the absence of observational analogues or theoretical expectations for such transients, we consider this explanation to be unlikely.
-
•
Jets launched from black holes can have flat spectra through the continuous superposition of synchrotron self-absorbed components. However, black holes of this radio luminosity are not typically expected to reside in galaxies of this mass, and there are no optical or X-ray indications of accretion onto a black hole. More importantly, the size scale implied by self-absorption is not consistent with the slow and steady fading that we have observed from 1-10 GHz over four years. We do not believe that a black hole jet is a likely explanation, though future observations including radio monitoring will provide important tests for this argument. In particular, stochastic behavior in the radio lightcurve (in excess of expectations for scintillation) or a change in the radio spectral index would reopen the case for an AGN, while continued slow and steady fading would further strengthen our arguments against this scenario.
-
•
Pulsar wind nebulae are one of the only known source classes that are expected to have flat spectra and fade slowly. They will appear as radio transients once the surrounding supernova ejecta becomes optically thin to free-free absorption. Though VT 1137-0337 is much more luminous than pulsar wind nebulae found in the Milky Way, all of its observed properties can be explained with the spin-down of a decades old neutron star with a dipole field G and a period ms. Alternatively, VT 1137-0337 could be powered by the decay of internal magnetic fields in the core of a magnetar (possibly through discrete flares), provided that the internal field is stronger than G. We find a nebula powered by either spindown or field decay to be a reasonable explanation for VT 1137-0337.
-
•
The two known persistent radio sources associated with repeating FRBs have similar radio luminosities, spectral indices and host galaxies to VT 1137-0337. Though FRB persistent sources have not previously been observed as transients, they have been theorized to be decades old magnetar wind nebulae. If that were the case, they should have appeared as transients in the recent past. We consider these sources to be intriguing potential analogs to VT 1137-0337. This scenario can be tested by further monitoring for associated bursts.
Among the scenarios considered, we find that the most compelling explanations for VT 1137-0337 involve highly magnetized neutron stars at an age of 1 to 8 decades. In the case of a spindown-powered pulsar wind nebula, the surface dipole field is constrained by limits on the spindown luminosity and initial spindown time to be approximately G. In the case of a nebula powered by magnetar field decay, the injected power scales sharply with , which should be stronger than G in order to power to the nebula.
Our results establish a general picture for VT 1137-0337, but leave open a rich set of questions for further observational and theoretical analysis. We list a few of these questions below:
-
•
Where are the breaks in the spectrum and how do they evolve with time? Synchrotron spectra should generically turn over at a low frequency due to synchrotron self-absorption or free-free absorption, and should break at a high frequency due to synchrotron cooling. The self-absorption and cooling frequencies depend on the radius and magnetic field of the nebula, which in the case of young pulsar wind nebulae, are expected to evolve with time. Locating and tracking these breaks would provide important constraints on the evolution of the nebula and even nondetections would strengthen the limits we have provided in Section 4 (e.g., Resmi et al., 2021).
-
•
What is the origin of the flat spectrum? Much theoretical work has been done to explain the flat spectra of pulsar wind nebulae, though observational verification of these theories has proven challenging. Many of the theories are motivated by in-depth studies of the Crab Nebula made possible by multi-wavelength, spatially resolved observations. VT 1137-0337 presents an opportunity to probe a very different region of the pulsar wind nebula parameter space. In particular, theories involving electrons injected at early times (e.g., Atoyan, 1999) may be constrained by measurements of the nebula’s evolution.
-
•
Are there associated FRBs or other bursts? Neutron stars produce a wide range of potentially related bursts, including Crab giant pulses (e.g., Bera & Chengalur, 2019), X-ray bursts (e.g., Tavani et al., 2021), and fast radio bursts (e.g., Bochenek et al., 2020). Most of these burst types are associated with field-decay powered magnetars, though the line between these sources and the most strongly magnetized spindown powered pulsars is somewhat fuzzy (e.g., Gavriil et al., 2008). Since VT 1137-0337 has an inferred field in the range of strongly magnetized pulsars to full magnetars, it will be particularly interesting to monitor the source for bursts. In particular, the particles injected by bursts may be important in providing the number of relativistic particles required to produce the high radio luminosity we observe (e.g., Beloborodov, 2017).
-
•
What can VT 1137-0337 teach us about the population of young pulsar wind nebulae as a whole? In our effective survey volume (Section 2.1), there should be young neutron stars born per year, of which at least should be magnetars (e.g., Beniamini et al., 2019). Our detection of only 1 likely pulsar wind nebula in observations spanning 20 years implies that the vast majority of young neutron stars (including magnetars) either produce nebulae that are much less luminous, or do not produce nebulae at all. An even larger gap in rates is inferred for FRB persistent sources by Law et al. (2022). Understanding the selection factors that lead to luminous pulsar wind nebula will help interpret future searches for extragalactic nebulae and, if FRB persistent sources are truly magnetar wind nebulae, may help reveal why some repeating FRBs have luminous persistent sources (Chatterjee et al., 2017; Niu et al., 2021) while others do not (e.g., Kirsten et al., 2022).
We conclude with a few thoughts on the selection factors leading to radio-luminous nebulae. In both field-decay and spindown powered scenarios, we find that a flux-limited survey such as VLASS may biased towards neutron stars that are particularly strongly magnetized, though detailed verification requires population synthesis, further transient searches, and theoretical modeling beyond the scope of this paper.
In Galactic magnetars, the typical timescale of field decay is 104 years (Beniamini et al., 2019) rather than the fiducial few 102 years we considered in Section 5.3.3. These longer decay times translate to weaker internal fields , lower averages rates of energy release and, for fixed values of , lower average radio luminosities . Since for our fiducial parameters, is already close to the minimum value for VT 1137-0337 of erg s-1 when G, we may only be sensitive to the highest values of , corresponding to strong internal fields. This tracks with the lack of radio-detected magnetar wind nebulae in the Milky Way (the strongest candidate for such a nebula is a faint X-ray source not detected in the radio; Younes et al., 2016). Detailed modeling beyond our order of magnitude estimates is required to draw firm conclusions, however.
For spindown-powered pulsars, Galactic sources that can be age-dated with associated supernova remnants have initial periods and dipole fields drawn from log-normal distributions centered at 100 ms with a scatter of 0.5 dex and G with a scatter of 0.4 dex (Igoshev et al., 2022). By running a Monte Carlo simulation where we assume a volumetrically uniform distance distribution and neglect any covariance between and , we find that the median peak flux due to spindown of these neutron stars is mJy, roughly 1000 times fainter than we can detect. Due to the sharp scaling of with however, a substantial tail of the distribution ( of nebulae for or 3.5% for ) should be brighter at peak than 1 mJy and would be detectable by our search. The requirement for nebulae to still be luminous at the time of emergence from free-free absorption shrinks this tail by only a small factor due to the slow spindown from ordinary pulsar-like dipole fields (a median value of 1012.7 G in the tail). At an age of 40 years, roughly 80% in the tail will still be brighter than 1 mJy, dropping to 30% after 200 years. Altogether, the combined requirements of youth and escape from free-free absorption downselects the pulsar population by a factor of , leaving us with a further factor of to account for our detection rate.
This can be accomplished if VT 1137-0337’s unusually strong dipole field is a selected-for feature rather than a fluke. In the bright tail, only 30% of neutron stars have dipole fields stronger than 1 1013 G, roughly the minimum field strength inferred for VT 1137-0337. The fraction drops to 10% above 2 G, and to only 1% above 5 G, which is in the middle of the inferred range for spindown. Thus, if a field strength of a few 1013 G is required to produce a nebula as luminous as VT 1137-0337, that could plausibly explain our detection rate. As with magnetars, further analysis is required to draw a firm conclusion.
It is interesting to note that at a dipole field strength of 1013.5 G, the distinction between spindown powered pulsars and field-decay powered magnetars becomes blurred, with each population displaying features of the other (e.g., Gavriil et al., 2008; Kaspi &
Beloborodov, 2017). If magnetar-like flares are required to populate the radio electron population and a large energy input from spindown (or decay of an unusually strong internal field) is required to power those electrons, the highest radio luminosity tail of young pulsar wind nebulae may be populated by unusually magnetized neutron stars. Future detections of flat spectrum radio transients in surveys such as the remaining epochs of VLASS (Lacy et al., 2020), ASKAP/VAST (Murphy et al., 2021), LOTSS (Shimwell et al., 2017), or the DSA-2000 (Hallinan et al., 2019) will provide a test of this hypothesis.
Appendix A Free-free emission
Here we show that VT 1137-0337’s combination of high luminosity and human-timescale variability cannot be explained by free-free emission, as claimed in Section 4.2. Let us consider the implications of having a substantial fraction of the observed luminosity be due to free-free emission. For simplicity, we assume that the source of the free-free emission is a sphere of ionized gas with a radius , temperature , and density . We denote the frequency where the optical depth to free-free absorption equals 1 as and the thermal fraction (i.e. the fraction of the flux at due to free-free emission) as . The flux due to free-free emission at frequency can then be expressed in two ways:
| (A1) |
from the observed spectrum discussed in Section 3.2 and
| (A2) |
since at the thermal free-free emission is close to being optically thick.
From the variability timescale and observed spectrum, we have constraints on and . Taking the year span between nondetection at 1.5 GHz in FIRST and and our first follow-up epoch to be an upper limit on the rise time of the transient, we have a maximum length scale for the region responsible for the excess emission of pc. The nondetection in Epoch 1 of any spectral break between 1-12 GHz and the falling spectrum in that range (Figure 3) implies that we are observing the optically thin part of the spectrum and thus that GHz.
Combining equations A1 and A2, we have
| (A3) |
which together with the constraints on and indicates a minimum temperature of 8 fth K. If is 1, the corresponding lower bound is extreme for a region emitting radio free-free emission. Moreover, it is likely a substantial underestimate when considering the range of reasonable radii. For instance, a constant velocity blast wave of 10,000 km/s would reach cm in 20 years, and would thus require a temperature K.
We can further highlight the problem of extremes by considering the required density and energy within the emitting region. The density can be constrained from the free-free opacity (Condon & Ransom, 2016) which, for our constant density sphere of radius , is approximately
| (A4) |
| (A5) |
Again if , this density is substantially higher than then 102 cm-3 inferred for the surrounding star forming region (Section 4.1), and would thus require an unusual environment or a significant pre-explosion deposition of mass from the source of the transient. It is also likely underestimated by a similar factor to the temperature, given the similar scaling with . These issues come together when considering the thermal energy required for the radiating plasma:
| (A6) |
| (A7) |
If there is any substantial thermal fraction, the implied lower limit on the energy is orders of magnitude beyond what can be deposited by e.g. a supernova, tidal disruption event, or black hole flare. For scale, the minimum energy would require a black hole of 20% the stellar mass of the galaxy to be emitting at its Eddington luminosity for 20 years. Varying the assumptions (e.g. a nonspherical geometry, or a non constant temperature and density) does not help by much. Considering that the emission appeared within a dwarf galaxy on the timescale of 20 years, we conclude that free-free emission is not a reasonable explanation for VT 1137-0337.
Appendix B Literature transients and flat spectrum sources
Here we give the luminosities, spectral indices, and references for the points plotted in Figure 5. Due to the evolving nature of supernovae, gamma ray bursts and tidal disruption events, the luminosities for sources in those classes are approximate values, valid at some point in the evolution of the transient. We have made an effort to choose luminosities at late times where the transient is optically thin at 3 GHz. Where possible, we use spectral indices that are directly fit from standard peaked SED models. For spectral indices derived from measurements in two bands, we use values from late epochs after the peak has dropped to frequencies below the two bands and the spectral index has converged to its optically thin value.
Fast radio burst persistent sources:
-
•
PRS/FRB 121102: From a fit of the the 1 - 10 GHz observations in Chatterjee et al. (2017), we estimate a low frequency spectral index of . There is evidence of a break at 10 GHz, with a spectral index of toward higher frequencies. The 3 GHz luminosity is = 2.3 1029 erg s-1 Hz-1 at the redshift reported in Tendulkar et al. (2017).
-
•
PRS/FRB 190520B: The spectral index and luminosity come from the values reported in Niu et al. (2021): 0.41 0.04 and = 3 1029 erg s-1 Hz-1.
Gamma ray bursts:
-
•
GRB 030329: Our plotted spectral index comes from the report in van der Horst et al. (2007) that , though we note that Figure 1 of Granot & van der Horst (2014) suggests a value closer to . This GRB has many observations over a span of years. In the figure, we plot a value of erg s-1 Hz-1 in between the 4.8 and 2.3 GHz temporal peaks.
-
•
GW 170817: The spectral index comes from the fit in Mooley et al. (2018), and the luminosity ( erg s-1 Hz-1) comes from their brightest reported 3 GHz data point.
-
•
GRB 980703: We estimate a spectral index of from the late-time data points plotted in Fig 1 of Granot & van der Horst (2014). The 5 GHz luminosity at the point where the spectral index plateaus is roughly 4 1029 erg s Hz-1.
Radio supernovae:
-
•
SN 1978K: The spectral index and luminosity erg s-1 Hz-1 are from the 1992.5 epoch in Table 5 of Ryder et al. (1993).
-
•
SN 1979C: The spectral index and luminosity erg s-1 Hz-1 are from Table 3 of Weiler et al. (1991).
-
•
SN 1983N: The plotted optically thin spectral index and luminosity erg s Hz-1 are from Table 8 of Weiler et al. (1986).
-
•
SN 1984L: The spectral index and luminosity erg s-1 Hz-1 are from the Nov 30. 1984 epoch reported in Panagia et al. (1986).
-
•
SN 1986J: The spectral index is from the report in Weiler et al. (1990) that from 6 to 2 cm and the luminosity erg s-1 Hz-1 is from Table 5.
-
•
SN 1987A: The plotted spectral index is from the report in Manchester et al. (2002) that the spectral index has changed from 0.97 to 0.88 and the luminosity erg s Hz-1 is estimated from their Figure 1.
-
•
SN 1988Z: The spectral index and luminosity erg s Hz-1 are from Tables 1 and 2 of van Dyk et al. (1993b).
-
•
SN 1990B: The spectral index and luminosity erg s-1 Hz-1 are from the Apr 26, 1990 epoch reported in van Dyk et al. (1993a).
-
•
SN 1993J: The spectral index is from Table 1 of van Dyk et al. (1994) and the luminosity erg s Hz-1 is estimated from their Figure 1.
-
•
SN 1998bw: The plotted spectral index 0.7 and luminosity erg s Hz-1 come from observations presented in Li & Chevalier (1999) at a late epoch where the radio SED is optically thin.
-
•
SN 2009bb: The spectral index and luminosity come from Soderberg et al. (2010), who report and mJy on day 52, corresponding to 3 1028 erg s-1 Hz-1.
-
•
PTF 11qcj: The spectral index () and luminosity ( erg s-1 Hz-1) come from the most recent broadband radio spectrum (at day 1887) reported in Palliyaguru et al. (2019).
-
•
VT 1210+4956: The spectral index and 3 GHz luminosity 1.3 1029 erg s Hz-1 come from the May 30, 2018 followup epoch in Dong et al. (2021).
Tidal disruption events:
-
•
Sw J1644+57: We use the report in Eftekhari et al. (2018) that on day 651, the 3.4 GHz flux was 8.78 mJy, corresponding to erg s Hz-1. The optically thin slope at this epoch is consistent with , corresponding to .
-
•
IGR 12580+0134: We use the combined jet model from Perlman et al. (2017), which predicts , corresponding to . Extrapolating from their 5GHz flux using this spectral index gives a 3 GHz flux of 46 mJy in the 2015 Oct 8 epoch, corresponding to 1.6 1028 erg s Hz-1.
- •
-
•
Arp 299-B AT1: We use the spectral model from Mattila et al. (2018). Their modeling (Table S8) indicates that p = 3.0 for the jet, corresponding to . From their Table S4, we adopt 3mJy as a representative flux at 3GHz, corresponding to erg s Hz-1.
-
•
CNSS J0019+00: Spectral fitting in Anderson et al. (2020) indicates that during the 2015 Oct 15 epoch, the 2.9 GHz flux was 7.25 mJy, corresponding to erg s Hz-1 and the optically thin spectral index was .
-
•
ASASSN 14li: From modeling in Alexander et al. (2016), the transient component in the 2015 June epoch was mJy, corresponding to erg s Hz-1 and the spectral index was .
-
•
XMMSL1 J0740-85: From Alexander et al. (2017), the 2.7 GHz emission was 0.87 mJy at peak, corresponding to erg s Hz-1. They find a best fit spectral index of .
-
•
VT J1548+2208: Somalwar et al. (2021) observe a 3 GHz flux of mJy, corresponding to erg s Hz-1. We use the spectral index of the high frequency component: .
-
•
FIRST J1533+2727: This TDE was discovered at a late time where the spectrum is optically thin at all observed frequencies. From Table 1 in Ravi et al. (2021), we calculate a spectral index of . At this late time, the 3 GHz luminosity is erg s Hz-1.
Pulsar wind nebulae:
The spectral indices and luminosities of plotted PWNe are from the Green (2019) pulsar wind nebula and supernova remnant catalog. We selected every source classified as a PWN with a measured distance, flux, and spectral index. They are: the Crab Nebula, 3C58, Vela X, G284.3-1.8, G292.2-0.5, G292.0+1.8, G308.8-0.1, G320.4-1.2, G341.2+0.9, G343.1-2.3, G5.4-1.2, G11.2-0.3, G21.5-0.9, G29.7-0.3, G34.7-0.4, G54.1+0.3, and G69.0+2.7.
References
- Aguado et al. (2019) Aguado, D. S., Ahumada, R., Almeida, A., et al. 2019, ApJS, 240, 23, doi: 10.3847/1538-4365/aaf651
- Alexander et al. (2016) Alexander, K. D., Berger, E., Guillochon, J., Zauderer, B. A., & Williams, P. K. G. 2016, ApJ, 819, L25, doi: 10.3847/2041-8205/819/2/L25
- Alexander et al. (2017) Alexander, K. D., Wieringa, M. H., Berger, E., Saxton, R. D., & Komossa, S. 2017, ApJ, 837, 153, doi: 10.3847/1538-4357/aa6192
- Aller & Reynolds (1985) Aller, H. D., & Reynolds, S. P. 1985, ApJ, 293, L73, doi: 10.1086/184494
- Anderson et al. (2020) Anderson, M. M., Mooley, K. P., Hallinan, G., et al. 2020, ApJ, 903, 116, doi: 10.3847/1538-4357/abb94b
- Asada & Nakamura (2012) Asada, K., & Nakamura, M. 2012, ApJ, 745, L28, doi: 10.1088/2041-8205/745/2/L28
- Asplund et al. (2009) Asplund, M., Grevesse, N., Sauval, A. J., & Scott, P. 2009, ARA&A, 47, 481, doi: 10.1146/annurev.astro.46.060407.145222
- Astropy Collaboration et al. (2013) Astropy Collaboration, Robitaille, T. P., Tollerud, E. J., et al. 2013, A&A, 558, A33, doi: 10.1051/0004-6361/201322068
- Astropy Collaboration et al. (2018) Astropy Collaboration, Price-Whelan, A. M., Sipőcz, B. M., et al. 2018, AJ, 156, 123, doi: 10.3847/1538-3881/aabc4f
- Atoyan (1999) Atoyan, A. M. 1999, A&A, 346, L49. https://arxiv.org/abs/astro-ph/9905204
- Atoyan & Aharonian (1996) Atoyan, A. M., & Aharonian, F. A. 1996, MNRAS, 278, 525, doi: 10.1093/mnras/278.2.525
- Baars et al. (1977) Baars, J. W. M., Genzel, R., Pauliny-Toth, I. I. K., & Witzel, A. 1977, A&A, 500, 135
- Baldwin et al. (1981) Baldwin, J. A., Phillips, M. M., & Terlevich, R. 1981, PASP, 93, 5, doi: 10.1086/130766
- Barbarino et al. (2020) Barbarino, C., Sollerman, J., Taddia, F., et al. 2020, arXiv e-prints, arXiv:2010.08392. https://arxiv.org/abs/2010.08392
- Bassa et al. (2017) Bassa, C. G., Tendulkar, S. P., Adams, E. A. K., et al. 2017, ApJ, 843, L8, doi: 10.3847/2041-8213/aa7a0c
- Becker et al. (1995) Becker, R. H., White, R. L., & Helfand, D. J. 1995, ApJ, 450, 559, doi: 10.1086/176166
- Bellovary et al. (2019) Bellovary, J. M., Cleary, C. E., Munshi, F., et al. 2019, MNRAS, 482, 2913, doi: 10.1093/mnras/sty2842
- Beloborodov (2017) Beloborodov, A. M. 2017, ApJ, 843, L26, doi: 10.3847/2041-8213/aa78f3
- Beloborodov & Li (2016) Beloborodov, A. M., & Li, X. 2016, ApJ, 833, 261, doi: 10.3847/1538-4357/833/2/261
- Beniamini et al. (2019) Beniamini, P., Hotokezaka, K., van der Horst, A., & Kouveliotou, C. 2019, MNRAS, 487, 1426, doi: 10.1093/mnras/stz1391
- Bennett et al. (2014) Bennett, C. L., Larson, D., Weiland, J. L., & Hinshaw, G. 2014, ApJ, 794, 135, doi: 10.1088/0004-637X/794/2/135
- Bera & Chengalur (2019) Bera, A., & Chengalur, J. N. 2019, MNRAS, 490, L12, doi: 10.1093/mnrasl/slz140
- Bietenholz et al. (2021) Bietenholz, M. F., Bartel, N., Argo, M., et al. 2021, ApJ, 908, 75, doi: 10.3847/1538-4357/abccd9
- Bietenholz et al. (2001) Bietenholz, M. F., Frail, D. A., & Hester, J. J. 2001, ApJ, 560, 254, doi: 10.1086/322244
- Blandford & Eichler (1987) Blandford, R., & Eichler, D. 1987, Phys. Rep., 154, 1, doi: 10.1016/0370-1573(87)90134-7
- Blandford & Königl (1979) Blandford, R. D., & Königl, A. 1979, ApJ, 232, 34, doi: 10.1086/157262
- Blandford & Znajek (1977) Blandford, R. D., & Znajek, R. L. 1977, MNRAS, 179, 433, doi: 10.1093/mnras/179.3.433
- Bochenek et al. (2020) Bochenek, C. D., Ravi, V., Belov, K. V., et al. 2020, Nature, 587, 59, doi: 10.1038/s41586-020-2872-x
- Bradley et al. (2006) Bradley, T. R., Knapen, J. H., Beckman, J. E., & Folkes, S. L. 2006, A&A, 459, L13, doi: 10.1051/0004-6361:20066151
- Burbidge & Burbidge (1957) Burbidge, G. R., & Burbidge, E. M. 1957, ApJ, 125, 1, doi: 10.1086/146279
- Calzetti et al. (2000) Calzetti, D., Armus, L., Bohlin, R. C., et al. 2000, ApJ, 533, 682, doi: 10.1086/308692
- Cann et al. (2019) Cann, J. M., Satyapal, S., Abel, N. P., et al. 2019, ApJ, 870, L2, doi: 10.3847/2041-8213/aaf88d
- Cavagnolo et al. (2010) Cavagnolo, K. W., McNamara, B. R., Nulsen, P. E. J., et al. 2010, ApJ, 720, 1066, doi: 10.1088/0004-637X/720/2/1066
- Cendes et al. (2021) Cendes, Y., Alexander, K. D., Berger, E., et al. 2021, ApJ, 919, 127, doi: 10.3847/1538-4357/ac110a
- Chatterjee et al. (2017) Chatterjee, S., Law, C. J., Wharton, R. S., et al. 2017, Nature, 541, 58, doi: 10.1038/nature20797
- Chen et al. (2022) Chen, G., Ravi, V., & Hallinan, G. W. 2022, arXiv e-prints, arXiv:2201.00999. https://arxiv.org/abs/2201.00999
- Chevalier (1998) Chevalier, R. A. 1998, ApJ, 499, 810, doi: 10.1086/305676
- Chevalier (2004) —. 2004, Advances in Space Research, 33, 456, doi: 10.1016/j.asr.2003.04.018
- Chevalier (2012) —. 2012, ApJ, 752, L2, doi: 10.1088/2041-8205/752/1/L2
- Chevalier & Fransson (1992) Chevalier, R. A., & Fransson, C. 1992, ApJ, 395, 540, doi: 10.1086/171674
- CHIME/FRB Collaboration et al. (2020) CHIME/FRB Collaboration, Andersen, B. C., Bandura, K. M., et al. 2020, Nature, 587, 54, doi: 10.1038/s41586-020-2863-y
- Comisso et al. (2020) Comisso, L., Sobacchi, E., & Sironi, L. 2020, ApJ, 895, L40, doi: 10.3847/2041-8213/ab93dc
- Condon et al. (1998) Condon, J. J., Cotton, W. D., Greisen, E. W., et al. 1998, AJ, 115, 1693, doi: 10.1086/300337
- Condon & Ransom (2016) Condon, J. J., & Ransom, S. M. 2016, Essential Radio Astronomy (Princeton University Press)
- Cook et al. (2019) Cook, D. O., Kasliwal, M. M., Van Sistine, A., et al. 2019, ApJ, 880, 7, doi: 10.3847/1538-4357/ab2131
- Corbel et al. (2012) Corbel, S., Dubus, G., Tomsick, J. A., et al. 2012, MNRAS, 421, 2947, doi: 10.1111/j.1365-2966.2012.20517.x
- Cordes & Lazio (2002) Cordes, J. M., & Lazio, T. J. W. 2002, arXiv e-prints, astro. https://arxiv.org/abs/astro-ph/0207156
- Cordes et al. (2021) Cordes, J. M., Wasserman, I., Chatterjee, S., & Batra, G. 2021, arXiv e-prints, arXiv:2107.12874. https://arxiv.org/abs/2107.12874
- Davis et al. (2020) Davis, T. A., Nguyen, D. D., Seth, A. C., et al. 2020, MNRAS, 496, 4061, doi: 10.1093/mnras/staa1567
- Domínguez et al. (2013) Domínguez, A., Siana, B., Henry, A. L., et al. 2013, ApJ, 763, 145, doi: 10.1088/0004-637X/763/2/145
- Dong et al. (2021) Dong, D. Z., Hallinan, G., Nakar, E., et al. 2021, Science, 373, 1125, doi: 10.1126/science.abg6037
- Dopita et al. (2000) Dopita, M. A., Kewley, L. J., Heisler, C. A., & Sutherland, R. S. 2000, ApJ, 542, 224, doi: 10.1086/309538
- Draine (2011) Draine, B. T. 2011, Physics of the Interstellar and Intergalactic Medium (Princeton University Press)
- Eftekhari et al. (2018) Eftekhari, T., Berger, E., Zauderer, B. A., Margutti, R., & Alexander, K. D. 2018, ApJ, 854, 86, doi: 10.3847/1538-4357/aaa8e0
- Egron et al. (2021) Egron, E., Pellizzoni, A., Righini, S., et al. 2021, ApJ, 906, 10, doi: 10.3847/1538-4357/abc5b1
- Fender et al. (2004) Fender, R. P., Belloni, T. M., & Gallo, E. 2004, MNRAS, 355, 1105, doi: 10.1111/j.1365-2966.2004.08384.x
- Fender et al. (2000) Fender, R. P., Pooley, G. G., Durouchoux, P., Tilanus, R. P. J., & Brocksopp, C. 2000, MNRAS, 312, 853, doi: 10.1046/j.1365-8711.2000.03219.x
- Fleishman (2006) Fleishman, G. D. 2006, ApJ, 638, 348, doi: 10.1086/498732
- Fleishman & Bietenholz (2007) Fleishman, G. D., & Bietenholz, M. F. 2007, MNRAS, 376, 625, doi: 10.1111/j.1365-2966.2007.11450.x
- Foreman-Mackey et al. (2013) Foreman-Mackey, D., Hogg, D. W., Lang, D., & Goodman, J. 2013, PASP, 125, 306, doi: 10.1086/670067
- Frail & Scharringhausen (1997) Frail, D. A., & Scharringhausen, B. R. 1997, ApJ, 480, 364, doi: 10.1086/303943
- Gaensler & Slane (2006) Gaensler, B. M., & Slane, P. O. 2006, ARA&A, 44, 17, doi: 10.1146/annurev.astro.44.051905.092528
- Gaensler et al. (2000) Gaensler, B. M., Stappers, B. W., Frail, D. A., et al. 2000, MNRAS, 318, 58, doi: 10.1046/j.1365-8711.2000.03626.x
- Gal-Yam (2019) Gal-Yam, A. 2019, ARA&A, 57, 305, doi: 10.1146/annurev-astro-081817-051819
- Gavriil et al. (2008) Gavriil, F. P., Gonzalez, M. E., Gotthelf, E. V., et al. 2008, Science, 319, 1802, doi: 10.1126/science.1153465
- Gehrels (1986) Gehrels, N. 1986, ApJ, 303, 336, doi: 10.1086/164079
- Goldreich & Julian (1969) Goldreich, P., & Julian, W. H. 1969, ApJ, 157, 869, doi: 10.1086/150119
- Graham & Schady (2016) Graham, J. F., & Schady, P. 2016, ApJ, 823, 154, doi: 10.3847/0004-637X/823/2/154
- Granot & van der Horst (2014) Granot, J., & van der Horst, A. J. 2014, PASA, 31, e008, doi: 10.1017/pasa.2013.44
- Green (2019) Green, D. A. 2019, Journal of Astrophysics and Astronomy, 40, 36, doi: 10.1007/s12036-019-9601-6
- Greene et al. (2020) Greene, J. E., Strader, J., & Ho, L. C. 2020, ARA&A, 58, 257, doi: 10.1146/annurev-astro-032620-021835
- Guillochon et al. (2017) Guillochon, J., Parrent, J., Kelley, L. Z., & Margutti, R. 2017, ApJ, 835, 64, doi: 10.3847/1538-4357/835/1/64
- Hallinan et al. (2019) Hallinan, G., Ravi, V., Weinreb, S., et al. 2019, in Bulletin of the American Astronomical Society, Vol. 51, 255. https://arxiv.org/abs/1907.07648
- Harris et al. (2020) Harris, C. R., Millman, K. J., van der Walt, S. J., et al. 2020, Nature, 585, 357, doi: 10.1038/s41586-020-2649-2
- Hicken et al. (2017) Hicken, M., Friedman, A. S., Blondin, S., et al. 2017, ApJS, 233, 6, doi: 10.3847/1538-4365/aa8ef4
- Hjellming & Johnston (1988) Hjellming, R. M., & Johnston, K. J. 1988, ApJ, 328, 600, doi: 10.1086/166318
- Ho et al. (2019) Ho, A. Y. Q., Phinney, E. S., Ravi, V., et al. 2019, ApJ, 871, 73, doi: 10.3847/1538-4357/aaf473
- Ho et al. (2020) Ho, A. Y. Q., Perley, D. A., Kulkarni, S. R., et al. 2020, ApJ, 895, 49, doi: 10.3847/1538-4357/ab8bcf
- Igoshev et al. (2022) Igoshev, A. P., Frantsuzova, A., Gourgouliatos, K. N., et al. 2022, arXiv e-prints, arXiv:2205.06823. https://arxiv.org/abs/2205.06823
- Izotov et al. (2006) Izotov, Y. I., Stasińska, G., Meynet, G., Guseva, N. G., & Thuan, T. X. 2006, A&A, 448, 955, doi: 10.1051/0004-6361:20053763
- Jones et al. (2001) Jones, E., Oliphant, T., Peterson, P., et al. 2001, SciPy: Open source scientific tools for Python. http://www.scipy.org/
- Jones & Ellison (1991) Jones, F. C., & Ellison, D. C. 1991, Space Sci. Rev., 58, 259, doi: 10.1007/BF01206003
- Josephy et al. (2019) Josephy, A., Chawla, P., Fonseca, E., et al. 2019, ApJ, 882, L18, doi: 10.3847/2041-8213/ab2c00
- Kagan et al. (2018) Kagan, D., Nakar, E., & Piran, T. 2018, MNRAS, 476, 3902, doi: 10.1093/mnras/sty452
- Kasen & Bildsten (2010) Kasen, D., & Bildsten, L. 2010, ApJ, 717, 245, doi: 10.1088/0004-637X/717/1/245
- Kaspi & Beloborodov (2017) Kaspi, V. M., & Beloborodov, A. M. 2017, ARA&A, 55, 261, doi: 10.1146/annurev-astro-081915-023329
- Kaspi et al. (2006) Kaspi, V. M., Roberts, M. S. E., & Harding, A. K. 2006, Isolated neutron stars, Vol. 39, 279–339
- Kellermann & Pauliny-Toth (1981) Kellermann, K. I., & Pauliny-Toth, I. I. K. 1981, ARA&A, 19, 373, doi: 10.1146/annurev.aa.19.090181.002105
- Kennicutt & Evans (2012) Kennicutt, R. C., & Evans, N. J. 2012, ARA&A, 50, 531, doi: 10.1146/annurev-astro-081811-125610
- Kewley et al. (2013) Kewley, L. J., Dopita, M. A., Leitherer, C., et al. 2013, ApJ, 774, 100, doi: 10.1088/0004-637X/774/2/100
- Kewley et al. (2001) Kewley, L. J., Dopita, M. A., Sutherland, R. S., Heisler, C. A., & Trevena, J. 2001, ApJ, 556, 121, doi: 10.1086/321545
- Kewley & Ellison (2008) Kewley, L. J., & Ellison, S. L. 2008, ApJ, 681, 1183, doi: 10.1086/587500
- Kewley et al. (2019) Kewley, L. J., Nicholls, D. C., Sutherland, R., et al. 2019, ApJ, 880, 16, doi: 10.3847/1538-4357/ab16ed
- Kirsten et al. (2022) Kirsten, F., Marcote, B., Nimmo, K., et al. 2022, Nature, 602, 585, doi: 10.1038/s41586-021-04354-w
- Kochanek et al. (2017) Kochanek, C. S., Shappee, B. J., Stanek, K. Z., et al. 2017, PASP, 129, 104502, doi: 10.1088/1538-3873/aa80d9
- Kolmogorov (1941) Kolmogorov, A. 1941, Akademiia Nauk SSSR Doklady, 30, 301
- Kormendy & Kennicutt (2004) Kormendy, J., & Kennicutt, Robert C., J. 2004, ARA&A, 42, 603, doi: 10.1146/annurev.astro.42.053102.134024
- Kou & Tong (2015) Kou, F. F., & Tong, H. 2015, MNRAS, 450, 1990, doi: 10.1093/mnras/stv734
- Kulkarni et al. (2018) Kulkarni, S. R., Perley, D. A., & Miller, A. A. 2018, ApJ, 860, 22, doi: 10.3847/1538-4357/aabf85
- Lacy et al. (2020) Lacy, M., Baum, S. A., Chandler, C. J., et al. 2020, PASP, 132, 035001, doi: 10.1088/1538-3873/ab63eb
- Law et al. (2022) Law, C. J., Connor, L., & Aggarwal, K. 2022, ApJ, 927, 55, doi: 10.3847/1538-4357/ac4c42
- Law et al. (2018) Law, C. J., Gaensler, B. M., Metzger, B. D., Ofek, E. O., & Sironi, L. 2018, ApJ, 866, L22, doi: 10.3847/2041-8213/aae5f3
- Leitherer et al. (1999) Leitherer, C., Schaerer, D., Goldader, J. D., et al. 1999, ApJS, 123, 3, doi: 10.1086/313233
- Li & Chevalier (1999) Li, Z.-Y., & Chevalier, R. A. 1999, ApJ, 526, 716, doi: 10.1086/308031
- Lien et al. (2016) Lien, A., Sakamoto, T., Barthelmy, S. D., et al. 2016, ApJ, 829, 7, doi: 10.3847/0004-637X/829/1/7
- Linden et al. (2020) Linden, S. T., Murphy, E. J., Dong, D., et al. 2020, ApJS, 248, 25, doi: 10.3847/1538-4365/ab8a4d
- Liodakis et al. (2017) Liodakis, I., Pavlidou, V., Hovatta, T., et al. 2017, MNRAS, 467, 4565, doi: 10.1093/mnras/stx432
- Lister (2001) Lister, M. L. 2001, ApJ, 561, 676, doi: 10.1086/323528
- Lyne et al. (1993) Lyne, A. G., Pritchard, R. S., & Graham Smith, F. 1993, MNRAS, 265, 1003, doi: 10.1093/mnras/265.4.1003
- Lyutikov et al. (2019) Lyutikov, M., Temim, T., Komissarov, S., et al. 2019, MNRAS, 489, 2403, doi: 10.1093/mnras/stz2023
- Macías-Pérez et al. (2010) Macías-Pérez, J. F., Mayet, F., Aumont, J., & Désert, F. X. 2010, ApJ, 711, 417, doi: 10.1088/0004-637X/711/1/417
- Manchester et al. (2002) Manchester, R. N., Gaensler, B. M., Wheaton, V. C., et al. 2002, PASA, 19, 207, doi: 10.1071/AS01042
- Manchester et al. (2005) Manchester, R. N., Hobbs, G. B., Teoh, A., & Hobbs, M. 2005, AJ, 129, 1993, doi: 10.1086/428488
- Margalit & Metzger (2018) Margalit, B., & Metzger, B. D. 2018, ApJ, 868, L4, doi: 10.3847/2041-8213/aaedad
- Martinez et al. (2022) Martinez, L., Bersten, M. C., Anderson, J. P., et al. 2022, A&A, 660, A41, doi: 10.1051/0004-6361/202142076
- Mattila et al. (2018) Mattila, S., Pérez-Torres, M., Efstathiou, A., et al. 2018, Science, 361, 482, doi: 10.1126/science.aao4669
- McMullin et al. (2007) McMullin, J. P., Waters, B., Schiebel, D., Young, W., & Golap, K. 2007, Astronomical Society of the Pacific Conference Series, Vol. 376, CASA Architecture and Applications, ed. R. A. Shaw, F. Hill, & D. J. Bell, 127
- Meier (2001) Meier, D. L. 2001, ApJ, 548, L9, doi: 10.1086/318921
- Metzger et al. (2017) Metzger, B. D., Berger, E., & Margalit, B. 2017, ApJ, 841, 14, doi: 10.3847/1538-4357/aa633d
- Metzger et al. (2015) Metzger, B. D., Williams, P. K. G., & Berger, E. 2015, ApJ, 806, 224, doi: 10.1088/0004-637X/806/2/224
- Mohan & Rafferty (2015) Mohan, N., & Rafferty, D. 2015, PyBDSF: Python Blob Detection and Source Finder, Astrophysics Source Code Library. http://ascl.net/1502.007
- Molina et al. (2021a) Molina, M., Reines, A. E., Greene, J. E., Darling, J., & Condon, J. J. 2021a, ApJ, 910, 5, doi: 10.3847/1538-4357/abe120
- Molina et al. (2021b) Molina, M., Reines, A. E., Latimer, C. J., Baldassare, V., & Salehirad, S. 2021b, ApJ, 922, 155, doi: 10.3847/1538-4357/ac1ffa
- Mooley et al. (2019) Mooley, K. P., Myers, S. T., Frail, D. A., et al. 2019, ApJ, 870, 25, doi: 10.3847/1538-4357/aaef7c
- Mooley et al. (2018) Mooley, K. P., Nakar, E., Hotokezaka, K., et al. 2018, Nature, 554, 207, doi: 10.1038/nature25452
- Moustakas et al. (2010) Moustakas, J., Kennicutt, Robert C., J., Tremonti, C. A., et al. 2010, ApJS, 190, 233, doi: 10.1088/0067-0049/190/2/233
- Murase et al. (2016) Murase, K., Kashiyama, K., & Mészáros, P. 2016, MNRAS, 461, 1498, doi: 10.1093/mnras/stw1328
- Murphy et al. (2011) Murphy, E. J., Condon, J. J., Schinnerer, E., et al. 2011, ApJ, 737, 67, doi: 10.1088/0004-637X/737/2/67
- Murphy et al. (2021) Murphy, T., Kaplan, D. L., Stewart, A. J., et al. 2021, PASA, 38, e054, doi: 10.1017/pasa.2021.44
- Nicholl et al. (2015) Nicholl, M., Smartt, S. J., Jerkstrand, A., et al. 2015, MNRAS, 452, 3869, doi: 10.1093/mnras/stv1522
- Niu et al. (2021) Niu, C. H., Aggarwal, K., Li, D., et al. 2021, arXiv e-prints, arXiv:2110.07418. https://arxiv.org/abs/2110.07418
- Nyland et al. (2017) Nyland, K., Davis, T. A., Nguyen, D. D., et al. 2017, ApJ, 845, 50, doi: 10.3847/1538-4357/aa7ecf
- Nyland et al. (2020) Nyland, K., Dong, D. Z., Patil, P., et al. 2020, ApJ, 905, 74, doi: 10.3847/1538-4357/abc341
- Ofek (2017) Ofek, E. O. 2017, ApJ, 846, 44, doi: 10.3847/1538-4357/aa8310
- Oke et al. (1995) Oke, J. B., Cohen, J. G., Carr, M., et al. 1995, PASP, 107, 375, doi: 10.1086/133562
- Osterbrock & Ferland (2006) Osterbrock, D. E., & Ferland, G. J. 2006, Astrophysics of gaseous nebulae and active galactic nuclei (University Science Books)
- Palliyaguru et al. (2019) Palliyaguru, N. T., Corsi, A., Frail, D. A., et al. 2019, ApJ, 872, 201, doi: 10.3847/1538-4357/aaf64d
- Panagia et al. (1986) Panagia, N., Sramek, R. A., & Weiler, K. W. 1986, ApJ, 300, L55, doi: 10.1086/184602
- Pelletier et al. (2017) Pelletier, G., Bykov, A., Ellison, D., & Lemoine, M. 2017, Space Sci. Rev., 207, 319, doi: 10.1007/s11214-017-0364-6
- Pérez-González et al. (2003) Pérez-González, P. G., Zamorano, J., Gallego, J., Aragón-Salamanca, A., & Gil de Paz, A. 2003, ApJ, 591, 827, doi: 10.1086/375364
- Perley (2019) Perley, D. A. 2019, PASP, 131, 084503, doi: 10.1088/1538-3873/ab215d
- Perley & Butler (2017) Perley, R. A., & Butler, B. J. 2017, ApJS, 230, 7, doi: 10.3847/1538-4365/aa6df9
- Perley et al. (2011) Perley, R. A., Chandler, C. J., Butler, B. J., & Wrobel, J. M. 2011, ApJ, 739, L1, doi: 10.1088/2041-8205/739/1/L1
- Perlman et al. (2017) Perlman, E. S., Meyer, E. T., Wang, Q. D., et al. 2017, ApJ, 842, 126, doi: 10.3847/1538-4357/aa71b1
- Phinney (1989) Phinney, E. S. 1989, in The Center of the Galaxy, ed. M. Morris, Vol. 136, 543
- Pietka et al. (2015) Pietka, M., Fender, R. P., & Keane, E. F. 2015, MNRAS, 446, 3687, doi: 10.1093/mnras/stu2335
- Plavin et al. (2019) Plavin, A. V., Kovalev, Y. Y., Pushkarev, A. B., & Lobanov, A. P. 2019, MNRAS, 485, 1822, doi: 10.1093/mnras/stz504
- Rau et al. (2005) Rau, A., Kienlin, A. V., Hurley, K., & Lichti, G. G. 2005, A&A, 438, 1175, doi: 10.1051/0004-6361:20053159
- Ravi et al. (2021) Ravi, V., Dykaar, H., Codd, J., et al. 2021, arXiv e-prints, arXiv:2102.05795. https://arxiv.org/abs/2102.05795
- Raynaud et al. (2020) Raynaud, R., Guilet, J., Janka, H.-T., & Gastine, T. 2020, Science Advances, 6, eaay2732, doi: 10.1126/sciadv.aay2732
- Reines et al. (2020) Reines, A. E., Condon, J. J., Darling, J., & Greene, J. E. 2020, ApJ, 888, 36, doi: 10.3847/1538-4357/ab4999
- Reines & Volonteri (2015) Reines, A. E., & Volonteri, M. 2015, ApJ, 813, 82, doi: 10.1088/0004-637X/813/2/82
- Resmi et al. (2021) Resmi, L., Vink, J., & Ishwara-Chandra, C. H. 2021, A&A, 655, A102, doi: 10.1051/0004-6361/202039771
- Reynolds et al. (2018) Reynolds, S. P., Borkowski, K. J., & Gwynne, P. H. 2018, ApJ, 856, 133, doi: 10.3847/1538-4357/aab3d3
- Reynolds & Chevalier (1984) Reynolds, S. P., & Chevalier, R. A. 1984, ApJ, 278, 630, doi: 10.1086/161831
- Richardson et al. (2016) Richardson, C. T., Allen, J. T., Baldwin, J. A., et al. 2016, MNRAS, 458, 988, doi: 10.1093/mnras/stw100
- Robitaille & Bressert (2012) Robitaille, T., & Bressert, E. 2012, APLpy: Astronomical Plotting Library in Python, Astrophysics Source Code Library, record ascl:1208.017. http://ascl.net/1208.017
- Ryder et al. (1993) Ryder, S., Staveley-Smith, L., Dopita, M., et al. 1993, ApJ, 416, 167, doi: 10.1086/173223
- Saikia et al. (2019) Saikia, P., Russell, D. M., Bramich, D. M., et al. 2019, ApJ, 887, 21, doi: 10.3847/1538-4357/ab4a09
- Salim et al. (2018) Salim, S., Boquien, M., & Lee, J. C. 2018, ApJ, 859, 11, doi: 10.3847/1538-4357/aabf3c
- Salpeter (1955) Salpeter, E. E. 1955, ApJ, 121, 161, doi: 10.1086/145971
- Schlickeiser & Fuerst (1989) Schlickeiser, R., & Fuerst, E. 1989, A&A, 219, 192
- Schwab (1984) Schwab, F. R. 1984, AJ, 89, 1076, doi: 10.1086/113605
- Scott & Readhead (1977) Scott, M. A., & Readhead, A. C. S. 1977, MNRAS, 180, 539, doi: 10.1093/mnras/180.4.539
- Serino et al. (2014) Serino, M., Sakamoto, T., Kawai, N., et al. 2014, PASJ, 66, 87, doi: 10.1093/pasj/psu063
- Shappee et al. (2014) Shappee, B. J., Prieto, J. L., Grupe, D., et al. 2014, ApJ, 788, 48, doi: 10.1088/0004-637X/788/1/48
- Shimwell et al. (2017) Shimwell, T. W., Röttgering, H. J. A., Best, P. N., et al. 2017, A&A, 598, A104, doi: 10.1051/0004-6361/201629313
- Sironi & Spitkovsky (2011) Sironi, L., & Spitkovsky, A. 2011, ApJ, 741, 39, doi: 10.1088/0004-637X/741/1/39
- Sądowski & Narayan (2016) Sądowski, A., & Narayan, R. 2016, MNRAS, 456, 3929, doi: 10.1093/mnras/stv2941
- Smith (2014) Smith, N. 2014, ARA&A, 52, 487, doi: 10.1146/annurev-astro-081913-040025
- Soderberg et al. (2006) Soderberg, A. M., Kulkarni, S. R., Nakar, E., et al. 2006, Nature, 442, 1014, doi: 10.1038/nature05087
- Soderberg et al. (2010) Soderberg, A. M., Chakraborti, S., Pignata, G., et al. 2010, Nature, 463, 513, doi: 10.1038/nature08714
- Somalwar et al. (2021) Somalwar, J. J., Ravi, V., Dong, D., et al. 2021, arXiv e-prints, arXiv:2108.12431. https://arxiv.org/abs/2108.12431
- Sridhar & Metzger (2022) Sridhar, N., & Metzger, B. D. 2022, arXiv e-prints, arXiv:2206.10486. https://arxiv.org/abs/2206.10486
- Stein et al. (2021) Stein, R., Velzen, S. v., Kowalski, M., et al. 2021, Nature Astronomy, 5, 510, doi: 10.1038/s41550-020-01295-8
- Sutton et al. (2013) Sutton, A. D., Roberts, T. P., & Middleton, M. J. 2013, MNRAS, 435, 1758, doi: 10.1093/mnras/stt1419
- Taddia et al. (2013) Taddia, F., Stritzinger, M. D., Sollerman, J., et al. 2013, A&A, 555, A10, doi: 10.1051/0004-6361/201321180
- Taddia et al. (2015) Taddia, F., Sollerman, J., Leloudas, G., et al. 2015, A&A, 574, A60, doi: 10.1051/0004-6361/201423915
- Taddia et al. (2018) Taddia, F., Stritzinger, M. D., Bersten, M., et al. 2018, A&A, 609, A136, doi: 10.1051/0004-6361/201730844
- Taggart & Perley (2019) Taggart, K., & Perley, D. 2019, arXiv e-prints, arXiv:1911.09112. https://arxiv.org/abs/1911.09112
- Tanaka & Asano (2017) Tanaka, S. J., & Asano, K. 2017, ApJ, 841, 78, doi: 10.3847/1538-4357/aa6f13
- Tavani et al. (2021) Tavani, M., Casentini, C., Ursi, A., et al. 2021, Nature Astronomy, 5, 401, doi: 10.1038/s41550-020-01276-x
- Taylor et al. (2014) Taylor, M., Cinabro, D., Dilday, B., et al. 2014, ApJ, 792, 135, doi: 10.1088/0004-637X/792/2/135
- Tchekhovskoy et al. (2014) Tchekhovskoy, A., Metzger, B. D., Giannios, D., & Kelley, L. Z. 2014, MNRAS, 437, 2744, doi: 10.1093/mnras/stt2085
- Tendulkar et al. (2017) Tendulkar, S. P., Bassa, C. G., Cordes, J. M., et al. 2017, ApJ, 834, L7, doi: 10.3847/2041-8213/834/2/L7
- The CHIME/FRB Collaboration et al. (2021) The CHIME/FRB Collaboration, :, Amiri, M., et al. 2021, arXiv e-prints, arXiv:2106.04352. https://arxiv.org/abs/2106.04352
- Urry & Padovani (1995) Urry, C. M., & Padovani, P. 1995, PASP, 107, 803, doi: 10.1086/133630
- van der Horst et al. (2007) van der Horst, A. J., Kamble, A., Wijers, R. A. M. J., et al. 2007, Philosophical Transactions of the Royal Society of London Series A, 365, 1241, doi: 10.1098/rsta.2006.1993
- van der Walt et al. (2011) van der Walt, S., Colbert, S. C., & Varoquaux, G. 2011, Computing in Science and Engineering, 13, 22, doi: 10.1109/MCSE.2011.37
- van Dyk et al. (1993a) van Dyk, S. D., Sramek, R. A., Weiler, K. W., & Panagia, N. 1993a, ApJ, 409, 162, doi: 10.1086/172652
- van Dyk et al. (1993b) van Dyk, S. D., Weiler, K. W., Sramek, R. A., & Panagia, N. 1993b, ApJ, 419, L69, doi: 10.1086/187139
- van Dyk et al. (1994) van Dyk, S. D., Weiler, K. W., Sramek, R. A., Rupen, M. P., & Panagia, N. 1994, ApJ, 432, L115, doi: 10.1086/187525
- Vanderplas et al. (2012) Vanderplas, J., Connolly, A., Ivezić, Ž., & Gray, A. 2012, in Conference on Intelligent Data Understanding (CIDU), 47 –54, doi: 10.1109/CIDU.2012.6382200
- Virtanen et al. (2020) Virtanen, P., Gommers, R., Oliphant, T. E., et al. 2020, Nature Methods, 17, 261, doi: 10.1038/s41592-019-0686-2
- Walker (1998) Walker, M. A. 1998, MNRAS, 294, 307, doi: 10.1046/j.1365-8711.1998.01238.x
- Weiler et al. (1990) Weiler, K. W., Panagia, N., & Sramek, R. A. 1990, ApJ, 364, 611, doi: 10.1086/169444
- Weiler et al. (1986) Weiler, K. W., Sramek, R. A., Panagia, N., van der Hulst, J. M., & Salvati, M. 1986, ApJ, 301, 790, doi: 10.1086/163944
- Weiler et al. (1991) Weiler, K. W., van Dyk, S. D., Panagia, N., Sramek, R. A., & Discenna, J. L. 1991, ApJ, 380, 161, doi: 10.1086/170571
- Werner et al. (2016) Werner, G. R., Uzdensky, D. A., Cerutti, B., Nalewajko, K., & Begelman, M. C. 2016, ApJ, 816, L8, doi: 10.3847/2041-8205/816/1/L8
- Wiktorowicz et al. (2019) Wiktorowicz, G., Wyrzykowski, Ł., Chruslinska, M., et al. 2019, ApJ, 885, 1, doi: 10.3847/1538-4357/ab45e6
- Wright (2006) Wright, E. L. 2006, PASP, 118, 1711, doi: 10.1086/510102
- Yao et al. (2020) Yao, Y., Kulkarni, S. R., Burdge, K. B., et al. 2020, arXiv e-prints, arXiv:2012.00169. https://arxiv.org/abs/2012.00169
- Younes et al. (2016) Younes, G., Kouveliotou, C., Kargaltsev, O., et al. 2016, ApJ, 824, 138, doi: 10.3847/0004-637X/824/2/138
- Zauderer et al. (2011) Zauderer, B. A., Berger, E., Soderberg, A. M., et al. 2011, Nature, 476, 425, doi: 10.1038/nature10366