longtable
Quality Control of Image Sensors using Gaseous Tritium Light Sources
Abstract
We propose a practical method for radiometrically calibrating cameras using widely available gaseous tritium light sources (betalights). Along with the gain (conversion factor) and read noise level, the predictable photon flux of the source allows us to gauge the quantum efficiency. The design is easily reproducible with a 3D printer (three-dimensional printer) and three inexpensive parts. Suitable for common image sensors, we believe that the method has the potential to be a useful tool in microscopy facilities and optical labs alike.
1 Institute of Physical Chemistry and Abbe Center of
Photonics, Friedrich-Schiller-University, Jena, Germany
2 Leibniz Institute of Photonic Technology,
Albert-Einstein-Straße 9, 07745 Jena, Germany
3 Jena Center for Soft Matter (JCSM), Friedrich
Schiller University Jena, Jena, Germany
4 Medical Research Council, MRC, Laboratory of
Molecular Biology, Cambridge, United Kingdom
Introduction
Photodetectors and cameras are common instruments used for acquiring scientific data. Scientists are often particularly concerned about the read noise performance and the photon conversion factor, which may vary from device to device. Manufacturers therefore often include such information in quality control reports provided to the customers upon delivery. The detectors may, however, exhibit damage or ageing effects which can affect the quality and reproducibility of data. Various robust methods for end-user calibration exist [1]. But despite this, many labs do not regularly perform quantitative quality control checks on their instruments [2]. It is even less common to measure the radiometric quantum efficiency in a laboratory setting. One explanation could be a relative lack of convenient and low-cost calibration sources.
Existing methods
Measuring the gain and noise characteristics of a detector requires a stable light source. In order to measure the quantum efficiency, the light source must furthermore be calibrated to a radiometric standard. This is the main application for calibrated radiometric transfer standards [3]. In the visible spectrum, these are realised using quartz-tungsten-halogen lamps, which have an irradiance uncertainty in the range of 1% [4]. They offer a limited lifetime, require a long start-up period and a regular recalibration is also recommended [5]. These lamps, in turn, require a calibrated power supply, resulting in a combined setup that is both bulky and expensive, with prices on the order of 1000 EUR to 6000 EUR. For most labs, a calibration tool that costs as much as a camera itself is unlikely to be considered a good return on investment.
Alternatively, one could perform a control experiment using a calibrated detector and correct for the different detector geometries, but this adds complexity to the procedure and introduces a potential for human error. This is the method outlined in the industry-standard EMVA1288[6].
X-rays from radioactive sources, such as Fe55, are sometimes used to measure the gain of visible range image sensors[7 ch. 2.3,8]. The method can be challenging to use in situ, though, as the glass windows of cooled cameras absorb X-rays. It is also not suited to measure the visible range quantum efficiency as this requires visible light.
Gaseous Tritium Light Sources
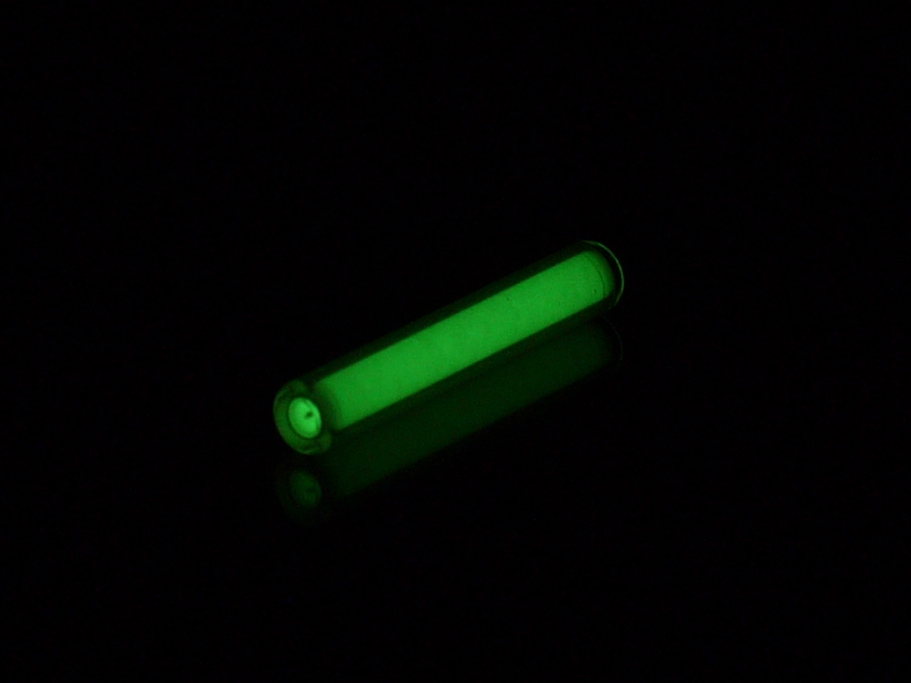
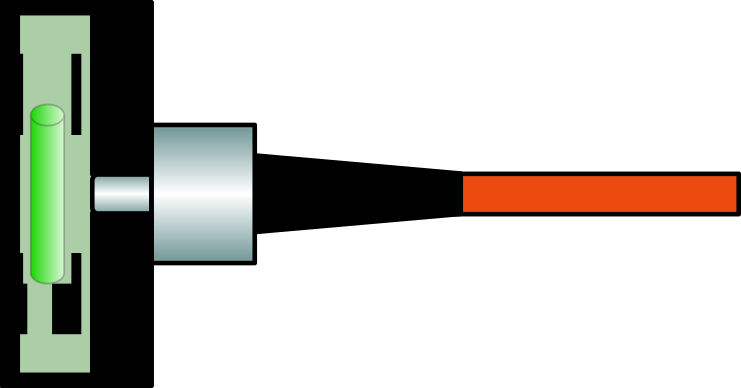
Gaseous Tritium Light Sources (GTLSs, or betalights), used in niche products such as high-end watches, gun sights and fishing tackle, are relatively inexpensive (approximate cost: 5-20 EUR) and emit a stable and predictable light over long periods of time, ideally suited as a standard light source. They rely on free electrons from the beta-decay of tritium (hydrogen-3) gas to excite light-emitting phosphors that coat the inside layer of a glass tube (figure 1a).
Compared to thermal lamps, they offer some attractive properties: They can be made very compact, being smaller than the hands on a watch. And they are self-powered, independent of an electrical power supply.
The idea of using radioluminescent light sources as a low-light radiometric standard is not new [9,10]. But while radioluminescence-based sensor quality-control has been performed by astronomical observatories [11], radioluminescence based calibration methods have not to our knowledge been widely adopted in microscopy facilities.
While the use of radioactive materials initially raises safety concerns, the quantities used in small GTLSs are considered safe and unlikely to result in a significant radiation exposure, even in the worst-case scenario [12,13].
The regulatory situation is an important consideration for any application. But while radionuclides, including tritium, are a controlled substance across the world, many jurisdictions have exemptions for devices up to a certain level of activity that would usually include small GTLSs. For instance, in Germany, this limit is set at one gigabecquerel [14].
Stability
To assess the stability, we measured the signal that a green GTLS produced on a calibrated photodiode (Thorlabs S130C sensor head with PM100D power meter) at a fixed position over time. While work by Mikhalchenko et al. [15] has demonstrated in principle the stability of tritium radioluminescent sources, and others have praised their stable properties [11], [16] , we found little quantitative data, and it is unclear how these results would apply to generically sourced GTLSs, given their proprietary formulations and manufacturing methods.
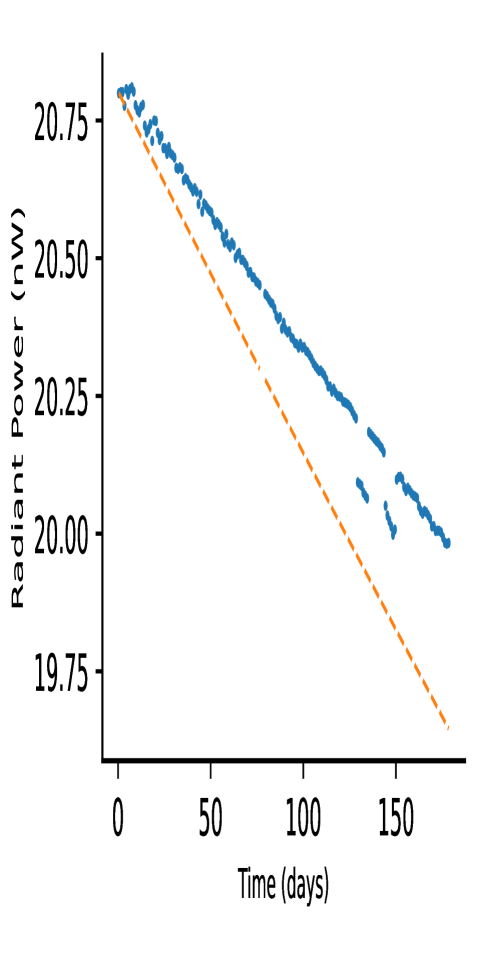
We purchased a green-emitting GTLS from a commercial vendor 111Mad Nuclear Scientist Ltd., London, United Kingdom and monitored the optical power over 178 days (see section “Optical Power measurement” in the methods supplement). The device was found to have excellent predictability. The decay is in good agreement with the expected decay of tritium activity (half-life 12.3 years [17])(figure 2). The output power decreased by 3.9% over the duration of the measurement, whereas the expected decay in tritium activity over this time is 2.7%. This corresponds to a half-life of 8.4 years. We cannot rule out that this discrepancy is caused by a long-term drift in the photodiode or the current meter. (cf. “Power meter reliability” in the methods supplement).
Barring any nonlinear ageing process in the phosphor coating, these results imply that the source could be used as a standard for low-light optical power over many years.
It has been noted that the temperature dependence of GTLSs is a drawback [18], but we consider the mentioned to be comparatively small for our intended application.
Design
With this knowledge, we conceptualised a radiometric calibration tool for cameras. The goal is that it should be reliable, reproducible and affordable. Using it to calibrate a camera should be a simple plug and play procedure.
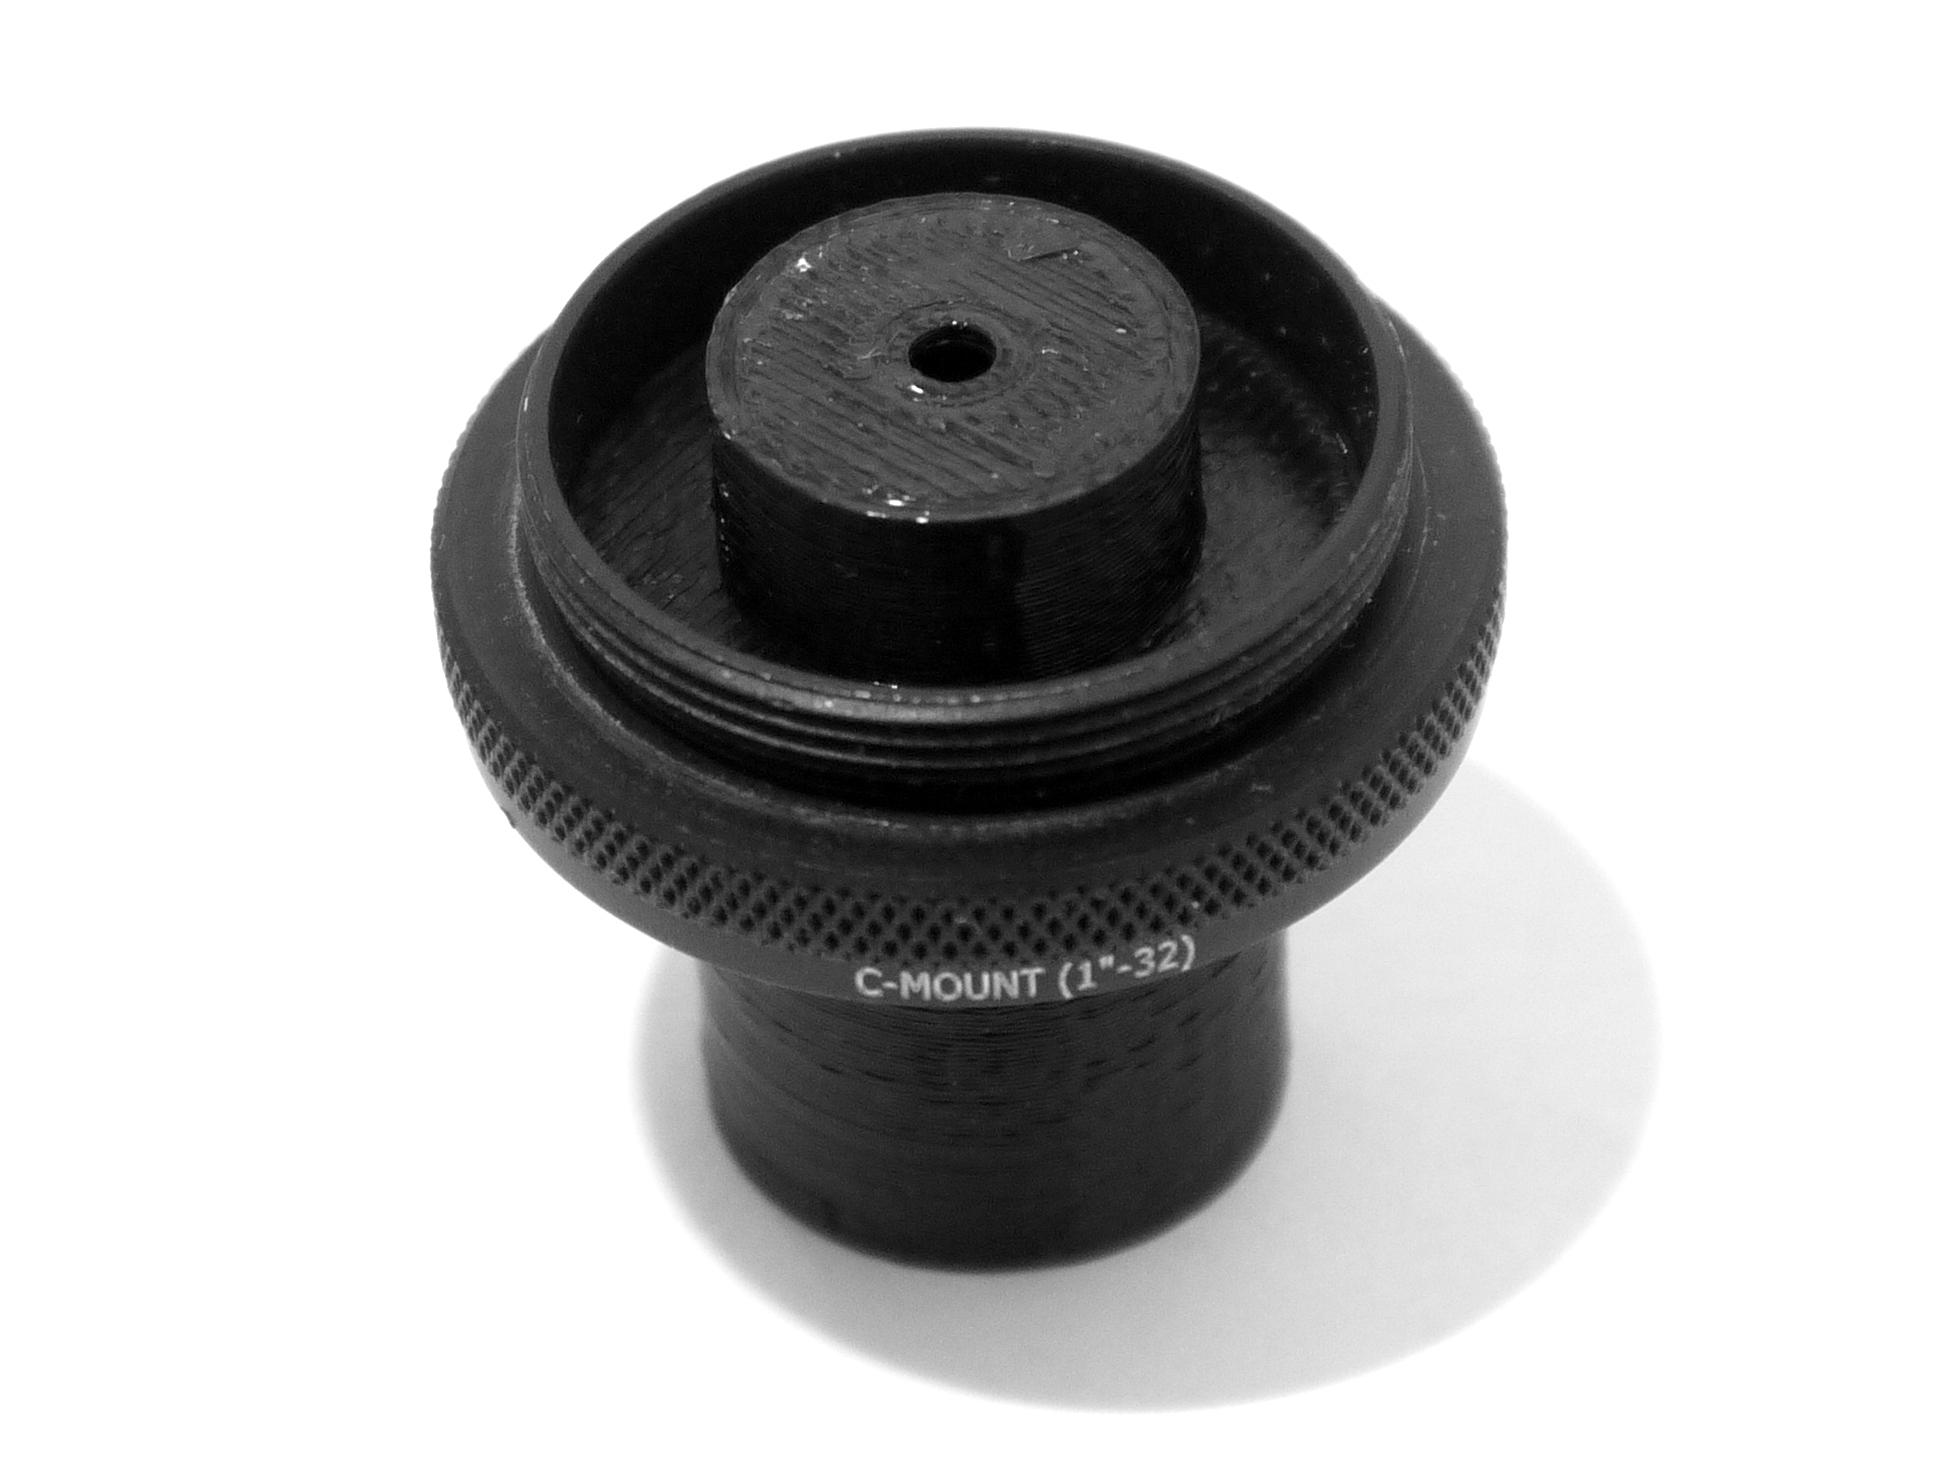
We designed a 3D (three-dimensional) printable mount (figure 1b) for the aforementioned GTLS. Fused filament fabrication 3D printers were used for development and manufacture (Ultimaker 2/3, Prusa i3).
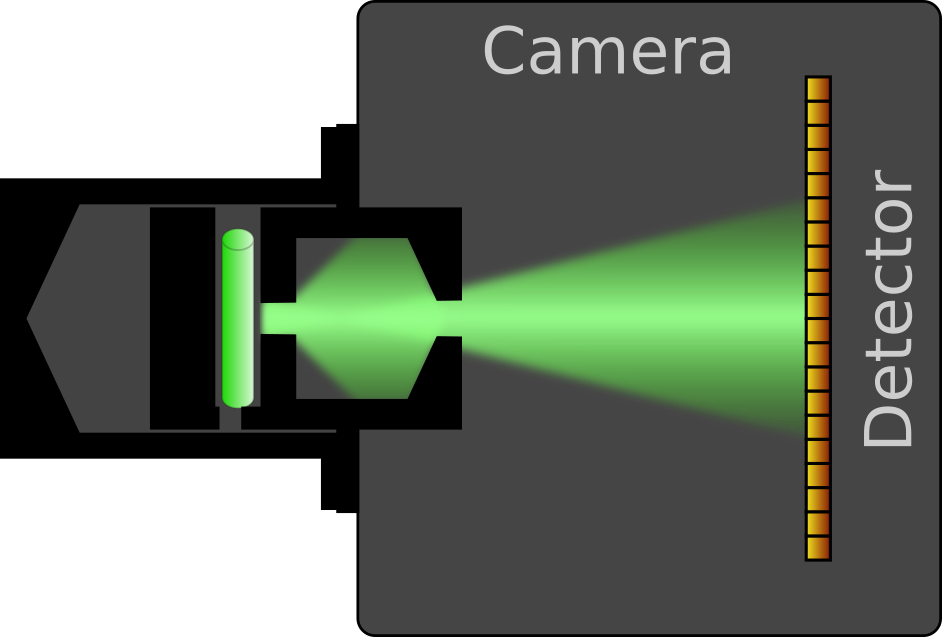
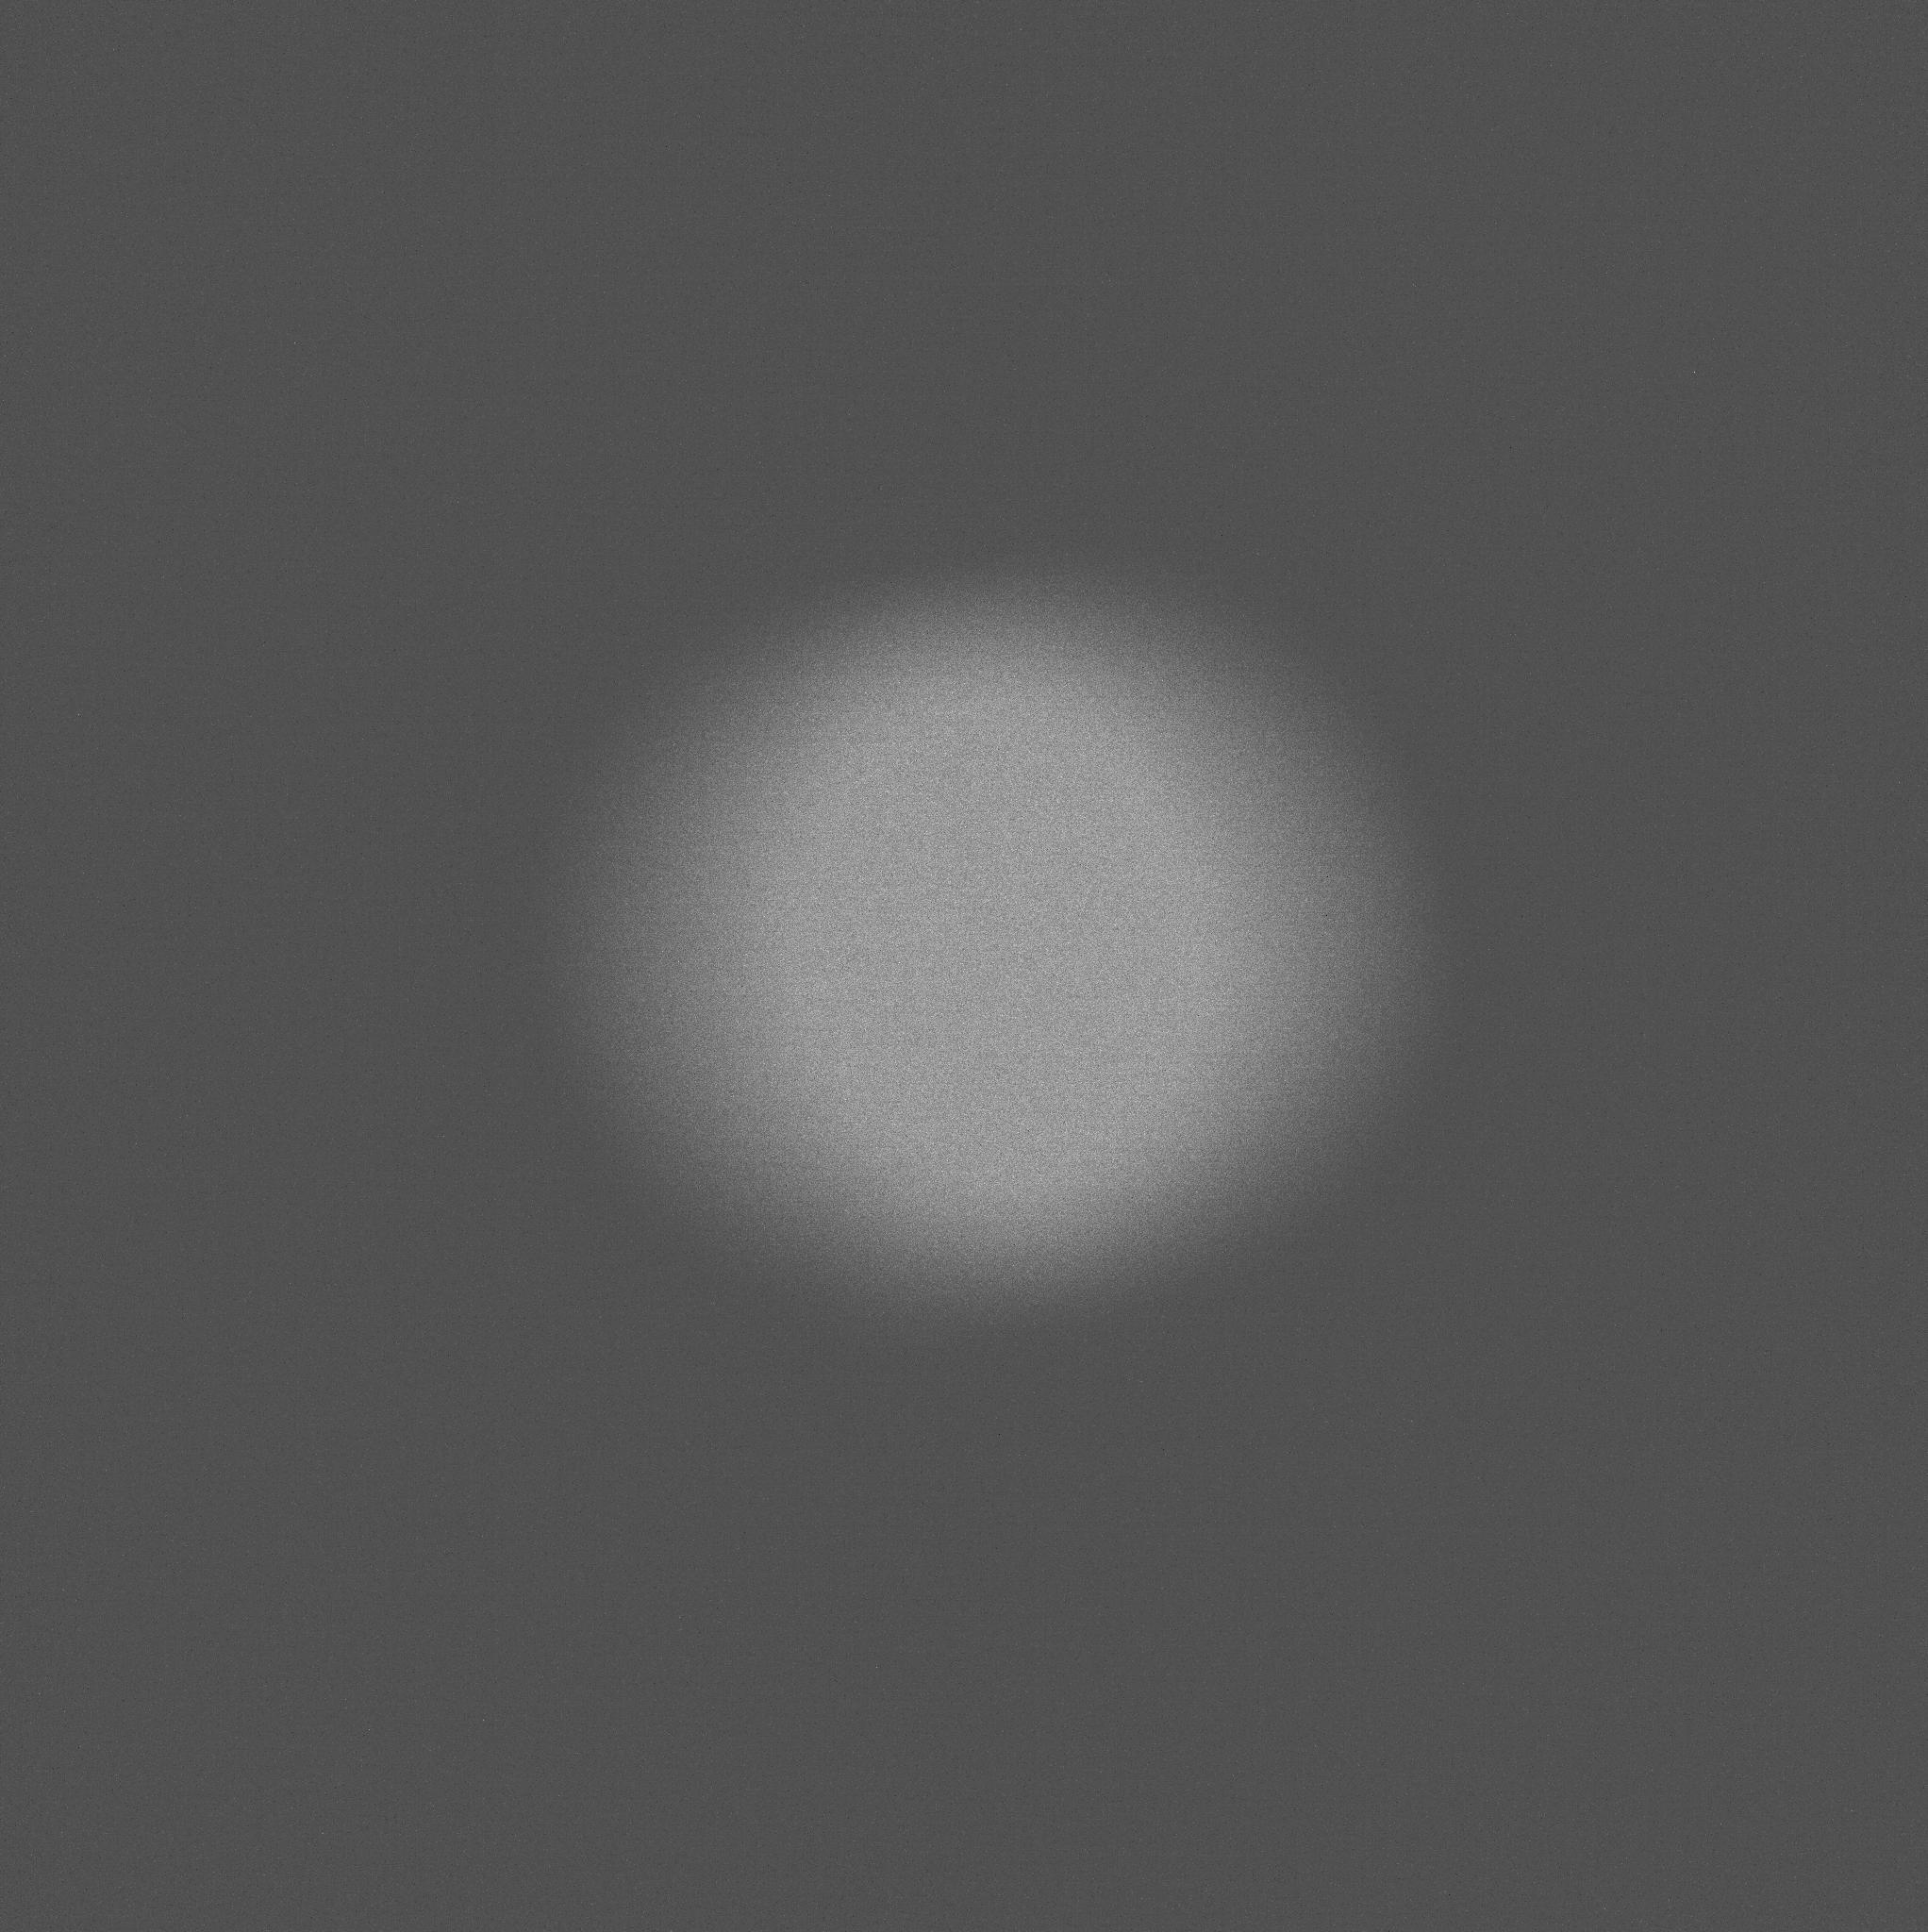
The design mounts the GTLS in a fixed position, and two circular apertures define a divergent beam which exits from the detector-pointing side (figure 3a). The apertures are dimensioned specifically to shape a beam that under-fills the detector’s active area at a chosen distance (figure 3b). The extended size of the first aperture results in a feathered edge for the beam spot on the image sensor, yielding a continuous range of pixel intensities. This is an ideal image pattern for the camera calibration method discussed in the methods supplement (section “Image analysis”).
Under-filling the detector also greatly simplifies the comparison of quantum efficiencies between different detectors, as it is not necessary to correct for different geometries if all of them are under-filled.
There are no optical elements between the source and the camera, eliminating potential sources of misalignment and contamination. To ensure a high-quality light seal and repeatable attachment, we fastened it in a conventional c-mount adapter.
A correctly chosen geometry will also restrict the light’s angle of incidence on the detector, which is useful to ensure that the measurements are representative of typical imaging applications.
For printing, we used both PLA (polylactic acid) and ABS (acrylonitrile butadiene styrene), two common 3D printing materials (brand: BASF Ultrafuse, black colour option). Both materials have a higher transmission in the near-infrared than they do in the visible range (cf. methods supplement, section “Light absorption of printed materials”). This could bias measurements, as silicon-based detectors are sensitive up to a wavelength of about 1200 nm. While we observed that the ABS material had an excellent overall optical extinction, the PLA material leaked a small amount of infrared light even through very thick layers. Based on this, we would recommend that ABS be preferred for printed parts. These absorption characteristics may vary from vendor to vendor, however. Whilst PLA can still be used, measurements should be performed away from NIR sources such as daylight and incandescent lamps, and with the room lighting turned off as a precaution. This should be enough to limit light leakage to very low levels. All printed parts should be visually inspected for holes and defects.
The design is freely available at https://github.com/mcfaddendavid/betalight-calibration[19]. Parameters can be tuned so that the spot best matches various detector geometries. The bill of materials for non-printed parts consists of:
| () Number | Description | Approx. Price |
|---|---|---|
| () | ||
| 1 | Thorlabs C-mount retaining ring, Part number: CMRR | 11.52 EUR |
| 1 | Thorlabs CS- to C-Mount Extension Adapter, Part number: CML05 | 16.78 EUR |
| 1 | Cylindrical GTLS light source 2 mm x 12 mm (green colour suggested) | 8.80 EUR |
| () |
Camera calibration and charge carriers
First, the mounted source is screwed onto the camera lens mount, and a stack of images at constant exposure is acquired (cf. figure 3b). Afterwards, the source is replaced with a camera body cap and we acquire a stack of dark exposures with identical camera settings.
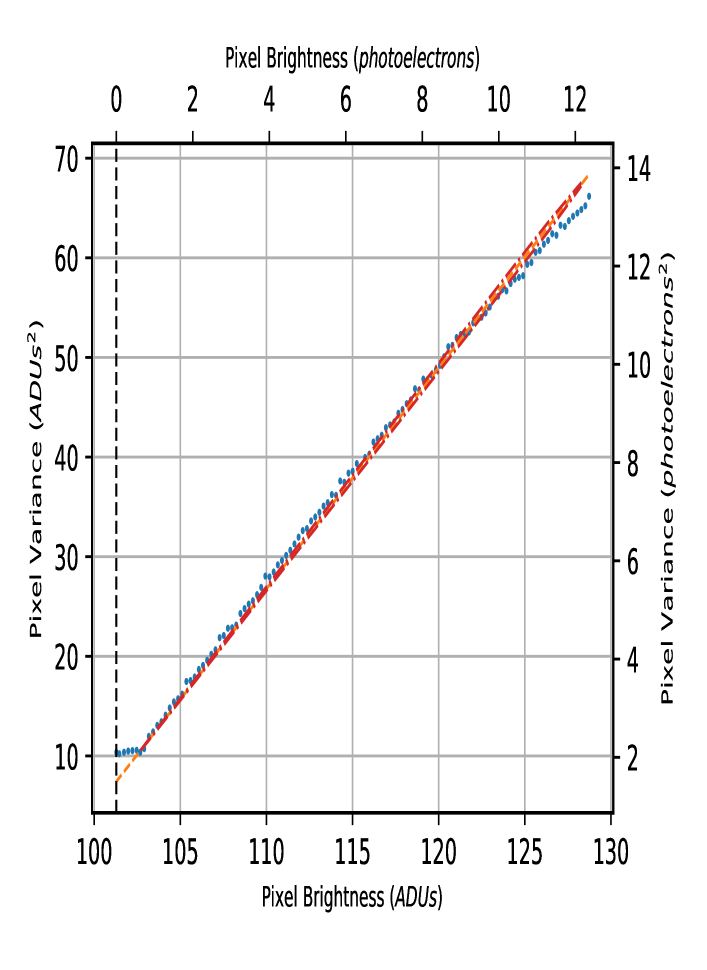
The typical approach for calibrating gain is the photon transfer method [1,20,21]. Our implementation is based on a mean-variance curve (figure 4) and is described in the electronic supplementary material. We use it to obtain estimates for the read noise, the offset, and the camera gain, which relates the arbitrary analog-digital-units (ADU) in the output image to a specific number of charge carriers (photoelectrons) and is expressed in electrons per ADU. Expressing the noise in terms of effective charge carriers is the only meaningful way to compare cameras with different designs.
Subtracting the mean projection along the time axis of the dark exposure stack from the mean projection of the bright exposure gives us an unbiased average frame. We sum the signal of all pixels and multiply the result with the camera gain. This yields a value for the average number of detected photoelectrons per exposure
Dividing this by the exposure time gives us a rate of effective photoelectrons :
| (1) |
Source characterisation
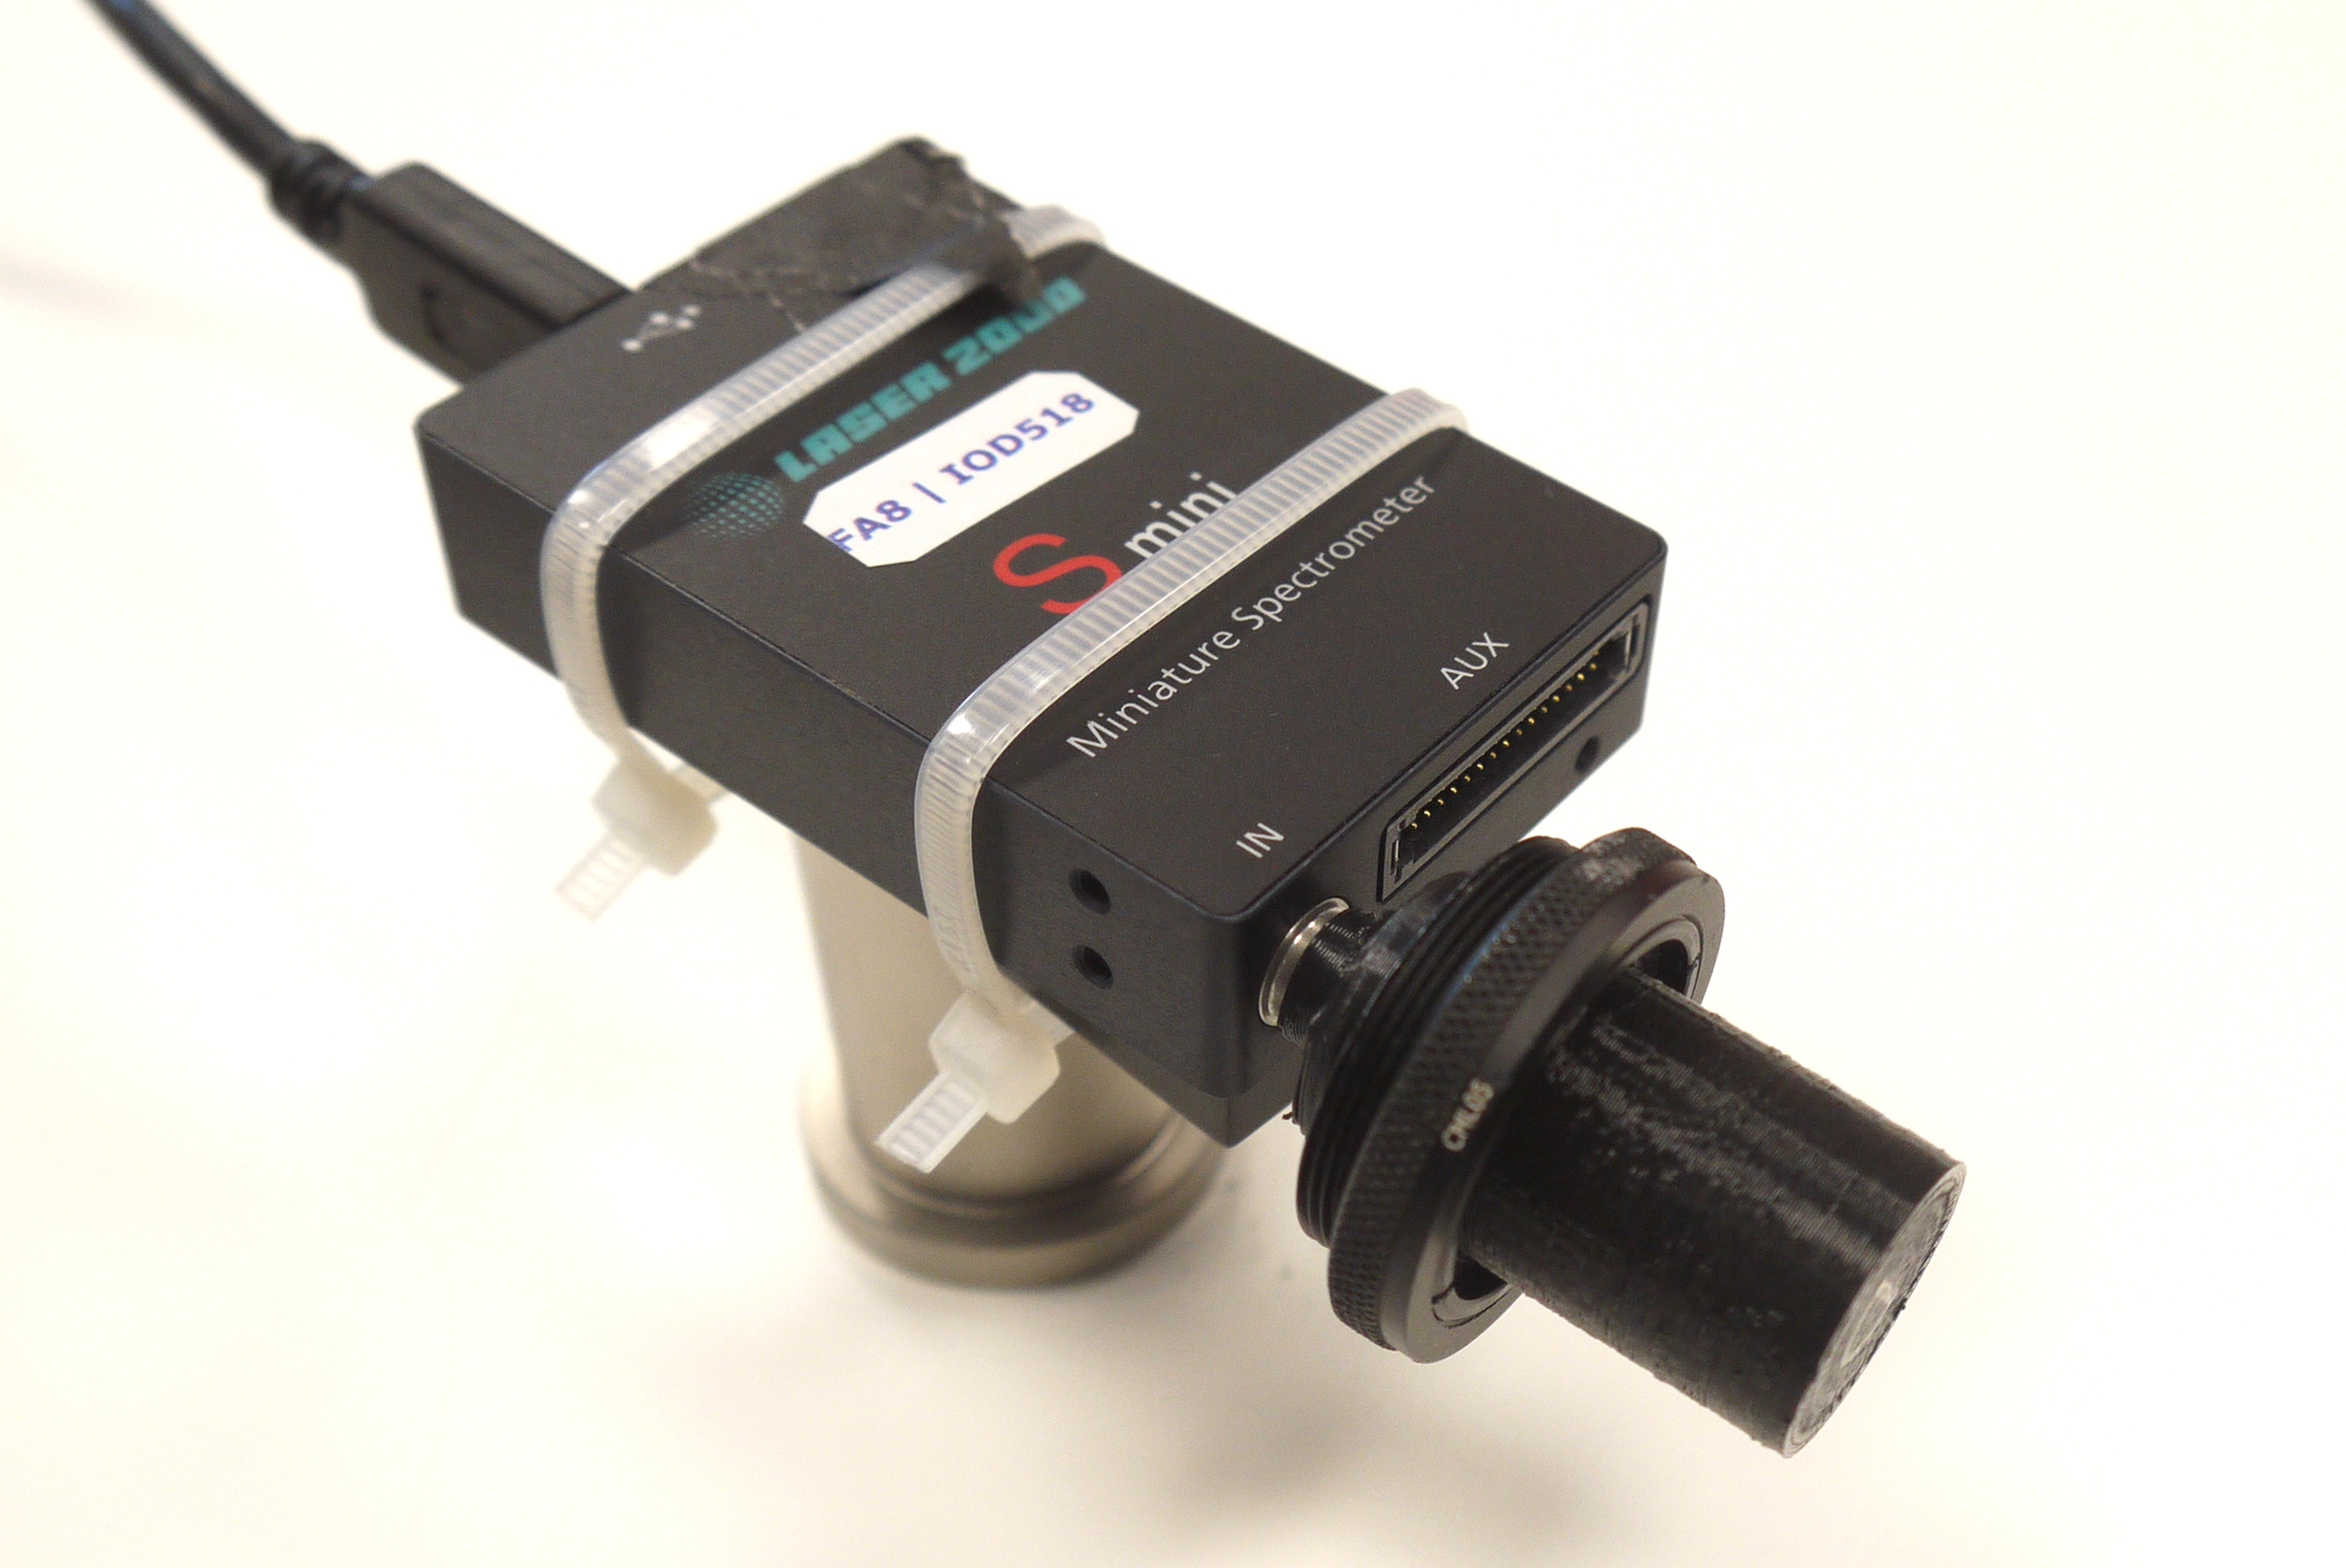
A radiometrically calibrated spectrometer yields the spectral power distribution of the source. The diffuse emission and low light level are an additional challenge for some low-sensitivity uncooled spectrometers. Fibre-based spectrometers may benefit from using a fibre-based mount for the GTLS (figure 5b). Using careful background subtraction, we were nevertheless able to obtain a satisfactory spectrum with a compact uncooled spectrometer (figure 5a) using only free-space propagation (figure 6).
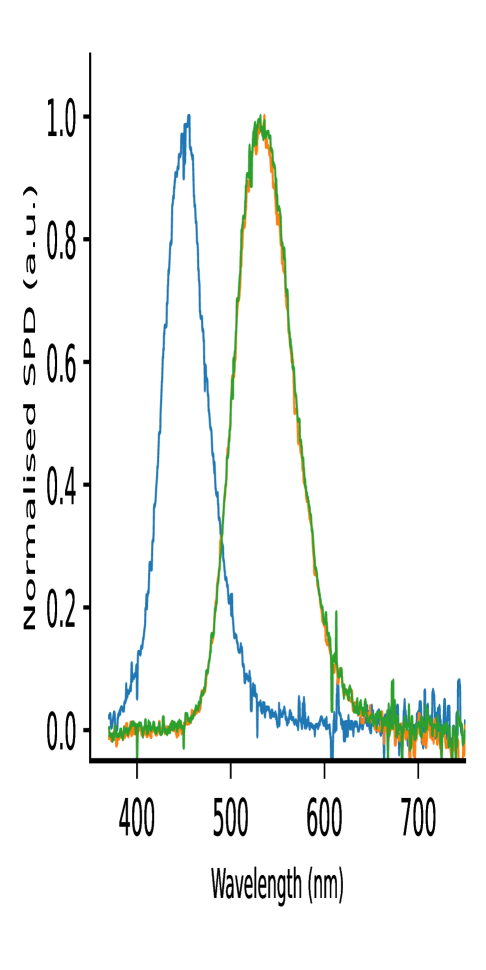
A calibrated spectrometer will output a spectral power distribution . In SI units, this will be in W/nm. Using this as a weighting function allows us to characterise the source by a power-weighted mean wavelength :
The assembled calibration source is then mounted pointing towards a power-calibrated photodiode. The distance to the photodiode surface is exactly the same that the source would otherwise be from the surface of the image sensor of a c-mount camera body. (see methods supplement).
We measure the photocurrent that the beam induces on the under-filled detector, and by correcting for the spectral responsivity of the photodiode as well as the spectral power distribution of the source (see methods supplement, section “Optical Power measurement”), we obtain the expected optical power of the beam.
The power-weighted mean wavelength can be associated with a photon energy:
Dividing the power by this photon energy yields the expected rate of impinging photons :
| (2) |
Note that using the photon energy of the power-weighted mean wavelength to calculate the photon rate in this way is valid for any temporally stable spectral shape. If, however, the spectral shape experiences a shift over time, then it will result in a different photon rate. Such a change might occur in GTLSs with multi-coloured or blended phosphors.
We found that our photodiode power meter delivered satisfactory and repeatable results, with a total optical power of 118 pW. With a of 537 nm, this corresponds to a photon flux of .
The quantum efficiency is simply the ratio between the rate of detected photoelectrons (eq. 1) and the photon flux (eq. 2):
Results
Testing the procedure on three scientific cameras, we obtain quantum efficiency values that agree very well with the quantum efficiencies quoted by the manufacturers222The data was read manually from graphs provided by the manufacturers. The manufacturers do not provide error estimates. We assume a 3% relative uncertainty in the calibrations as well as a 2% absolute uncertainty in the rendering of the quantum efficiency graphs. There are more potential unknown errors which we cannot account for (see methods supplement, section “Manufacturer stated quantum efficiency”). For its working range, the manufacturer quotes the uncertainty of the power meter as ±3% above 450nm, and ±5% below 450nm [22]. However, it should be noted that we are operating the photodiode below its specified power range (Our source has an optical power of 118 pW, whereas the specified minimum power of the photodiode is 500pW, cf. methods supplement, section “Power meter reliability”). The spectral distribution of the source is another crucial input, and measurements on the green source suggest an uncertainty on the order of 1%. We add this to a 3% photodiode uncertainty to obtain a relative error of 4% for our measurements., once the spectral power distribution of the sources is taken into account. Two of these are based on scientific CMOS (sCMOS) sensors. CMOS sensors are active pixel sensors named after the complementary metaloxide-semiconductor (CMOS) fabrication method, and the “scientific” is commonly used to distinguish high-performance scientific cameras from low-performance sensors common in consumer devices. The third sensor is an electronmultiplying charge coupled device (EMCCD) sensor operated in its non-amplified mode. Table LABEL:tbl:qe_tab shows values obtained using both blue and green coloured GTLSs. We find that all but one of the measurements (denoted with “*“) fall within the estimated uncertainty intervals of the manufacturer-specified values.
| () | Colour | Measured | Quoted | Difference |
|---|---|---|---|---|
| () | ||||
| EMCCD camera | Green | 88.6%±3.5% | 89.3%±4.7% | -0.7% |
| Blue | 73.8%±3.0% | 74.1%±4.3% | +1.2% | |
| sCMOS Camera no. 1 | Green | 69.0%±2.8% | 70.8%±4.2% | -1.8% |
| Blue | 53.7%±2.1% | 55.5%±3.7% | -1.8% | |
| sCMOS Camera no. 2 | Green | 70.5%±2.8% | 78.5%±4.4% | -8.0% (*) |
| Blue | 66.8%±2.7% | 73.0%±4.2% | -6.2% | |
| () |
Ultimately the results will also hinge upon the validity of the photon transfer method. It is therefore paramount to scrutinise the results of a photon transfer curve before using them in further processing. Some of our scientific cameras produced repeatable curves across a wide dynamic range, and we would have more confidence in such results. Figure 4 is such a curve. Other cameras produced nonlinear curves in a way that would clearly invalidate gain calibration results. (see methods supplement).
Conclusion
We have demonstrated an affordable and suitably accurate tool for calibrating cameras in a plug-and-play fashion in situ. The design requires only minimal parts and a 3D printer, which allows it to be quickly disseminated to labs where it might be useful.
Absolute quantum efficiency measurement was also demonstrated, but this requires additional spectral information obtained from a radiometrically calibrated spectrometer. Note that a radiometrically accurate spectrum is generally required for conventional quantum-efficiency measurement methods, and the EMVA1288 standard specifically recommends verifying the source spectrum using a (radiometrically calibrated) spectrometer [6]. The standard does, however, allow users to forgo this verification if an accurate spectrum can be provided by the light source manufacturer.
We found no significant difference in the spectrum between two different green GTLSs and were able to reproduce the same spectrum four months later. This suggests that sufficiently accurate prior knowledge of the source spectrum could be provided. But as our GTLSs are unbranded, we cannot know what quality control mechanisms they underwent and the vendor also supplied very limited documentation. As such, we can’t claim to have confidence that our spectral data will apply to GTLSs purchased by others. We would therefore recommend that anybody wishing to reproduce the method measure the spectrum of the GTLS upon delivery and assembly, and periodically thereafter in order to monitor for changes.
Compared to thermal calibration lamps, the optical power of GTLSs is very weak, which prevents us from measuring across the full dynamic range of most non-amplified detectors. Nevertheless, it is likely to be the appropriate power range for many life-science applications, especially single-molecule-localisation microscopy.
The relatively broad spectrum (FWHM 100 nm) of the source means that we are averaging over a wider spectral range than the 50 nm permitted by EMVA1288 [6]. Conversely, for some applications, the spectral width might be considered too narrow or not at the correct location. The availability of GTLSs with phosphors in many different colours [23] suggests, however, that the method could be applied to other spectral ranges. These sources would need to be evaluated individually for their stability, and such an approach might not have any inherent advantage over existing tools for relative polychromatic calibration, such as described by JM Beach [24].
As we do not expose the entire image sensor, local defects at the edges go undetected, though these can also be easily found with conventional light sources or by using a mount without baffles for the GTLS.
It should be noted that our method is especially useful for assessing the long-term stability of detectors. The calibration source should be stored in a dust-free container to ensure that this is not thwarted by dirt or dust blocking the light path.
The current design also requires the camera to be detached from any lens mount, which is a drawback as many microscope users do not wish to remove the cameras from their setups once they have been assembled.
We are currently working on a design that could alleviate this by mounting the source in an alternative location in the optical path of an instrument. For microscopes, this could be at the sample plane or the microscope objective mount. This would allow us to assess the long term stability of the entire optical path of the instrument.
Supplementary information
Electronic supplementary material is available online at https://doi.org/10.6084/m9.figshare.c.5768142
Data accessibility
The data, as well as the analysis script that was used to produce the results of this article, are available on the Dryad data repository with the following DOI: https://doi.org/10.5061/dryad.cvdncjt5f The code for the image analysis, as described in the methods supplement, is maintained in the freely available “NanoImagingPack” library: https://gitlab.com/bionanoimaging/nanoimagingpack/ 3D files for the printed parts of the calibration source, as well as assembly instructions, are available at: https://github.com/mcfaddendavid/betalight-calibration
Contributions
David McFadden designed, coordinated and performed the experiments, developed the designs, analysed the results and drafted the manuscript. Brad Amos came up with the idea of using betalights for camera calibration and revised the manuscript. Rainer Heintzmann participated in the analysis and revised the manuscript. All authors gave final approval for publication and agree to be held accountable for the work performed therein.
Competing interests
We declare we have no competing interests.
Funding
This work was supported by the Deutsche Forschungsgemeinschaft (1278 Polytarget, Project C04).
References
re 1. Heintzmann R, Relich PK, Nieuwenhuizen RPJ, Lidke KA, Rieger B. 2018 Calibrating photon counts from a single image. arXiv:161105654 [astro-ph, physics:physics] [Internet]
p
re 2. Boehm U et al. 2021 QUAREP-LiMi: A community endeavor to advance quality assessment and reproducibility in light microscopy. Nature Methods 18, 1423–1426. (doi:10.1038/s41592-021-01162-y)
pre 3. Hollandt J, Seidel J, Klein R, Ulm G, Migdall A, Ware M. 2005 Primary sources for use in radiometry. In Experimental Methods in the Physical Sciences (eds AC Parr, RU Datla, JL Gardner), pp. 213–290. Amsterdam, The Netherlands: Elsevier. (doi:10.1016/S1079-4042(05)41005-X)
pre 4. Ojanen M, Kärhä P, Nevas S, Sperling A, Mäntynen H, Ikonen E. 2012 Double-coiled tungsten filament lamps as absolute spectral irradiance reference sources. Metrologia 49, S53–S58. (doi:10.1088/0026-1394/49/2/S53)
pre 5. Johnson BC, Graham GD, Saunders RD, Yoon HW, Shirley EL. 2012 Validation of the dissemination of spectral irradiance values using FEL lamps. In (eds JJ Butler, X Xiong, X Gu), p. 85100E. San Diego, CA, USA. (doi:10.1117/12.930801)
pre 6. European Machine Vision Association. 2021 EMVA Standard 1288 Standard for Characterization of Image Sensors and Cameras Release 4.0 General. Spain: European Machine Vision Association. See https://www.emva.org/standards-technology/emva-1288/.
pre 7. Janesick JR. 2001 Scientific Charge-Coupled Devices. Bellingham, WA, USA: SPIE. (doi:10.1117/3.374903)
pre 8. Weatherill DP, Arndt K, Plackett R, Shipsey IPJ. 2017 An electro-optical test system for optimising operating conditions of CCD sensors for LSST. J. Inst. 12, C12019–C12019. (doi:10.1088/1748-0221/12/12/C12019)
pre 9. Hanle W, Kügler I. 1956 Radiolumineszenz als Lichtquelle Konstanter Intensität. Optica Acta: International Journal of Optics (doi:10.1080/713823667)
pre 10. Yamamoto O, JA, Takenaga M, JA, Tsujimoto Y, JA. 1975 Standard light source utilizing spontaneous radiation -United States Patent: 3889124.
pre 11. Amico P, Ballester P, Hummel W, LoCurto G, Lundin L, Modigliani A, Sinclaire P, Vanzi L. 2008 The Detector Monitoring Project. In The 2007 ESO Instrument Calibration Workshop (eds A Kaufer, F Kerber), pp. 11–21. Berlin, Germany: Springer. (doi:10.1007/978-3-540-76963-7_2)
pre 12. Bundesamt für Strahlenschutz. 2020 BfS - Radioactive materials in watches. See https://www.bfs.de/EN/topics/ion/daily-life/watches/watches_node.html . Archived at https://web.archive.org/web/20200608172547/https://www.bfs.de/EN/topics/ion/daily-life/watches/watches_node.html
pre 13. OECD Council. 1973 Decisions on the Adoption of OECD Legal Instruments Radiation Protection Standards for Gaseous Tritium Light Devices. Paris: Organisation for Economic Co-operation and Development. See https://legalinstruments.oecd.org/en/instruments/OECD-LEGAL-0110.
pre 14. Federal Republic of Germany. In press. Strahlenschutzverordnung. See https://www.gesetze-im-internet.de/strlschv_2018/ Archived at http://web.archive.org/web/20201002092905/https://www.gesetze-im-internet.de/strlschv_2018/
pre 15. Mikhal’chenko AG. 2011 Properties of radioluminescence sources for photometry. J. Opt. Technol. 78, 452. (doi:10.1364/JOT.78.000452)
pre 16. Marette G, Gérard J-C. 1976 Rocket-borne baffled photometer: Design and calibration. Appl. Opt. 15, 437. (doi:10.1364/AO.15.000437)
pre 17. Lucas LL, Unterweger MP. 2000 Comprehensive Review and Critical Evaluation of the Half-Life of Tritium. J Res Natl Inst Stand Technol 105, 541–549. (doi:10.6028/jres.105.043)
pre 18. Abbott TMC. 1995 The CCDs at ESO: A Systematic Testing Program. In New Developments in Array Technology and Applications (eds AGD Philip, KA Janes, AR Upgren), pp. 343–344. Dordrecht, Netherlands: Springer Netherlands. (doi:10.1007/978-94-011-0383-1_52)
pre 19. McFadden D. 2021 GTLS-based calibration source for cameras. See https://github.com/mcfaddendavid/betalight-calibration.
pre 20. Janesick JR. 2007 Photon Transfer. 1000 20th Street, Bellingham, WA 98227-0010 USA: SPIE. (doi:10.1117/3.725073)
pre 21. van Vliet L, Sudar D, Young I. 1998 Digital fluorescence imaging using cooled charge-coupled device array cameras. In Cell biology, second edition, volume III (ed K Simons), pp. 109–120. New York, N.Y: Academic Press.
pre 22. Thorlabs Inc. In press. Spec sheet S130C. See https://www.thorlabs.de/drawings/f7a637e286876c21-ACC02A8B-ED79-777B-5D7939344598B79F/S130C-SpecSheet.pdf. Archived at http://web.archive.org/web/20220623155622/https://www.thorlabs.de/drawings/f7a637e286876c21-ACC02A8B-ED79-777B-5D7939344598B79F/S130C-SpecSheet.pdf.
pre 23. MB Microtec AG. 2020 Trigalight. See http://www.trigalight.com/ Archived at https://web.archive.org/web/20200603160423/http://www.trigalight.com/.
pre 24. Beach JM. 1997 A LED light calibration source for dual-wavelength microscopy. Cell Calcium 21, 63–68. (doi:10.1016/S0143-4160(97)90097-X)
p