Multiscale nanoindentation modeling of concentrated solid solutions: A continuum plasticity model
Abstract
Recently developed single-phase concentrated solid-solution alloys (CSAs) contain multiple elemental species in high concentrations with different elements randomly arranged on a crystalline lattice. These chemically disordered materials present excellent physical properties, including high-temperature thermal stability and hardness, with promising applications to industries at extreme operating environments. The aim of this paper is to present a continuum plasticity model accounting for the first time for the behaviour of a equiatomic five-element CSA, that forms a face-centered cubic lattice. The inherent disorder associated with the lattice distortions caused by an almost equiatomic distribution of atoms, is captured by a single parameter that quantifies the relative importance of an isotropic plastic contribution to the model. This results in multiple plasticity mechanisms that go beyond crystallographic symmetry-based ones, common in the case of conventional single element metals. We perform molecular dynamics simulations of equiatomic CSAs: NiFe, NiFeCr, NiFeCrCo, and Cantor alloys to validate the proposed continuum model which is implemented in the finite element method and applied to model nanoindentation tests for three different crystallographic orientations. We obtain the representative volume element model by tracking the combined model yield surface.
I Introduction
High entropy alloys (HEAs) are multicomponent versions of concentrated solid solution alloys (CSAs) that attracted increasing attention throughout recent years Osetsky et al. (2018); Zhao et al. (2021). The main reason behind the interest in these materials is their exceptional properties such as high strength (also at high temperature), high hardness and resistance to wear, corrosion and irradiation, cf. Kaushik et al. (2021); Otto et al. (2013) and references therein. Due to these properties, they are considered as candidates for various applications where the materials have to withstand harsh conditions, such as future nuclear power plants (generation IV and fusion) Kurpaska et al. (2022), chemical plants as well as aerospace applications and biomedical implants Zhao et al. (2021). In this paper, we present a continuum plasticity model considering for the first time the behaviour of a equiatomic multi-element face centered cubic (FCC) CSA. The inherent disorder associated with the lattice distortions is characterized by an -parameter that quantifies the relative importance of an isotropic plastic contribution to the model implemented in the finite element method. This results in multiple plasticity mechanisms that go beyond crystallographic symmetry-based ones. Besides, molecular dynamics (MD) simulations are performed for equiatomic CSA: NiFe, NiFeCr, NiFeCrCo, and Cantor alloys to validate the proposed continuum model applied to nanoindentation tests obtaining the representative volume element model by tracking the combined model yield surface.
The crystal plasticity (CP) theory is a tool that enables us to get insight into the active plastic deformation mechanisms (slip, twinning, transformation) in a continuum setting, leading to a given mechanical response and microstructure evolution. For the material with known properties, it also enables to predict the mechanical response and microstructure evolution provided that the initial crystallographic orientation is specified. Although the CSAs have been the subject of increasing interest, some authors Fang et al. (2021) reported recently that crystal plasticity (CP) theory has not been used to study equiatomic CSAs. While this is no longer true, simulating the behavior and microstructure evolution of CSAs by means of crystal plasticity theory is still in its nascent stage. In particular, although there is a vast number of papers concerning modelling the micro- and nanoindentation of conventional metals and alloys by means of crystal plasticity finite element method (CPFEM), cf. e. g. Renner et al. (2016); Yao and You (2017); Wang et al. (2018); Frydrych (2019), it seems there is no such study devoted to the CPFEM simulation of the indentation in chemically complex CSAs like the Cantor Alloy. We shall now briefly summarize some CPFEM simulations of CSAs in other contexts.
Lu et al. Lu et al. (2021) applied the classical power law CP coupled with simple damage model to study the effect of strain rates and stress states on mechanical behavior and texture evolution in polycrystalline CoCrFeNi alloy. Gao et al. Gao et al. (2020) applied a power law plasticity with hardening based on dislocation density evolution to study the mechanical response and texture evolution of NiCoCrFe deforming by slip and twinning. It should be noted that the study is not strictly a CPFEM where there is one or more finite elements in each grain. Rather, the Taylor assumption was applied in order to merge the contributions of a number of grains in each integration point. A power law crystal plasticity with both isotropic and kinematic hardening was applied in Han et al. (2021) in order to simulate Fe44Mn36Co10Cr10 subjected to 10 cycles of tensile-tensile sine load. Maps of cumulative plastic strain and dominant slip system were presented. The insterstitial HEA Fe49.5Mn30Co10Cr10C0.5 was studied in Lu et al. (2020); Zhang et al. (2022). The modified Orowan equation was used to determine the shear rate on each slip system and the evolution of dislocation density was treated with the modified Kocks-Mecking model. The impact of deformation mechanisms on the ratchetting strain evolution was analysed in Lu et al. (2020). The influence of temperature and grain size on deformation behavior was studied in Zhang et al. (2022). The tensile behaviour of the polycrystalline Cantor alloy was studied using fast-Fourier transform (FFT) based crystal plasticity model in Gordon et al. (2021).
Instead of using the finite element method (FEM) or FFT, one can combine the responses of individual grains by applying self-consistent modelling. In such a model, each grain is treated as an ellipsoidal inclusion submerged in a homogeneous equivalent medium representing the polycrystal. Tazuddin, Biswas and Gurao Tazuddin et al. (2016) conducted the Visco-Plastic Self-Consistent (VPSC) Lebensohn and Tomé (1993) model simulation of rolling in HEA: MnFeCoNiCu. They have concluded that qualitative agreement with the experimental texture can be obtained only if the plastic deformation is carried out with a considerable portion of the partial slip alongside the conventional octahedral slip. The VPSC code was used also in Kaushik et al. (2021) in order to investigate the contributions of twin variants in texture development of equiatomic CrMnFeCoNi (Cantor alloy) subjected to rolling. Fang et al. Fang et al. (2021) applied a CP model to study the behavior of irradiated FeNiMnCr. The irradiation was taken into account by introducing the term stemming from the presence of dislocation loops in the critical resolved shear stress (CRSS). The solid solution strengthening occurring specifically in HEAs was explained to result from the lattice distortion caused by differences in shear modulus and atomic size of the atoms present in the alloy composition.
On the other hand, strengthening and plastic deformation of HEA are known to be atomic-level phenomena that are usually modeled by using molecular dynamics (MD) simulation to describe the dislocation nucleation and evolution during mechanical testing. The information gained in such MD simulations should be then applied in higher-scale models such as discrete dislocation dynamics or crystal plasticity, which leads us to the multiscale modelling concept. Experimental analyses of atomic-level materials phenomena are highly demanding and need to be validated by large-scale atomistic simulation techniques Choi et al. (2018); Kurpaska et al. (2022). MD simulations have been widely performed to understand the plastic deformation mechanisms of HEA from nanoindentation computational modelling noticing that the length of the dislocation network nucleated is kept by the geometrically necessary dislocations that are generated to remove the material from the indenter tip, slowing the mobility of the dislocations Alabd Alhafez et al. (2019); Qi et al. (2021). A particular advantage of simulating nanoindentation as compared to simulations of other set-ups is the ease at which such simulations can be compared against experimental data. Other experimental techniques at the scale available for MD are typically either impossible or require more effort and are more susceptible to error. By performing simulations of nanoindentation, the computation of the hardness of the material can be done by using the Oliver-Pharr method where this value is higher for Cantor HEA than for single element materials Ruestes and Farkas (2022). Moreover, an important feature revealed in MD simulations of spherical nanoindentation is the emergence of a considerable amount of isotropic plasticity Ruestes and Farkas (2022) that is usually compared to pure Ni samples. Typically, the pure single element metals of 100 orientation show four distinct pile-ups reflecting the crystal symmetry Varillas et al. (2017). The pile-up symmetry related to a given crystallographic orientation appears naturally not only in MD but also in CP simulations. On the other hand, the pile-up around an indent in the case of chemically complex materials appears to be almost circular which is typical for an isotropic material, as observed for polycrystalline Cantor alloys Qiu et al. (2021). The four-fold crystallographic symmetry is however still present too. The limit case of circular pile-up observed in nanoindentation can be easily obtained using the isotropic plasticity model, e. g. J2 plasticity. However, obtaining the response showing traces of both crystal and isotropic plasticity is to the best of our knowledge not possible using any continuum mechanics model.
Therefore, the aim of the current contribution is to propose a continuum model able to reproduce the behaviour of HEAs showing both isotropic and crystal plasticity signatures. The paper is organised as follows. After this introduction, in Sec. II we briefly describe MD simulations performed at three different crystal orientations for a pure Ni sample and a Cantor alloy. The presented results clearly show that the chemical disorder inherent to this alloy leads a decrease in the pile-up height variability around an indent. Next, in Sec. III the Continuum model of HEAs is described by the classical crystal viscoplastic model, the proposed isotropic viscoplastic model and shows how they were combined in order to address the effect observed in MD. It also describes the details of the finite element simulations performed. In Sec. IV Results are presented by the surface topographies obtained using the continuum model compared against the MD results for each orientation. Followed by the Discussion section (Sec. V) highlights the issues related to the chemical disorder and its relation to amorphization, the effect of elastic anisotropy and discusses the predictions of mechanical response as observed in other deformation schemes. In particular, the yield surface points obtained using crystal plasticity, isotropic plasticity and the combined isotropic-crystal plasticity model are presented. Finally, Conclusions are recapitulated in Sec. VI where the main findings of the paper suggest further research directions in terms of validation, application and possible extension of the proposed continuum model. It also points out the way to determine its limitations in terms of scale and atomic structure of a given material.
II Molecular Dynamics simulations
An atomistic computational model is applied to emulate nanoindentation test of pure crystalline nickel and equiatomic CSAs: NiFe, NiFeCr, NiFeCrCo, and Cantor NiFeCrCoMn alloys by the Large-scale Atomic/Molecular Massively Parallel Simulator (LAMMPS) Thompson et al. (2022) and interatomic potentials reported by Choi et al. Choi et al. (2018); which are based on the second Nearest Neighbor Modified Embedded Atom Method (2NN-MEAM). MD simulations first start by defining the initial energy optimized Ni sample and equilibrated for 100 ps with a Langevin thermostat at 300 K and a time constant of 100 fs Dominguez-Gutierrez et al. (2021). This is done until the system reaches a homogeneous sample temperature and pressure profile, at a density of 8.78 . A final step is performed by relaxing the prepared sample for 10 ps to dissipate artificial heat.
For the crystalline equiatomic CSAs samples, Ni atoms are substituted at the required percentage for the CSAs randomly in the original FCC Ni sample following a thermalization at T= 300 K for 2 ns. The system is further equilibrated through Monte Carlo (MC) relaxation, using a canonical ensemble with a compositional constraint by performing atomic swaps, as implemented in LAMMPS. Then the slab is exposed to the surface boundary conditions (2D periodicity) at 300 K into the microcanonical emsemble where the number of particles, N, the sample volume, V, and the system energy, E, are assumed to be constant during the NVE molecular dynamics simulation performed for 20 ps (with 1 fs steps) Kurpaska et al. (2022). The dimensions of the simulation box by considering different crystal orientations for the 5-element CSA are mentioned in Table 1.
| Orientation | Size (dx, dy, dz) [nm] | Atoms |
|---|---|---|
| 33.20 36.09 36.12 | 3 164 800 | |
| 33.06 36.17 38.71 | 3 442 032 | |
| 33.07 36.12 40.61 | 3 645 720 |
II.1 Nanoindentation test
In order to perform MD simulations of nanoindentation, the prepared sample is divided into three sections on the direction for setting up boundary conditions. In addition, we consider 7 nm vacuum section on the top, above the material sample and also the two lowest bottom layers are kept frozen ( 0.02dz) to assure stability of the Mo atoms when nanoindentation is performed. A thermostatic region above the already defined frozen one is considered to dissipate the generated heat during nanoindentation, with a thickness of 0.08dz. The rest of the layers the atoms are free to interact with the indenter tip that modifies the surface structure. Periodic boundary conditions are set on the and axes to simulate an infinite surface, while the orientation contains a fixed bottom boundary and a free top boundary in all MD simulations.
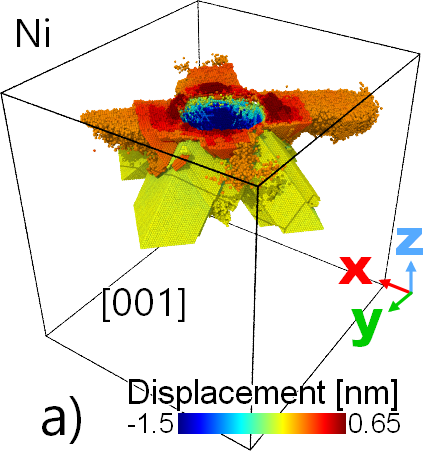
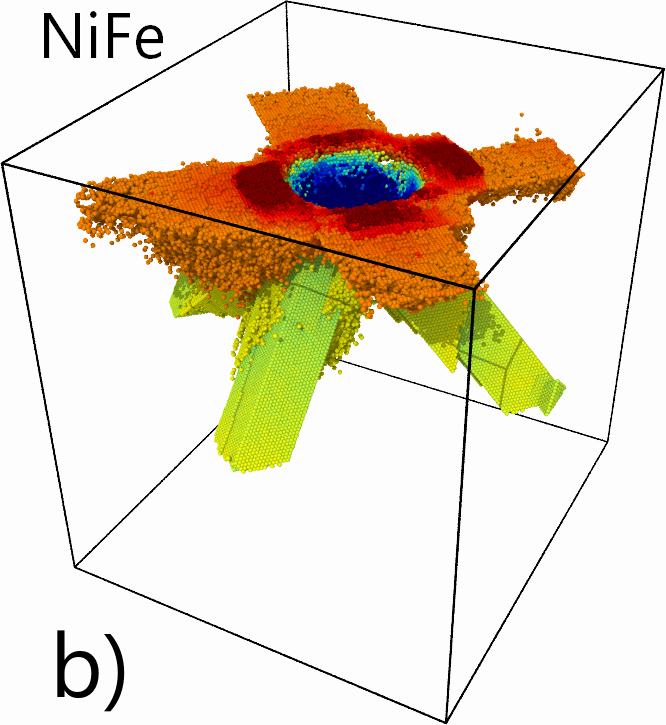
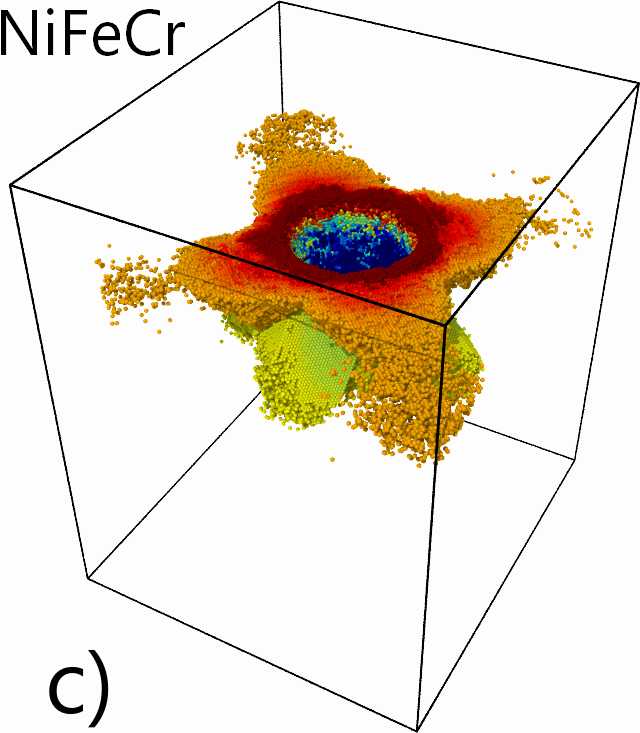
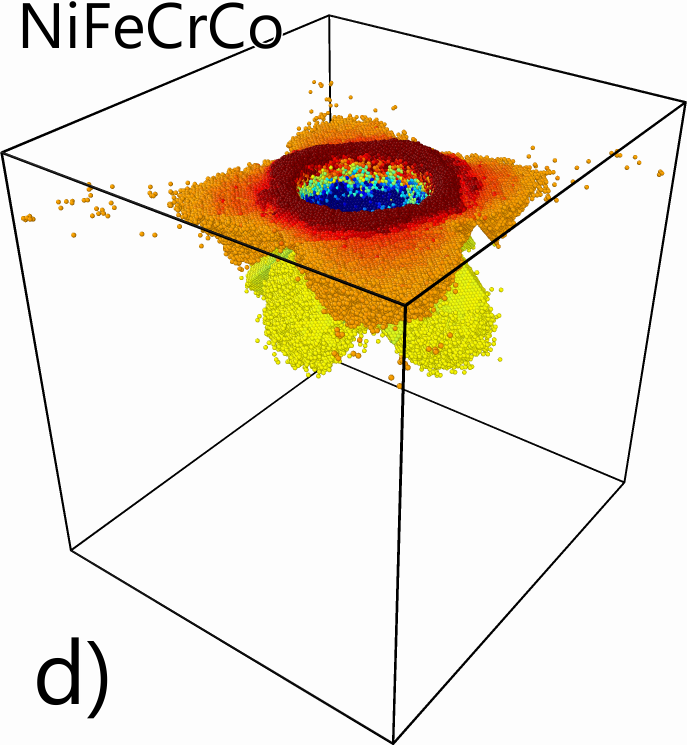
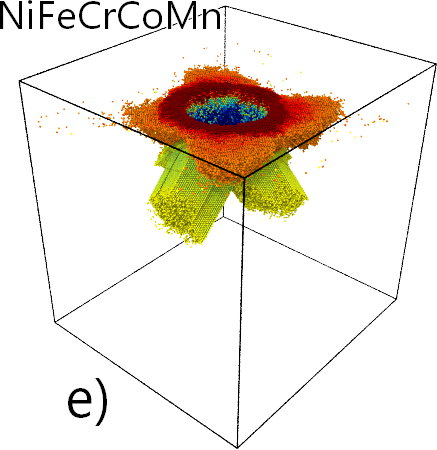
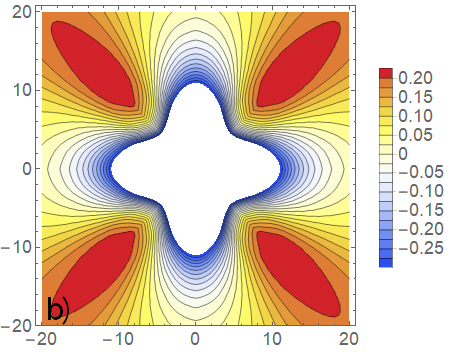
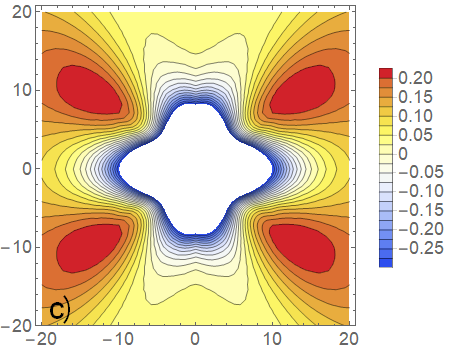
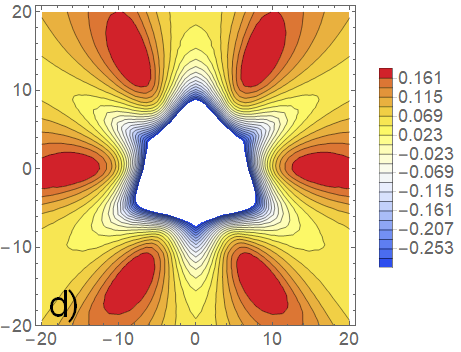
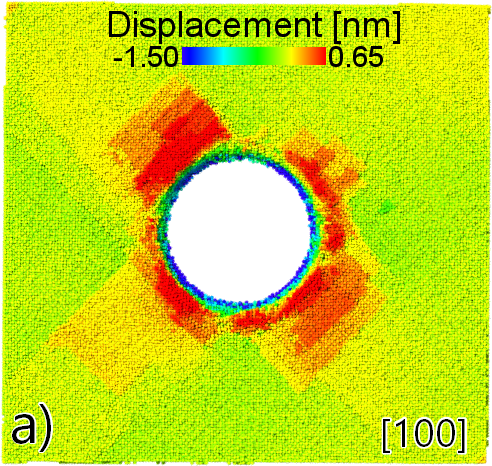
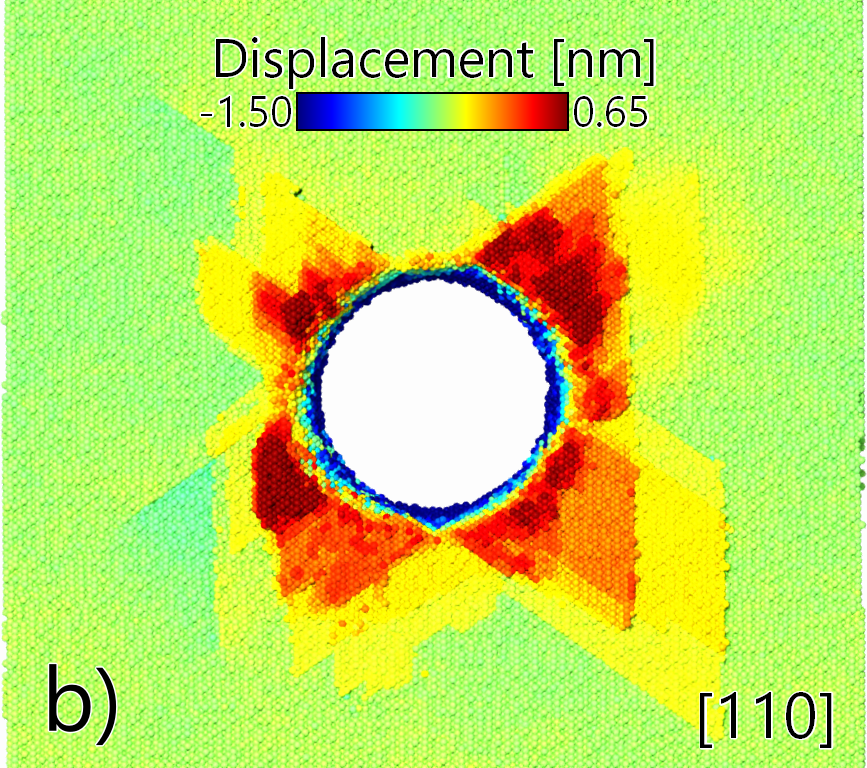
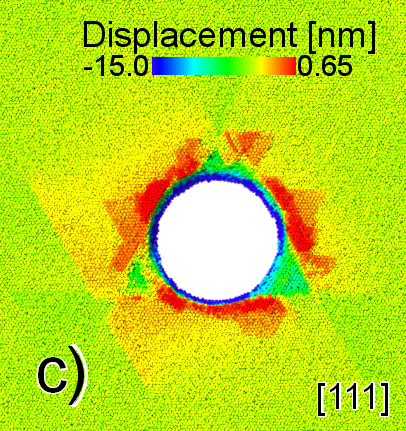
The indenter tip is considered as a non-atomic repulsive imaginary (RI) rigid sphere with a force potential defined as: where eV/Å3 (37.8 GPa) is the force constant, and is the position of the center of the tip as a function of time, with radius . Here, with and as the center of the surface sample on the xy plane, the nm is the initial gap between the surface and the intender tip moves with a speed = 20 m/s performed for 125 ps with a time step of fs. The maximum indentation depth is chosen to 5.0 nm to avoid the influence of boundary layers in the dynamical atoms region Kurpaska et al. (2022). In Fig. 1, we report results for the atomic displacement of the pure Ni in a) and for equiatomic CSA: NiFe in b) Kurpaska et al. (2022), NiFeCr in c), NiFeCrCo in d), and Cantor alloy in e) on the [001] crystal orientation, at the maximum indentation depth; noticing that single element materials presents slip traces with the four pile-ups. While the atoms are accumulated around the indenter tip for the CSA sample, which is an effect of the lattice mismatch due to the chemical complexity of the Cantor alloy. Nevertheless, the CSA preserves the FCC geometry as observed for the slip planes in Fig. 1 for different cases.
Motivated by these results, we decided to model the surface morphology of indented CSA by a crystal plasticity model, as discussed in the following section.
III Continuum model accounting for chemical disorder
In this section we first review the classical crystal viscoplasticity approach. Then we propose the power law isotropic viscoplasticity model. Finally, we suggest the way to combine the abovementioned models in order to account for the behaviour of CSAs which due their inherent lattice-level disorder show the features of both crystalline and isotropic materials.
III.1 The crystal plasticity model
The rate-dependent crystal plasticity model with phenomenological hardening law implemented in the total Lagrangian setting was already described in a number of papers, e. g. Frydrych and Kowalczyk-Gajewska (2018); Frydrych et al. (2019). Here we include its description for the sake of the paper’s clarity.
The kinematics follows classical contributions, cf. Hill and Rice (1972); Asaro and Rice (1977); Asaro and Needleman (1985). Multiplicative decomposition of the deformation gradient into elastic and plastic parts is performed:
| (1) |
and the evolution of the plastic part is dictated by the plastic velocity gradient :
| (2) |
The plastic velocity gradient is calculated as a sum of shear rates projected on the -th slip system direction and plane normal in the reference configuration:
| (3) |
The shear rates are obtained using the power law Asaro and Needleman (1985) with the reference slip velocity treated as a model parameter:
| (4) |
Here, is a rate-sensitivity parameter. The Mandel stress tensor is projected on a given slip system in order to calculate the resolved shear stress (RSS):
| (5) |
while the hyper-elastic law is applied to obtain the Mandel stress:
| (6) |
Here, the right elastic Cauchy-Green tensor is used and the free energy density is defined in terms of the elastic Lagrangian strain tensor and the four-dimensional stiffness tensor :
| (7) |
Concerning the critical resolved shear stress (CRSS) on a given slip system , its evolution is governed by the exponential Voce-type hardening law:
| (8) |
with
| (9) |
and
| (10) |
Where the accumulated plastic shear is defined as follows:
| (11) |
The latent hardening parameter is equal to 1 for (self-hardening), whereas for (latent hardening), it is equal to on coplanar systems and on non-coplanar systems. The model parameters for pure Ni were taken from Lewandowski and Stupkiewicz (2018) and are listed in Tab. 2.
| GPa | GPa | GPa | GPa | GPa | GPa | GPa | ||||
| 246.5 | 147.3 | 124.7 | 0.008 | 0.142 | 0.240 | 0.0075 | 1.4 | 1.0 | 0.0001 | 10 |
III.2 The isotropic plasticity model
In order to simulate the nanoindentation with isotropic distribution of plastic shear, some J2-based model (as the one in section 2.1 of Frydrych (2019)) could have been applied. However, we wanted to have the model directly analogous to the CP model so that the combined model can then be built (see the next section). The structure of the model is thus similar to the CP model presented above. The differences are described in the following.
Equations 1 and 2 still hold. We propose the model of the isotropic contribution to be analogous to the finite strain version of the viscoplastic Perzyna-type model. However, we replace the yield surface and its derivative with the power law. We thus obtain (details of the derivation are presented in the Appendix):
| (12) |
where is the viscosity parameter, is the rate sensitivity exponent (the same as in the crystal plasticity model), is the equivalent Huber-Mises stress, is the yield stress and is the stress deviator.
Equations 6 and 7 still hold. The linear-exponential hardening describes the evolution of the yield stress:
| (13) |
where , , and are the hardening parameters. The model parameters for pure Ni callibarated in such a way the the mechanical response is equivalent to the crystal response are presented in Tab. 3.
| GPa | - | GPa | GPa | GPa | - | - | |
| 220 | 0.31 | 0.012 | 0.1 | 0.04 | 22 | 1000 | 10 |
is the accumulated plastic shear which is defined as follows:
| (14) |
where is the plastic Lagrangian strain tensor.
III.3 The combined isotropic-crystal plasticity model
Finally, the crystal and isotropic plasticity models are combined in order to account for the observed behaviour of HEAs. The degree of isotropy is described by the parameter . Therefore, the velocity gradient is now defined as follows:
| (15) |
where and have been defined in equations 12 and 3, respectively. Also the hyper-elastic law 6 is still valid but the elastic stifness tensor is now computed as:
| (16) |
The hardening contributions are calculated separately for the isotropic and crystal parts.
III.4 The finite element simulation details
The material models described above have been implemented using the AceGen software Korelc (2002); Wriggers (2008), which takes advantage of the automatic code generation, automatic differentiation and automatic expression optimization techniques. In the case of the crystal plasticity and the combined model, 12 FCC slip systems were used. The finite element simulations have been carried out using the AceFEM software Korelc (2002); Wriggers (2008) applying 8-noded hexahedral elements. The F-bar method de Souza Neto et al. (1996) is applied for the sake of the robustness of the implementation when the nearly incompressible behaviour of the material is enforced in the finite deformation regime.
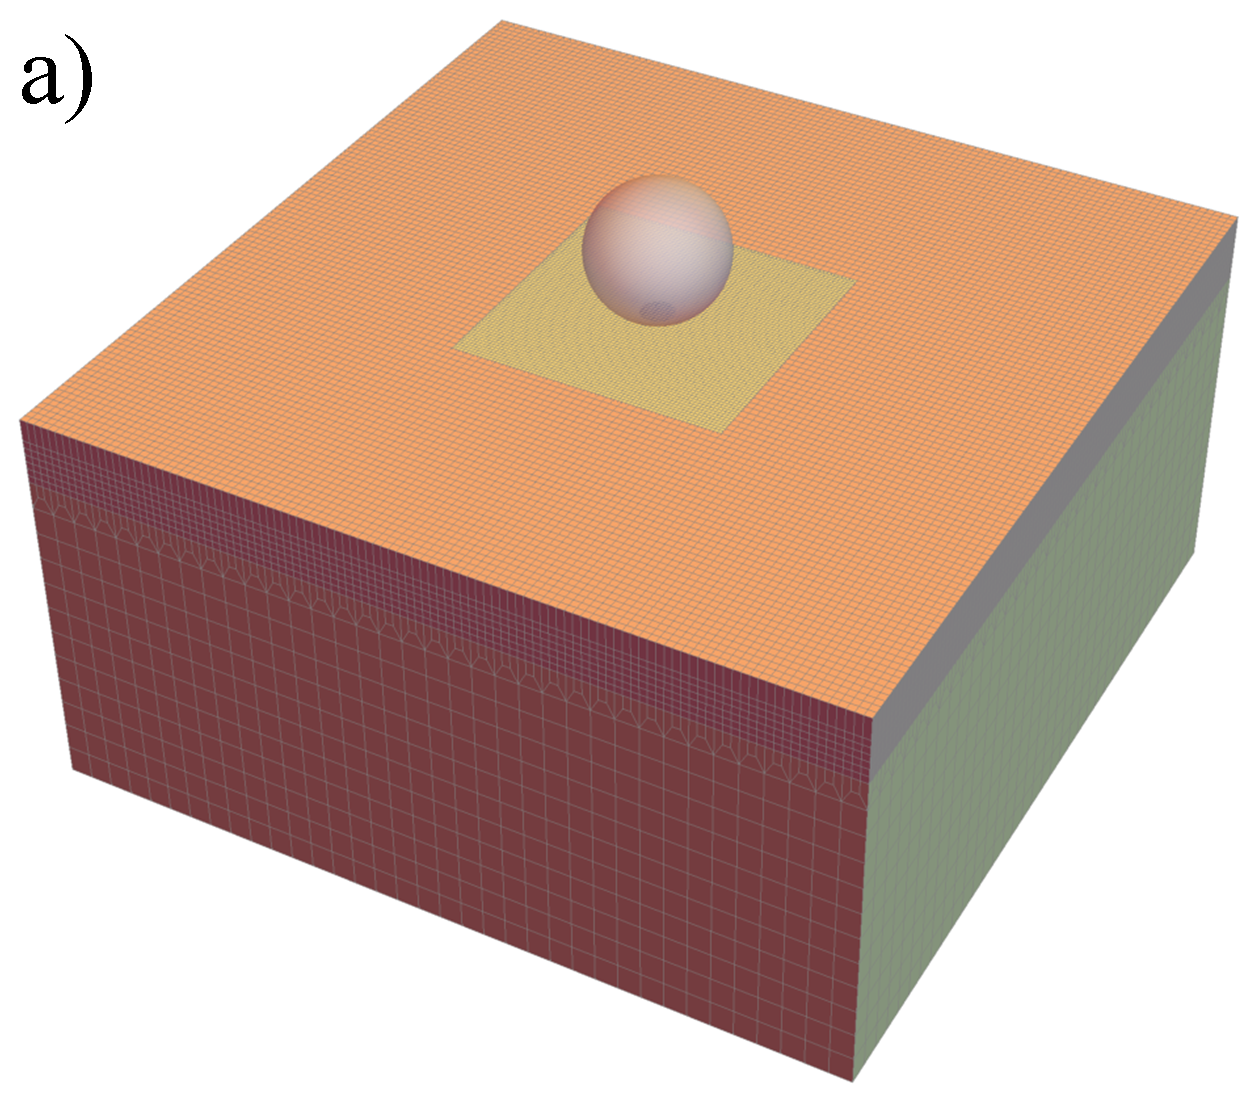
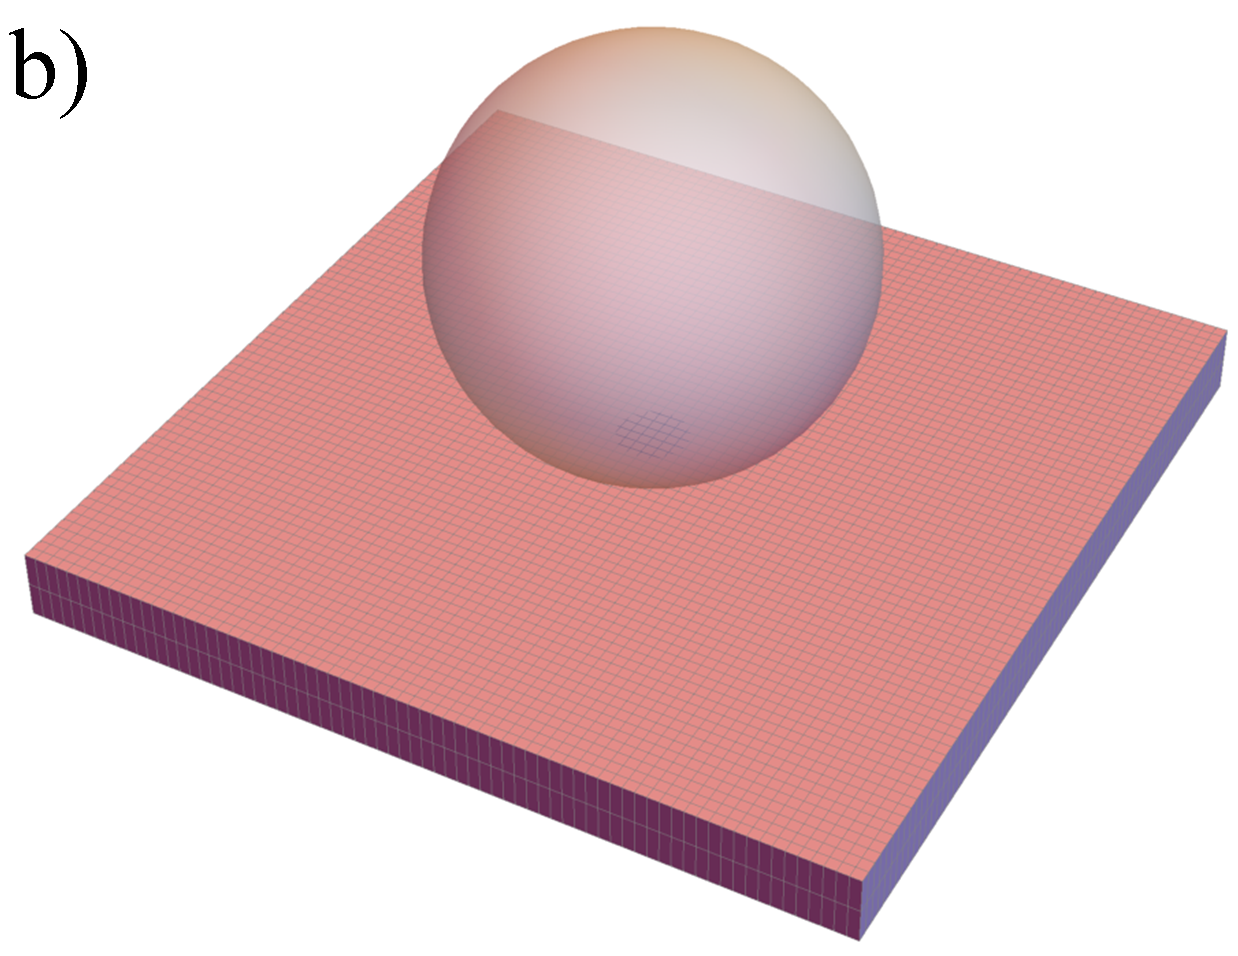
The mesh used to perform the simulations is similar to the one used in Frydrych (2019) and shown in Fig. 2. The applied mesh density is not necessary from the point of view of the solution convergence (see Frydrych (2019) for mesh convergence analysis) but it is done in order to get an excellent resolution of the surface topography maps. The dimensions of the whole mesh along x and y directions are 60 nm and the height is equal to 30 nm. In total, the mesh is built using 121,824 linear hexahedral elements. The most refined region shown in Fig. 2b has x and y dimensions equal to 20 nm and is 1.67 nm thick. It was divided into 72 x 72 x 2 finite elements. The refined region is connected with the rest of the mesh using a hanging nodes formulation described in section 2.4 of Frydrych (2019).
The essential boundary conditions are applied as follows. The deformation of the lateral surfaces in the normal direction is set to zero. The bottom surface is forced to move in the positive z direction up to and the position of the indenter is fixed. This is of course equivalent to fixing the bottom surface along the z direction and moving the indenter in the negative z direction but the former approach was easier to implement.
The nanoindentation was simulated using the contact surface element implemented in AceGen. The spherical indenter is treated as a rigid ball. The 4-noded quadrilateral element with Lobatto quadrature is applied. In order to exactly fulfill the impenetrability condition:
| (17) |
the augmented Lagrangian formulation (cf. Lengiewicz (2008); Stupkiewicz et al. (2010); Frydrych (2019)) was used. In Eq. 17 denotes the normal gap and is the contact pressure. Similarly as in Frydrych (2019), friction was neglected here.
IV Results
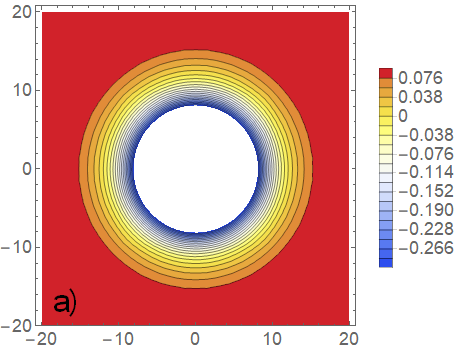
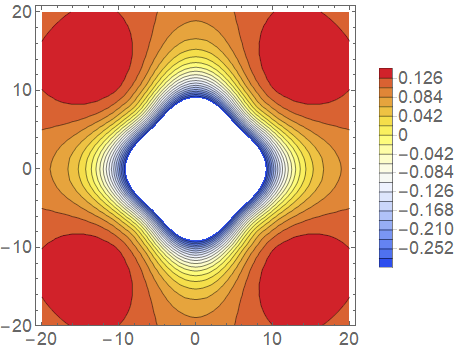
Fig. 3 shows the surface normal displacement maps obtained by using the isotropic plasticity model and the crystal plasticity model for 100, 110 and 111 orientations for a pure Ni sample. Since the spherical tip is considered, the surface topography resulting from the isotropic model simulation does not show any preferred direction. In addition, the symmetries predicted by the CP model directly reflect the crystallographic symmetry for a given crystallographic orientation. The results of the MD simulations with the same tip radius and maximum indentation depth are shown in Fig. 4. Since different methods were used, an exact quantitative agreement was not expected. However, the qualitative agreement in terms of the type of pile-up symmetry can be observed. In particular, one can see the four-fold symmetry for orientation 100 (cf. Fig. 3b and 4a), two perpendicular mirror planes with four pile-ups in the case of orientation 110 (cf. Fig. 3c and Fig. 4b) as well as the three-fold symmetry with mirror planes for orientation 111 (cf. Fig. 3d and Fig. 4c).
 |
 |
 |
 |
 |
 |
 |
As it was already discussed in the MD simulation section, in CSAs, the deformation by glide on crystallographic slip systems is less pronounced than in classical metals and alloys (cf. Fig. 1). In particular, the surface topography in nanoindentation is affected by crystal symmetry to a lesser extent and presents some degree of isotropy. This can be especially seen when comparing the MD results of the high entropy alloy with pure Ni for orientation 100 (LABEL:Fig4b and 4a), 110 (LABEL:Fig6b and 4b) and 111 (LABEL:Fig7b and 4c). Accounting for this effect was a goal of the combined isotropic-crystal plasticity model developed in section III.3. Fig. LABEL:Fig4a shows the surface topography after indentation predicted using this model for orientation 100 with equal contributions of isotropic and crystal plasticity (). Comparing with Fig. 3a and 3b one can clearly see the origin of this topography. This is in qualitative agreement with the MD result for HEA shown in LABEL:Fig4b.
Fig. LABEL:Fig5 presents the amount of accumulated plastic shear divided into a) isotropic (cf. Eq. 14) and b) crystal plasticity (cf. Eq. 11) contributions in the combined model for orientation 100. One can see that the observed effect of isotropization is indeed the result of simulataneous contributions of isotropic and crystal plasticity.
Figures LABEL:Fig6 and LABEL:Fig7 show the results analogous to LABEL:Fig4 for orientations 110 and 111, respectively. These pictures confirm that the observed effects are not related to any particular crystallographic orientation, which was expected.
V Discussion
Wang et al. Wang et al. (2021) studied the crystalline-to-amorphous phase transformation ahead of the crack tip in the NiFeCrCoMn Cantor alloy. Based on MD simulations with binary Cu-Al potentials, they concluded that the mechanism of transformation is the dislocation tangles development which finally lead to emergence of the amorphous phase. The severe increase of the dislocation density is due to high lattice resistance which limits the dislocation motion. The authors enlist also other possibilities to obtain amorphous phase by plastic deformation reported in the literature, such as cold rolling or high pressure torsion, where the transformation mechanism is similar. Moreover, as noted in Alabd Alhafez et al. (2019), the same amount of plastic strain in the multi-component alloy, as compared to pure metal, leads to a higher dislocation density in a smaller volume. This can finally lead to amorphization. Although in Alabd Alhafez et al. (2019) the amorphization was not observed in the case of the Cantor alloy subjected to indentation, this can be due to a different MD potential than the one used in Wang et al. (2021).
It is interesting to link these results to our findings. Note that the severe lattice distortion inherent in the structure of HEAs leads to a decreased peak intensity and greater peak width (cf. Alabd Alhafez et al. (2019); Mishra et al. (2021)) and high lattice friction leads to increased dislocation density. Even if the combination of those two effects does not lead to a fully amorphous system, it is expected that the system’s behaviour will be impacted by this added disorder so using the combined isotropic-crystal plasticity model as proposed here seems to be justified.
In our isotropic-crystal plasticity model, we have proposed that both the elastic and plastic deformation consists of isotropic and crystal components as this appeared as the most natural way of building the model. However, it was reported that elastic anisotropy of the Cantor alloy is actually higher than in the case of Nickel. In particular, the Zener anisotropy parameter
| (18) |
for Ni is equal to 2.51 Lewandowski and Stupkiewicz (2018), whereas for the Cantor alloy the reported values are 2.88 Gordon et al. (2021), 4.09 Zhang et al. (2018) and 4.15 Zaddach et al. (2013). The Zener parameter calculated for the elastic stiffness tensor calculated in Eq. 16 and parameters reported in Tabs. 2 and 3 is equal to 1.56 which is obviously much lower. Therefore, we decided to verify if the elastic anisotropy has any effect on the nanoindentation results presented here. Fig 9 shows the surface deformation for orientation 100 simulated with full elastic anisotropy taking elastic constants equal to GPa, GPa and GPa Zhang et al. (2018) (which yields ). Comparing with LABEL:Fig5a it can be concluded that no discernible difference can be seen and thus the results presented in the Results section are valid even though the high elastic anisotropy of HEAs was not taken into account.
Apart from indentation, in the vast majority of papers reporting mechanical tests of HEAs the response was analysed by uniaxial tension Gao et al. (2020); Fang et al. (2021); Lu et al. (2021); Zhang et al. (2022). Other types of tests include cyclic tension-compression Lu et al. (2020), fatigue Han et al. (2021) and shear-tension experiments Lu et al. (2021). However, it appears no one has systematically studied the yield surface of any HEA. Therefore, we provide the yield points calculated using our model in order to trigger the discussion and in order to show how the developed model works. They were calculated with a representative volume element (RVE) consisting of 1000 elements with random crystallographic orientations subjected to periodic boundary conditions (see Frydrych and Kowalczyk-Gajewska (2018); Frydrych et al. (2019) for details) with various ratios so as to achieve various points in the principal stress plane. The simulation was stopped when the accumulated plastic shear was equal to 0.002 and the stress tensor values were recorded at that point.
The normalized yield points (stress values divided by at yield at uniaxial tension) are shown in Fig. 10. The J2 yield surface is also provided. The highest differences appear in the biaxial state, therefore a close-up of this region is provided in Fig. 10b). One can clearly see that the power-law isotropic plasticity points (in green) are the most ooutward and the crystal plasticity model (black points) are the most inward. It should be however noted that maximum differences do not exceed 3%. The combined isotropic-crystal plasticity model provides the points that lie in-between the two which was expected. This proves that the model leads to reasonable predictions also for the polycrystalline case. Moreover, it can be concluded that the position of the yield point obtained with the combined model is driven by the value of the single parameter .
a)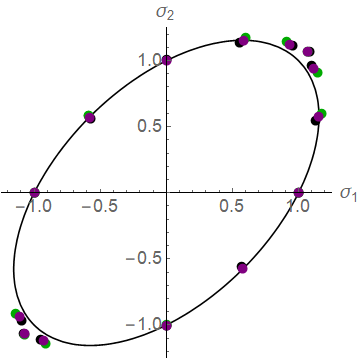 b)
b)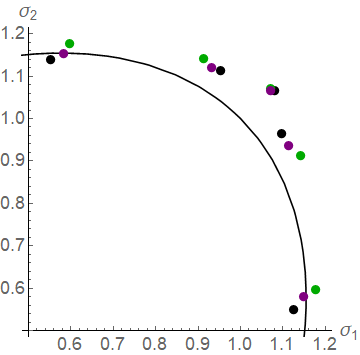

Qiu et al. Qiu et al. (2019) reported that compression in the case of Cantor alloy is associated with much higher stress than tension. Interestingly, even the elastic part of the stress-strain curve in compression and tension do not match each other. It should be noted that the geometry of tensile and compressive specimens in op. cit. was considerably different so it is hard to say if the effect is real or geometry-related. Moreover, no details on the procedure to avoid barelling in the case of compression specimens was supplied. On the contrary, Jang et al. Jang et al. (2016) who described their procedure to avoid barrelling in detail, did not observe any considerable tension-compression asymmetry while studying the same alloy composition. Therefore, we do not introduce any tension-compression asymmetry in our continuum model, bearing in mind that such asymmetry can be easily introduced in the case any real HEA to be studied presents such a behaviour.
VI Conclusions
In this paper, a continuum model of concentrated solid solutions has been proposed. Using the single parameter , the model combines the features stemming from both crystalline symmetries, as well as an isotropic disorder-induced contribution, in both elastic and plastic regimes. Definition of the model in the finite deformation regime enables us to perform simulations of nanoindentation tests. The predictions of the combined continuum model have been shown to be qualitatively consistent with atomistic (MD) simulations both in terms of the resulting surface topography maps and load-displacement curves. To the best of authors’ knowledge, this is a first study where lattice disorder, inherent in HEAs, is taken into account in the continuum crystal plasticity based model. In addition, such issues as amorphization and its relation to atomic disorder, as well as the effect of elastic anisotropy were discussed. Furthermore, the predictions of the normalized yield surface points obtained by subjecting a polycrystalline RVE to various periodic boundary conditions were supplied.
For validation, we have shown that the model predictions are qualitatively consistent with atomistic simulations, but it should be further validated by comparing with other lower scale models, such as discrete dislocation dynamics, as well as with experimental data. In particular, systematic investigations using nanoindentation and atomic force microscopy of various compositions starting from pure Ni and equiatomic CSAs as in Fig. 1 would provide adequate results to validate the proposed approach. Other ways of validating the reported model could be provided by experimental investigation of normalized yield surface in CSAs as compared to pure metals (cf. Fig. 10).
The model has been validated through molecular dynamics simulations of equiatomic CSA: NiFe, NiFeCr, NiFeCrCo, and Cantor alloys, possibly the most intensively studied HEAs to date. In the future, the proposed continuum model should be compared also against other CSAs. For this purpose, the proposed continuum model requires the development of an additional set of parameters that are in general different for each material studied. Here, as only the qualitative agreement with MD was sought, the parameter calibration step for the combined model was omitted (the parameters established separately for the crystal and isotropic plasticity models were used also in the continuum model). However, seeking for a quantitative agreement with experimental data, it should be calibrated. We have recently conducted the optimization of crystal plasticity parameters using evolutionary algorithm in a similar spirit to what was done in Chakraborty and Eisenlohr (2017), where the Nelder-Mead algorithm was applied for this task. In the future, we will apply our optimization approach in the CSA context so that the model is in quantitative agreement with the experimental data both in terms of the measured surface topography and the stress-strain response.
As pointed out in Antillon et al. (2020), the random occupation of lattice sites by constituent atoms (as observed in the Cantor alloy) is not common in other CSAs. Rather, the atomic configurations that are thermodynamically most stable typically present some chemical short range order (C-SRO). It is therefore interesting to check how C-SRO changes the material behaviour and whether these changes can be accounted for using the developed continuum model. To the best of author’s knowledge, there were so far no studies reporting MD simulations of nanoindentation in CSA with C-SRO. After such simulations are carried out, the surface topographies should be rigorously studied. However, we expect that the combined model will be able to capture the mechanical behaviour affected by the level of disorder by simply changing the value of a single parameter .
Other possible extensions or modifications of the model are straightforward, as in other constitutive descriptions of plasticity. Note that it is relatively easy to extend the model to address such phenomena as irradiation hardening (cf. e. g. Han (2012)) or indentation size effect (through strain gradient plasticity, cf. e. g. Ryś et al. (2022)), especially exploiting the automatic differentiation and automatic code generation of modern software such as MFRONT Helfer et al. or AceGen Korelc (2002). To the best of our knowledge, the effect of irradiation on the chemical disorder in CSAs was not thoroughly studied thus far. However, if the irradiation changes the chemical disorder considerably, we expect that the single parameter is going to capture this.
It is obvious that the proposed model accounts for phenomena emerging at the atomistic level. In particular, both the indenter’s radius and maximum penetration depth were set to 5nm. It is now interesting to tell whether the effects observed in MD simulations will be still present at the larger scale. The presented isotropic-crystal plasticity model was built in order to address the effects observed in MD. At the same time it is scale-insensitive – the same result will be shown for tip radius at the scale of nano-, micro- or millimeters provided that the depth-to-radius ratio is fixed. On the other hand, the observed ”isotropization” of the surface topography is related to dislocation patterns driven by atomic-scale chemical disorder. It should be examined using dedicated experiments or simulations on larger material volumes (e. g. discrete dislocation dynamics) whether this effect disappears when the indented volume is larger. After answering this question, it will become clear whether the proposed model is general and can be applied at a larger scale or its area of application is limited to the nanometer scale. Moreover, if the effect of chemical disorder gradually diminishes with increasing the sample volume, this will give rise to the size effect different from the one driven by presence of geometrically necessary dislocations. However, the former one can be simply captured by varying the single parameter and only the treatment of the latter needs a strain gradient plasticity approach as e.g. in Ryś et al. (2022).
Acknowledgments
We acknowledge support from the European Union Horizon 2020 research and innovation program under grant agreement no. 857470 and from the European Regional Development Fund via the Foundation for Polish Science International Research Agenda PLUS program grant No. MAB PLUS/2018/8. We acknowledge the computational resources provided by the High Performance Cluster at the National Centre for Nuclear Research in Poland. Karol Frydrych acknowledges fruitful discussions with prof. Katarzyna Kowalczyk-Gajewska from IPPT PAN.
Appendix A Derivation of the velocity gradient for the isotropic part of the model
We build the isotropic plasticity model starting from the Perzyna-type viscoplastic model defined within the infinitesimal strain theory. In such a model, the J2 yield surface appears:
and the plastic part of the velocity framework is defined as follows:
When we represent the tensors in the index notation, this has the following form:
Which, in direct notation is equivalent to:
On the other hand, when switching to the finite strain formulation the derivative is taken wrt. to the Kirchhoff stress . Therefore:
Which, in direct notation is equivalent to:
Then, we create an ad hoc modification so that the velocity gradient is analogous to the one appearing in the power law crystal plasticity:
References
- Osetsky et al. (2018) Y. N. Osetsky, L. K. BĂ©land, A. V. Barashev, and Y. Zhang, Current Opinion in Solid State and Materials Science 22, 65 (2018).
- Zhao et al. (2021) S. Zhao, Z. Li, C. Zhu, et al., Science Advances 7, eabb3108 (2021).
- Kaushik et al. (2021) L. Kaushik, M.-S. Kim, J. Singh, J.-H. Kang, Y.-U. Heo, J.-Y. Suh, and S.-H. Choi, International Journal of Plasticity 141, 102989 (2021).
- Otto et al. (2013) F. Otto, Y. Yang, H. Bei, and E. George, Acta Materialia 61, 2628 (2013).
- Kurpaska et al. (2022) L. Kurpaska, F. Dominguez-Gutierrez, Y. Zhang, K. Mulewska, H. Bei, W. Weber, A. Kosinska, W. Chrominski, I. Jozwik, R. Alvarez-Donado, S. Papanikolaou, J. Jagielski, and M. Alava, Materials & Design 217, 110639 (2022).
- Fang et al. (2021) Q. Fang, J. Peng, Y. Chen, et al., Mechanics of Materials 155, 103744 (2021).
- Renner et al. (2016) E. Renner, Y. Gaillard, F. Richard, F. Amiot, and P. Delobelle, Int. J. Plast. 77, 118 (2016).
- Yao and You (2017) W. Yao and J. You, Philos. Mag. 97, 1418 (2017).
- Wang et al. (2018) Z. Wang, J. Zhang, H. ul Hassan, J. Zhang, Y. Yan, A. Hartmaier, and T. Sun, Int. J. Mech. Sci. 148, 531 (2018).
- Frydrych (2019) K. Frydrych, Comput. Methods Mater. Sci. 19, 41 (2019).
- Lu et al. (2021) P. Lu, T. Zhang, D. Zhao, S. Ma, Q. Li, T. Wang, and Z. Wang, Journal of Alloys and Compounds 851, 156779 (2021).
- Gao et al. (2020) T. Gao, D. Zhao, T. Zhang, T. Jin, S. Ma, and Z. Wang, Journal of Alloys and Compounds 845, 155911 (2020).
- Han et al. (2021) Q. Han, X. Lei, S.-S. Rui, et al., International Journal of Fatigue 151, 106385 (2021).
- Lu et al. (2020) X. Lu, J. Zhao, C. Yu, Z. Li, Q. Kan, G. Kang, and X. Zhang, Journal of the Mechanics and Physics of Solids 142, 103971 (2020).
- Zhang et al. (2022) X. Zhang, X. Lu, J. Zhao, Q. Kan, Z. Li, and G. Kang, International Journal of Plasticity 150, 103201 (2022).
- Gordon et al. (2021) J. Gordon, R. Lim, M. Wilkin, D. Pagan, R. Lebensohn, and A. Rollett, Acta Materialia 215, 117120 (2021).
- Tazuddin et al. (2016) Tazuddin, K. Biswas, and N. Gurao, Materials Science and Engineering: A 657, 224 (2016).
- Lebensohn and Tomé (1993) R. A. Lebensohn and C. N. Tomé, Acta Metall. Mater. 41, 2611 (1993).
- Choi et al. (2018) W. M. Choi, Y. Jo, S. Sohn, et al., npj Comput Mater 4, 1 (2018).
- Alabd Alhafez et al. (2019) I. Alabd Alhafez, C. J. Ruestes, E. M. Bringa, and H. M. Urbassek, Journal of Alloys and Compounds 803, 618 (2019).
- Qi et al. (2021) Y. Qi, T. He, H. Xu, Y. Hu, M. Wang, and M. Feng, Journal of Alloys and Compounds 871, 159516 (2021).
- Ruestes and Farkas (2022) C. J. Ruestes and D. Farkas, Computational Materials Science 205, 111218 (2022).
- Varillas et al. (2017) J. Varillas, J. Ocenasek, J. Torner, and J. Alcala, Acta Materialia 125, 431 (2017).
- Qiu et al. (2021) Y. Qiu, Y. Qi, H. Zheng, T. He, and M. Feng, Journal of Applied Physics 130, 125102 (2021).
- Thompson et al. (2022) A. P. Thompson, H. M. Aktulga, R. Berger, D. S. Bolintineanu, W. M. Brown, et al., Computer Physics Communications 271, 108171 (2022).
- Dominguez-Gutierrez et al. (2021) F. Dominguez-Gutierrez, S. Papanikolaou, A. Esfandiarpour, P. Sobkowicz, and M. Alava, Materials Science and Engineering: A 826, 141912 (2021).
- Frydrych and Kowalczyk-Gajewska (2018) K. Frydrych and K. Kowalczyk-Gajewska, Model. Simul. Mater. Sci. Eng. 26, 065015 (2018).
- Frydrych et al. (2019) K. Frydrych, K. Kowalczyk-Gajewska, and A. Prakash, Model. Simul. Mater. Sci. Eng. 27, 075001 (2019).
- Hill and Rice (1972) R. Hill and J. R. Rice, J. Mech. Phys. Solids 20, 401 (1972).
- Asaro and Rice (1977) R. J. Asaro and J. R. Rice, J. Mech. Phys. Solids 25, 309 (1977).
- Asaro and Needleman (1985) R. J. Asaro and A. Needleman, Acta Metall. 33, 923 (1985).
- Lewandowski and Stupkiewicz (2018) M. Lewandowski and S. Stupkiewicz, Int. J. Plast. 109, 54 (2018).
- Korelc (2002) J. Korelc, Eng. Comput. 18, 312 (2002).
- Wriggers (2008) P. Wriggers, “Nonlinear finite element methods,” (Springer Berlin Heidelberg, Berlin, Heidelberg, 2008) Chap. Automation of the Finite Element Method by J. Korelc, pp. 483–508.
- de Souza Neto et al. (1996) E. de Souza Neto, D. Peric, M. Dutko, and D. Owen, Int J Solid Struct 33, 3277 (1996).
- Lengiewicz (2008) J. Lengiewicz, “Analiza wrażliwości dla zagadnień kontaktowych z tarciem,” (2008), in Polish.
- Stupkiewicz et al. (2010) S. Stupkiewicz, J. Lengiewicz, and J. Korelc, Comput. Methods Appl. Mech. Engrg. 199, 2165 (2010).
- Wang et al. (2021) H. Wang, D. Chen, X. An, Y. Zhang, S. Sun, Y. Tian, Z. Zhang, A. Wang, J. Liu, M. Song, et al., Science Advances 7, eabe3105 (2021).
- Mishra et al. (2021) R. S. Mishra, R. S. Haridas, and P. Agrawal, Materials Science and Engineering: A 812, 141085 (2021).
- Zhang et al. (2018) H. Zhang, X. Sun, S. Lu, et al., Acta Materialia 155, 12 (2018).
- Zaddach et al. (2013) A. Zaddach, C. Niu, C. Koch, and D. Irving, Jom 65, 1780 (2013).
- Qiu et al. (2019) J. Qiu, T. Jin, G. Xiao, Z. Wang, E. Liu, B. Su, D. Zhao, and X. Shu, Journal of Alloys and Compounds 802, 93 (2019).
- Jang et al. (2016) M. J. Jang, S.-H. Joo, C.-W. Tsai, J.-W. Yeh, and H. S. Kim, Metals and Materials International 22, 982 (2016).
- Chakraborty and Eisenlohr (2017) A. Chakraborty and P. Eisenlohr, European Journal of Mechanics - A/Solids 66, 114 (2017).
- Antillon et al. (2020) E. Antillon, C. Woodward, S. Rao, B. Akdim, and T. Parthasarathy, Acta Materialia 190, 29 (2020).
- Han (2012) X. Han, Modeling of cavity swelling-induced embrittlement in irradiated austenitic stainless steels; Modelisation de la fragilisation due au gonflement dans les aciers inoxydables austenitiques irradies, Ph.D. thesis, Ecole Nationale Superieure des Mines de Paris Univ., Paris, France (2012).
- Ryś et al. (2022) M. Ryś, S. Stupkiewicz, and H. Petryk, Int. J. Plasticity (submitted) (2022).
- (48) T. Helfer, B. Michel, et al., 70, 994.