Pseudo-4D view of the growth and form of locked eutectic colonies
Abstract
We investigate solidification of an Al-Cu alloy as a model system to understand the emergence of patterns (such as lamellar, rod and maze-like) within eutectic colonies. To uncover the morphological transitions in situ and in 3D, we introduce here a new synchrotron-based procedure termed pseudo-4D X-ray imaging. Our method simultaneously maximizes the temporal (200 ms) and spatial resolution (0.692 2/pixel) over that of traditional imaging approaches. The wealth of information obtained from this procedure enables us to visualize the development of a crystallographically ‘locked’ eutectic microstructure in the presence of thermosolutal convection. This data provides direct insight into the mechanism of the lamella-to-rod transition as the eutectic accommodates fluctuations in interfacial composition and growth velocity. We offer evidence to show that this transition is diffusive. It is brought about by impurity-driven forces acting on the solid-solid-liquid trijunction that must overcome the stiffness of the solid-solid interfaces. Our pseudo-4D imaging strategy holds broad appeal to the solidification science community, as it can overcome the space-time trade-off in conventional in situ X-ray microtomography.
keywords:
Eutectic solidification, X-ray synchrotron radiation, 4D tomography, Solidification microstructures, Anisotropy1 Introduction
Eutectics exhibit outstanding mechanical and electrical properties because their polyphase microstructures act as natural or in situ composite materials [1, 2, 3]. The microstructures of eutectics oftentimes show a structural hierarchy in the nanometer to micrometer regime, which arises during solidification. As the eutectic grows into the undercooled liquid, the interdiffusion between the solid phases at the duplex growth front leads to spacing selection [4, 5]. Based on a stability analysis, Datye and Langer [6] showed that the eutectic will self-organize into a variety of steady-state, tilted, and oscillating structures. These solid phases may, in turn, be arranged in cells or colonies, a type of long wavelength instability. The length-scale of the cells is typically 10-100× that of the lamellar spacing [7].
Cells form due to the presence of a third chemical component (so-called impurity), which induces a Mullins-Sekerka-type instability at the growth front [8, 9]. Provided the partition coefficient is below unity, the rejected impurity species will pile up at the eutectic-liquid interface. Above a critical ratio of where is the thermal gradient and is the growth velocity, the constitutional undercooling will render the interface unstable. In this scenario, the interface will form a protrusion leading to the rejection of impurity laterally and accumulation of impurity around the protrusion [7, 10, 11, 12, 13]. Technologically, eutectic solidification usually occurs in the presence of trace elements or impurities [14, 15, 16]; thus, solidification along a univariant pathway warrants further consideration.
Based on observations of solidification in organic eutectics, Trivedi has developed a morphological taxonomy of this long-wavelength instability [17]. Two-phase cellular or dendritic microstructures are common microstructures observed during non-planar solidification, including that of eutectics. These morphologies can begin as shallow, low-amplitude cells, i.e., “fan” or “needle”-shaped colonies, at growth rates just above the critical velocity. The former shows a fanning of lamellae at the eutectic-liquid interfaces whereas the needle colonies are aligned in a specific direction even if there is a macroscopic eutectic-liquid interfacial curvature. At higher velocities, deep cells termed cellular dendrites can form [18]. Such two-phase dendrites assume a nearly parabolic shape, which is similar to that of a single-phase dendrite tip, hence the name [17]. Somewhat akin to single-phase dendrites, the lamellae in eutectic dendrites may be arranged in primary and secondary branches, which are not collinear. These microstructures can be further understood as eutectic grains, where each grain is composed of crystals interlocked in a unique crystallographic orientation [19, 20]. The interphase anisotropy can influence colony microstructure such that the eutectic lamellae within a particular colony can become “locked” on a preferred crystallographic orientation and thus tilted with respect to the thermal gradient [21, 22, 23, 24].
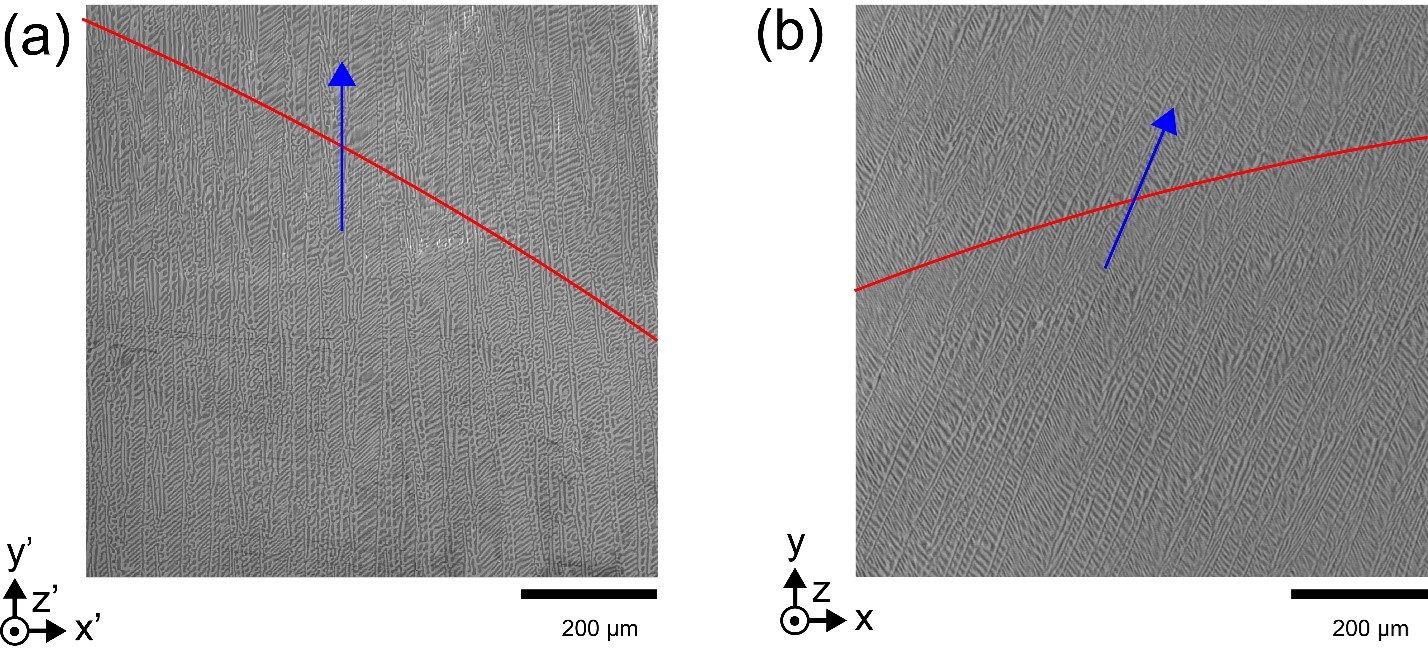
The 3D structure of eutectic cells has been debated since the 1960s [4, 25, 26] to present day [27, 28, 29]. A confounding issue is that investigators lacked suitable (i.e., 3D space- and time-resolved) measurements on the growth dynamics of eutectic colonies, as will be elaborated on below. Generally, past studies report a lamellar or rod-like microstructure or a coexistence of these two morphologies within eutectic colonies. Perhaps the earliest proposal is that one morphology is favored based strictly on the volume fraction of the minor phase [4]. That is, minimization of the interphase boundary energy (i.e., between solid phases) leads to a critical volume fraction below which rods are expected. This model utilizes the competitive growth principle, wherein selection of morphology is determined by which has the higher interface temperature under steady-state conditions. Recent extensions to this approach account also for the possibility of a coexistence between rods and lamellae [30] but do not predict where in the eutectic microstructure rods or lamellae may be found nor how the rods may transition into lamellae and vice versa. According to Chadwick [25], rods should be located preferentially at the edges of the eutectic colonies (Fig. 1(a)). From earlier, during growth, the cells in the eutectic-liquid interface reject impurity into the melt laterally and thus one would envision a higher concentration of impurity at the colony edges than center. Assuming the partition coefficients of the impurity in the solid phases are different (and below unity), the equilibrium temperatures of the two phases will be different and hence one phase () will grow ahead of the other (). Let us assume also that the imposed is such that the depressed phase is locally constitutionally supercooled. If, by chance, a rod-like protrusion forms at the -liquid interface, then this protrusion will be stabilized just like a cellular structure is stabilized [25]. The protrusion will reject solute radially, which then incorporates into the phase. That is, the protrusion of will be surrounded by a matrix of . Hunt [26] questioned this proposal, arguing that rods may not necessarily form at the edges of the colony. Instead, rods may be produced any time lamellae are forced to accommodate the curvature of the eutectic-liquid interfaces in a eutectic cell (Fig. 1(b)). That is, a lamellar structure is formed when the eutectic grows with a low interphase energy between the lamellae, and rods are produced when the local growth direction (indicated by the arrows in Fig. 1(b)) is furthest from this low energy, lamellar plane. The curvature of the cell causes rod formation away from the lamellae by Cahn’s rule [6, 13]. In this view, the area fraction of rods depends on the interfacial curvature and the volume ratio of the two eutectic phases.
In order to make sense of these mechanisms, we rely on experiments that capture the evolution of microstructure in eutectic colonies. To this end, full-field synchrotron-based X-ray imaging has opened a paradigm shift in solidification science, allowing us to visualize transient microstructural dynamics in optically opaque materials [31, 32, 33, 34, 35]. The traditional imaging strategy for dynamic in situ 4D (i.e., 3D space plus time) computed tomography (CT) experiments is to collect a series of forward transmitted X-ray projections whilst the sample is continuously rotated [36]; a sequence of projections from a 180° rotation is used to reconstruct successive volumes that show the microstructure formation in 4D [37, 38]. In such experiments, there is a fundamental trade-off between the spatial and temporal resolutions. That is, improving temporal resolution by reducing the number of projections or the exposure time of the camera leads to severe aliasing artifacts in the 3D reconstructions. Until now, the solidification dynamics of a regular eutectic (on the scale of the lamellar spacing) has been difficult to probe with 4D CT. This is because of the rapid growth velocity (on the order of tens of /s) and vanishingly small crystal dimensions (on the order of single ). Regarding the former, the eutectic-liquid interfaces would have advanced over within a time interval of 1 min, assuming a modest undercooling of 0.3 °C for an Al-Al2Cu eutectic. This growth velocity is prohibitively fast for any meaningful analysis of the solidification dynamics via 4D CT in the conventional approach. Here, we implement a novel imaging strategy termed “pseudo-4D imaging” that circumvents the above challenges. We achieve the highest reported temporal and spatial resolutions for 4D CT, see Fig. 2. We do this by digitally fusing data from two synchrotron-based experiments conducted in series, namely, X-radiography and X-ray tomography. In situ X-radiography (videomicroscopy) reveals the evolution of solid-liquid interfaces. Following solidification, ex situ X-ray tomography provides insight on the solid-solid interfaces in 3D.
In this paper, we invoke our new imaging procedure to gain insight on the detailed dynamics of pattern formation in metallic eutectic colonies. As alluded to above, our studies are focused on a eutectic between -Al and -Al2Cu, for which there is a test bed of information in the literature including the scaling relations between velocity, undercooling, and lamellar spacing [4, 39, 40, 41, 42, 43, 44]; the orientation relations, defined by a pair of parallel crystallographic planes and parallel directions within those planes [24, 45, 46]; and the crystallographic anisotropy of the solid-solid interfaces [47, 48, 49, 50, 51, 52, 53]. We show the dynamic microstructural adjustment mechanisms within Al-Al2Cu eutectic colonies under the influence of thermosolutal convection. Our real-time observations paint a clear picture on the mechanism of the lamella-to-rod transition in cells, as the eutectic accommodates changes in interfacial composition and growth velocity. With this information, we can test the predictions of existing theories. We observe a coplanar transition from a single lamella to multiple rods that is unlike previous models by Chadwick [11], Hunt [26], and others [4, 10, 30]. The transition reflects a competition between two opposing factors, an impurity-induced motion of the solid-solid-liquid trijunctions and an immobility of particular solid-solid interfaces. Our results reveal also an additional orientation relationship (OR) and a particular solid-solid interface within this OR that remains “locked” in eutectic solidification. We justify the existence of the latter by drawing upon Kraft’s “puckered” interface density description, which allows us to determine a minimum misfit between the two phases [47]. Our results provide the benchmark data to validate simulations (e.g., phase field) of microstructure evolution along a univariant solidification pathway in the face of thermosolutal convection and an anisotropy in solid-solid interface energy. Both factors are the norm and not the exception in solidification of technologically relevant eutectics.
2 Methods
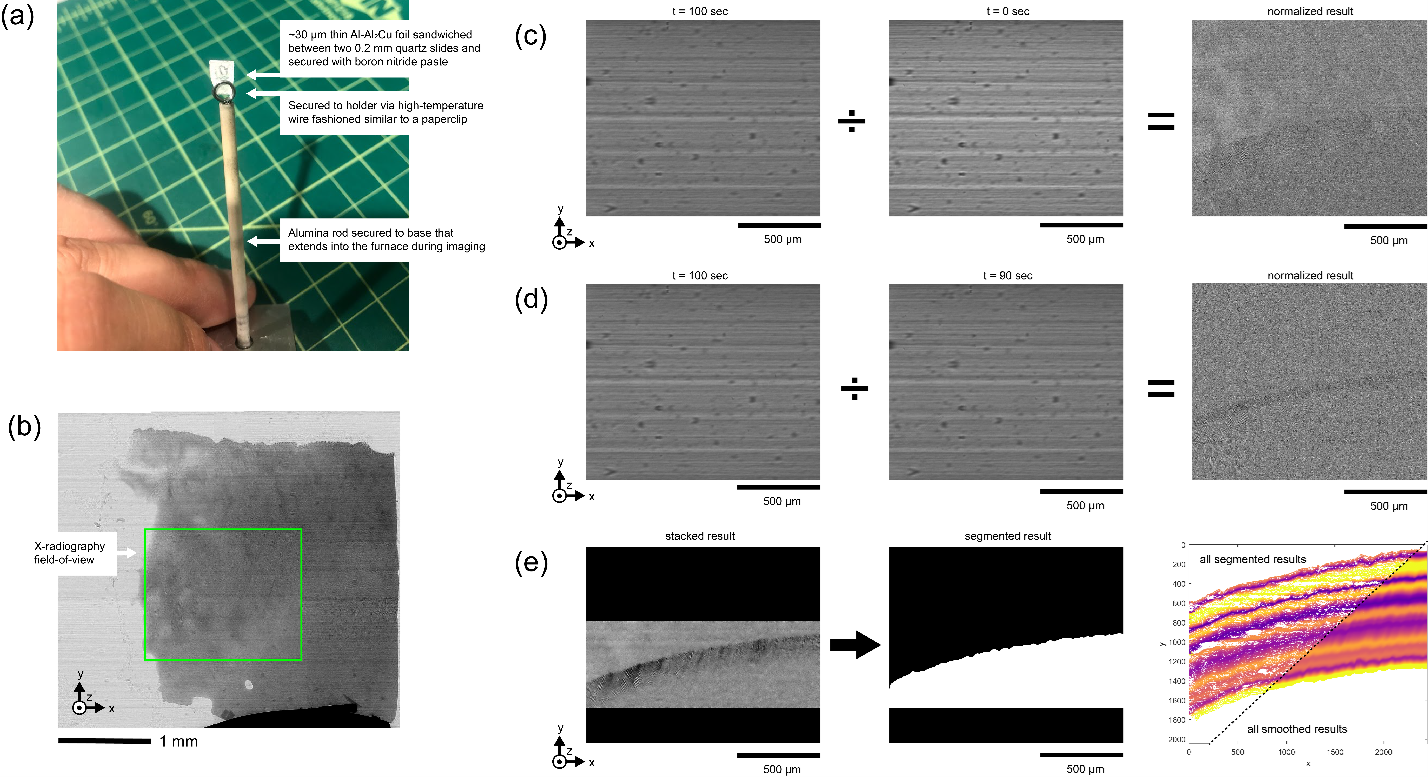
For the subsequent experiments, we used an Al-33wt%Cu alloy, corresponding to the eutectic composition in the Al-Cu system. The sample was cast at the Materials Preparation Center at Ames Laboratory (Ames, IA, USA) with high purity Al (99.99%) and Cu (99.99%). We confirmed the composition of the cast ingot via inductively coupled plasma mass spectrometry (ICP-MS), see Table S1. Further analysis via atom probe tomography (APT) on the sample solidified at the beamline revealed the presence of trace B, see Sec. 3.2. We prepared the sample in the shape of a thin foil by mechanically sectioning and polishing with 1200 grit SiC metallurgical paper. The foils were ultrasonically cleaned in isopropanol, sandwiched between two quartz slides, and then secured with boron nitride paste following the approach used in Refs. [54, 55, 56], see Fig. S1(a-b) for additional details.
We conducted our experiments at sector 2-BM of Argonne National Laboratory’s Advanced Photon Source (Lemont, IL, USA). The synchrotron beamline is equipped with a resistive furnace, described elsewhere [55, 56, 57, 58, 59, 60]. We calibrated the temperature at the sample position with a thermocouple prior to the experiment. We then raised the furnace temperature to 560 °C (above the eutectic temperature of 548 °C) and held it there for 5 min. before cooling at a rate of 0.5 °C/min. for a total scan duration of 30 min.
As mentioned in Sec. 1, we first conducted an in situ X-radiography scan (at temperature) to retrieve the position of the eutectic-liquid interface as solidification progresses across the field-of-view (FOV). Then, we performed an ex situ CT scan to resolve the solid-solid interfaces in 3D. Refs. [61, 62] have used these techniques in series to estimate interfacial velocities and determine bulk microstructure zones in ceramic freezing experiments; the distinguishing feature in our work is that we have fused the datasets to obtain a cohesive picture of the solidification process (Fig. 2). A monochromatic X-ray beam operating at 20 keV was focused onto our sample and X-rays were converted to visible light using a thick LuAG:Ce scintillator. These digital images were collected using a FLIR Oryx CCD with a 5× magnifying objective lens, yielding pixel sizes of 0.692 2 within a FOV of 1689×2. X-radiographs (or projection images) were acquired for approximately 30 min. with an exposure of 200 ms, see Video V1 for the time interval spanning eutectic growth. The collected images were processed in MATLAB [63] to enhance the attenuation contrast between the solid and liquid phases, and hence delineate the eutectic-liquid interface. More specifically, we first normalized each image (corresponding to a distinct timestep) to remove detector artifacts, also referred to as flat-field correction [64, 65]. This was accomplished by using a pixel-by-pixel division operation between two successive images, namely, a frame of interest and a background frame [55, 56, 66]. Then, we limited the range of the pixel intensity values to four standard deviations from the mean to adjust for random dead pixels on the detector. Direct segmentation of these simply processed radiographs was nontrivial due to random noise and minimal contrast between phases. After some trial-and-error, we found success by performing two additional operations: we applied a non-local means filter [63] to the normalized frame to remove speckle noise while preserving edges; furthermore, we summed 100 normalized and filtered images to yield a single image (a technique commonly employed in visible light photography to reduce noise in astroimages). Stated differently, each pixel in the resulting, stacked image can be described as the sum of the pixels in the same spatial location within each image in the set of 100 images. This procedure improved image quality significantly (refer to Video V2). We then utilized Zeiss Zen Blue 3.1 with the Intellesis deep learning module [67, 68] to perform semantic segmentation, a pixel-based machine learning method, to identify the eutectic-liquid interface in the processed images. For this purpose, we supplied one dozen carefully and manually segmented images as training data. After training, the model was capable of tracing the eutectic-liquid interface, albeit with some residual noise (i.e., the interface was jagged and it also overlapped with interfaces in neighboring frames, two features that are unphysical). We overcame this lack of definition by applying an average filter along both spatial axes of all eutectic-liquid interfaces in combination to create smooth, non-overlapping interfaces at each timestep. Fig. S1(c-e) summarizes the data processing steps.
For the same foil sample, following eutectic solidification, we acquired an ex situ X-ray tomogram. We imaged the same FOV as in the above X-radiography experiment over a full 360° rotation, with a pixel size of 0.692 2, a total of 3000 projections, and an exposure of 200 ms. We used TomoPy [69], a Python-based open source framework for the analysis of tomographic data, to reconstruct the volume. Although it may appear to be redundant, collecting images over a span of 360° provided clarity on the as-solidified microstructure: the pairs of mirror images doubled the supplied projections for reconstruction and hence reduced detector noise. Within TomoPy, we first normalized the X-ray projections by the dark-field and white-field images. Normalization alone was not sufficient to correct for “ring”-shaped artifacts, which are typically caused by a combination of dead pixels in the CCD as well as beam instabilities. Such artifacts were corrected here via a combination of algorithms in Ref. [70]. After normalization and artifact removal, the data were reconstructed via the Gridrec algorithm [71], which is a direct Fourier-based method. Further details can be found in Ref. [69] and the references therein.
We digitally fused the two results to obtain a pseudo-4D view of the solidification process, see Fig. 3 for a sketch. We interpolated the spatial location of the eutectic-liquid interface onto the tomographic data, assuming there is no tilt of the interface in the direction of the X-ray beam (discussed later in Sec. 3.5). Video V3 shows the resulting transverse cross-sectional views. To our advantage, the two sample frames of reference are nearly equivalent such that this mapping is straightforward. We confirmed equivalence of the FOV between the two experiments by registering the data [63] and determining a < translation in the plane of the detector. Our procedure is a significant improvement over traditional 4D X-ray tomography (Fig. 2). In principle, the temporal resolution in pseudo-4D imaging is limited only by the frame rate of the camera. In addition, our imaging strategy eliminates the influence of convection caused by a centripetal acceleration of the sample during continuous rotation.
After the synchrotron experiment, we sought to analyze the same sample further via electron microscopy at our home institution, with a focus on the crystallographic orientation of the eutectic solid-solid interfaces. We removed the sample from the quartz slides and mechanically polished it with 1200 grit SiC metallurgical paper; next, we ion polished with Xe plasma to achieve a smooth surface for electron backscatter diffraction (EBSD). We collected Kikuchi patterns from a 196×2 region of the as-solidified microstructure, using a step size of in a hexagonal grid. To align the EBSD frame of reference with the X-ray frame of reference, we used an affine transformation such that the lamellae in both sets of images are oriented similarly, see Fig. S2.
By combining the X-ray and EBSD data, we can transform orientational data from the specimen () frame to the crystallographic () frame. Denoting the crystal symmetry operators as (obtained from Refs. [72, 73, 74]), and the orientation matrix of a given phase as (determined via EBSD), we can rotate the normal vectors of the solid-solid interfaces in (calculated from the tomographic data) to crystal directions in according to [75, 76]. This analysis is critical to deduce the crystal orientation of the solid-solid interfaces. That said, it is only applicable for a single crystal, in which case takes on a unique form. We will later prove this to be true in Section 3.4, i.e., the Al-Al2Cu eutectic consists of two interpenetrating single crystals.
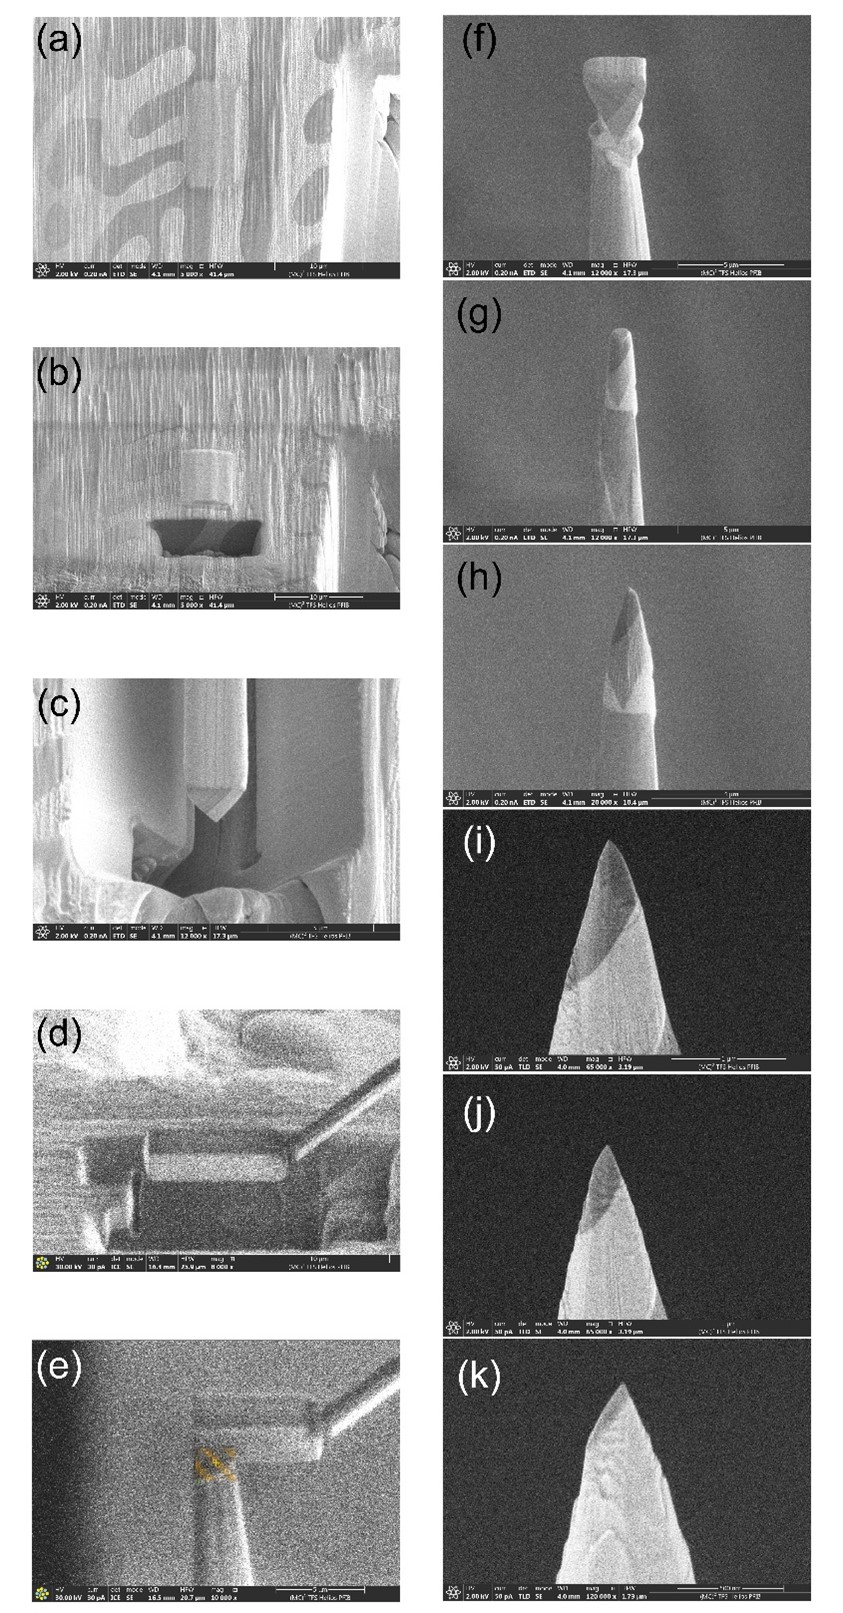
We further deduced the interfacial chemistry of the Al-Al2Cu phase boundary with the aid of atom probe tomography (APT) [77]. The APT tips were prepared by focused ion beam (FIB) milling using a Helios G4 Plasma FIB UXe (ThermoFisher Scientific, Hillsboro, OR). The region of interest was selected from the foil after solidification at the beamline to be near an area of larger average lamellar spacing (corresponding to lower growth velocity as discussed later in Sec. 3.2); it was first protected from FIB damage by capping the surface with several hundred nm thick Pt deposited using the electron beam at 2 kV accelerating voltage. A thicker layer of W was deposited on top of the Pt layer using the Xe ion beam at 12 kV accelerating voltage. FIB cuts were made at 30∘ normal to the surface using 30 kV Xe ions to produce a triangle shaped bar. The bar was extracted from the sample surface using a W manipulator needle and transferred to Mo posts. The Mo posts were cut into a standard 3 mm Mo TEM half-grid by FIB milling. The pieces of the bar were attached to the tops of the Mo posts using W deposited at 30 kV accelerating voltage. The posts were sharpened to points using a series of annular milling patterns at 30 kV accelerating voltage. Final tip polishing was performed with a circular pattern at 5 kV accelerating voltage. The atom probe tips were analyzed in a LEAP 5000X HR local electrode atom probe (LEAP) (Cameca Instruments Inc., Madison, WI). The specimen tip was run in laser pulsed mode using a pulse energy of 100 pJ per pulse at 125 kHz pulse repetition rate. The tip temperature was 25 K and the average detection rate for the experiment was 0.5% ions/pulse. The analyzed volume was reconstructed using the IVAS module within APSuite 6.1.0.26 (Cameca Instruments Inc., Madison, WI). The tip profile reconstruction method was used to reconstruct the dataset according to a high resolution SEM image of the sharpened tip acquired just prior to collecting the dataset. See Fig. S3 for additional details.
3 Results and discussion
3.1 Analysis of pseudo-4D data
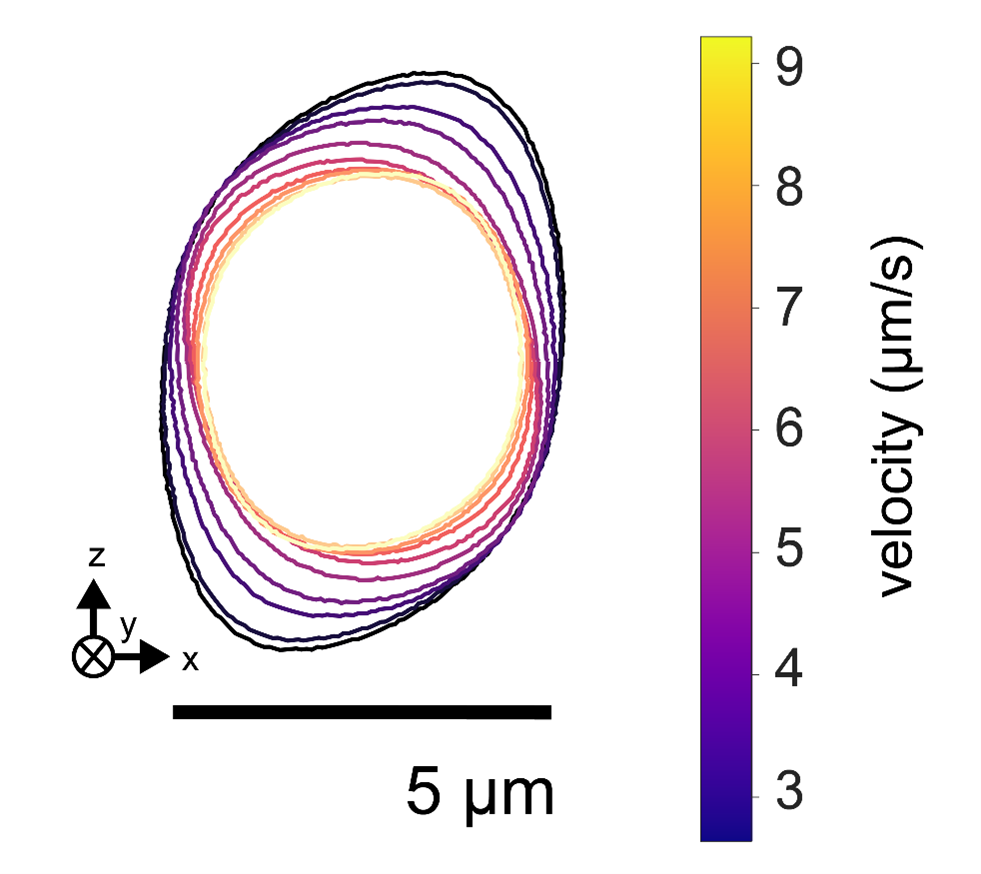
By examining the X-radiography data, we see the eutectic-liquid interface exhibits an oscillatory velocity. See Fig. 4(a), Fig. 5(a), and Video V1. A wealth of information can be quantified from this image stream. We begin with the velocity of the eutectic-liquid interface as it propagates along the positive direction (i.e., antiparallel to gravity). We calculated by fitting a second degree polynomial to each eutectic-liquid interface, and taking the derivative of the interfacial displacement in the direction. The average velocity of the eutectic-liquid interface oscillates between 3 to 9 for upwards of 4 periods within the FOV. The uncertainty in Fig. 5(a) represents the standard deviation of the calculated velocity. We also quantified the maximum curvature within the projected eutectic-liquid interface. We compute in a somewhat similar manner to , by fitting polygons to the points on the line, and then calculating the analytical curvature from the polygons [78]. The maximum curvature for a given time-step varies from 0.04 to 0.08 1 (absolute values, see Fig. 5(b)). We take the error range as the 10 to 90 percentile. Finally, we determined the thermal gradient along the direction, by taking into account the cooling rate and the amount of time for the growth front to propagate vertically across the FOV, see also Refs. [79, 80]. Ultimately, we find the thermal gradient is on the order of 1 K/mm.
As noted in Sec. 2, the spatial location of growth front can be mapped onto the tomographic volume to capture the development of two-phase microstructure within the eutectic-liquid interface (Fig. 4(b)). We now have two complementary perspectives of the solidification process, one from a side view (corresponding to the detector plane) and the other from a bird’s eye view (corresponding to the transverse cross-section). This provides access into a number of key microstructural attributes by way of the pseudo-4D reconstruction, beyond the curvatures and velocities of the eutectic-liquid interfaces. They include the lamellar spacing, area fraction of phases within the eutectic-liquid interface, and area fraction of Al rods. We determined the time-dependant average eutectic spacing (Fig. 5(c)) from the image autocorrelation on these transverse cross-sections [81, 82, 28], see Fig. S4. Peaks in the image autocorrelation are diffuse and provide real-space information on periodicity of microstructure. We derived so-called “primary” and “secondary” eutectic spacings as the next-nearest peak from the center along two corresponding lamellae directions and approximate the error as . We determined also the area fraction of the eutectic phases after segmentation (Fig. 5(d)). We selected an adaptive threshold [63] with sensitivity of 0.57, which yielded a reasonable segmentation upon visual inspection and also the expected phase fractions for this alloy (47% Al2Cu, by volume) [41]. Finally, we found the area fraction of Al rods (Fig. 5(e)) by applying a morphological criteria based on eccentricity and solidity [63] of connected components in the segmented, transverse cross-section. We selected a threshold of 0.9 for eccentricity (note line segments have an eccentricity of 1 while circles have an eccentricity of 0) and a threshold of 0.8 for solidity (convex shapes like circles have a solidity of 1). A connected component on the eutectic-liquid interface must have eccentricity less than and solidity greater than these values to classify as a rod. The reported fractional value represents the area fraction of Al that satisfies the criteria. We quantified the variation in area fraction and area fraction of Al rods across the transverse cross-sections using a series of overlapping windowed subsections: each window is wide with an incremental step size of along for a total of 180 windows. Despite the fact that the two eutectic phases have nearly equal area fractions (Fig. 5(d)), there is still a significant fraction of rods. This result is consistent with phase field simulations that depict a family of periodic and disordered configurations “in between” rods and lamellae [83]. We report in Fig. 5(d-e) the maximum and minimum average values of the windowed subsections as the corresponding error (grey bands). All results shown in Fig. 5 have been smoothed with windowed polynomial fits for clarity.
The velocity evolves out-of-phase with other measured attributes. That is, an increase in eutectic-liquid velocity corresponds to a decrease in the maximum eutectic-liquid curvature, average lamellar spacing, area fraction of Al2Cu, and area fraction of Al rods. We observe the converse for decreasing velocity. We next discuss the underlying source of these trends.
3.2 Origin of cells and their oscillatory velocity
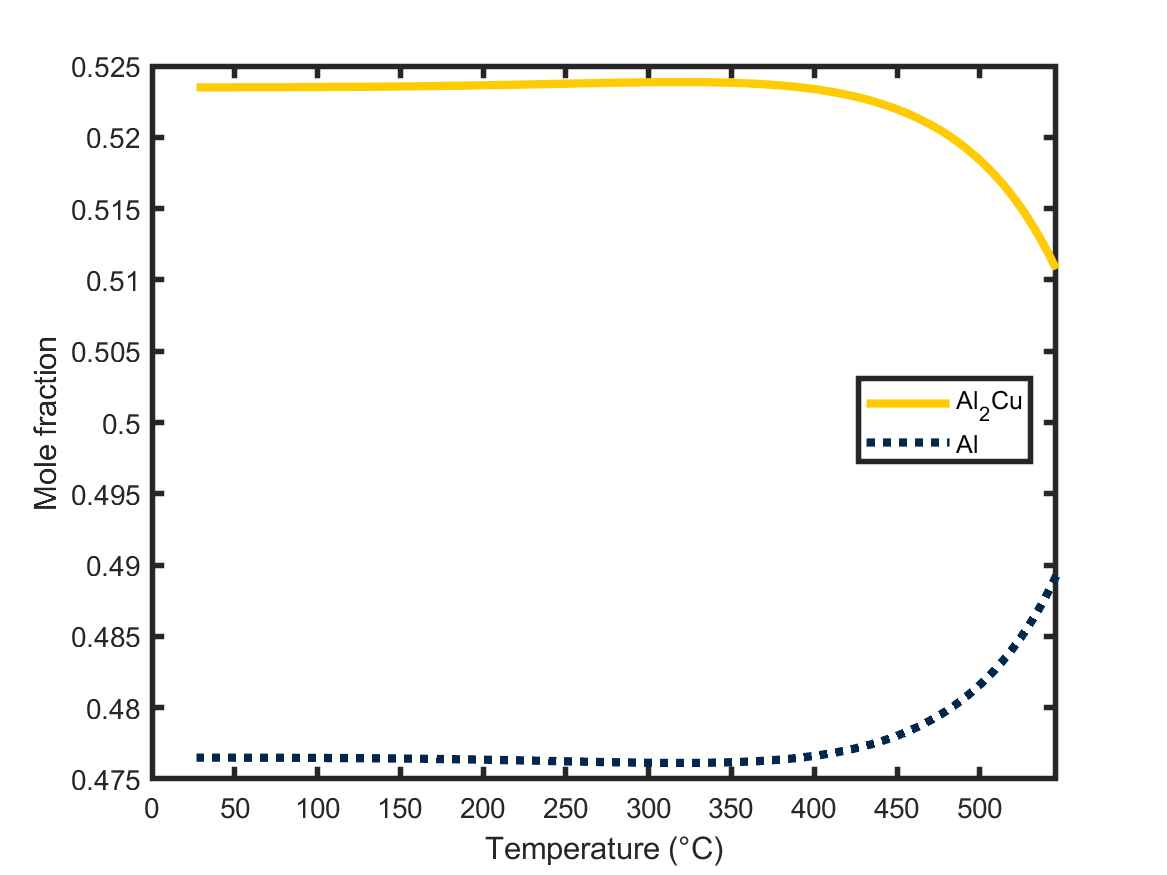
We begin by analyzing the APT dataset, which consisted of approximately 10 million ions and contained an Al-Al2Cu interface. The atoms detected within the reconstruction were Al, Cu, O, N, B, Xe. H was detected in the reconstructed volume but will not be considered in this analysis due to the uncertainty of the true H concentration in the sample compared to background levels in the UHV vacuum chamber. The Xe ions likely originated from implantation during FIB milling of the tip and are also not considered for futher analysis. The interface separating the Al from the Al2Cu phase was identified using a 10.0 at% Cu iso-concentration surface. The reconstructed view of the interface is shown in Fig. 6(a). The composition profile across the interface was measured using a proximity histogram [84] based on the Cu iso-concentration surface. A step size of 0.01 nm was used to generate the profiles which were then smoothed using a 0.5 nm moving average function. The resulting composition profiles for Al, Cu, and B are shown in Fig. 6(b). The compositions profiles of the Al and Al2Cu are not flat. Within the Al phase, the Al content becomes enriched closer to the interface and the Cu is correspondingly depleted. Within the Al2Cu phase, the Al profile shows a depletion near the interface and a corresponding increase in Cu concentration. These profiles suggest some solid-state growth of the Al2Cu phase following eutectic solidification. The exact shape of the composition profile is likely due to a combination of diffusion-controlled growth and varying equilibrium phase fractions upon cooling, see Fig. S5. Examination of the B concentration shows a peak located approximately 10 nm from the Al/Al2Cu interface with almost zero B detected on the Al side of the interface. This can be explained by the B being segregated at the Al-Al2Cu interface during eutectic solidification and then becoming trapped while the Al2Cu phase boundary shifted during diffusional growth. N and O were also measured in the composition profile and both N and O were observed to partition slightly to the Al2Cu phase, however interfacial segregation was not apparent.
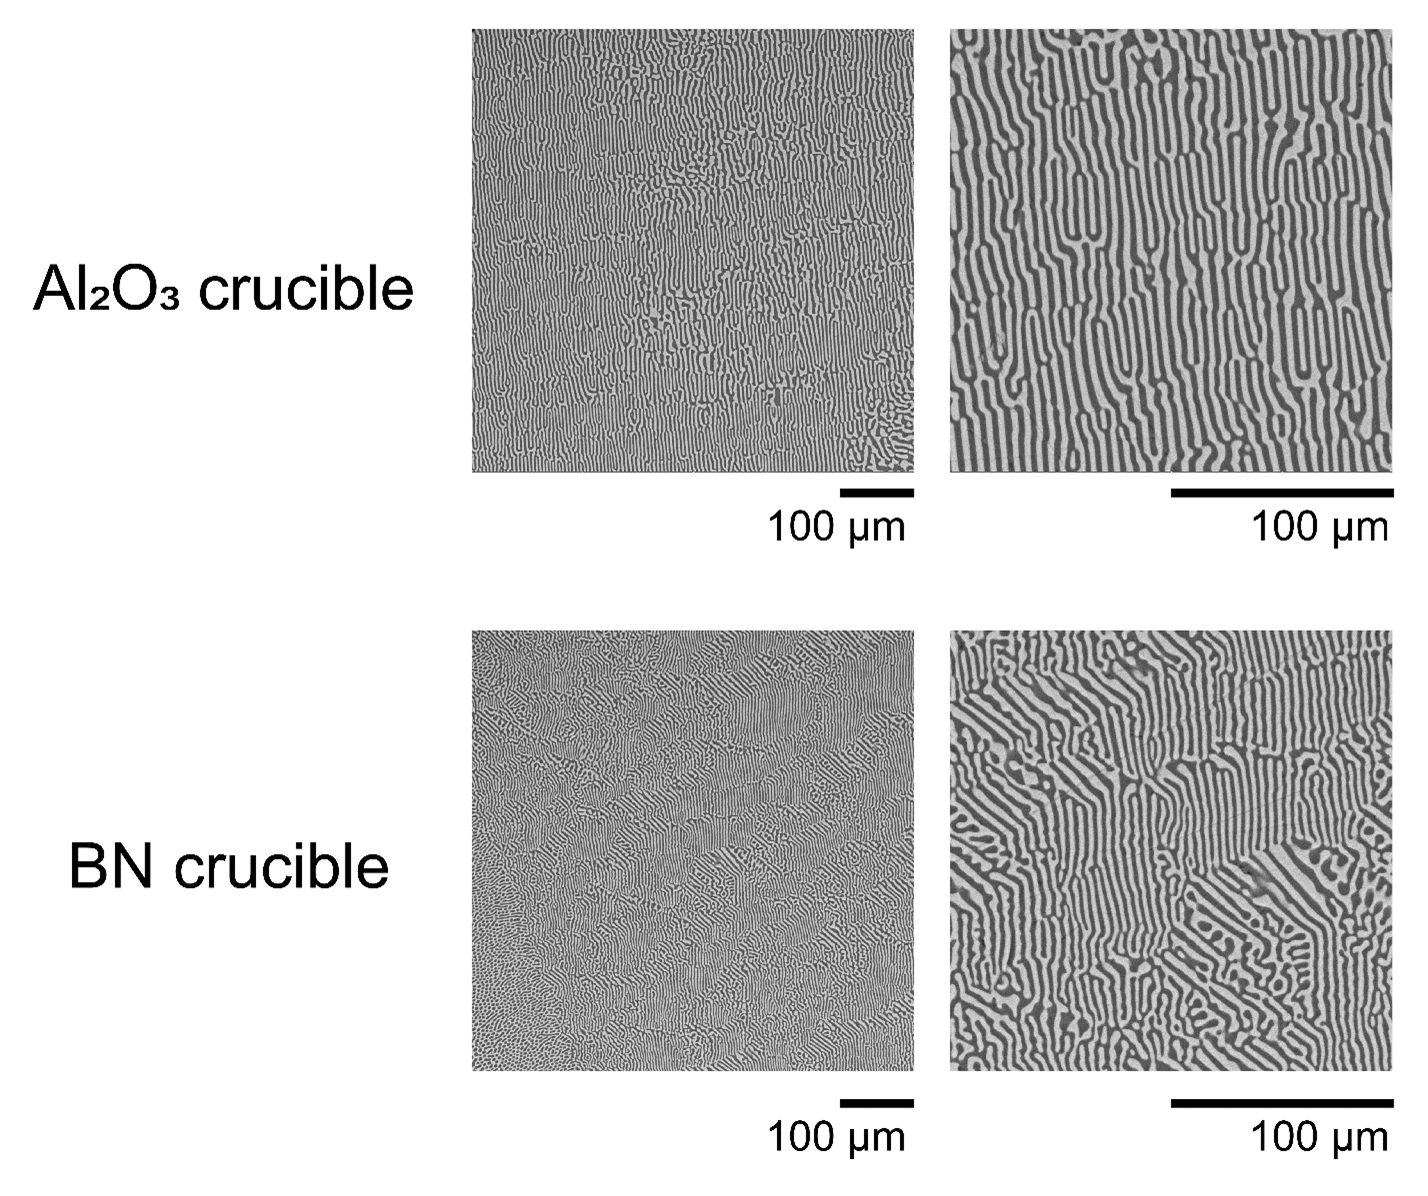
The observed eutectic cells in Figs. 3-4 are evidence of the morphological instability induced by the constitutional undercooling of an impurity species, which we determine as B from the above analysis of the interfacial chemistry. The suspected B likely originated from the BN paste used to secure the foil and quartz assembly, where the BN and molten Al will react to liberate B into the melt [85]. At 548 °C, it is expected that B would diffuse quickly through the thin, molten sample (the characteristic diffusion time is only 5 s in a sample of thickness ), relative to the 30 min. duration of the experiment, following a similar analysis done in Ref. [60]. As a cross-check, we solidified Al-Al2Cu eutectics with and without the BN; the results in Fig. S6 show dramatically different microstructures, which supports the idea of an underlying chemical effect. Accordingly, a planar interface will break down into an array of cells when the eutectic-liquid velocity exceeds a critical velocity, . The latter can be calculated using the following relationship [10, 14], . In our experiments, we take the values of thermal gradient (), solute (B) partition coefficient (), solute diffusivity in the liquid (), slope of the liquidus line (), and solute composition () to be , 0.08, [86], , and 10-1-10-2 at%, respectively.111The quantities , , and are not known for the ternary Al-Al2Cu-B system. Thus, in a manner similar to Ref. [87], we assume they are equal to the known quantities of the binary Al-B system. We find lies in the range -, which is in line with the order-of-magnitude of our experimentally observed velocities (Fig. 5(a)). Technically speaking, the above equation applies for an established and steady impurity boundary layer, while in our case transient conditions prevail. Nevertheless, others [88] have used the above equation to compute during an initial transient, without loss of generality.
The observed variation of the eutectic-liquid interface velocity in time suggests an unsteady impurity concentration field ahead of the solidification front. Note that fluid flow is otherwise negligible in binary eutectic alloys since the solute boundary layer, on the order of the lamellar spacing, is smaller than the fluid boundary layer, as noted in Ref. [89]. Instead, the instability arises due to thermosolutal convection of trace B in univariant solidification, and namely, cycles of B pile-up and convection away from the eutectic-liquid interfaces. The layer of rejected B at the eutectic-liquid interface (for , see above) is unstable and subject to buoyancy forces (B is lighter than the Al-Cu melt). This buoyancy force will overcome the fluid inertia and result in thermosolutal convection of B upwards (i.e., antiparallel to gravity) thereby disturbing the impurity boundary layer. In this configuration, the temperature gradient will have a stabilizing influence only when the thermal Rayleigh number (denoted , with a length-scale dependence based on ) is much greater than 10, according to a theoretical treatment [90]. We calculate where is the acceleration of gravity, is the thermal coefficient of expansion of the melt, is kinematic viscosity, and is the thermal diffusivity of the melt. The values of the last three parameters are given in Ref. [91] as , , and , respectively. This analysis indicates that the thermal field plays little role in restraining fluid flow. Consequently, the process of pile-up and ejection occurs with a characteristic frequency in time (Fig. 4). Ref. [92] also suggested an unstable solute field when an Al-Al2Cu eutectic is solidified in an upwards direction and in the presence of trace Si, although they offer no microstructural data for this particular case. Among the alternative scenarios that we have considered, none can satisfactorily explain this behavior: poor furnace control is not responsible because we do not see any such systematic variation in eutectic-liquid interfacial velocity in our other in situ solidification experiments [55, 56]. Marangoni convection is also not plausible because we observed no bubbles in the FOV nor in the sample overall (likely because it was degassed during casting). Furthermore, magnetohydrodynamic convection is unlikely in the presence of a small magnetic field (estimated as ) generated by the heating elements in the furnace. In comparison, Refs. [93, 94] have demonstrated that a relatively high magnetic field of at least 2 T is necessary to modify the Al-Al2Cu eutectic microstructure during directional solidification, although further research is necessary to ascertain the effect of magnetohydrodynamics on fluid flow.
Recently, Ref. [80] reported, through X-radiography observations, an oscillatory velocity for single-phase dendritic growth in Ni-based alloys. We attempted to follow a similar approach outlined in that paper by computing the impurity concentration ahead of the eutectic-liquid interfaces by application of the Beer-Lambert law. Unfortunately, however, we did not see direct evidence of impurity concentration variations in our X-radiography data. This is likely a result of the low concentration of B in the alloy. Given a sample thickness of , a beam energy centered on 20 keV, and assuming that B substitutes for Cu, the normalized intensity of X-rays on the detector would be 0.005% different from that of pure Al-33wt%Cu. In comparison, the normalized standard deviation of intensities in the bulk liquid is of the order 10%. Thus, calculation of the impurity composition profiles in the melt is beneath the detection limit of the instrument and thus may not be directly measurable by X-radiography. Nevertheless, the numerous macroscopic quantities measured in the fused 4D data reconstruction, shown in Fig. 5, and the B identified by APT, shown in Fig. 6, provide ample evidence of impurity-induced microstructural changes. These results are self-consistent with our description of thermosolutal convection that induces oscillations in eutectic-liquid interface velocity. Firstly, we consider the coupling between interfacial velocity and interfacial curvature (Fig. 5(a-b)). The formation of cellular protrusions causes the impurity to be rejected laterally, piling up at the roots of the protrusion. This would necessarily lower the interface temperature (by Alkamede’s theorem [95]), causing the formation of depressions. Depressions are associated with a maximal curvature of eutectic-liquid interfaces (refer to Fig. 5(b)). Conversely, increasing velocity leads to a decrease in maximum curvature of the eutectic-liquid interface: when the impurity flows upwards, the solid-liquid interface temperature will rise at the roots/depressions of the perturbation, causing the interface to accelerate into the liquid (thereby decreasing the curvature). These results are consistent with those of Ref. [96] who showed that the cell size tends to decrease with an increased impurity content, holding all else constant; that is, the higher degree of constitutional undercooling can only be relieved by a shorter lateral diffusion distance. Secondly, we observe that changes in velocity are coupled also to changes in area fraction of eutectic phases (Fig. 5(d)). It follows that the impurity species likely provokes a change in the diffusivity, solid-liquid interfacial energies, etc., which would, in turn, cause an increase in the undercooling of one particular phase. To maintain an isothermal eutectic liquid interface (as we see, on local, lamellar scales), the solid-liquid interfacial curvature would need to be reduced accordingly [27, 97, 98]. This leads to a departure of contact angles at the solid-solid-liquid trijunction, resulting in a driving force on the trijunction to restore the equilibrium contact angles. The volume fraction adjustment (observed experimentally in Fig. 5(d)) driven by trijunction movement regulates the boundary layer composition to bring the contact angles to their equilibrium values. The latter observation contradicts also the idea that the velocity oscillation is due to poor furnace control (vide supra, Sec. 3.1). If that were the case, then we would not expect to see the phase fractions oscillate in phase with the other measured attributes; they should be constant throughout (as in Ref. [91]), and only the lamellar spacing would adapt to the evolving interfacial velocity. These measured attributes are instead evidence of the microstructural adjustment to changes in interface velocity brought about by thermosolutal convection. It is only through a 4D analysis that they could be monitored in time. At this point, it is unclear if the increasing area fraction of Al rods is brought about by an increasing eutectic-liquid interfacial curvature (by Hunt’s proposal [26]) or by increasing the volume fraction of Al2Cu locally. There is support for both ideas from the data (Fig. 5). A closer look at the microstructure (below, Sec. 3.3) can help us deduce the underlying mechanism.
3.3 Structural consequences of an oscillatory velocity
The oscillation in velocity give us a unique opportunity to examine how the eutectic microstructure adapts to changes in growth conditions. We begin by placing our work on the same plane of analysis as others do in the realm of eutectic solidification, by measuring the relationship between eutectic-liquid interface velocity, , and lamellar spacing, , see Fig. 7. Our results show modest agreement with previous studies [39, 40, 41, 42, 43, 44] and Jackson-Hunt scaling behavior [4] (which applies also to univariant eutectics [99]), despite the fact that solidification proceeds under non-steady state conditions and with smoothly curved eutectic-liquid interfaces. The two preferred orientations of the solid-solid interfaces (termed “primary” and “secondary,” vide infra) invite a deeper inquiry into the spacing selection. It is clear the primary and secondary lamellae possess distinct spacings, see Fig. 5 and S4. One contributing factor is a different crystallographic orientation between the two types of solid-solid interfaces; the crystallographic orientations of both lamellar planes are examined later, in Sec. 3.4. The hysteresis in the vs. plane is not as pronounced as in recent work by Hecht [100], despite the higher eutectic-liquid interface acceleration in our work (on the order of here, compared to 106 there).
Altogether, these results offer new evidence on the transient structures within eutectic colonies, that do not satisfy previous theories. One is that the lamella-to-rod transition is provoked by a change in velocity [10]. If that were the case, we would expect rods to form at high velocity, as seen in other dynamic experiments [101]; yet we see the opposite here (cf. Figs. 5(a,e)). Furthermore, Chadwick’s model [25] does not hold merit for two reasons: Firstly, we would expect (by the logic in Ref. [25]) that the Al2Cu-liquid interface extends ahead of the Al-liquid interface (or vice versa). We do not see one phase grow substantially ahead of the other, at least at the resolution of the X-radiographs (0.692 2/pixel). Secondly, his proposal violates Young’s law at the trijunction. Instead, and as discussed previously (Sec. 3.2), the two phases adjust volume fractions to maintain an isothermal front. According to Hunt’s model [26], the eutectic is forced to accommodate the curvature of solid-liquid interface. Consequently, we would predict the growth of rods in a direction that is away from the preferred, low-energy lamellar plane, i.e., rods and lamellae are oriented differently. Instead, our pesudo-4D observations of a single colony in Fig. 8 and Video V4 paint a different picture, that of a coplanar transition. This can be considered as microstructural accommodation following a “locked” crystallographic growth direction (characterized below). Ultimately, we find that the selection of eutectic morphology (lamellae or rods) is a delicate balance between an impurity-induced change in solid volume fractions (stimulating a change in eutectic morphology) and a strong anisotropy of solid-solid interfacial energy (which tends to resist such a change). In fact, we see the latter effect constrains the lamella-to-rod transition to the lamellar plane, preserving the mirror symmetry of the pattern (unlike, e.g., a zigzag instability [102]). The volume fractions may become highly unequal on local scales: for example, at the early stages in Fig. 8(b), the Al phase occupies 75% of the growth front (by area) for a local region of 6.9 along (see boxed region); at the later stages, it takes up only 55% for this same patch of interface. Ultimately, the volume fractions will approach the global trends (Fig. 5(d)) for larger regions containing more than one lamella.
It remains to be determined the physical origin of the rod spacing that is selected in the lamella-to-rod transition. If the breakdown of the lamella is due to a capillary effect alone, i.e., a Rayleigh-Plateau instability [103], then the separation between rods at the transition should scale as the lamellar thickness . Instead, the instability may be governed by an interplay between capillary and diffusive effects, i.e., a Mullins-Sekerka instability [8], in which case should scale as the geometric mean of capillary and diffusion lengths (equivalent to the Jackson-Hunt spacing, a constant for a given velocity, cf. Fig. 7). In Fig. 9 we plot against for a particular 2 s window in time, during which we observed 14 lamellae of various thicknesses and orientations transforming into rods by the same mechanism shown in Fig. 8(c). It can be seen that is nearly invariant with respect to , which points not to a Rayleigh instability but to a diffusive transformation. We find the average rod separation in Fig. 9 of 5.1 ± 0.3 matches reasonably well the smallest stable eutectic spacing of for an interfacial velocity of [41], determined using the Jackson-Hunt model [4]. This finding is broadly in agreement with 3D phase field simulations [102].
We note also that the morphological transition is not reversible. As the volume fractions of the two phases become comparable on local scales, the same Al rods will not coalesce to form a lamella. Instead, the rods will flatten in cross-section and merge with other lamellar branches, a process that involves the collective interactions of many lamellae (not pictured).
Our observations in Fig. 8(c) and Video V5 bear some similarity to that of Refs. [100, 104], wherein transverse thermal gradients [104] and velocity changes [100] destabilize the steady-pattern formation in transparent eutectics. In Ref. [104], the authors observed a varicose instability that stimulates a coplanar transition from a lamella to rods. However, there are two key differences between their work and ours: firstly, in their case, lamellae are stabilized only by a wall/boundary effect while rods are ordinarily formed in their system-of-interest, succinonitrile(D),camphor. Meanwhile, the morphological transition in our case is provoked by an impurity effect. Secondly, anisotropy effects in succinonitrile(D),camphor (SCN-DC) are significantly weaker than in Al-Al2Cu. That is, the SCN- and DC-liquid interfaces are not only nonfaceted but also weakly anisotropic; furthermore, there exist no orientation relationship between SCN and DC [105]. In comparison, Al and Al2Cu form “epitaxial” eutectic grains during directional solidification [47, 48, 49, 50, 52, 53]. Thus, our rods are not circular in cross section (eccentricity of 0) but do show a slight elongation or ellipsoidal cross section (eccentricity of 0.7), see Fig. S7.222It follows from Fig. 9 that if , the rods will necessarily show an elongated shape when viewed cross-sectionally (trivial case). Yet even those few rods for which show a partially faceted shape, supporting the idea of an underlying anisotropy of solid-solid interfacial free energy. This geometry hints at a resistance to morphological instability due to a low-energy solid-solid boundary, an effect that is seen also in the capillary-driven evolution of pore channels in sapphire during annealing [106].
3.4 Crystallography of ‘locked’ eutectic grains
Why do the lamellae follow specific orientations during growth? Why do they not ‘fan out’ as in past studies [17, 18] of eutectic cells? We suppose that there exists a preferred growth crystallography between Al and Al2Cu phases. We begin by characterizing the OR between the two phases. The orientation relationship in the sample deviates from the commonly observed Beta-6 and Alpha-4 orientation relationships reported in [47, 48, 49, 50, 52, 53] (See Fig. 10). Instead, we identify a new OR based on the EBSD data collected on the same specimen, following the method described in Ref. [24]. We calculated the mismatch angle between -Al and -Al2Cu lattice planes, and the angle between directions belonging to those planes [74]. We considered planes and directions with Miller indices lower than 5. We dismissed pairs of common planes and common directions with and angles larger than a threshold value of 8°. On this basis, we designate the new OR as with of 3.34°and with of 6.88°.
By aligning the EBSD and X-ray tomography frames of reference, we can achieve a crystallographic description of the eutectic solid-solid interfaces (and specifically, the normal vectors along these interfaces), see Fig. 11. We first examine the orientation of microstructural features relative to each other (Fig. 12(a)). The angle between the normal vectors of primary and secondary lamellae is . Intriguingly, the growth direction (GD) of primary rods (here, “primary rod” indicates that the rods emerge from a primary lamella during solidification) is orthogonal to both lamellar normals. The growth direction of secondary rods is inclined around 30° to the primary rod growth direction. By this nomenclature, the primary rods are within the primary lamellar plane, and likewise for the secondary rods.
Next, we invoke the textural data from EBSD to transform the solid-solid orientations from specimen to crystallographic frame (as described in Sec. 2 and depicted in Fig. 11). The Al and Al2Cu inverse pole figures (IPFs) in Fig. 12(b-c) represent the crystallographic orientations of the primary and secondary lamella normals. With the aid of these results, we are able to determine completely the interfacial bi-crystallography. The habit planes of Al and Al2Cu are not the expected dense, low index planes [107]. Instead, we find the primary lamella habit plane is oriented along // and the secondary lamella habit plane is // . In the crystal frame, the angle between the two habit planes is , which falls within the error margins of our finding from above.
This interface between Al and Al2Cu is semicoherent [45, 46, 108, 109]. Generally, the minimum in interfacial energy for a semicoherent interface should correspond to a low misfit and hence a reduced lattice strain, not accounting for chemical or thermal contributions [46]. We define the lattice misfit as ), where subscripts indicate the two eutectic phases that meet at a solid-solid interface [45, 46]. The atomic density of a lattice plane is , where is the number of atoms per unit cell in the plane, the interplane spacing, and the volume of the 3D unit cell. Unfortunately, this definition forces the selection of a specific atomic layer which may have variable atomic density [24, 107]. We bypass this limitation by following Kraft’s description of a “puckered” interface to calculate the atomic planar density [47]. He describes a “puckered” atomic plane as one that accommodates additional atoms above and below it. By accounting for atoms that are not strictly on the plane but close to it, the density difference between the planes can be reduced (vide infra). In this way, we determine a minimum misfit across the primary lamellar interface as 0.01% for 8 atoms/unit area of Al2Cu and 1 atom/unit area of Al; for the the secondary lamellar interface, we find a misfit of 4.57% for 3 atoms/unit area of Al2Cu and 1 atom/unit area of Al. Figs. 13(a-b) depict the corresponding puckered densities for the lamellar habit planes for increasing thicknesses. We have also included the atomic structure of these planes as a visual aid similar to Kraft’s original sketch [47]. These lattices are oriented according to the OR determined by EBSD. Overlaying both atomic lattices can yield additional details such as 2D lattice strain tensors and coincident site lattice descriptions for these interfaces, as described elsewhere [52]. Though the puckered interface density has been used to explain ORs in Al-Al2Cu [47], the model may not necessarily apply to all eutectic systems [110].
The aforementioned theory holds for pristine or chemically pure Al-Al2Cu interfaces. In univariant solidification, however, the impurity species may segregate to the semicoherent solid-solid interfaces (as in Fig. 6). In a similar vein, APT shows that trace Si chemically modifies the semicoherent interface structure and lowers the solid-solid interfacial Gibbs free energy five times more than that of a coherent interface in precipitates embedded in the Al matrix [111]. The sequence of volume renders in Fig. S8 indicates that primary lamellae predominate at low velocity (corresponding to a greater impurity concentration in the boundary layer and presumably also a greater impurity segregation to the lamellar interfaces). It stands to reason, then, that B may stabilize this particular primary interface over that of the secondary lamellae (via Gibbs adsorption [111]). A sequence of renders demonstrating such lamella-to-lamella transitions are included in Fig. S8. We await confirmation of this idea via atomistic modeling of the interfacial structures in eutectics.
Based on rotating directional furnace experiments [21], large tilted domains can persist due to interfacial anisotropy. In many cases, the growth direction of the monocrystalline eutectic is the result of the initial seed crystal [107], not pictured in our experiments. Another consequence of a crystalline anisotropy is that the eutectic cells will appear to drift across the imaged FOV, as we see here in Fig. 4. A similar behavior is reported also in phase field simulations of locked eutectic grains [27].
3.5 Outlook on pseudo-4D tomography
The imaging strategy introduced in this study provides access to temporal and spatial resolutions scales that are not accessible in conventional 4D CT. Results presented here can lay the groundwork for future in situ tomography campaigns. Even so, one must bear in mind that there is one assumption that enables the pseudo-4D visualization with data fusion: when we extract and interpolate the 3D shape of the growth front from a projected view of the solidification process, we assumed that the eutectic-liquid interface is parallel to the beam direction. We do not know the ‘tilt’ of the growth front a priori but set it to be oriented along the beam direction for sake of simplicity. This assumption is strictly valid only in the limit that the sample thickness is infinitely reduced, corresponding to pseudo-2D solidification. With higher-resolution imaging, e.g., X-ray nanotomography [38], this assumption can be lifted: one can reproject the 3D microstructure to the detector plane and compare the solid-liquid interface against that of the actual X-radiograph. If the interface is tilted by an angle of in the direction of the X-ray beam, it should blur in the reprojected image by an amount , where is the sample thickness. By incrementally changing , one can find the tilt angle that results in a projection that is most similar in contrast to the X-radiograph, taken as ground truth. Efforts are underway to implement this approach.
Thin samples are otherwise beneficial for X-radiography, since it is difficult to interpret signals in projection images of thick (1 mm) samples. Yet the presence of surfaces leads to no-flux boundary conditions in solidification, which may influence solidification dynamics for sample sizes of less than 10-100×that of the eutectic lamellar spacing [13, 112]. For example, the lamella-to-rod transition may be restrained when the sample thickness is less than the wavelength of any instability threshold, thereby stabilizing lamellae [101].
Nonetheless, this technique is especially valuable when the final, solidified structure is the one that is growing during the in situ scan. Conversely, it is not applicable for solidification of metastable phases or transient states, which give way to stable ones during cooling at low rates. For this reason, pseudo-4D tomography is not suitable for capturing the peritectic transition, wherein the primary phase is consumed to yield a peritectic phase (a “perfect crime” since the latter “kills” the former phase in solidification [113]).
Conclusion
This study explores the evolution of Al-Al2Cu eutectic patterns along a univariant solidification pathway in the face of thermosolutal convection. To capture the transient microstructural details, we developed a new pseudo-4D approach that combines in situ X-radiography and postmortem X-ray microtomography. With this method, we achieve the highest reported temporal and spatial resolution for absorption-contrast X-ray imaging and gain unique insight into the solidification dynamics. Several conclusions can be drawn from this study:
-
1.
The influence of impurities (such as B, 0.01at%), is two-fold. It bring about a constitutional undercooling that destabilizes the eutectic-liquid interfaces at long wavelengths ( 10 ), giving rise to shallow cells or colonies. On shorter wavelengths, it changes the undercooling of one eutectic phase with respect to the other, which in turn changes the phase fractions and hence the eutectic morphology. Our time-resolved analysis provides evidence of these trends in phase fraction, morphology, and their relation.
-
2.
The eutectic accommodates the changes in phase fractions through a co-planar lamella-to-rod transition despite the resistance of ‘locked’ interfaces. The partially faceted morphology of the rods so-produced hints at a low-energy solid-solid boundary. Furthermore, the spacing between the rods is nearly invariant with the lamellar thickness, signifying a diffusive instability upon eutectic solidification.
-
3.
A multimodal crystallographic analysis (linking EBSD and pseudo-4D imaging) provides a complementary view of the microstructure. We detect a new OR and unexpectedly high index (yet low misfit) lamellar habit planes. As a result of this crystalline anisotropy, the eutectic colonies drift across the FOV, following the inclination of the habit planes with respect to the macroscopic growth direction.
Altogether, these results provides a fresh picture on the selection of eutectic patterns in systems with a strong anisotropy in solid-solid interfacial energy. Chemical effects give rise to a complexity in the dynamics of pattern formation that is not seen in nonvariant systems. We expect that pseudo-4D imaging may open other doors in solidification science, enabling researchers to test the predictions of theory with high precision.
Acknowledgements
We gratefully acknowledge financial support from the National Science Foundation (NSF) CAREER program under Award No. 1847855. We thank Dr. Caleb Reese, Aaron Gladstein, Dr. Francesco De Carlo, and Pavel Shevshenko for assisting in the synchrotron-based experiment. We also thank Drs. Silvère Akamatsu and Sabine Bottin-Rousseau for fruitful discussions. This research used resources of the Advanced Photon Source, a U.S. Department of Energy (DOE) Office of Science User Facility operated for the DOE Office of Science by Argonne National Laboratory under Contract No. DE-AC02-06CH11357. We also acknowledge the University of Michigan College of Engineering for financial support and the Michigan Center for Materials Characterization for use of the instruments and Bobby Kerns, Dr. Nancy Senabulya Muyanja, Dr. Tao Ma, and Dr. Haiping Sun for their assistance.
References
- Tiwary et al. [2022] C. S. Tiwary, P. Pandey, S. Sarkar, R. Das, S. Samal, K. Biswas, K. Chattopadhyay, Five decades of research on the development of eutectic as engineering materials, Progress in Materials Science 123 (2022) 100793.
- Glicksman [2011] M. E. Glicksman, Principles of Solidification, Springer New York, 2011. doi:10.1007/978-1-4419-7344-3.
- Aikin [1997] R. M. Aikin, The mechanical properties of in-situ composites, JOM 49 (1997) 35.
- Jackson and Hunt [1966] K. Jackson, J. Hunt, Lamellar and rod eutectic growth, Trans. Met. Soc. AIME 236 (1966).
- Kurz and Fisher [1992] W. Kurz, D. J. Fisher, Fundamentals of solidification, 3. rev. ed., reprinted ed., Trans Tech Publ, 1992.
- Datye and Langer [1981] V. Datye, J. S. Langer, Stability of thin lamellar eutectic growth, Physical Review B 24 (1981) 4155–4169.
- Plapp and Karma [1999] M. Plapp, A. Karma, Eutectic colony formation: a stability analysis, Physical Review. E, Statistical Physics, Plasmas, Fluids, and Related Interdisciplinary Topics 60 (1999) 6865–6889.
- Mullins and Sekerka [1964] W. W. Mullins, R. F. Sekerka, Stability of a planar interface during solidification of a dilute binary alloy, Journal of Applied Physics 35 (1964) 444–451.
- Caroli et al. [1986] B. Caroli, C. Caroli, B. Roulet, The Mullins-Sekerka instability in directional solidification of thin samples, Journal of Crystal Growth 76 (1986) 31–49.
- Tiller [1991] W. A. Tiller, The science of crystallization: microscopic interfacial phenomena, Cambridge University Press, 1991.
- Chadwick [1963] G. Chadwick, Eutectic alloy solidification, Progress in Materials Science 12 (1963) 99–182.
- Trivedi et al. [2002] R. Trivedi, P. Mazumder, S. N. Tewari, The effect of convection on disorder in primary cellular and dendritic arrays, Metallurgical and Materials Transactions A 33 (2002) 3763–3775.
- Plapp and Karma [2002] M. Plapp, A. Karma, Eutectic colony formation: A phase-field study, Physical Review E 66 (2002) 061608.
- Hecht et al. [2004] U. Hecht, L. Gránásy, T. Pusztai, B. Böttger, M. Apel, V. Witusiewicz, L. Ratke, J. De Wilde, L. Froyen, D. Camel, B. Drevet, G. Faivre, S. Fries, B. Legendre, S. Rex, Multiphase solidification in multicomponent alloys, Materials Science and Engineering: R: Reports 46 (2004) 1–49.
- Sargin et al. [2016] I. Sargin, A. L. Genau, R. E. Napolitano, Post-solidification effects in directionally grown Al-Ag2Al-Al2Cu eutectics, Journal of Phase Equilibria and Diffusion 37 (2016) 75–85.
- Steinmetz et al. [2018] P. Steinmetz, A. Dennstedt, M. Şerefoğlu, I. Sargin, A. Genau, U. Hecht, Crystal orientation relationships in ternary eutectic Al-Al2Cu-Ag2Al, Acta Materialia 157 (2018) 96–105.
- Trivedi and Sunseri [2008] R. Trivedi, E. Sunseri, Non-plane front solidification, in: S. Viswanathan, D. Apelian, R. J. Donahue, B. DasGupta, M. Gywn, J. L. Jorstad, R. W. Monroe, M. Sahoo, T. E. Prucha, D. Twarog (Eds.), Casting, ASM International, 2008, pp. 299–306. doi:10.31399/asm.hb.v15.a0005210.
- Han [1995] S. H. Han, Stability of a eutectic interface during directional solidification, 1995. doi:10.31274/rtd-180813-10182.
- Caroli et al. [1992] B. Caroli, C. Caroli, G. Faivre, J. Mergy, Lamellar eutectic growth of CBr4-C2Cl6: effect of crystal anisotropy on lamellar orientations and wavelength dispersion, Journal of Crystal Growth 118 (1992) 135–150.
- Akamatsu et al. [2001] S. Akamatsu, G. Faivre, S. Moulinet, The formation of lamellar-eutectic grains in thin samples, Metallurgical and Materials Transactions A 32 (2001) 2039–2048.
- Akamatsu et al. [2012] S. Akamatsu, S. Bottin-Rousseau, M. Şerefoğlu, G. Faivre, Lamellar eutectic growth with anisotropic interphase boundaries: Experimental study using the rotating directional solidification method, Acta Materialia 60 (2012) 3206–3214.
- Ghosh et al. [2015] S. Ghosh, A. Choudhury, M. Plapp, S. Bottin-Rousseau, G. Faivre, S. Akamatsu, Interphase anisotropy effects on lamellar eutectics: A numerical study, Physical Review E 91 (2015) 022407.
- Ghosh and Plapp [2017] S. Ghosh, M. Plapp, Influence of interphase boundary anisotropy on bulk eutectic solidification microstructures, Acta Materialia 140 (2017) 140–148.
- Bottin-Rousseau et al. [2018] S. Bottin-Rousseau, O. Senninger, G. Faivre, S. Akamatsu, Special interphase orientation relationships and locked lamellar growth in thin in-in2bi eutectics, Acta Materialia 150 (2018) 16–24.
- Chadwick [1962] G. A. Chadwick, Modification of lamellar eutectic structures, Journal of the Institute of Metals 91 (1962) 298–303.
- Hunt [1966] J. D. Hunt, The lamella -> rod transformation in eutectics, Journal of the Institute of Metals 94 (1966) 125–129.
- Lahiri et al. [2017] A. Lahiri, C. Tiwary, K. Chattopadhyay, A. Choudhury, Eutectic colony formation in systems with interfacial energy anisotropy: A phase field study, Computational Materials Science 130 (2017) 109–120.
- Aramanda et al. [2020] S. K. Aramanda, S. K. Salapaka, S. Khanna, K. Chattopadhyay, A. Choudhury, Exotic colony formation in Sn-Te eutectic system, Acta Materialia 197 (2020) 108–121.
- Aramanda et al. [2021] S. K. Aramanda, K. Chattopadhyay, A. Choudhury, Exotic three-phase microstructures in the ternary Ag-Cu-Sb eutectic system, Acta Materialia 221 (2021) 117400.
- Liu et al. [2011] S. Liu, J. Lee, R. Trivedi, Dynamic effects in the lamellar–rod eutectic transition, Acta Materialia 59 (2011) 3102–3115.
- Mathiesen et al. [2002] R. H. Mathiesen, L. Arnberg, K. Ramsøskar, T. Weitkamp, C. Rau, A. Snigirev, Time-resolved x-ray imaging of aluminum alloy solidification processes, Metallurgical and Materials Transactions B 33 (2002) 613–623.
- Yasuda et al. [2004] H. Yasuda, I. Ohnaka, K. Kawasaki, A. Sugiyama, T. Ohmichi, J. Iwane, K. Umetani, Direct observation of stray crystal formation in unidirectional solidification of Sn–Bi alloy by x-ray imaging, Journal of Crystal Growth 262 (2004) 645–652.
- Nguyen-Thi et al. [2012] H. Nguyen-Thi, L. Salvo, R. H. Mathiesen, L. Arnberg, B. Billia, M. Suery, G. Reinhart, On the interest of synchrotron x-ray imaging for the study of solidification in metallic alloys, Comptes Rendus Physique 13 (2012) 237–245.
- Clarke et al. [2015] A. J. Clarke, D. Tourret, S. D. Imhoff, P. J. Gibbs, K. Fezzaa, J. C. Cooley, W.-K. Lee, A. Deriy, B. M. Patterson, P. A. Papin, K. D. Clarke, R. D. Field, J. L. Smith, X-ray imaging and controlled solidification of Al-Cu alloys toward microstructures by design, Advanced Engineering Materials 17 (2015) 454–459.
- Shahani et al. [2020] A. J. Shahani, X. Xiao, E. M. Lauridsen, P. W. Voorhees, Characterization of metals in four dimensions, Materials Research Letters 8 (2020) 462–476.
- Patterson et al. [2018] B. M. Patterson, N. L. Cordes, K. Henderson, X. Xiao, N. Chawla, Data challenges of in situ x-ray tomography for materials discovery and characterization, in: T. Lookman, S. Eidenbenz, F. Alexander, C. Barnes (Eds.), Materials Discovery and Design: By Means of Data Science and Optimal Learning, Springer Series in Materials Science, Springer International Publishing, 2018, pp. 129–165. doi:10.1007/978-3-319-99465-9_6.
- Maire and Withers [2014] E. Maire, P. J. Withers, Quantitative X-ray tomography, International Materials Reviews 59 (2014) 1–43.
- Withers et al. [2021] P. J. Withers, C. Bouman, S. Carmignato, V. Cnudde, D. Grimaldi, C. K. Hagen, E. Maire, M. Manley, A. Du Plessis, S. R. Stock, X-ray computed tomography, Nature Reviews Methods Primers 1 (2021) 1–21.
- Ourdjini et al. [1994] A. Ourdjini, J. Liu, R. Elliott, Eutectic spacing selection in Al–Cu system, Materials Science and Technology 10 (1994) 312–318.
- Çadirli et al. [1999] E. Çadirli, A. Ülgen, M. Gündüz, Directional solidification of the Aluminium-Copper eutectic alloy, Materials Transactions, JIM 40 (1999) 989–996.
- Walker et al. [2007] H. Walker, S. Liu, J. H. Lee, R. Trivedi, Eutectic growth in three dimensions, Metallurgical and Materials Transactions A 38 (2007) 1417–1425.
- Murphy et al. [2013] A. G. Murphy, D. J. Browne, W. U. Mirihanage, R. H. Mathiesen, Combined in situ X-ray radiographic observations and post-solidification metallographic characterisation of eutectic transformations in Al-Cu alloy systems, Acta Materialia 61 (2013) 4559–4571.
- Luo et al. [2019] L. Luo, C. Wei, X.-M. Li, X. Wang, Research on microstructure evolution of Al-Al2Cu eutectic by regional melting under directional solidification, Crystal Research and Technology 54 (2019) 1900108.
- Kakitani et al. [2019] R. Kakitani, G. L. d. Gouveia, A. Garcia, N. Cheung, J. E. Spinelli, Thermal analysis during solidification of an Al-Cu eutectic alloy: interrelation of thermal parameters, microstructure and hardness, Journal of Thermal Analysis and Calorimetry 137 (2019) 983–996.
- Sutton and Balluffi [1995] A. P. Sutton, R. Balluffi, Interfaces in crystalline materials, Monographs on the physics and chemistry of materials ;51, Clarendon Press ; Oxford University, 1995.
- Howe [1997] J. M. Howe, Interfaces in materials: atomic structure, thermodynamics and kinetics of solid-vapor, solid-liquid and solid-solid interfaces, Wiley, 1997.
- Kraft [1962] R. W. Kraft, Crystallography of equilibrium phase interfaces in Al-CuAl2 eutectic alloys, Transactions of The Metallurgical Society of AIME 224 (1962) 65–75.
- Bonnet and Durand [1973] R. Bonnet, F. Durand, Geometric discussion of the relationships between the phases Al and CuAl2 for the eutectic and precipitates of CuAl2, in: Conference on in situ Composites, volume 308-I of Conference on in situ Composites, 1973, pp. 209–223.
- Cantor and Chadwick [1974] B. Cantor, G. A. Chadwick, The growth crystallography of unidirectionally solidified Al-Al3Ni and Al-Al2Cu eutectics, Journal of Crystal Growth 23 (1974) 12–20.
- Hecht et al. [2012] U. Hecht, V. Witusiewicz, A. Drevermann, Coupled growth of Al-Al2Cu eutectics in Al-Cu-Ag alloys, IOP Conference Series: Materials Science and Engineering 27 (2012) 012029.
- Kokotin and Hecht [2014] V. Kokotin, U. Hecht, Molecular dynamics simulations of Al-Al2Cu phase boundaries, Computational Materials Science 86 (2014) 30–37.
- Wang et al. [2018] S. J. Wang, G. Liu, J. Wang, A. Misra, Characteristic orientation relationships in nanoscale Al-Al2Cu eutectic, Materials Characterization 142 (2018) 170–178.
- Hecht et al. [2019] U. Hecht, J. Eiken, S. Akamatsu, S. Bottin-Rousseau, Phase boundary anisotropy and its effects on the maze-to-lamellar transition in a directionally solidified Al-Al2Cu eutectic, Acta Materialia 170 (2019) 268–277.
- Liotti et al. [2018] E. Liotti, C. Arteta, A. Zisserman, A. Lui, V. Lempitsky, P. S. Grant, Crystal nucleation in metallic alloys using x-ray radiography and machine learning, Science Advances 4 (2018) eaar4004.
- Wang et al. [2021] Y. Wang, J. Gao, P. Chao, N. S. Muyanja, R. H. Mathiesen, A. J. Shahani, In-situ evidence for impurity-induced formation of eutectic colonies in an interdendritic liquid, Materials Letters 292 (2021).
- Wang et al. [2022] Y. Wang, J. Gao, W. Sun, A. J. Shahani, In situ observation of faceted growth and morphological instability of a complex-regular eutectic in Zn-Mg-Al system, Scripta Materialia 206 (2022) 114224.
- Han et al. [2019] I. Han, X. Xiao, H. Sun, A. J. Shahani, A side-by-side comparison of the solidification dynamics of quasicrystalline and approximant phases in the al–co–ni system, Acta Crystallographica Section A: Foundations and Advances 75 (2019) 281–296.
- Moniri et al. [2019] S. Moniri, X. Xiao, A. J. Shahani, The mechanism of eutectic modification by trace impurities, Scientific Reports 9 (2019) 1–13.
- Moniri et al. [2020] S. Moniri, X. Xiao, A. J. Shahani, Singly-twinned growth of Si crystals upon chemical modification, Physical Review Materials 4 (2020) 063403. Publisher: American Physical Society.
- Reese et al. [2021] C. W. Reese, A. Gladstein, P. Shevchenko, X. Xiao, A. J. Shahani, A. I. Taub, Real-time visualization of particle evolution during reactive flux-assisted processing of aluminum melts, Scripta Materialia 201 (2021) 113978.
- Deville et al. [2009a] S. Deville, E. Maire, A. Lasalle, A. Bogner, C. Gauthier, J. Leloup, C. Guizard, In situ x-ray radiography and tomography observations of the solidification of aqueous alumina particle suspensions—part I: Initial instants, Journal of the American Ceramic Society 92 (2009a) 2489–2496.
- Deville et al. [2009b] S. Deville, E. Maire, A. Lasalle, A. Bogner, C. Gauthier, J. Leloup, C. Guizard, In situ x-ray radiography and tomography observations of the solidification of aqueous alumina particles suspensions. part II: Steady state, Journal of the American Ceramic Society 92 (2009b) 2497–2503.
- Mathworks [2020] Mathworks, MATLAB Image Processing Toolbox Reference (R2020b), The Mathworks, Inc., Natick, Massachusetts, 2020.
- Buffet et al. [2010] A. Buffet, H. Nguyen-Thi, A. Bogno, T. Schenk, N. Mangelinck-Noël, G. Reinhart, N. Bergeon, B. Billia, J. Baruchel, Measurement of solute profiles by means of synchrotron x-ray radiography during directional solidification of al-4 wt% cu alloys, in: Materials Science Forum, volume 649, Trans Tech Publ, 2010, pp. 331–336.
- Soltani et al. [2020] H. Soltani, G. Reinhart, M. Benoudia, F. Ngomesse, M. Zahzouh, H. Nguyen-Thi, Impact of growth velocity on grain structure formation during directional solidification of a refined al-20 wt.% cu alloy, Journal of Crystal Growth 548 (2020) 125819.
- Tandjaoui et al. [2013] A. Tandjaoui, N. Mangelinck-Noel, G. Reinhart, B. Billia, X. Guichard, Twinning occurrence and grain competition in multi-crystalline silicon during solidification, Comptes Rendus Physique 14 (2013) 141–148.
- Andrew et al. [2017] M. Andrew, S. Bhattiprolu, D. Butnaru, J. Correa, The usage of modern data science in segmentation and classification: Machine learning and microscopy, Microscopy and Microanalysis 23 (2017) 156–157.
- Volkenandt et al. [2018] T. Volkenandt, S. Freitag, M. Rauscher, Machine learning powered image segmentation, Microscopy and Microanalysis 24 (2018) 520–521.
- Gürsoy et al. [2014] D. Gürsoy, F. De Carlo, X. Xiao, C. Jacobsen, TomoPy: a framework for the analysis of synchrotron tomographic data, Journal of Synchrotron Radiation 21 (2014) 1188–1193.
- Vo et al. [2018] N. T. Vo, R. C. Atwood, M. Drakopoulos, Superior techniques for eliminating ring artifacts in x-ray micro-tomography, Optics Express 26 (2018) 28396–28412.
- Dowd et al. [1999] B. A. Dowd, G. H. Campbell, R. B. Marr, V. V. Nagarkar, S. V. Tipnis, L. Axe, D. P. Siddons, Developments in synchrotron x-ray computed microtomography at the National Synchrotron Light Source, in: Developments in X-Ray Tomography II, volume 3772, SPIE, 1999, pp. 224–236. doi:10.1117/12.363725.
- Kocks et al. [1998] U. F. Kocks, C. N. Tomé, H.-R. Wenk, Texture and Anisotropy: Preferred Orientations in Polycrystals and their Effect on Materials Properties, Cambridge University Press, 1998.
- Engler and Randle [2009] O. Engler, V. Randle, Introduction to Texture Analysis: Macrotexture, Microtexture, and Orientation Mapping, Second Edition, 2 ed., CRC Press, 2009. doi:10.1201/9781420063660.
- Bachmann et al. [2010] F. Bachmann, R. Hielscher, H. Schaeben, Texture analysis with MTEX – free and open source software toolbox, Solid State Phenomena 160 (2010) 63–68.
- Rohrer et al. [2004] G. S. Rohrer, D. M. Saylor, B. E. Dasher, B. L. Adams, A. D. Rollett, P. Wynblatt, The distribution of internal interfaces in polycrystals, Zeitschrift für Metallkunde 95 (2004) 197–214.
- Rowenhorst et al. [2016] D. Rowenhorst, A. Gupta, C. Feng, G. Spanos, 3D crystallographic and morphological analysis of coarse martensite: Combining EBSD and serial sectioning, Scripta Materialia 55 (2016) 11–16.
- Larson et al. [2013] D. J. Larson, T. Prosa, R. M. Ulfig, B. P. Geiser, T. F. Kelly, Local electrode atom probe tomography, New York, US: Springer Science 2 (2013).
- Mjaavatten [2021] A. Mjaavatten, Curvature of a 1d curve in a 2d or 3d space, 2021. URL: https://www.mathworks.com/matlabcentral/fileexchange/69452-curvature-of-a-1d-curve-in-a-2d-or-3d-space.
- Mathiesen et al. [2011] R. H. Mathiesen, L. Arnberg, Y. Li, V. Meier, P. L. Schaffer, I. Snigireva, A. Snigirev, A. K. Dahle, X-ray videomicroscopy studies of eutectic Al-Si solidification in Al-Si-Cu, Metallurgical and Materials Transactions A 42 (2011) 170–180.
- Reinhart et al. [2020] G. Reinhart, D. Grange, L. Abou-Khalil, N. Mangelinck-Noël, N. T. Niane, V. Maguin, G. Guillemot, C. A. Gandin, H. Nguyen-Thi, Impact of solute flow during directional solidification of a Ni-based alloy: In-situ and real-time x-radiography, Acta Materialia 194 (2020) 68–79.
- Kalidindi [2015] S. R. Kalidindi, Hierarchical materials informatics, in: S. R. Kalidindi (Ed.), Hierarchical Materials Informatics, Butterworth-Heinemann, 2015, pp. 75–110. doi:10.1016/B978-0-12-410394-8.00003-5.
- Cecen et al. [2018] A. Cecen, Y. C. Yabansu, S. R. Kalidindi, A new framework for rotationally invariant two-point spatial correlations in microstructure datasets, Acta Materialia 158 (2018) 53–64.
- Parisi and Plapp [2010] A. Parisi, M. Plapp, Defects and multistability in eutectic solidification patterns, EPL (Europhysics Letters) 90 (2010) 26010.
- Hellman et al. [2000] O. C. Hellman, J. A. Vandenbroucke, J. Rüsing, D. Isheim, D. N. Seidman, Analysis of three-dimensional atom-probe data by the proximity histogram, Microscopy and Microanalysis 6 (2000) 437–444.
- Fujii et al. [1993] H. Fujii, H. Nakae, K. Okada, Interfacial reaction wetting in the boron nitride/molten aluminum system, Acta Metallurgica et Materialia 41 (1993) 2963–2971.
- Du et al. [2003] Y. Du, Y. A. Chang, B. Huang, W. Gong, Z. Jin, H. Xu, Z. Yuan, Y. Liu, Y. He, F. Y. Xie, Diffusion coefficients of some solutes in fcc and liquid al: critical evaluation and correlation, Materials Science and Engineering: A 363 (2003) 140–151.
- Akamatsu and Faivre [2000] S. Akamatsu, G. Faivre, Traveling waves, two-phase fingers, and eutectic colonies in thin-sample directional solidification of a ternary eutectic alloy, Physical Review E 61 (2000) 3757–3770.
- Bogno et al. [2011] A. Bogno, G. Reinhart, A. Buffet, H. Nguyen Thi, B. Billia, T. Schenk, N. Mangelinck-Noël, N. Bergeon, J. Baruchel, In situ analysis of the influence of convection during the initial transient of planar solidification, Journal of Crystal Growth 318 (2011) 1134–1138.
- Lee et al. [2005] J. H. Lee, S. Liu, R. Trivedi, The effect of fluid flow on eutectic growth, Metallurgical and Materials Transactions A 36A (2005) 3111.
- McFadden et al. [1984] G. McFadden, R. Rehm, S. Coriell, W. Chuck, K. Morrish, Thermosolutal convection during directional solidification, Metallurgical Transactions A 15 (1984) 2125–2137.
- Carlberg [1984] T. Carlberg, The effect of convection upon off-eutectic composite growth of Al-Cu alloys, Journal of Crystal Growth 66 (1984) 106–120.
- De Wilde and Froyen [2005] J. De Wilde, L. Froyen, Solutal configuration during coupled two-phase [-(Al) + -Al2Cu] planar univariant eutetic growth in Al-Cu-(Ag, Si) ternary eutetic alloys, Microgravity - Science and Technology 16 (2005) 40–44.
- Li et al. [2007] X. Li, Z. Ren, Y. Fautrelle, The spiral growth of lamellar eutectics in a high magnetic field during the directional solidification process, Scripta materialia 56 (2007) 505–508.
- Li et al. [2010] X. Li, Z. Ren, Y. Fautrelle, Y. Zhang, C. Esling, Morphological instabilities and alignment of lamellar eutectics during directional solidification under a strong magnetic field, Acta Materialia 58 (2010) 1403–1417.
- Van Alkemade [1893] A. V. R. Van Alkemade, Graphical treatment of some thermodynamic problems with equilibrium states of salt solutions with solid phases, Z. Phys. Chem 11 (1893) 289–327.
- Rumball [1968] W. Rumball, Cellular growth in eutectic systems, Metallurgia 78 (1968) 141–145.
- Lahiri and Choudhury [2015] A. Lahiri, A. Choudhury, Effect of surface energy anisotropy on the stability of growth fronts in multiphase alloys, Transactions of the Indian Institute of Metals 68 (2015) 1053–1057.
- Lahiri and Choudhury [2017] A. Lahiri, A. Choudhury, Revisiting Jackson-Hunt calculations: Unified theoretical analysis for generic multi-phase growth in a multi-component system, Acta Materialia 133 (2017) 316–332.
- De Wilde et al. [2005] J. De Wilde, L. Froyen, V. Witusiewicz, U. Hecht, Two-phase planar and regular lamellar coupled growth along the univariant eutectic reaction in ternary alloys: An analytical approach and application to the Al-Cu-Ag system, Journal of applied physics 97 (2005) 113515.
- Witusiewicz et al. [2021] V. T. Witusiewicz, U. Hecht, J. Fernandez, J. Rodriguez, J. M. Ezquerro, In-situ observation of eutectic growth during directional solidification of succinonitrile - (D)camphor- neopentyl glycol alloys under imposed velocity transients, Acta Materialia 203 (2021) 116469.
- Şerefoǧlu et al. [2012] M. Şerefoǧlu, S. Bottin-Rousseau, S. Akamatsu, G. Faivre, Dynamics of rod eutectic growth patterns in confined geometry, in: IOP Conference Series: Materials Science and Engineering, volume 27-1, IOP Publishing, 2012, p. 012030.
- Parisi [2008] A. Parisi, Stability of lamellar eutectic growth, Acta Materialia 56 (2008) 1348–1357.
- Rayleigh [1878] L. Rayleigh, On the instability of jets, Proceedings of the London mathematical society 1 (1878) 4–13.
- Bottin-Rousseau et al. [2022] S. Bottin-Rousseau, V. T. Witusiewicz, U. Hecht, J. Fernandez, A. Laveron-Simavilla, S. Akamatsu, Coexistence of rod-like and lamellar eutectic growth patterns, Scripta Materialia 207 (2022) 114314.
- Akamatsu et al. [2007] S. Akamatsu, S. Bottin-Rousseau, M. Perrut, G. Faivre, V. Witusiewicz, L. Sturz, Real-time study of thin and bulk eutectic growth in succinonitrile–(d) camphor alloys, Journal of crystal growth 299 (2007) 418–428.
- Santala and Glaeser [2006] M. K. Santala, A. M. Glaeser, Surface-energy-anisotropy-induced orientation effects on rayleigh instabilities in sapphire, Surface Science 600 (2006) 782–792.
- Bottin-Rousseau et al. [2021] S. Bottin-Rousseau, M. Medjkoune, O. Senninger, L. Carroz, R. Soucek, U. Hecht, S. Akamatsu, Locked-lamellar eutectic growth in thin Al–Al2Cu samples: In situ directional solidification and crystal orientation analysis, Journal of Crystal Growth 570 (2021) 126203.
- Garmong and Rhodes [1974a] G. Garmong, C. G. Rhodes, Interfacial structure of Al-CuAl2 eutectic composites, Acta Metallurgica 22 (1974a) 1373–1382.
- Garmong and Rhodes [1974b] G. Garmong, C. G. Rhodes, The structure of interphase boundaries in Al-CuAl2 curved eutectic crystals, Metallurgical and Materials Transactions B 5 (1974b) 2507–2513.
- Kaya and Smith [1992] M. Kaya, R. W. Smith, Transmission electron microscope study of a directionally solidified Cu-MgCu2 eutectic, Journal of Materials Science 27 (1992) 2258–2266.
- Biswas et al. [2010] A. Biswas, D. J. Siegel, D. N. Seidman, Simultaneous segregation at coherent and semicoherent heterophase interfaces, Physical Review Letters 105 (2010) 076102.
- Asta et al. [2009] M. Asta, C. Beckermann, A. Karma, W. Kurz, R. Napolitano, M. Plapp, G. Purdy, M. Rappaz, R. Trivedi, Solidification microstructures and solid-state parallels: Recent developments, future directions, Acta Materialia 57 (2009) 941–971.
- Rappaz and Kurtuldu [2015] M. Rappaz, G. Kurtuldu, Thermodynamic aspects of homogeneous nucleation enhanced by icosahedral short range order in liquid fcc-type alloys, JOM 67 (2015) 1812–1820.
Figures
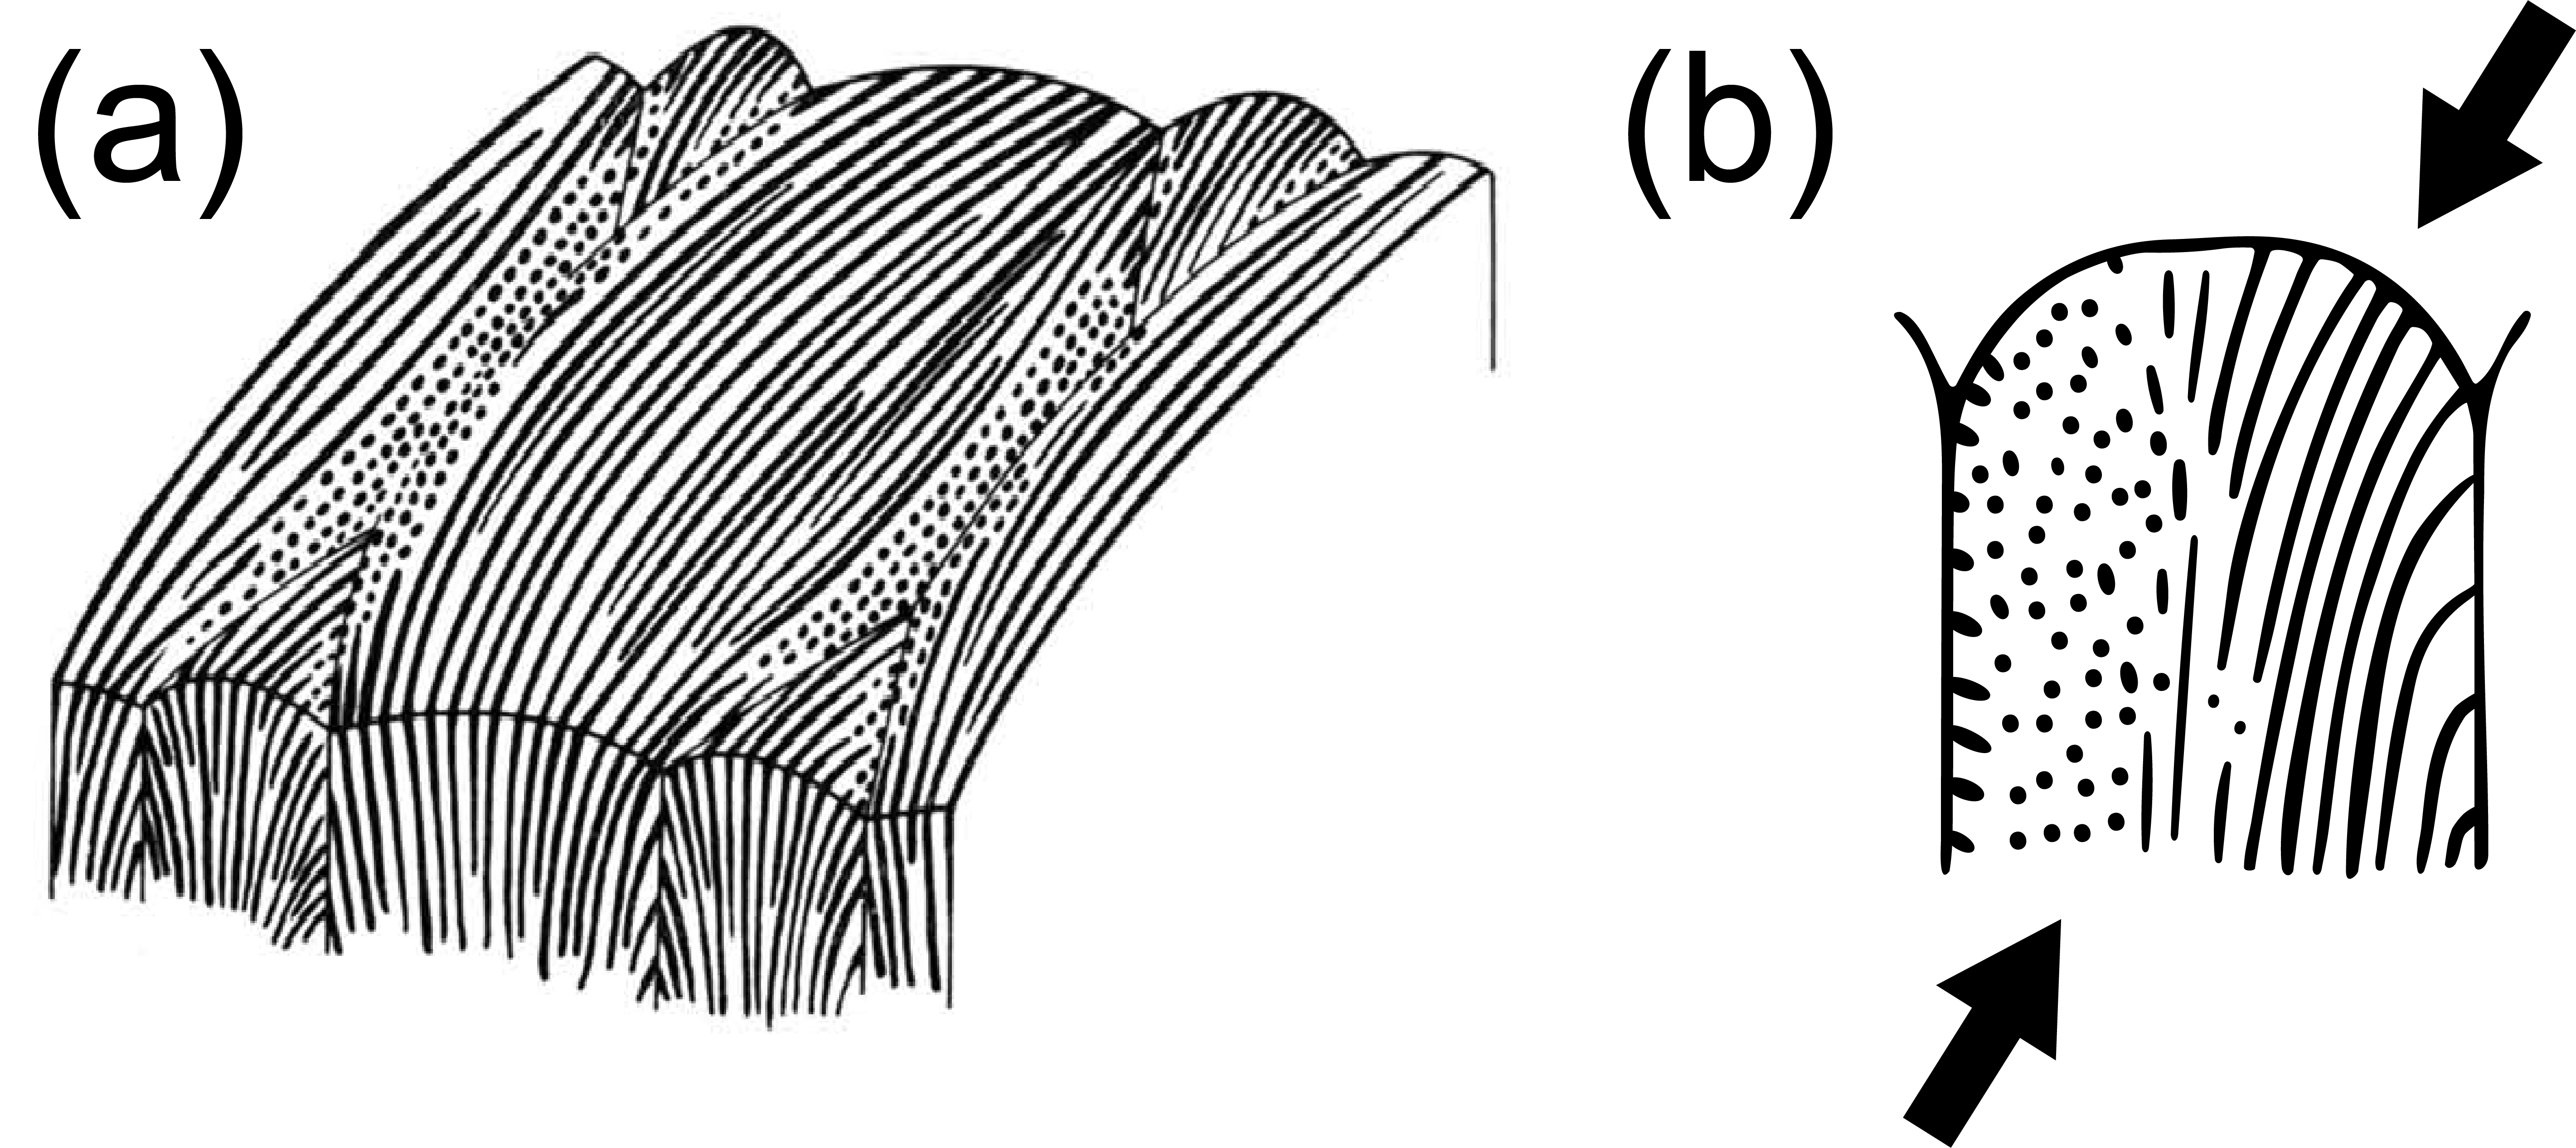
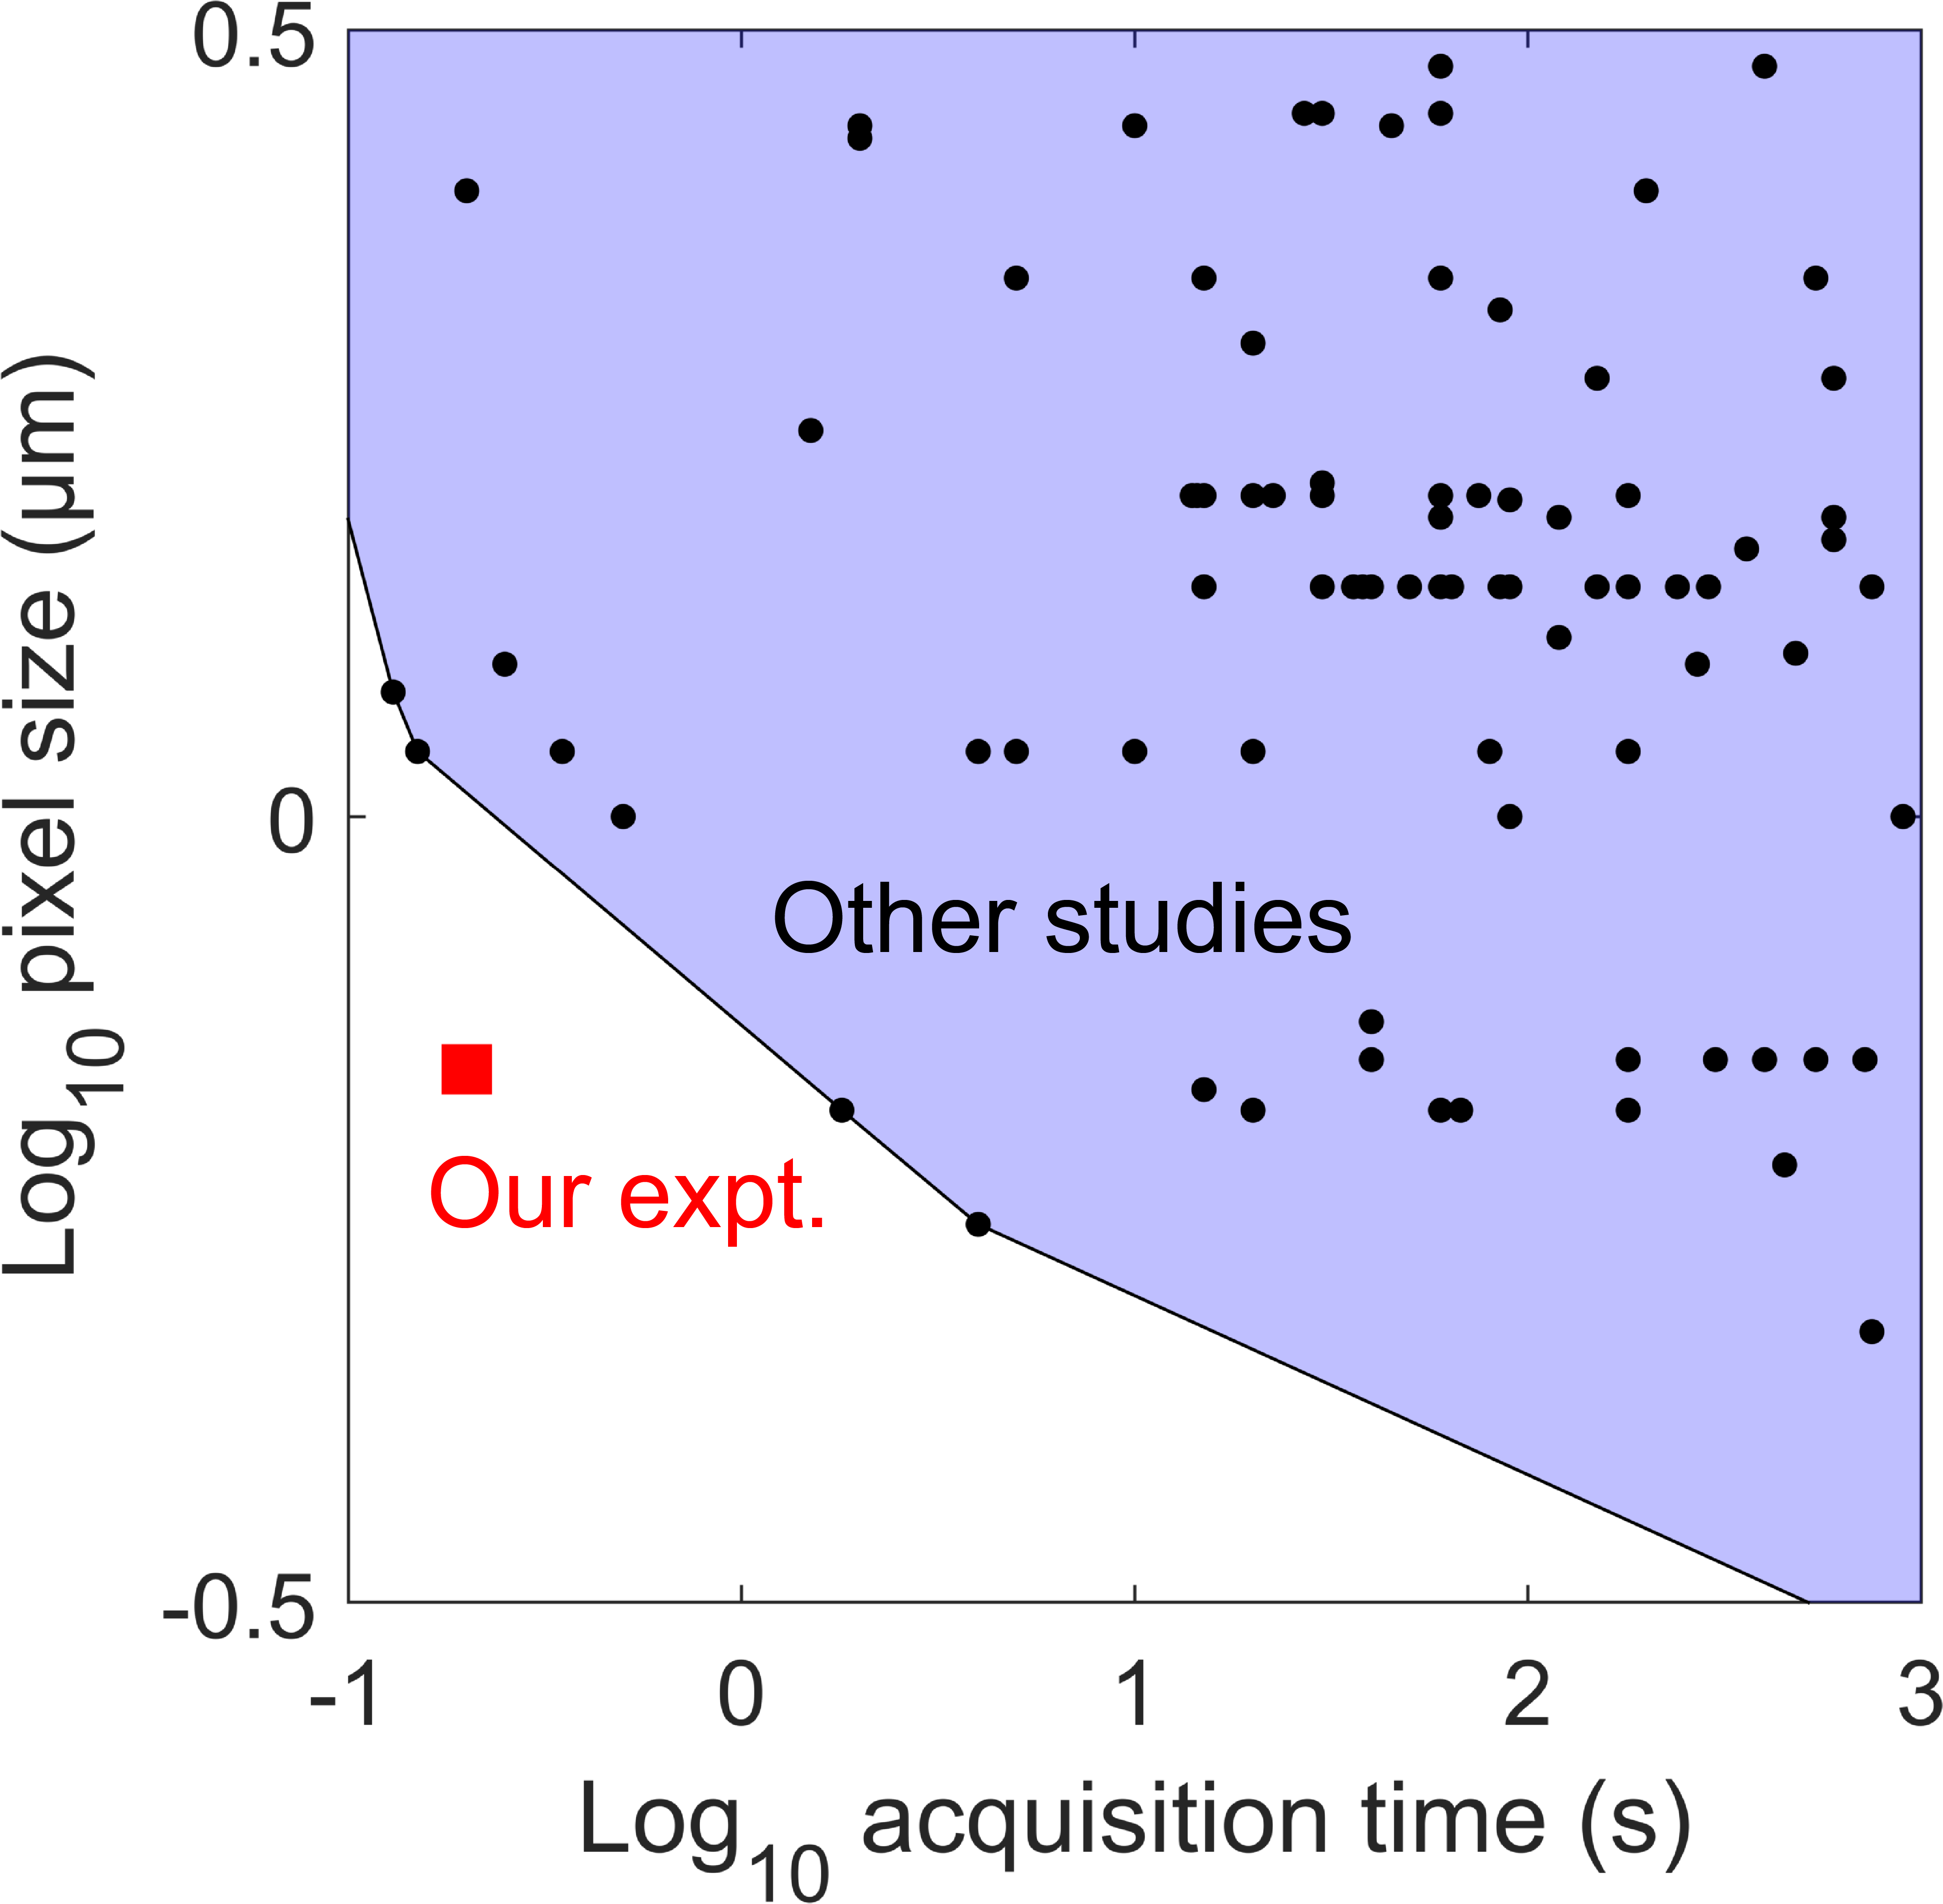
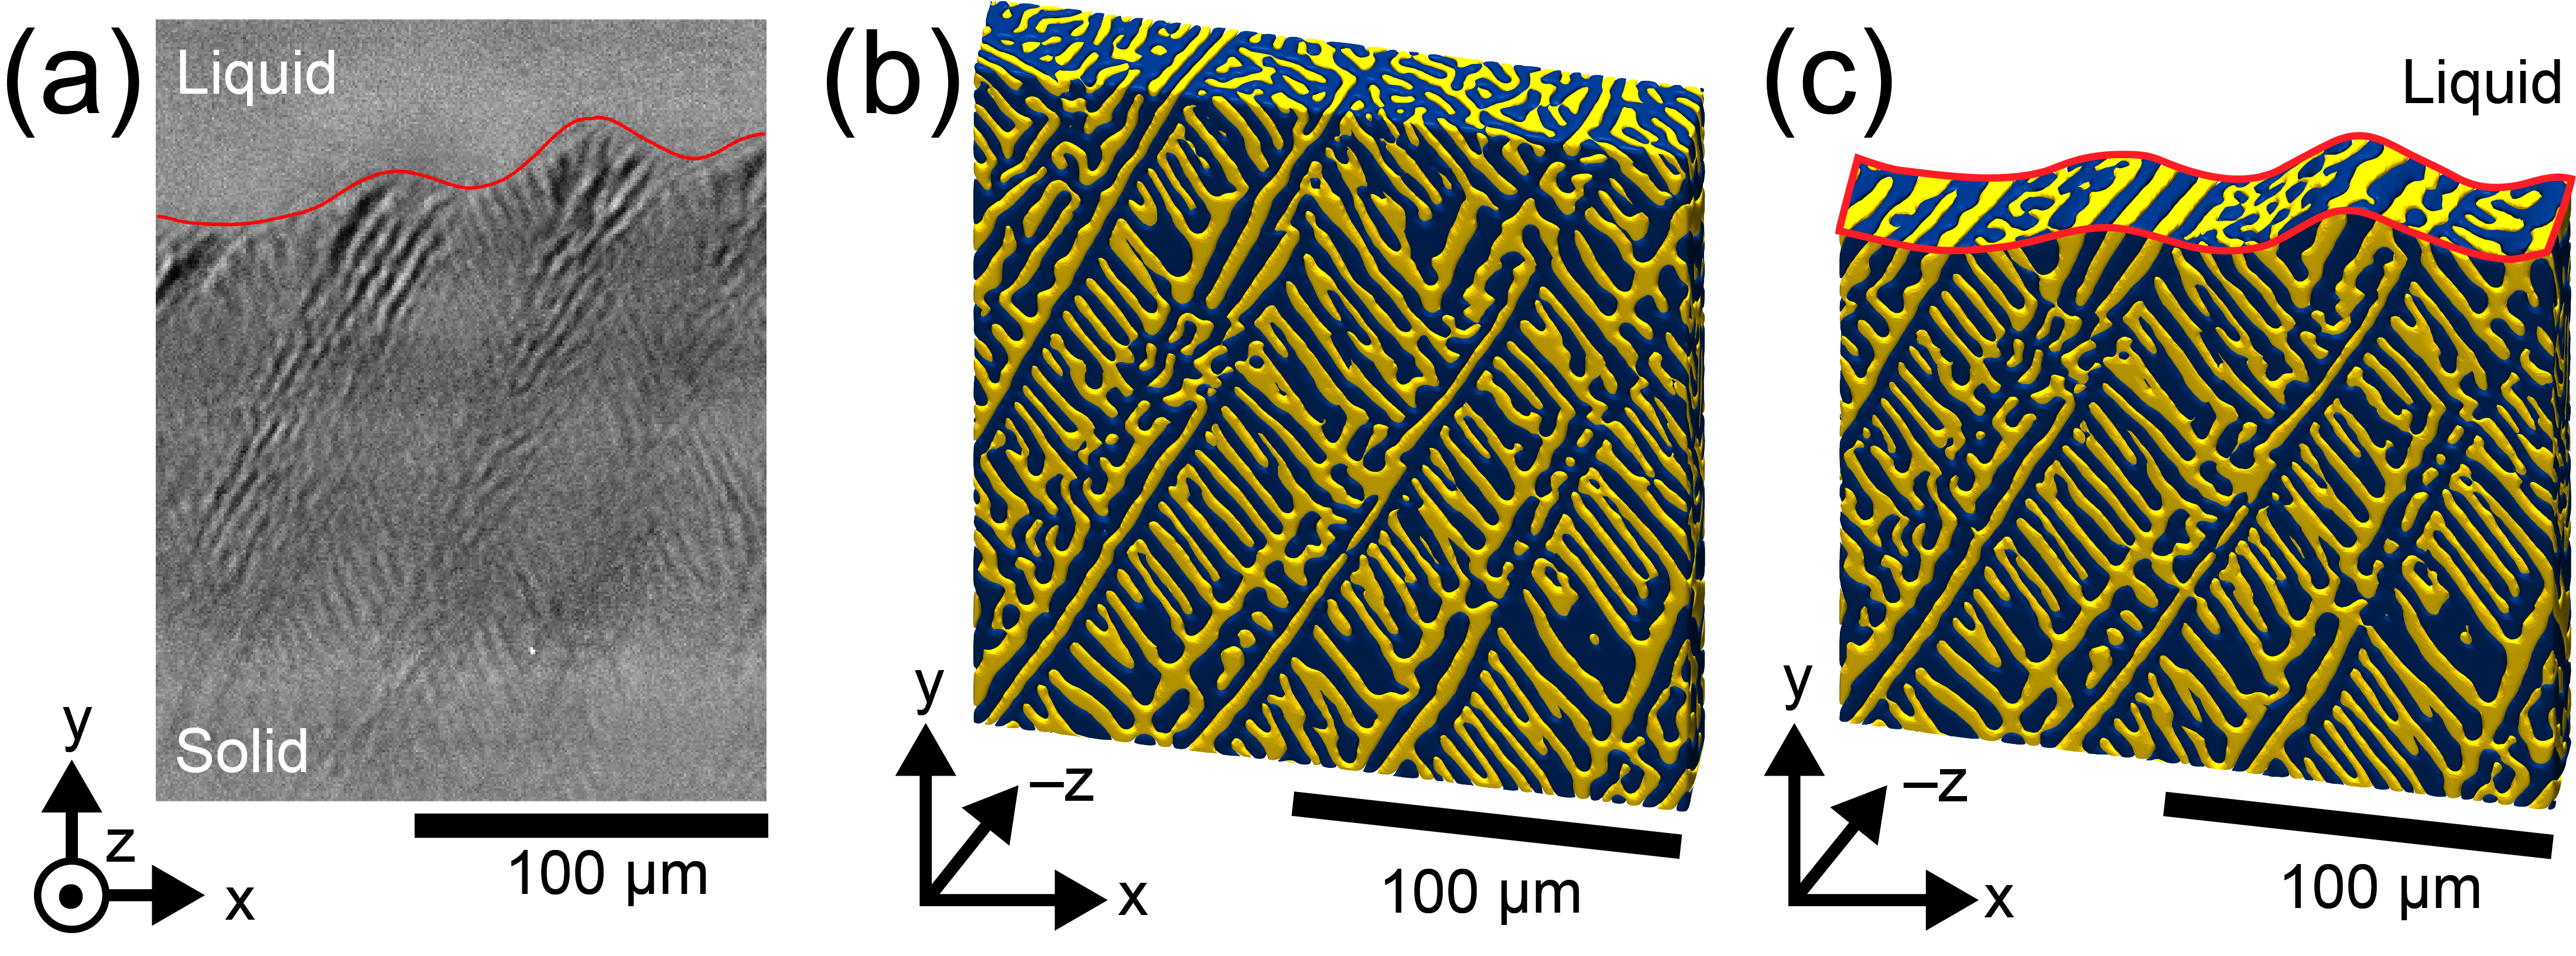

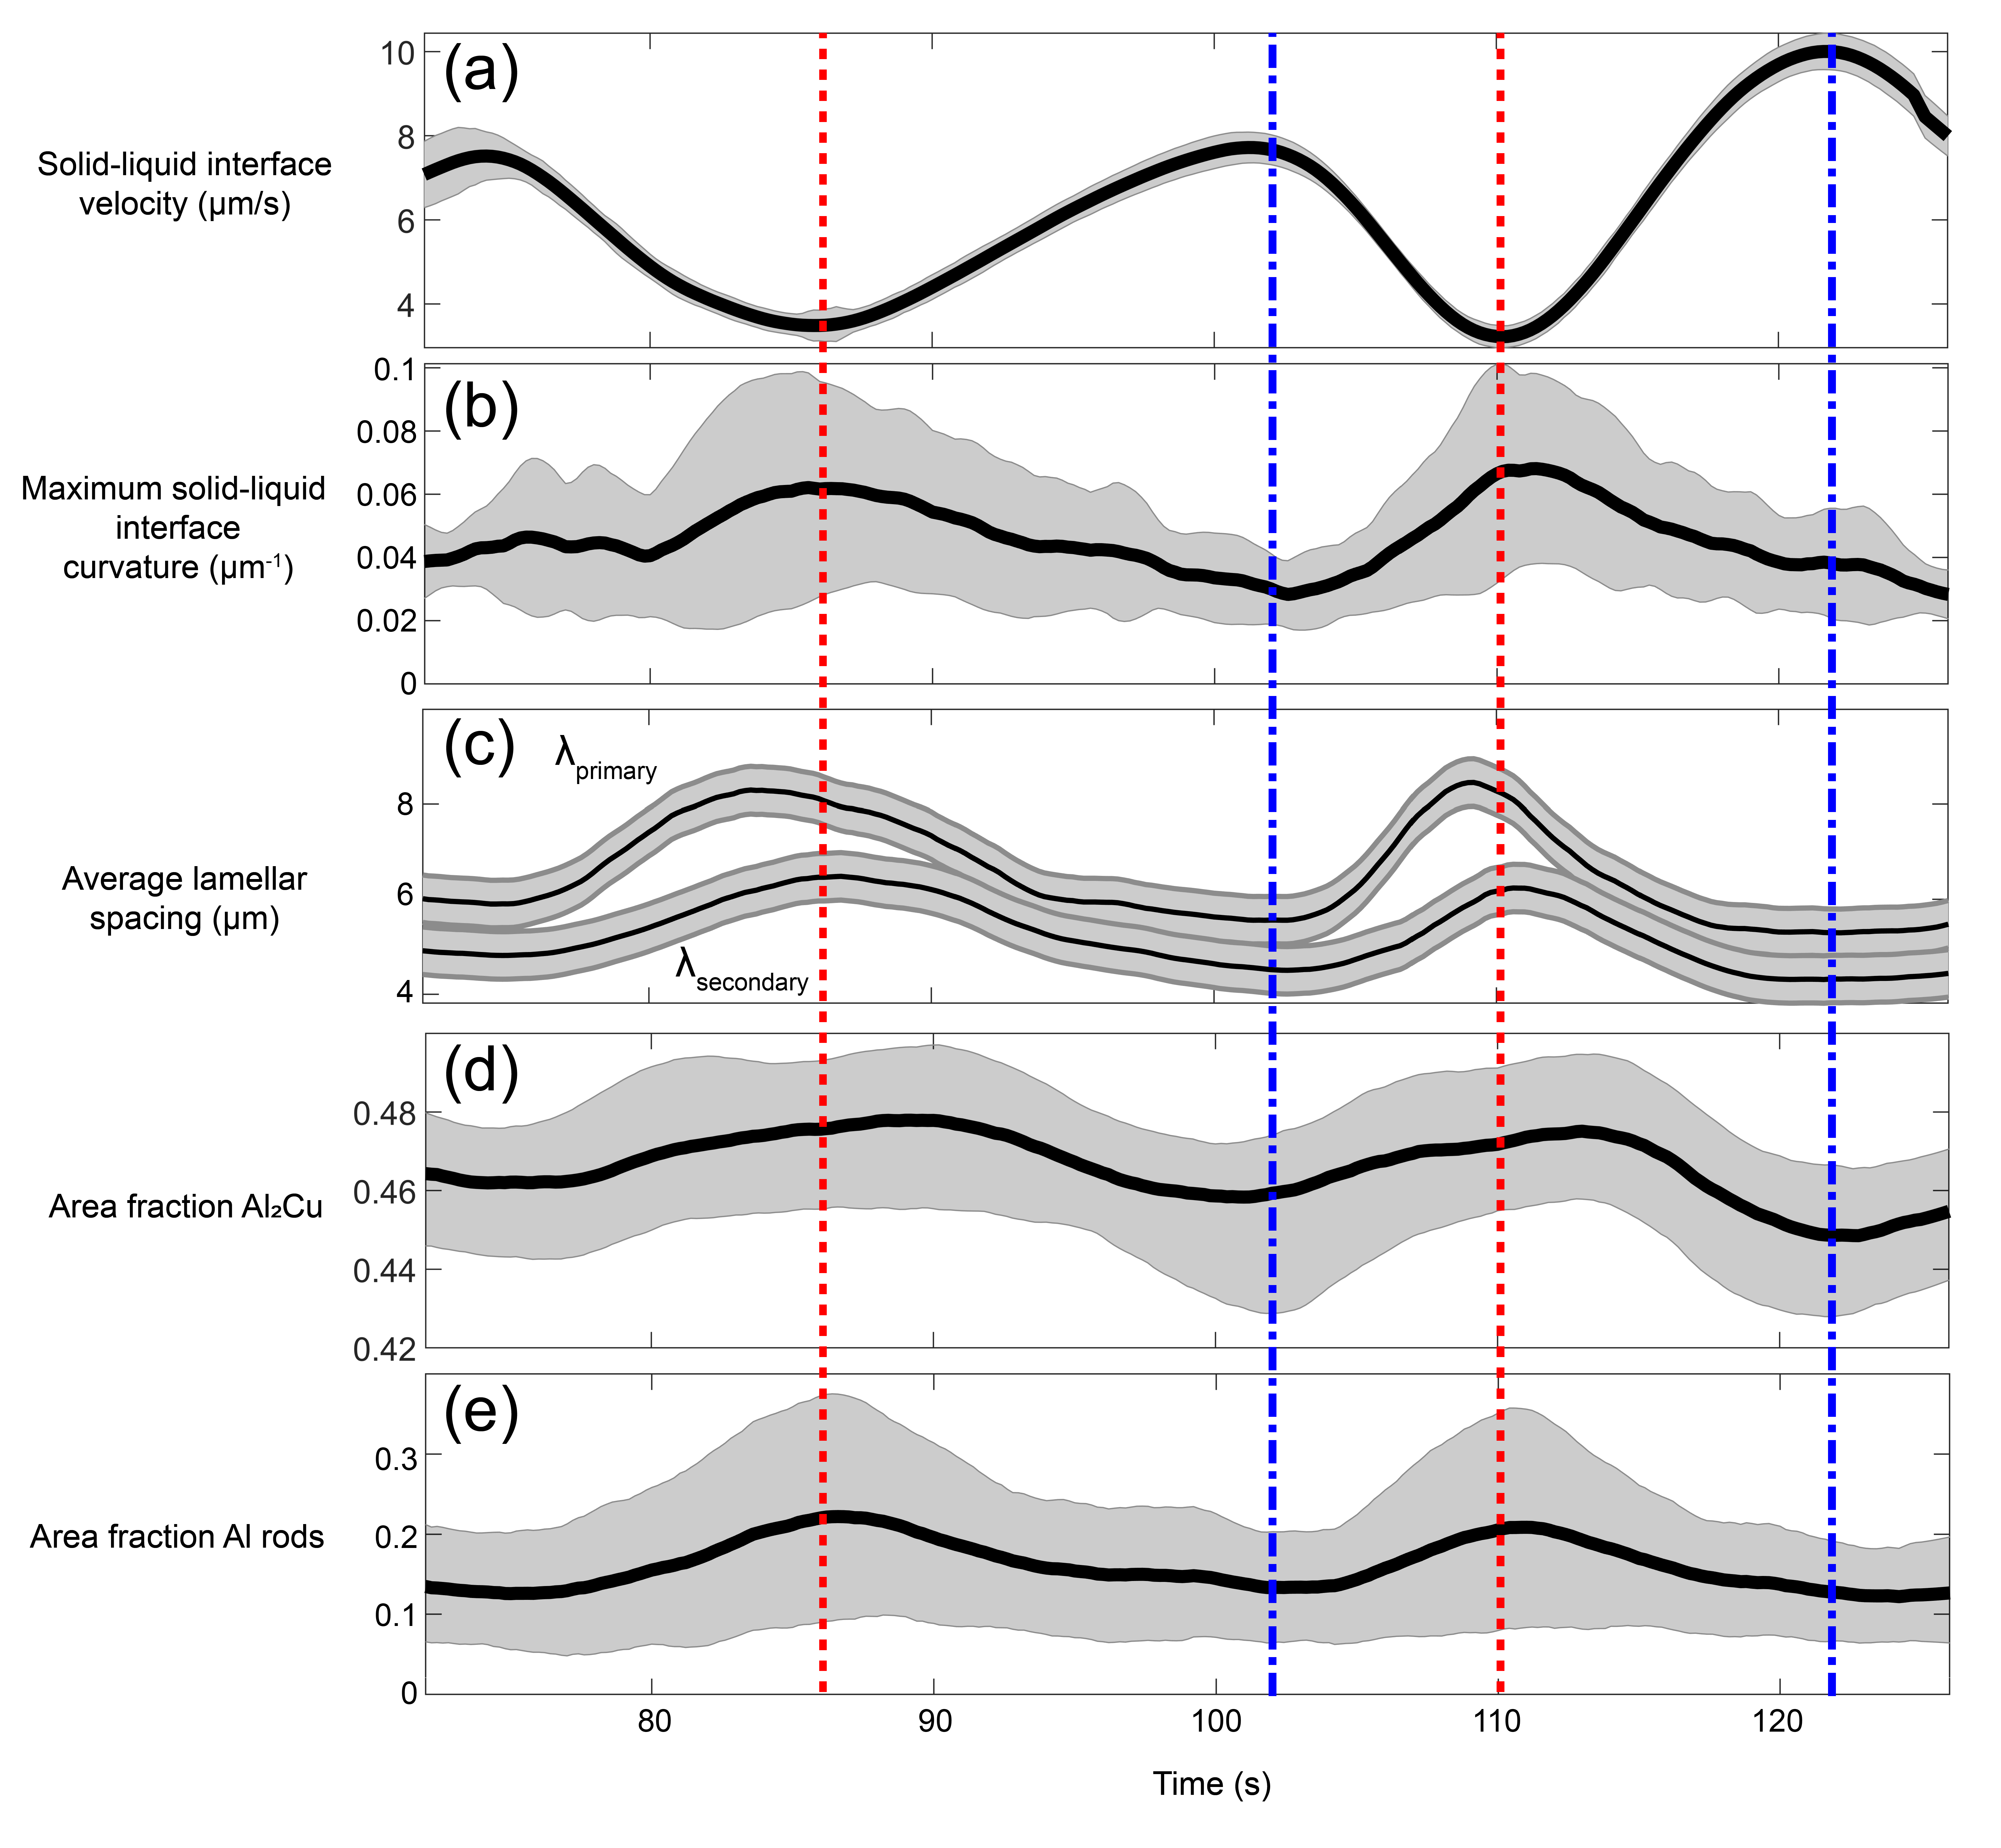
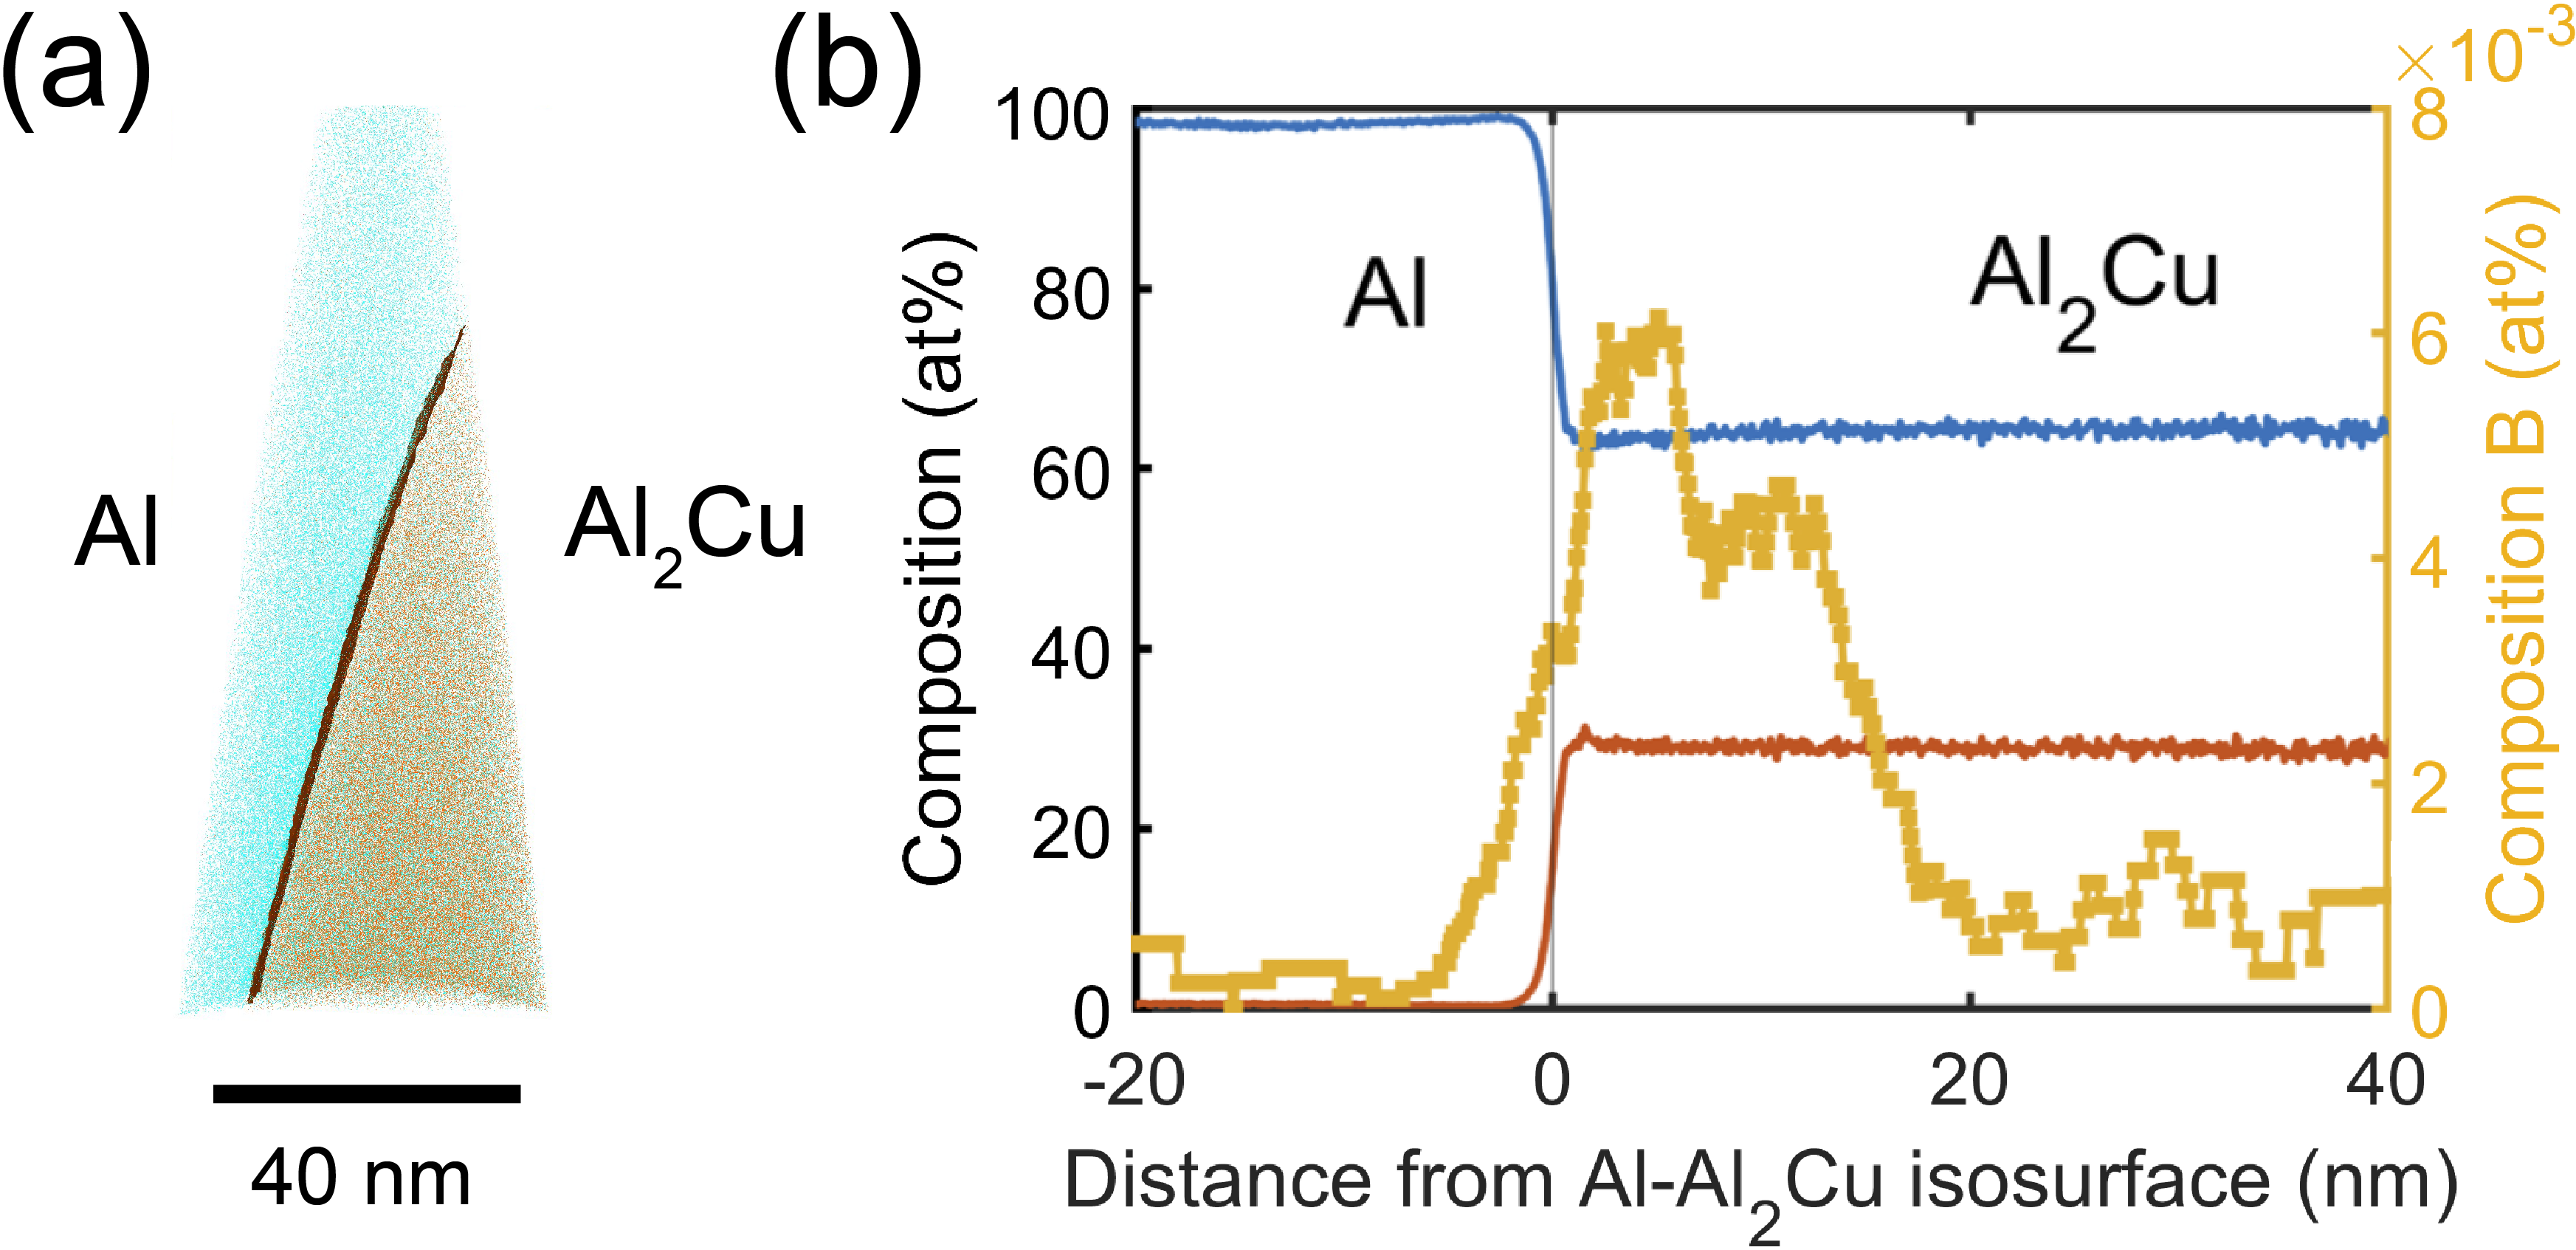
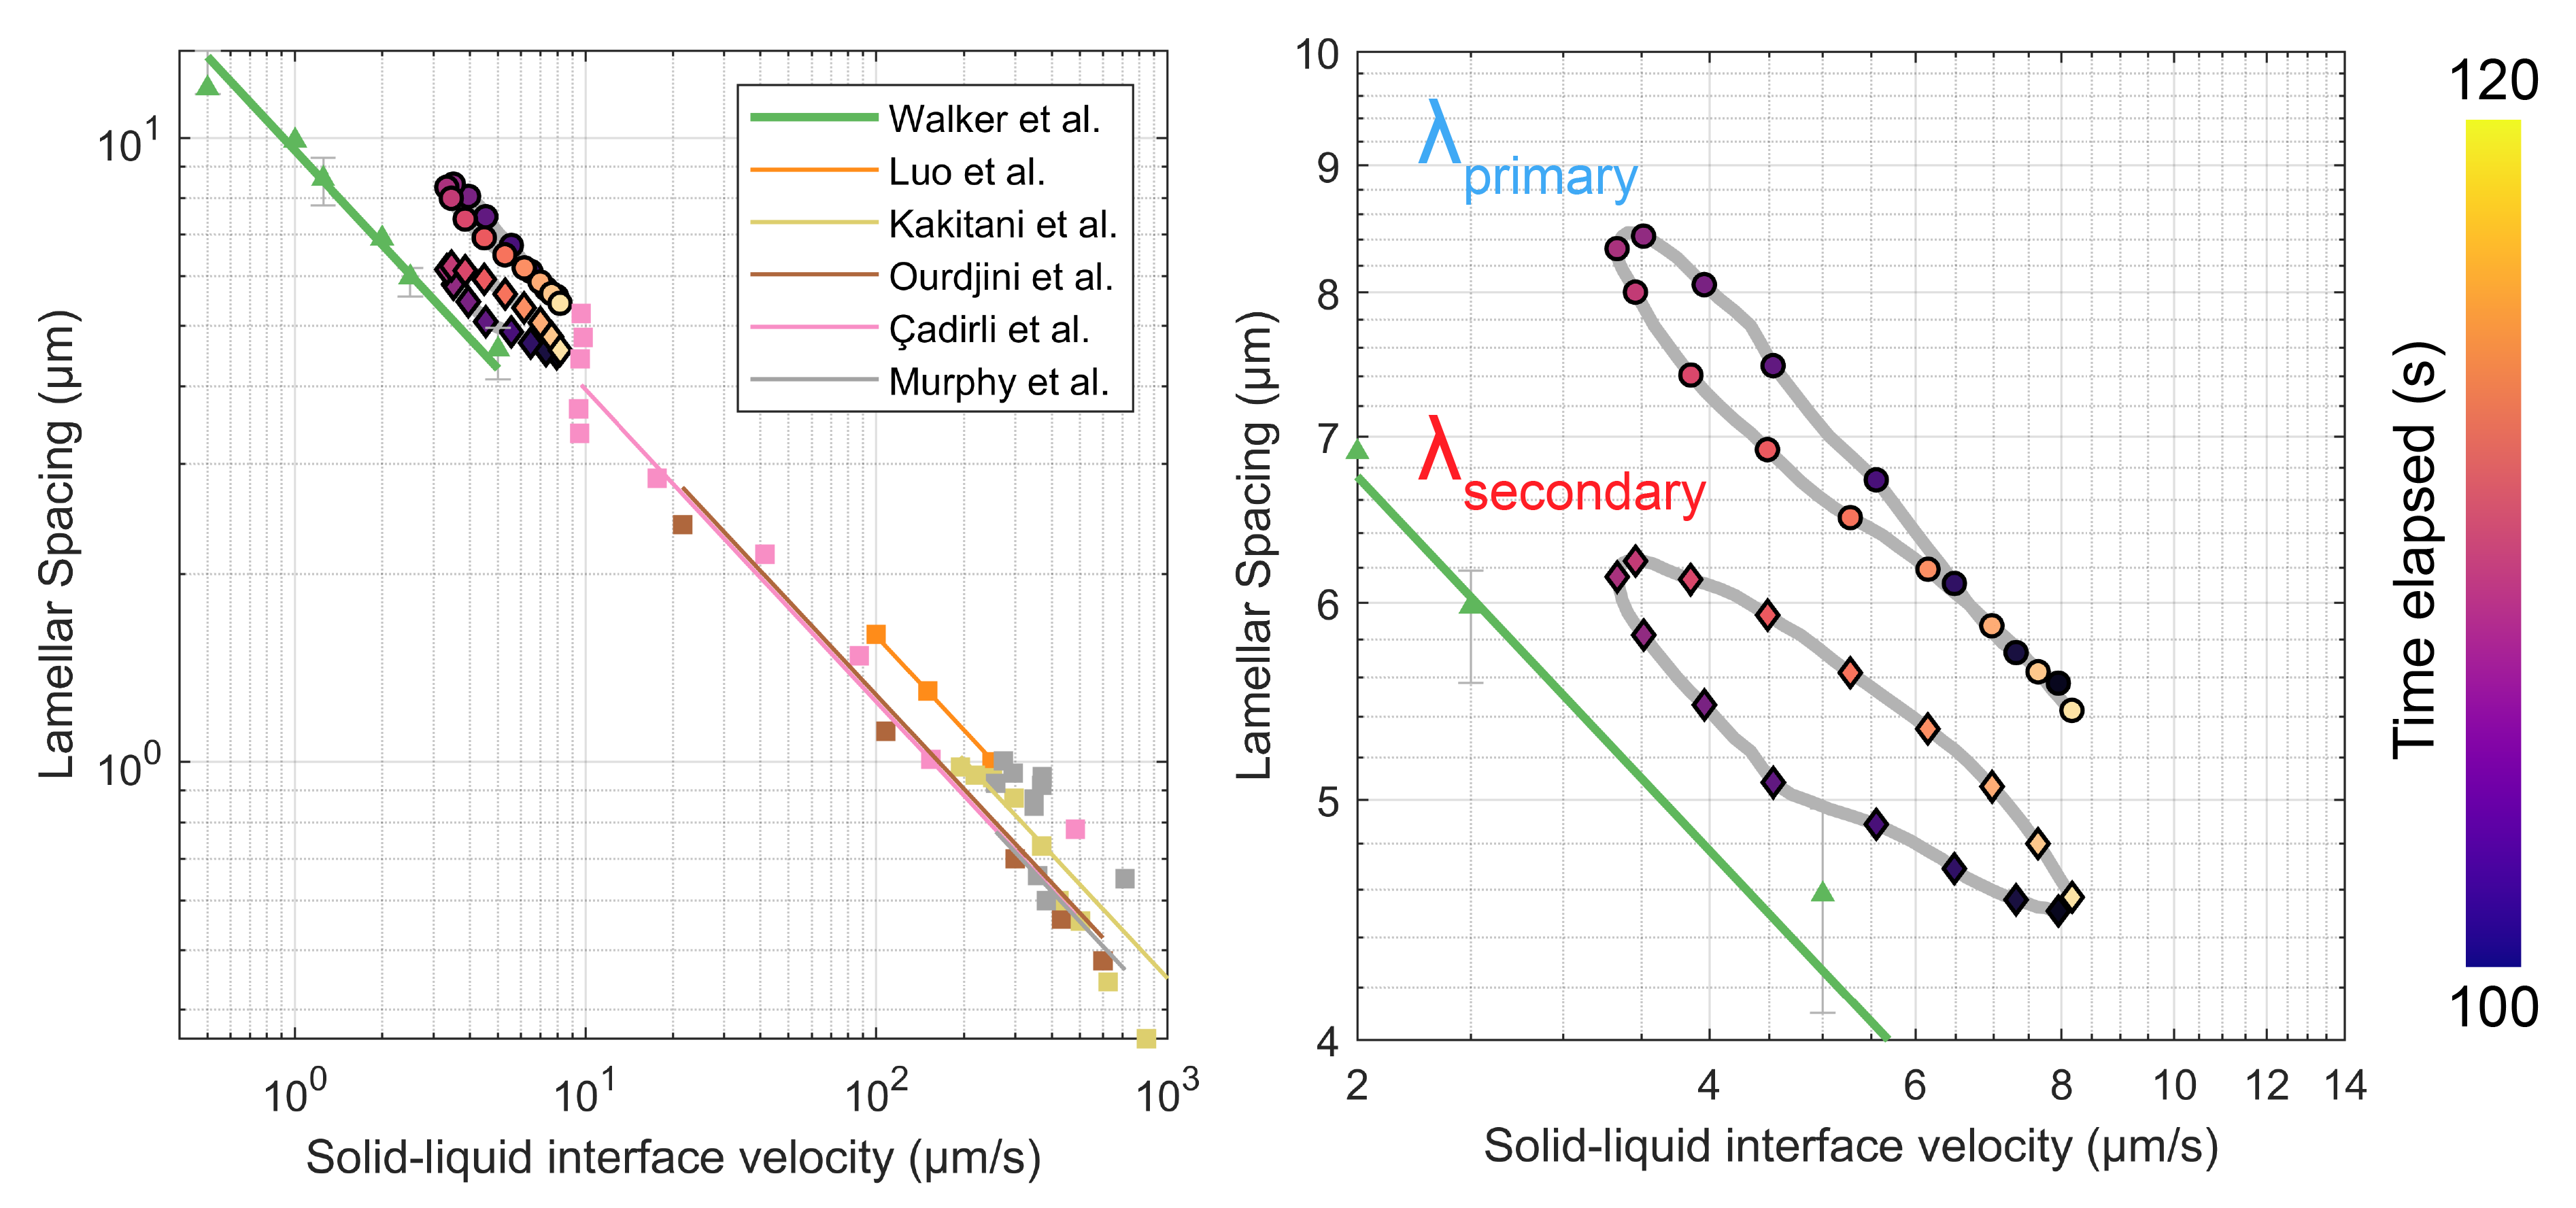
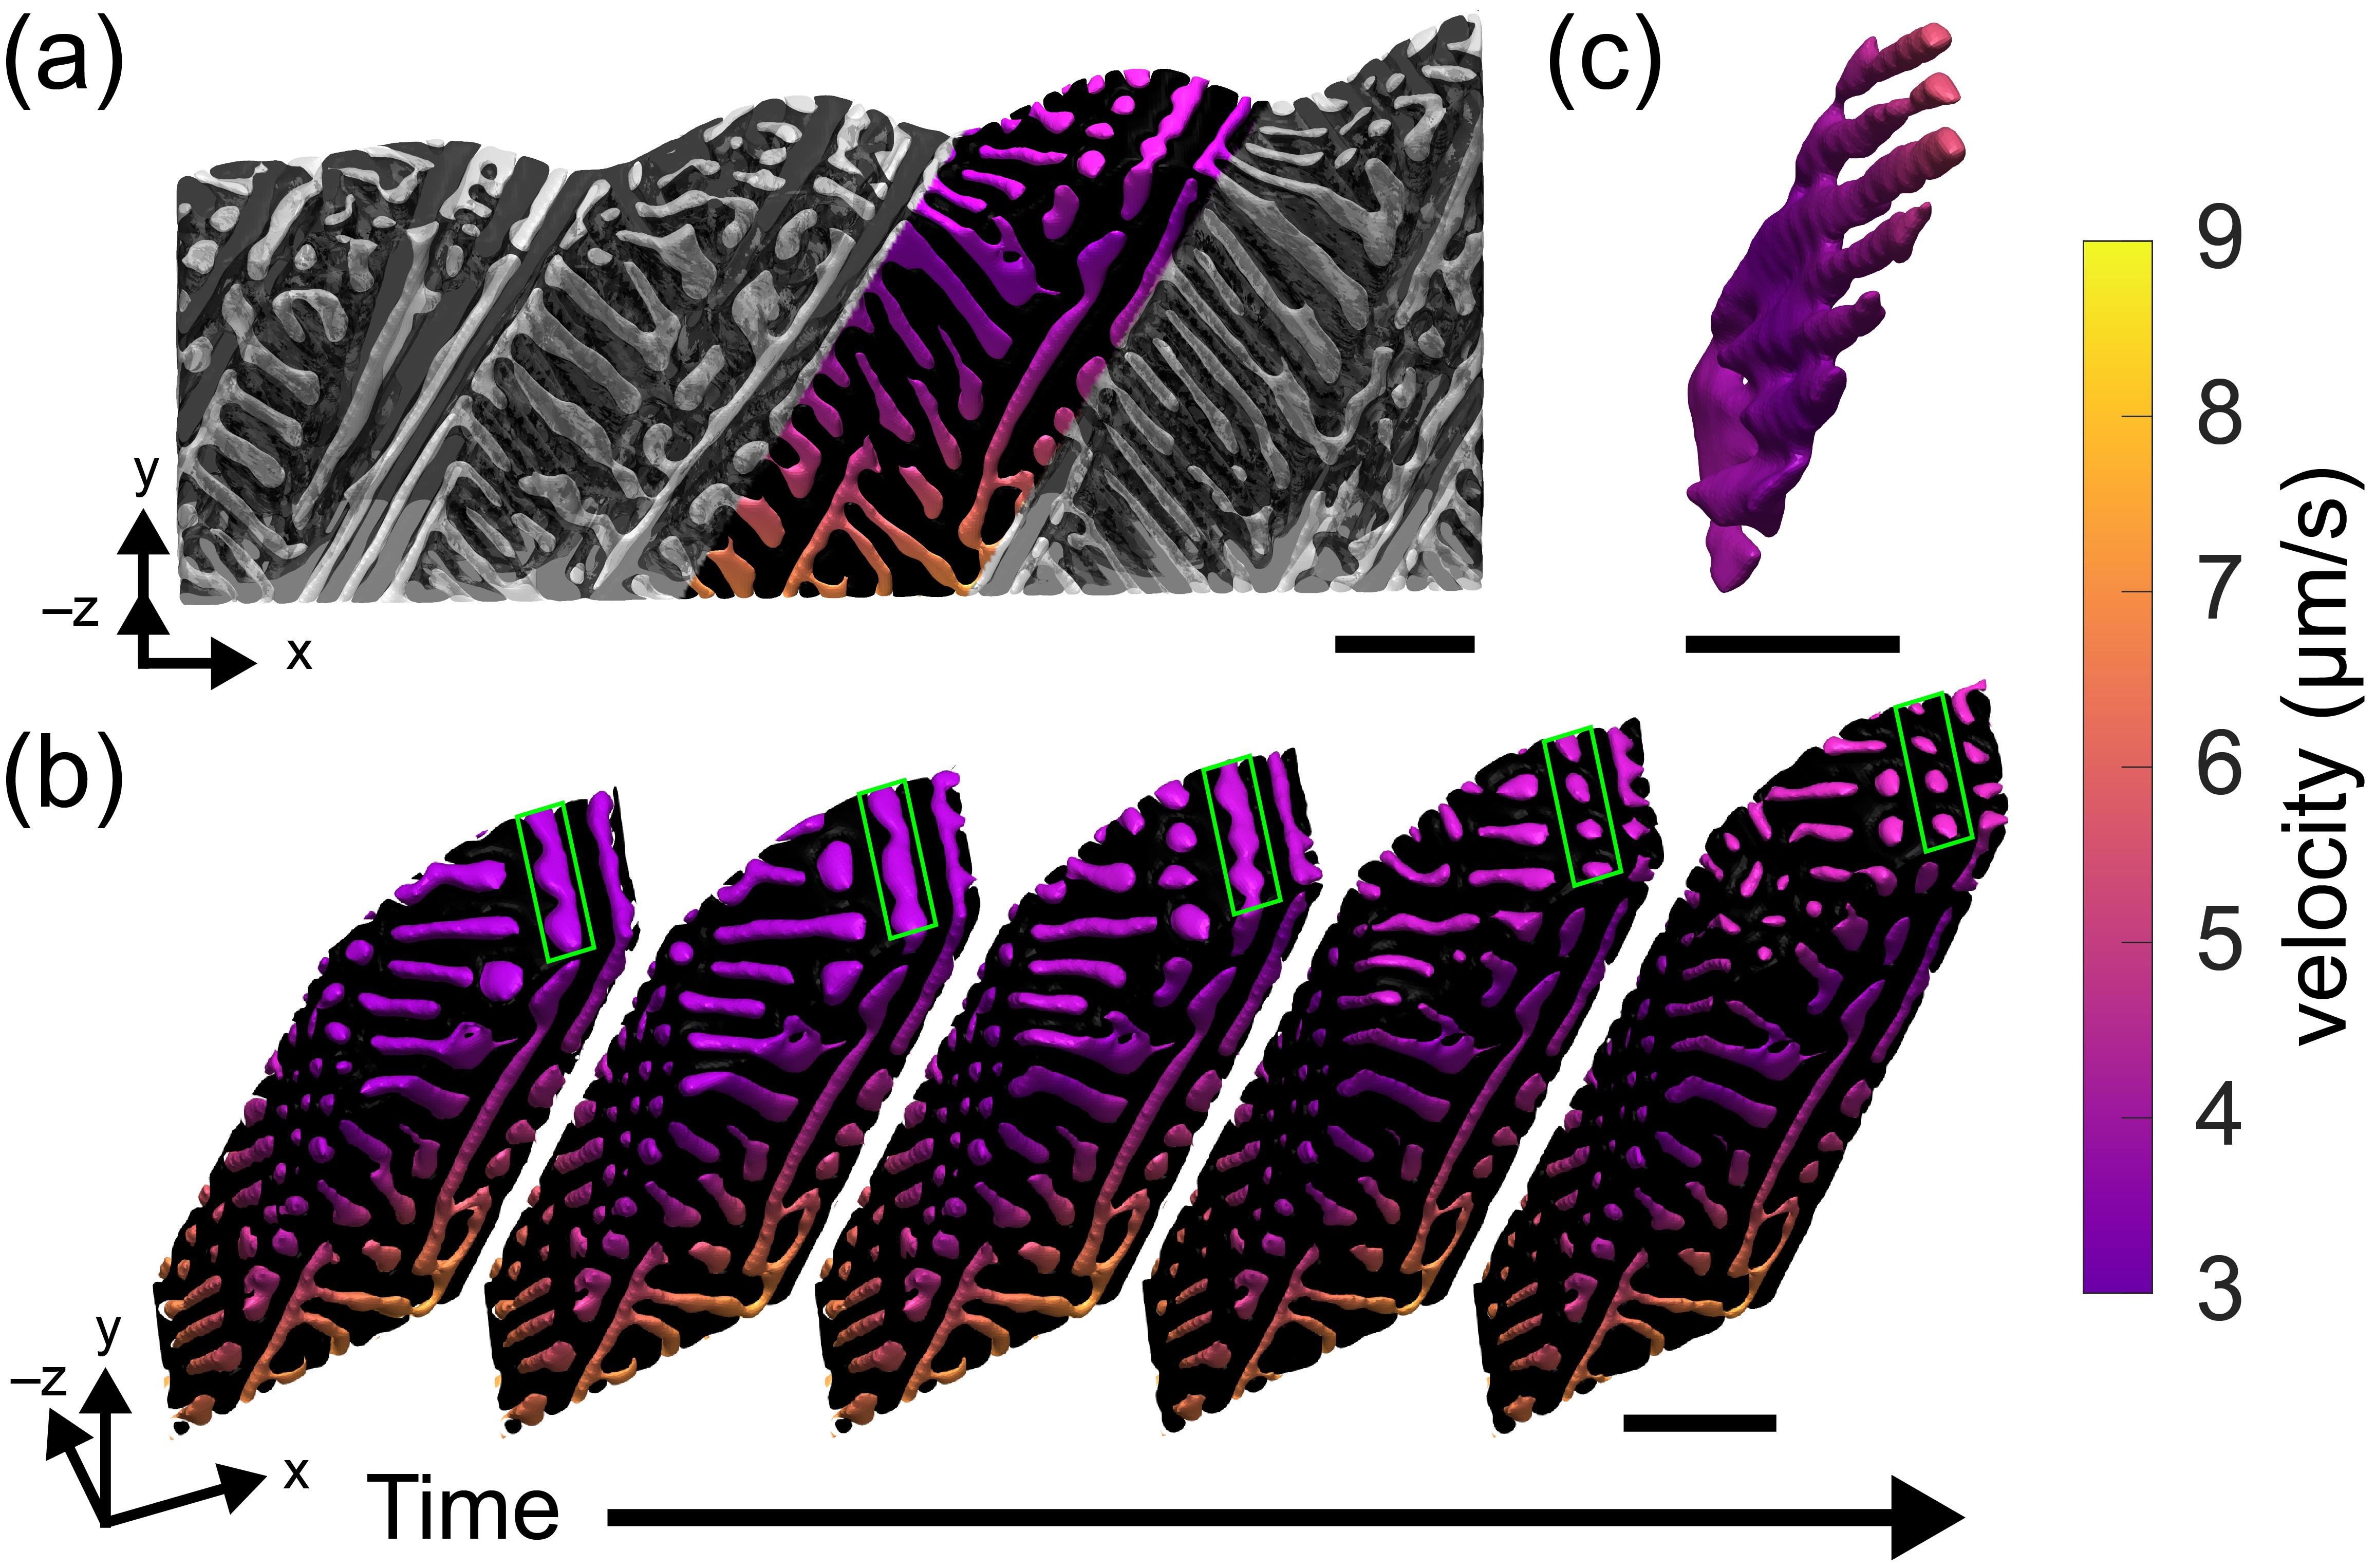
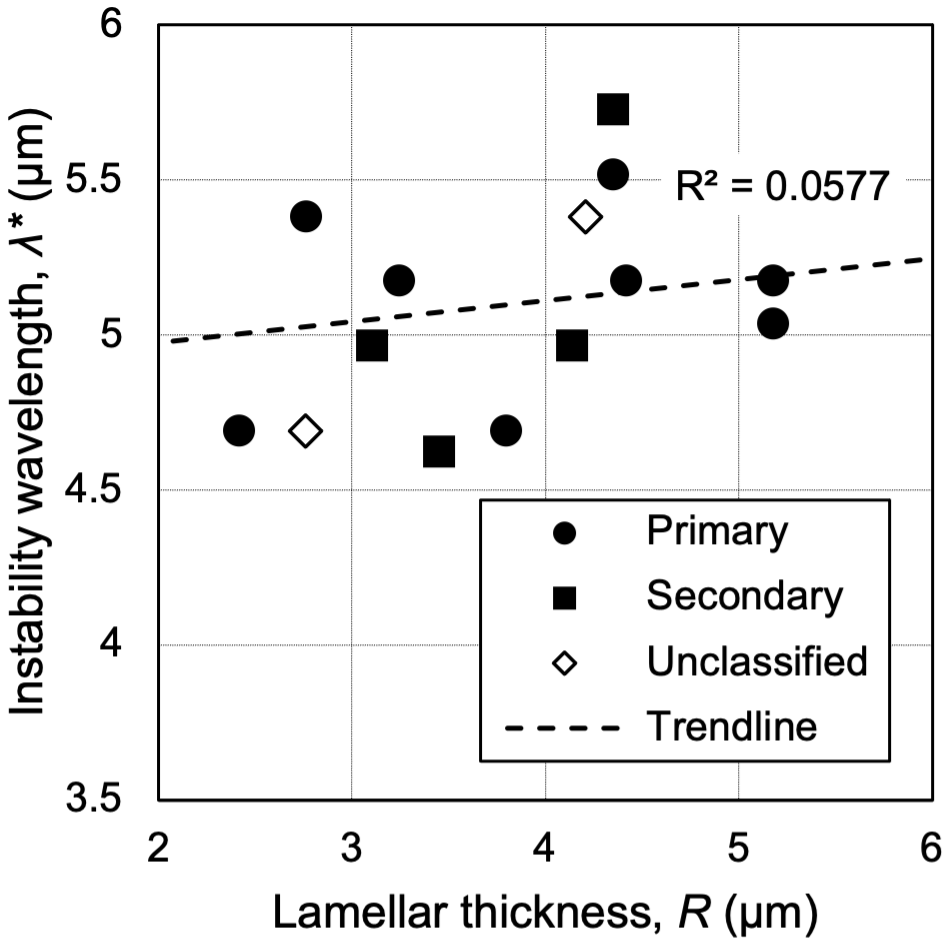
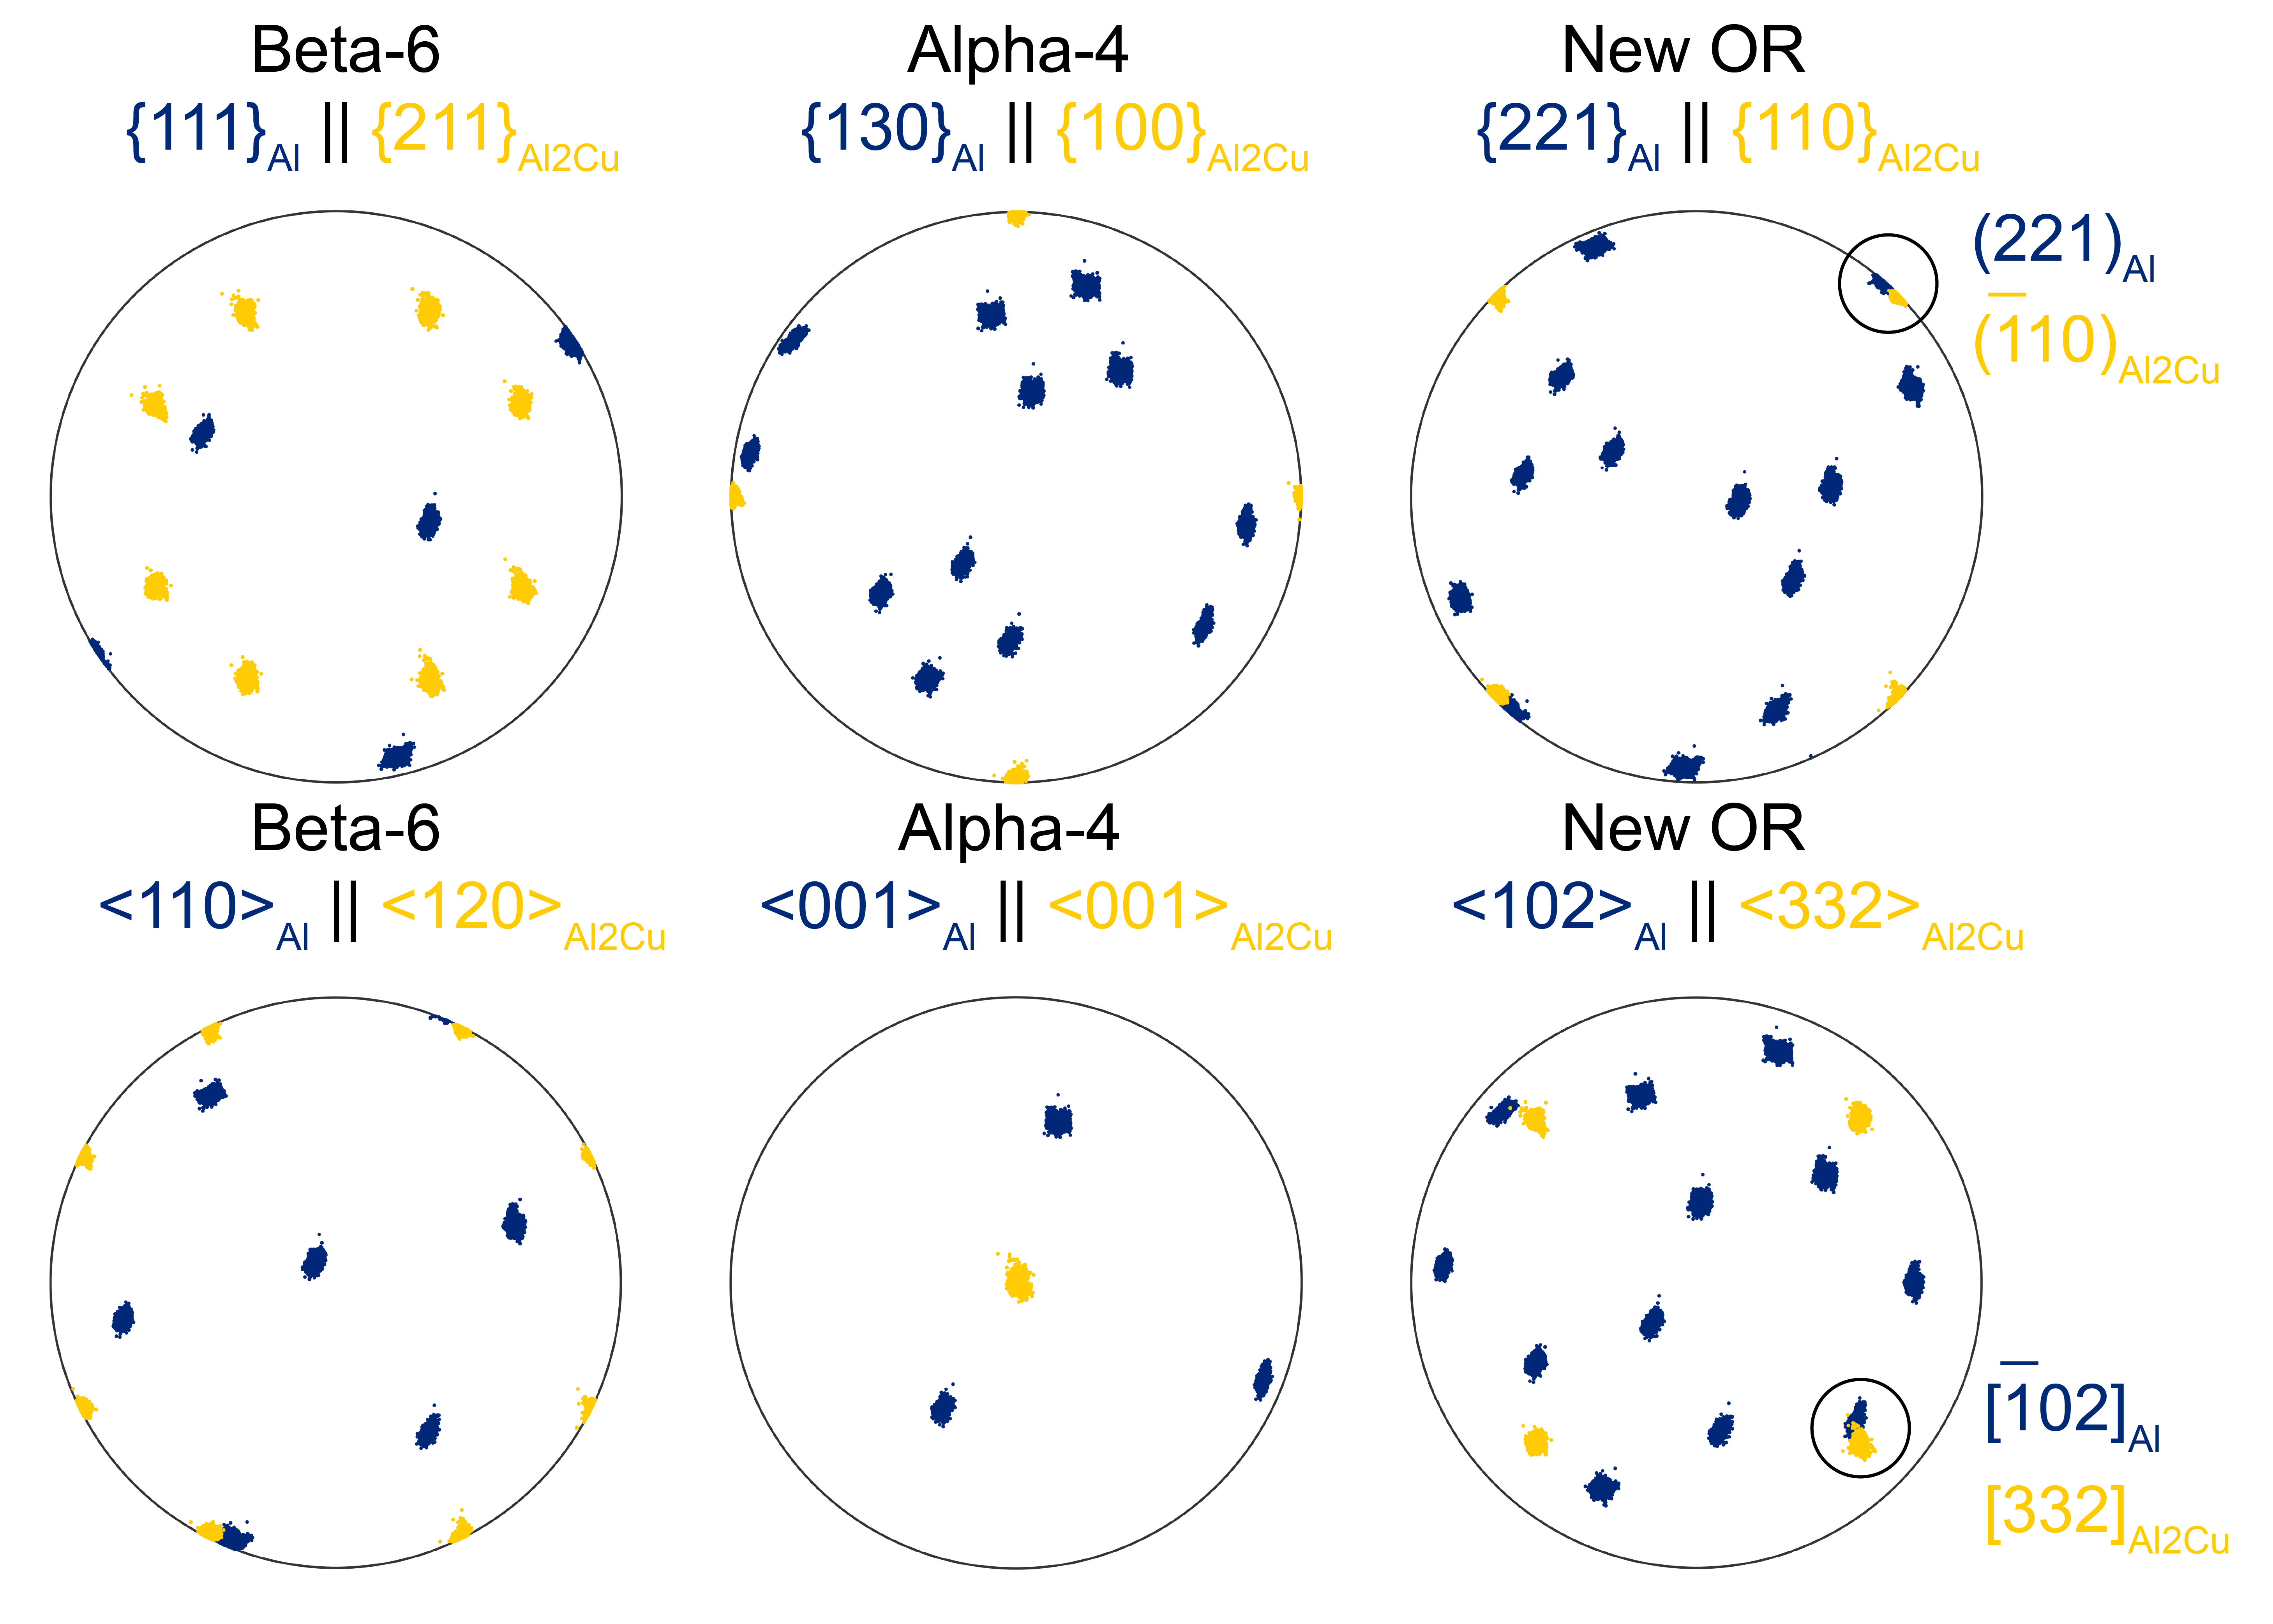
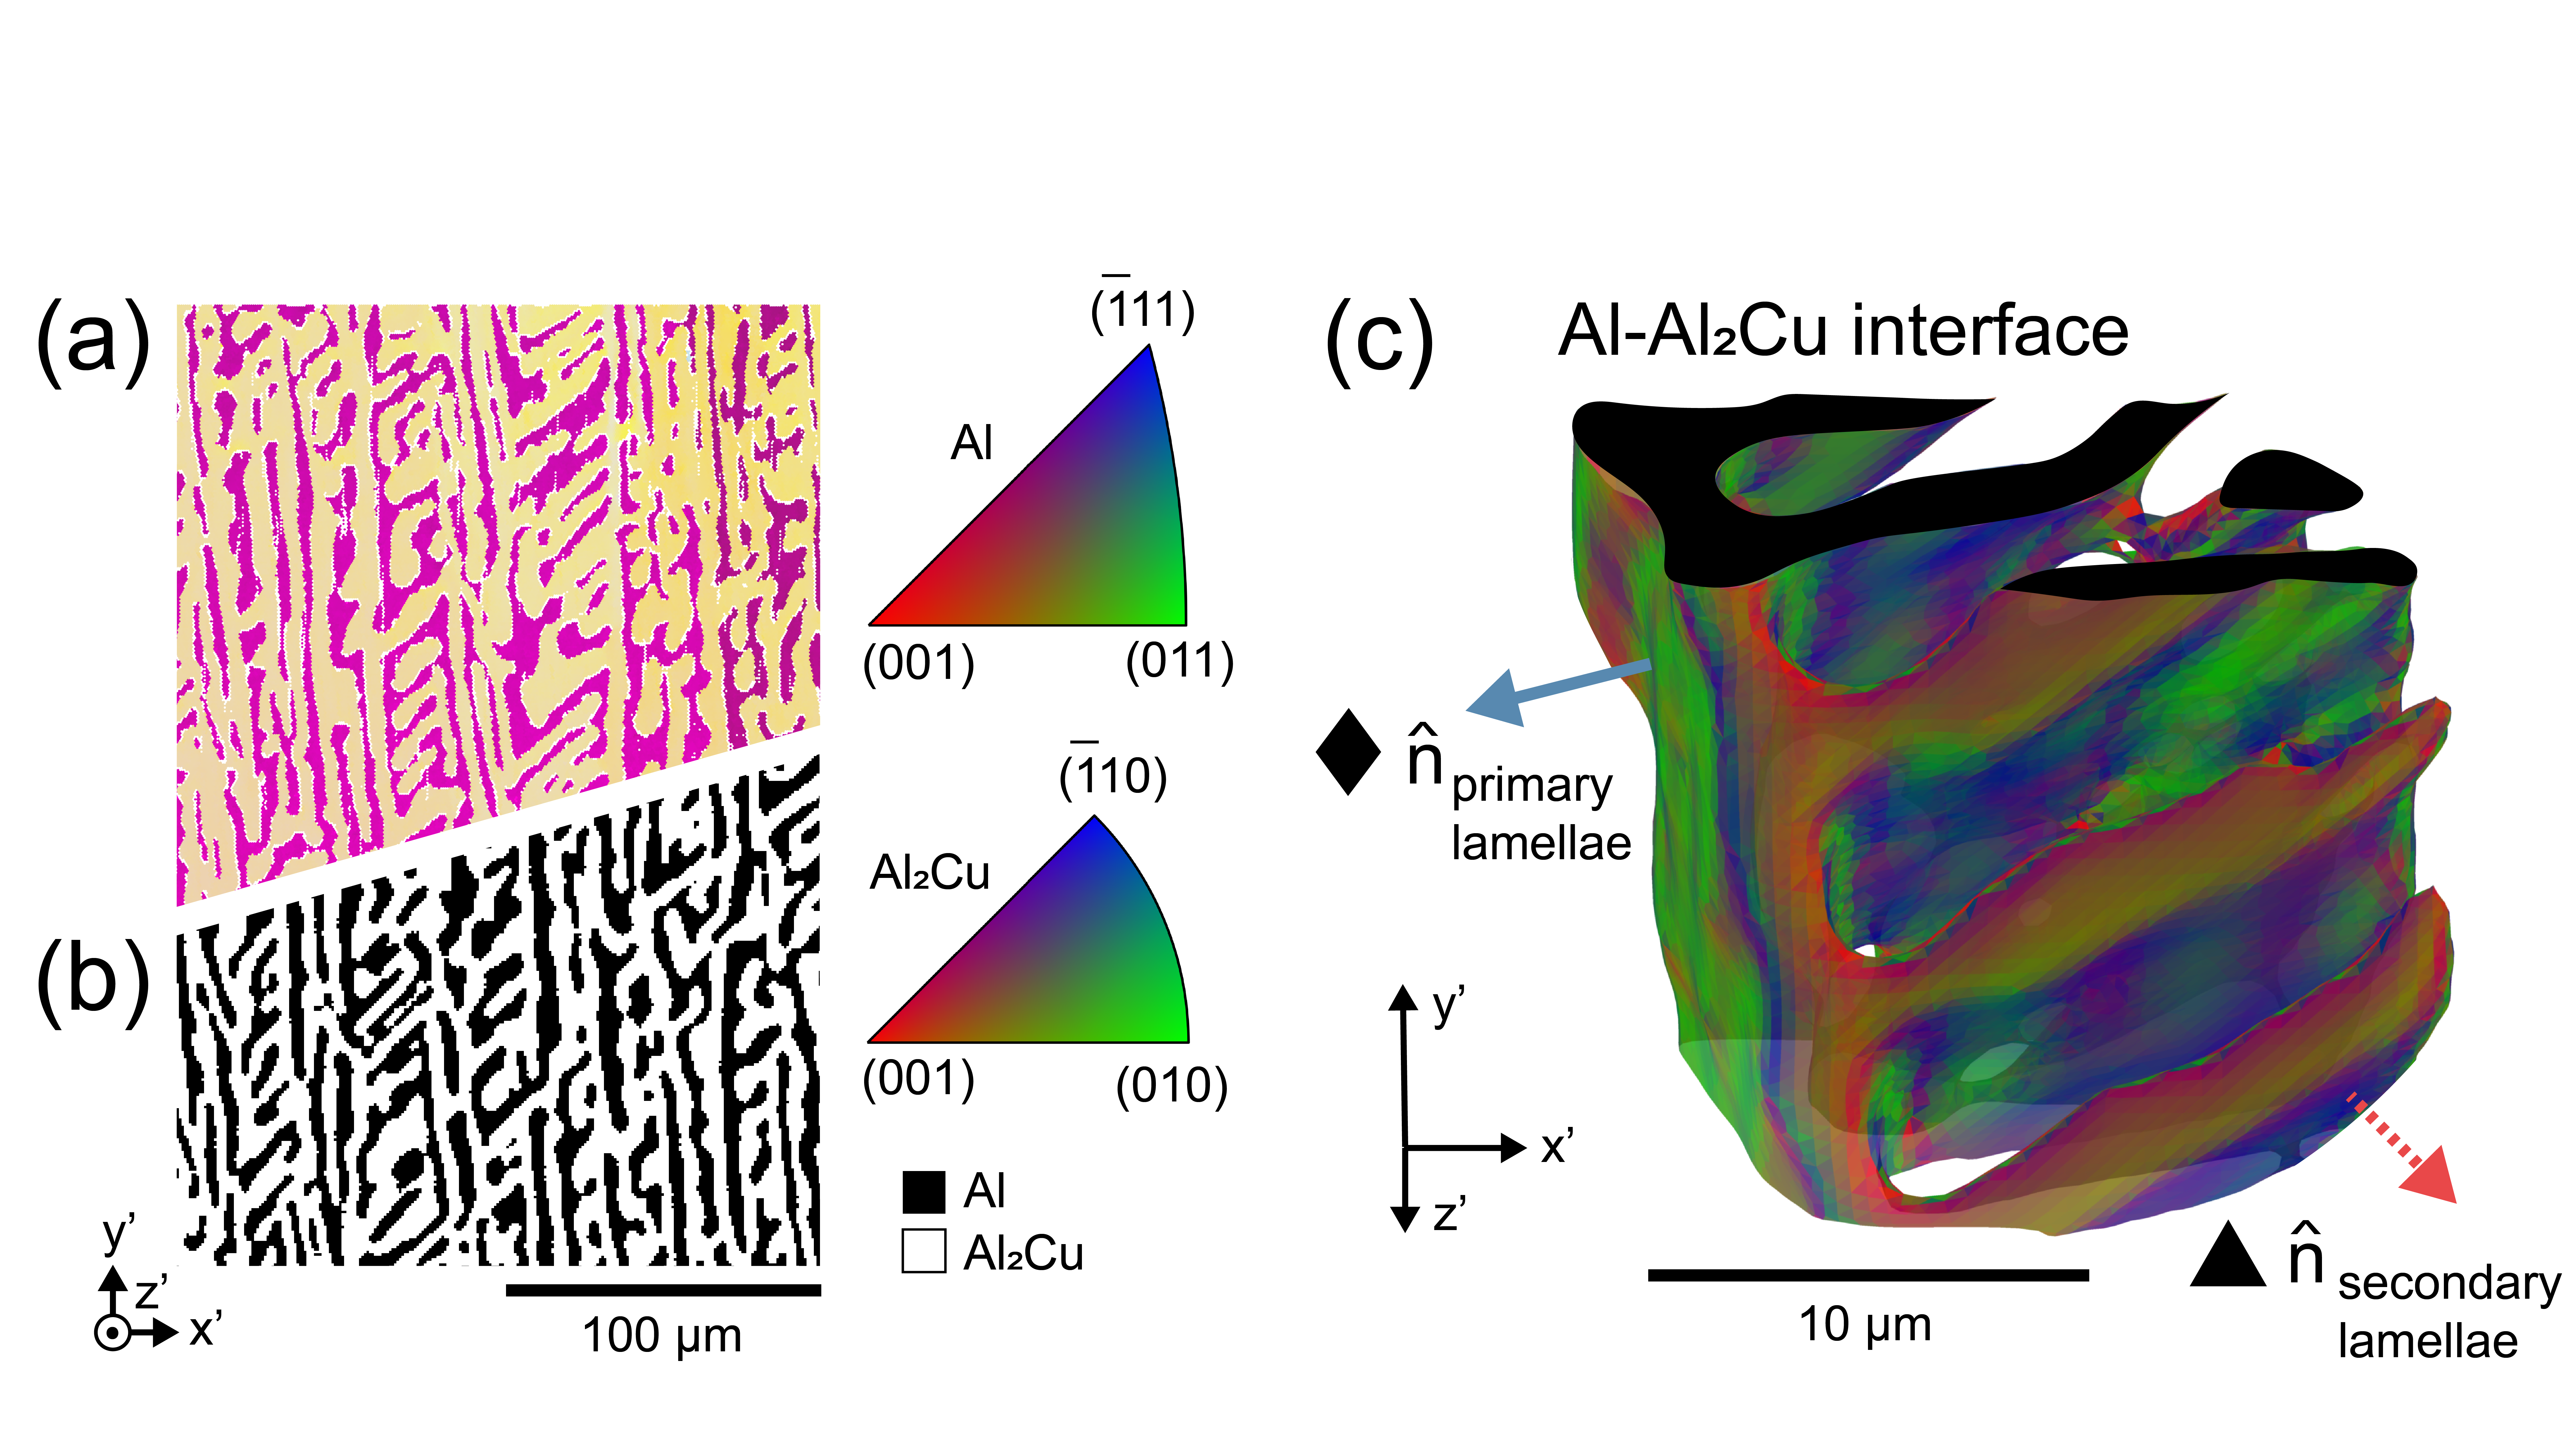
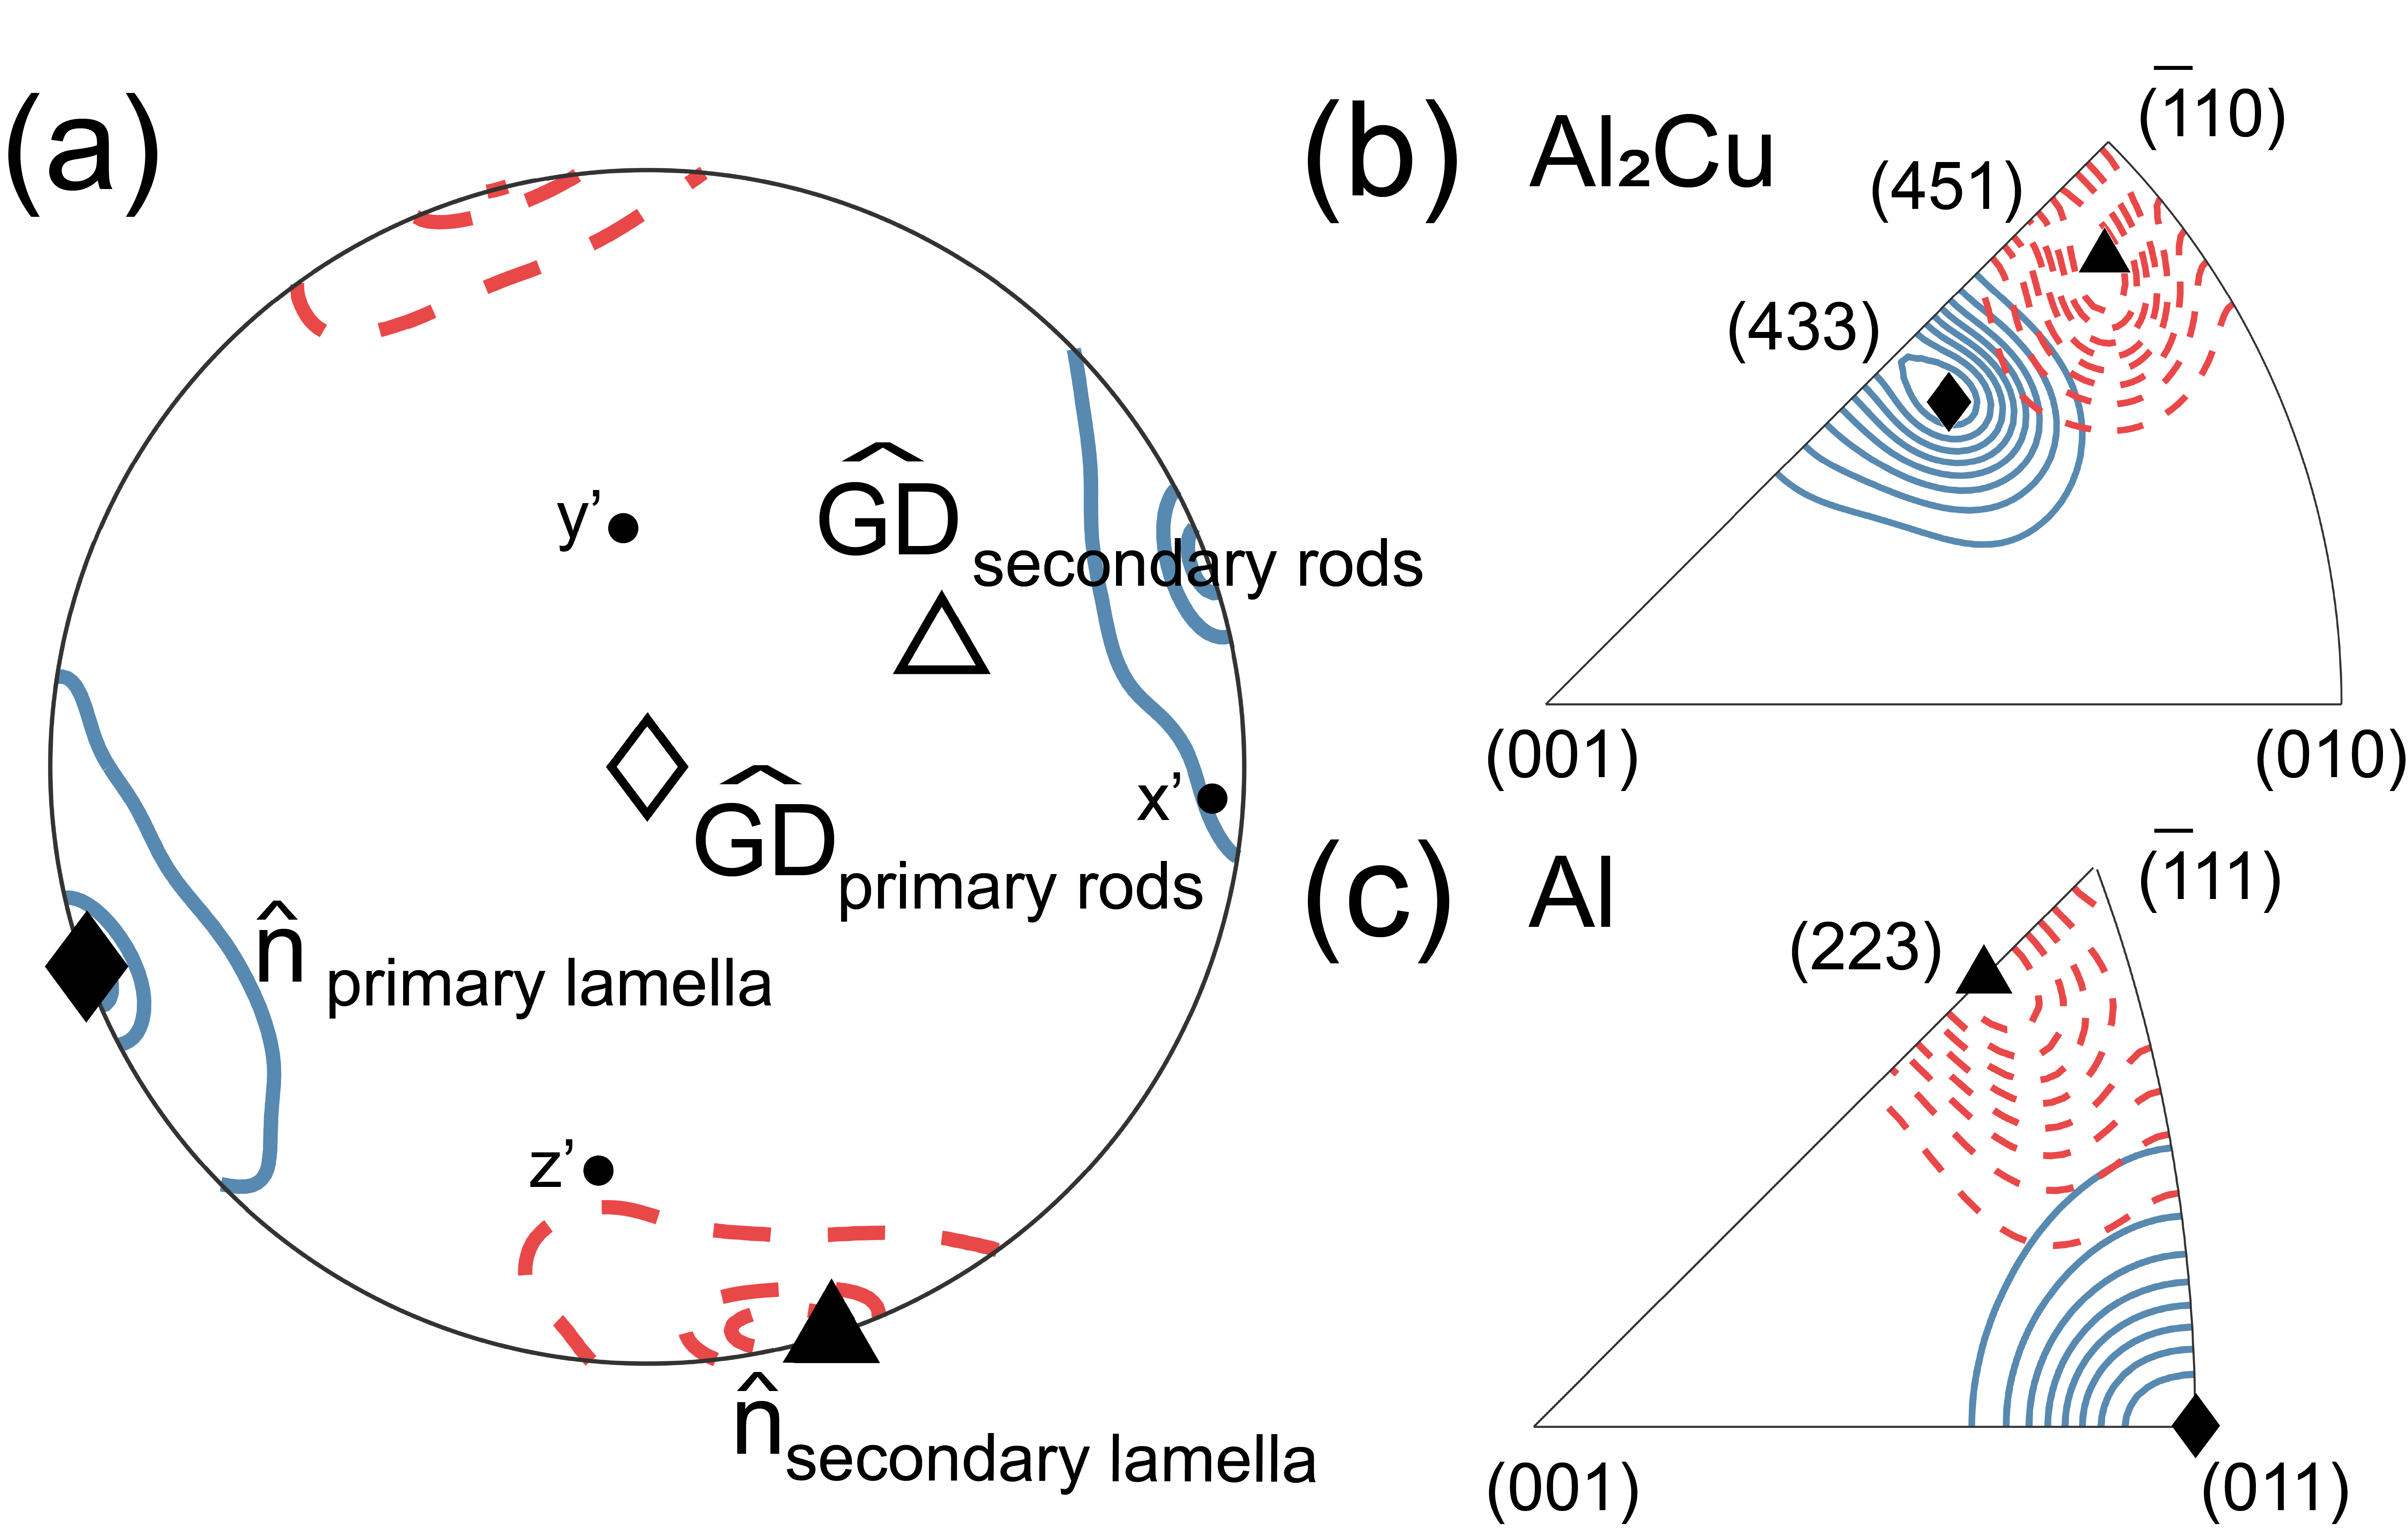
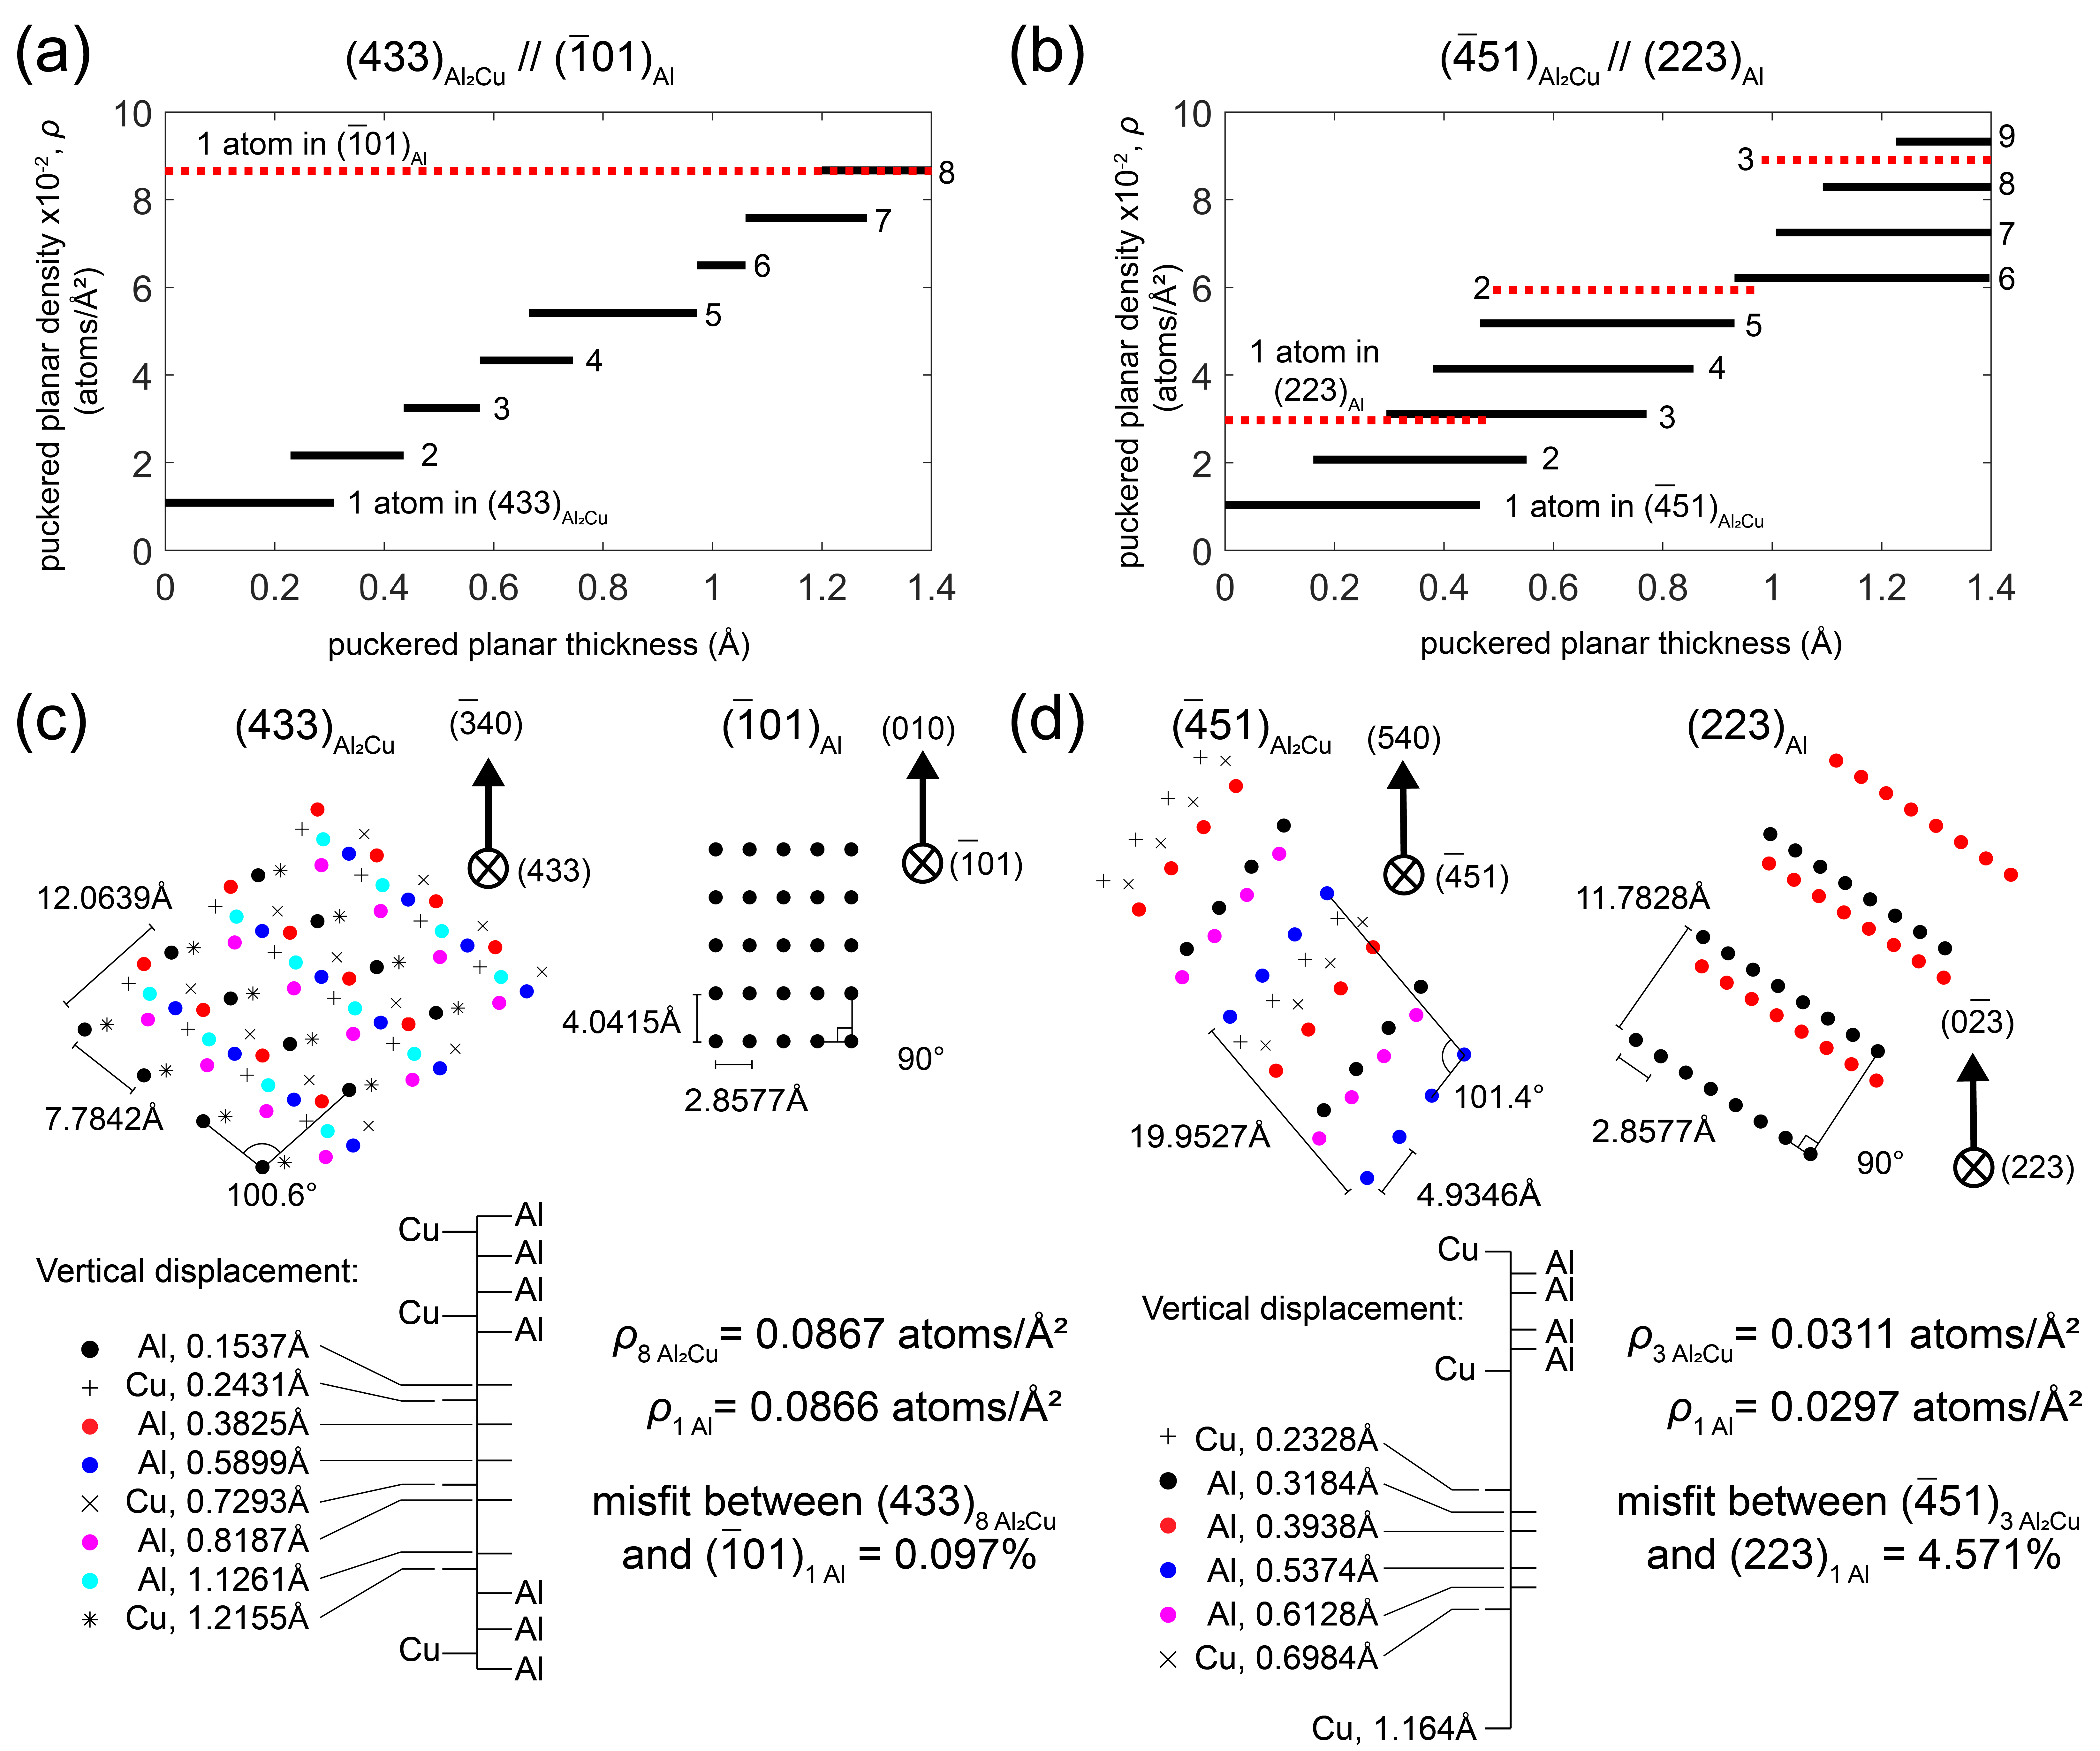
Supplemental Information
| Element | (wt %) |
|---|---|
| Cr | 0.01 |
| Cu | 33.7 |
| Fe | 0.01 |
| Mg | 0.01 |
| Mn | 0.01 |
| Ni | 0.01 |
| Pb | 0.01 |
| Si | 0.02 |
| Sn | 0.01 |
| Ti | 0.01 |
| Zn | 0.01 |
| Al | Remainder |
