Anomalous ferromagnetic behavior in the orthorhombic Li3Co2SbO6
Abstract
Monoclinic Li3Co2SbO6 has been proposed as a Kitaev spin liquid candidate and investigated intensively, whereas the properties of its polymorph, the orthorhombic phase, is less known. Here we report the magnetic properties of the orthorhombic Li3Co2SbO6 as revealed by dc and ac magnetic susceptibility, muon spin relaxation (SR) and neutron diffraction measurements. Successive magnetic transitions at (115, 89 and 71) K were observed in the low field dc susceptibility measurements. The transitions below (= 115 K), are suppressed in higher applied fields. However, zero field, ac susceptibility measurements reveals distinct frequency independent transitions at about (114, 107, 97, 79 and 71) K. A long range magnetic ordered state was confirmed by specific heat, SR and neutron diffraction measurements, all indicating a single transition at about 115 K. The discrepancy between different measurements is attributed to possible stacking faults and/or local disorders of the ferromagnetic zig-zag chains, resulting in ferromagnetic boundaries within the overall antiferromagnetic matrix.
pacs:
I Introduction
Co2+ based honeycomb lattice materials are of great interests due to the possible realization of the Kitaev model Liu and Khaliullin (2018); Sano et al. (2018); Xiao et al. (2019); Yan et al. (2019); Liu et al. (2020); Songvilay et al. (2020); Yao and Li (2020); Lin et al. (2021); Lefrançois et al. (2016); Bera et al. (2017). The 3d electrons are more localized compared to those of the 4d (Ru) or 5d (Ir) systems, and could suppress the undesired long range interactions beyond the nearest neighbors. Moreover, the extra eg-electrons introduce more interaction channels which can be tuned to effectively quash the non-Kitaev terms in the Hamiltonian Liu et al. (2020). Such candidates include A3Co2SbO6 and A2Co2TeO6 (A = alkali metals). Among these, the Li3Co2SbO6 has two polymorphs, one crystalizes in the monoclinic structure with the Co honeycomb lattice, and the other in the orthorhombic structure Brown et al. (2019). In the monoclinic phase, the Co-O-Co angle is close to 90∘, making this material a better approximation to the Kitaev model than the well studied RuCl3 Cao et al. (2016) or Na2IrO3 Choi et al. (2012). Recent neutron powder diffraction measurements on the monoclinic Li3Co2SbO6 confirm the formation of ferromagnetic honeycomb layers which stack antiferromagnetically along the -direction Vivanco et al. (2020). On the other hand, the orthorhombic phase is less investigated.
The main feature of the crystal structure of the orthorhombic Li3Co2SbO6 can be viewed as a stacking of Co-O zig-zag chains along the c-axis. The chains, from layer to layer, run along the [110] and [1-10] directions alternatively, as shown in Fig. 1(a). The Co ions along the chain are connected via edge-shared CoO6 octahedra, while the interchain Co ions are connected via corner-shared CoO6 octahedra. The intra- and interchain Co-O-Co angles are about 92∘ and 170∘, presumably leading to antiferromagnetic and ferromagnetic interactions, respectively. Previous studies by Brown et al. have shown that the sample has three transitions at 113, 80 and 60 K, as revealed by dc magnetic susceptibility measurements. Similar multiple transitions in the dc magnetic susceptibility below have been observed in the honeycomb phase such as Na2Co2TeO6 Bera et al. (2017); Xiao et al. (2019). Also, the honeycomb phase of Li3Co2SbO6 clearly shows a bifurcation at 75 K, well above the antiferromagnetic transition temperature = 14 K Brown et al. (2019). However, the nature of these multiple transitions remains unclear. Brown et al. have also performed neutron powder diffraction measurements on the title compound, but unfortunately, failed to unravel the magnetic structure of the ordered state Brown et al. (2019). These findings demonstrate the rich properties in the orthorhombic phase, which deserves further investigations.
In order to elucidate the magnetic ground state and the origin of the successive transitions, we have performed detailed dc and ac magnetic susceptibility, together with muon spin relaxation (SR) and neutron diffraction measurements, which enable us to reveal the underlying magnetic ground state from a microscopic aspect. The most surprising result is the observation of multiple sharp ferromagnetic transitions from the ac susceptibility measurement, which have almost no correspondence in the dc magnetic susceptibility, nor in the SR or neutron measurements. We propose that these anomalies most likely originate from the stacking faults and/or local disorders of the zig-zag chains, thus, forming ferromagnetic regions with small volume fraction that is difficult to be detected by other techniques, but can not conclusively rule out other possibilities, like charge fluctuations, spin stripes, or cluster glass dynamics.
II Experimental Section
Polycrystalline samples of orthorhombic Li3Co2SbO6 was prepared by a conventional solid state reaction method. Li2CO3 (99.99%) was dried at 120∘C for 4 hours prior to the reaction. It was then mixed with Sb2O3 (99.99%) in the appropriate ratio to form the Li3SbO4 precursor, which was then mixed with stoichiometric CoO powders and ground thoroughly in an agate mortar, pressed into pellet and calcined between 1100 and 1150∘C for 24 hours with several intermediate grindings. The phase purity was confirmed both by laboratory x-ray diffraction (XRD) and neutron powder diffraction (NPD) measurements.
The dc and ac magnetic susceptibility measurements were performed using the vibrating sample magnetometer (VSM) and ACMS-II options, respectively, of the Physical Property Measurement System (PPMS DynaCool, Quantum Design). For the ac susceptibility measurement, excitation fields of 5 Oe in amplitude are superimposed to various dc bias fields (including zero field). The heat capacity was measured using the relaxation method in the PPMS.
Muon spin relaxation measurements were performed on the GPS spectrometer at the Paul Scherrer Institute (PSI), Villigen, Switzerland. Nearly 100% polarized muons were injected into the sample and the decayed positrons, which are emitted preferentially along the muon spin direction, were detected. The asymmetry is defined as A(t) = [N(t) - B(t)]/[N(t) + B(t)], where N(t) and B(t) are the number of positrons arrived at the forward and backward detectors at time t, and the parameter reflects the relative counting efficiencies of the two detectors. Here, the forward and backward detectors are referred to the ones located at the top and down positions, respectively, with the muon spin polarization being rotated about 45∘ with respect to the beam. The data was analyzed using the Musrfit software.Suter and Wojek (2012)
Neutron powder diffraction measurements were carried out on the HRPT diffractometer at PSI. Approximate 10 g of the samples with natural Li were loaded into a vanadium can. Neutron wavelengths of 1.15 Å and 1.89 Å were used for the nuclear and magnetic structure refinement, respectively. The neutron data was analyzed using the FullProf software suite.Rodríguez-Carvajal (1993)
III Results
III.1 nuclear structure
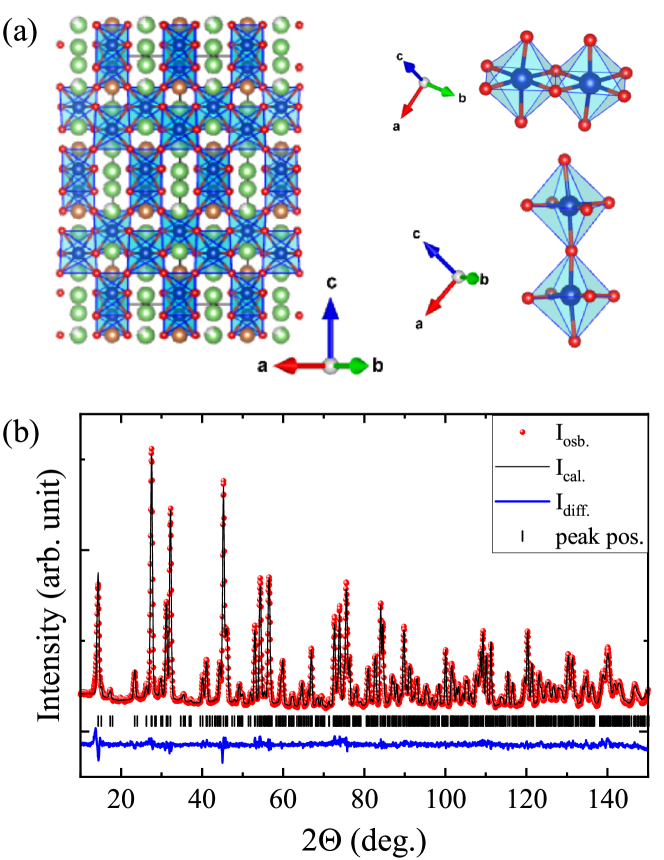
The synthesized sample crystallizes in the orthorhombic phase with space group . Since the laboratory XRD is not sensitive to the light element Li, the nuclear structure refinement was conducted against the NPD pattern collected at 130 K, as shown in Fig. 1(b). Assuming a full occupancy at each site, it was found that the isotropic thermal parameter, , of Li2 at the 8b site is unusually large. This is consistent with a previous study, where it was assumed that a small amount of Co ions replace the Li ions at this site Brown et al. (2019). However, in this case, some of the Co ions will possess the rare valence state of 1+. Therefore, a Li vacancy at the Li2 site is assumed in our refinement, which is reasonable considering the volatile nature of Li at high temperatures. This naturally leads to a mixing of the more common Co2+ and Co3+ valence states. The refined structural parameters are summarized in the Tab. 1. It was determined that there is a small Li deficiency of amount, 7%, in our sample. In other words, a maximum of about 7% of the Co ions are in the 3+ valence state in order to keep charge neutrality.
| atom | x | y | z | (Å2) | occ. |
|---|---|---|---|---|---|
| Li1 (16g) | 0.12500 | 0.62500 | 0.28578(35) | 1.064(98) | 1 |
| Li2 (8b) | 0.12500 | 0.62500 | 0.12500 | 0.887(165) | 0.79(2) |
| Co (16g) | 0.12500 | 0.12500 | 0.29475(21) | 0.263(46) | 1 |
| Sb (8a) | 0.12500 | 0.12500 | 0.12500 | 0.294(28) | 1 |
| O1 (16g) | 0.12500 | 0.35378(13) | 0.12500 | 0.417(20) | 1 |
| O2 (32h) | 0.11178(14) | 0.37007(18) | 0.29559(6) | 0.314(10) | 1 |
III.2 magnetic susceptibility
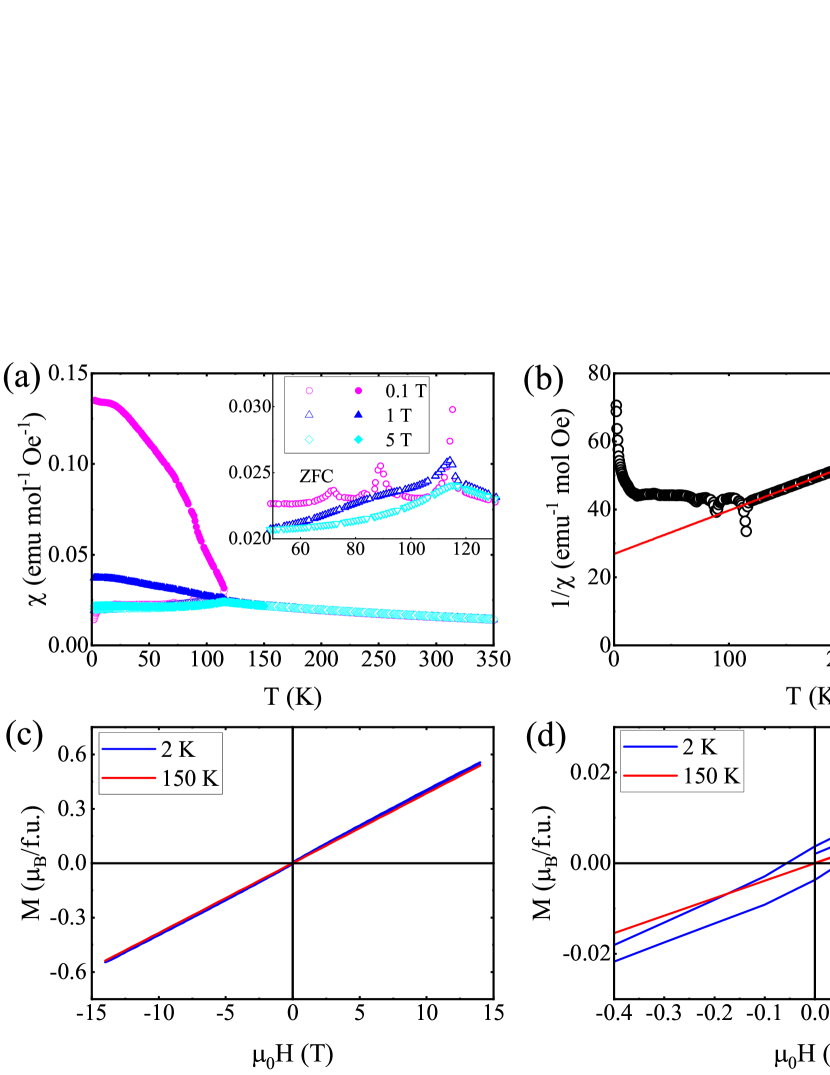
Temperature dependence of the dc magnetic susceptibility is presented in Fig. 2(a). A bifurcation can be seen below 115 K for the zero-field-cooled (ZFC) and field-cooled (FC) curves, which is most apparent for the 0.1 T data, and gradually suppressed with increasing fields. At 5 T, the two curves almost overlap. A careful inspection of the ZFC curve, as shown in the inset of Fig. 2(a), reveals more complex behavior below . In addition to the peak at 115 K, two small peaks appear at 89 and 71 K, which are also suppressed by the magnetic field, and already disappear at 1 T. A Curie-Weiss fit, , to the 0.1 T ZFC curve above 150 K resulting in an effective moment of 5.60 /Co and Curie-Weiss temperature of -210 K. The large effective moment indicates that the Co2+ ions are in the high spin state (S = 3/2) with substantial orbital moment Guo et al. (2021). The negative is suggestive of the dominant antiferromagnetic interactions among Co ions. The bifurcation between the ZFC and FC curves suggests the existence of ferromagnetic components on top of the antiferromagnetic ground state, which is further verified by the isothermal hysteresis measurements. As shown in Fig. 2(c), the M vs. H curves are almost linear down to the lowest temperature, as expected for an antiferromagnet. However, a closer lookup of the curve in the low field region clearly show hysteresis effect, consistent with the M vs. T measurements.
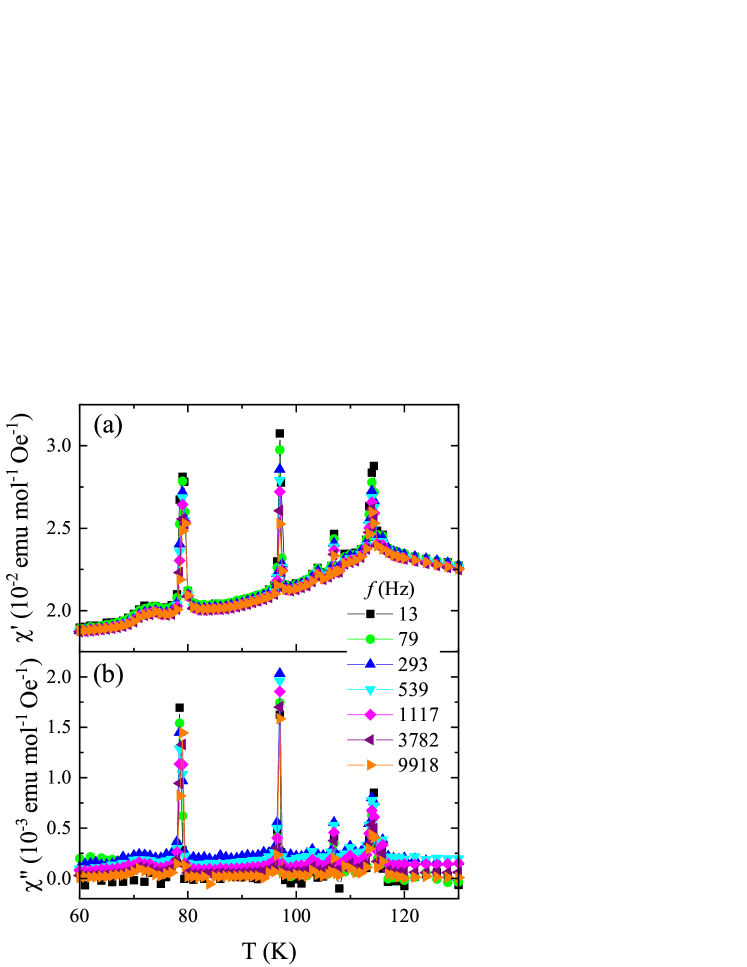
In order to further investigate the nature of the successive transitions below , a series of ac susceptibility measurements have been performed. The samples used for the dc and ac susceptibility measurements shown here are from the same batch, but not exactly the same ones. Those using exactly the same sample for the dc and ac susceptibility measurements are shown in the Supplementary Materials (SM) Fig. S1. Figure 3 show the temperature dependence of the real () and imaginary () components of the ac susceptibility with various driven frequencies and no dc bias field. Remarkably, at least four sharp peaks (FWHM less than 1 K) can be observed at 114, 107, 97 and 79 K both in and . The sharp-peak positions are independent of the frequencies, ruling out the formation of spin glass state Guo et al. (2016). Combined with the presence of nonzero , these results suggest the presence of the ferromagnetic components. Surprisingly, the peaks below have no correlation with those observed below (= 115 K) in the dc susceptibility measurements (89 K and 71 K), see also Fig. S1 in SM. A more careful inspection of the ac susceptibility data reveals a weak, broad peak at 73 K in (71 K in ) in Fig. 4, which can be associated with the low temperature peak (71 K) observed in the dc measurement. However, the 89 K peak is still invisible in the ac susceptibility.
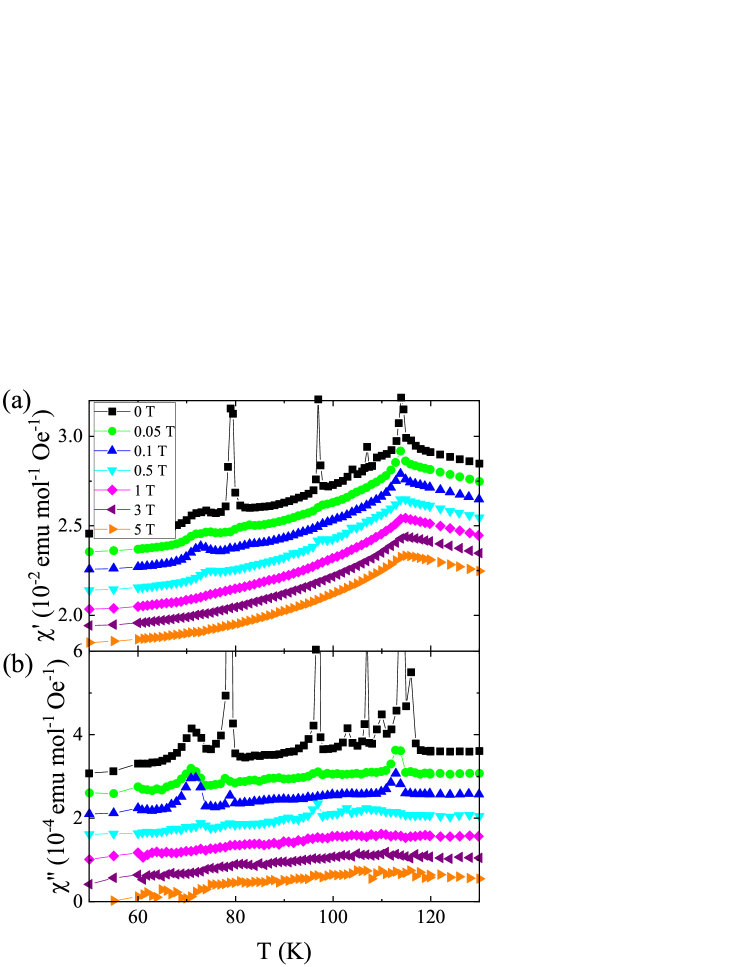
Figure 4 shows the dc field dependence of the ac susceptibility at a fixed frequency of 3782 Hz. The sharp peaks at (107, 97 and 79) K are profoundly affected by dc fields, and are almost completely suppressed with a dc field of 0.05 T, whereas the 71 K peak persists to 0.1 T. Above 0.5 T, only the signature of survives, which behaves as a kink in , has no anomaly in , and does not change in fields up to 5 T, consistent with an antiferromagnetic transition.
III.3 specific heat
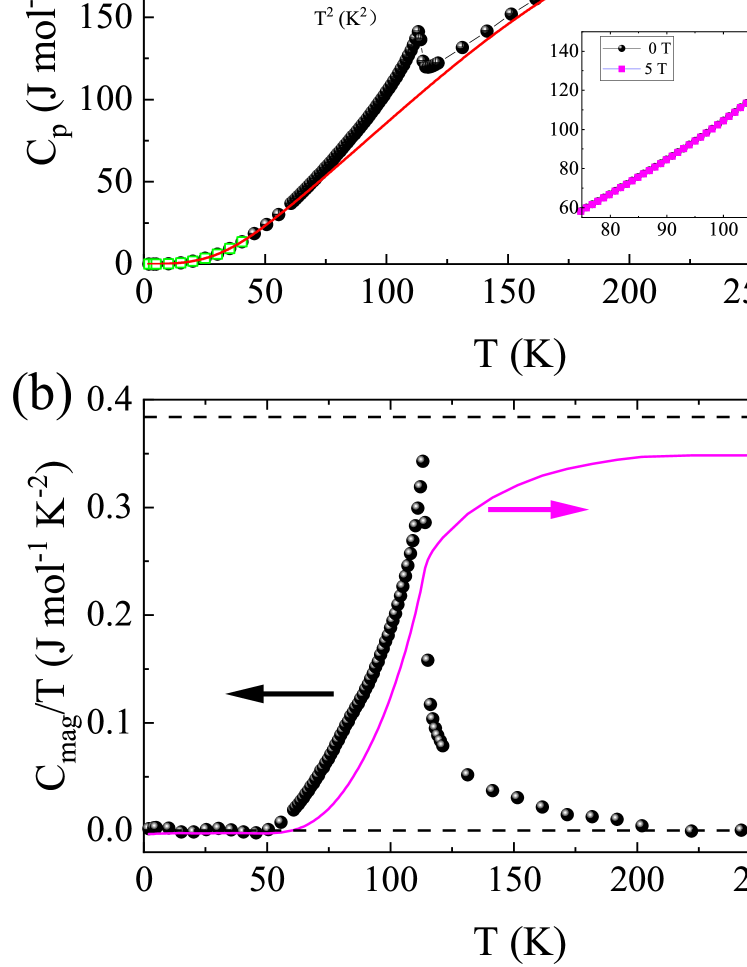
The specific heat, , is presented in Fig. 5(a). A -shaped transition can be observed at = 115 K. No further anomaly is observed at lower temperatures. The transition at 115 K is very robust to magnetic field, no obvious changes can be observed at 5 T, as shown in the right inset and consistent with the ac susceptibility. The low temperature ( 40 K) region is described well by (T)/T = +T2, yielding a negligibly small of 3(2) mJ/mol-K2, and of 2.08(2) 10-4 J/mol-K4, indicating that the low temperature specific heat is dominated by phonon contributions. The Debye temperature extracted from , where r is the number of atoms in the chemical formula and is the ideal gas constant, amounts to 482 K. In order to extract the magnetic contributions from the total heat capacity, the phonon contributions are estimated from a fit with a combination of the Debye and Einstein model,
| (1) |
using the high temperature ( 220 K) and low temperature ( 40 K) data points marked as green circles in Fig. 5. The best fit results in about = 42% weight to the Debye term. The obtained Debye temperature, , amounts to 356 K, in reasonable agreement with the one extracted from the low temperature fitting alone, while the Einstein temperature is 620 K. The magnetic contribution, , is thus obtained by subtracting the fitted phonon contribution from the total heat capacity, and the magnetic entropy is then calculated by integrating , as shown in Fig. 5. The calculated release of entropy is about 10.5 J/mol-K, which is close to the value expected for an effective spin s = 1/2 state [2Rln(2s+1) = 11.52 J/mol-K].
III.4 muon spin relaxation
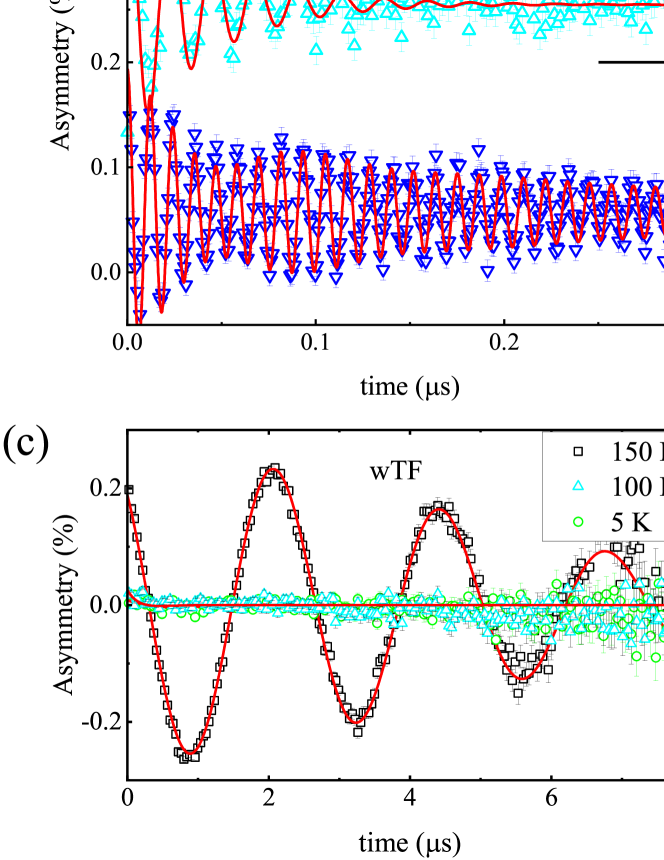
In order to unravel the origin of the enigmatic magnetic behavior observed in the bulk, static and dynamic susceptibility measurements, we have performed local-probed SR measurements. Figure 6(a) shows the ZF-SR time spectra measured at various temperatures. At 150 K, the spectrum exhibits a gaussian-shaped depolarization behavior, indicating an electronic paramagnetic state, and the depolarization is mainly caused by the nuclear moments. With a decrease in temperature, the initial asymmetry drops quickly, showing a dramatic change of the spectra around = 115 K. In the early time regions, Fig. 6(b) exhibits clear muon spin precessions at low temperatures. At the base temperature (1.6 K), two independent components are required to describe the oscillating spectra creating a beating, however, by , the two frequencies become comparable and merge into one frequency (see the 110 K spectrum). In order to extract useful parameters from the spectra, a relaxation function
| (2) |
was fit to the spectra above 110 K, where is the initial asymmetry at time zero, the gaussian Kubo-Toyabe function Guo et al. (2013), and the relaxation rate caused by electronic spins. At low temperatures, a three-component function
| (3) |
was used to describe the spectra, where is the amplitude of each component with the constraint , the internal field at the muon site, = 13.55 MHz/kOe the gyromagnetic ratio of muon, and is the corresponding relaxation rate for each component.
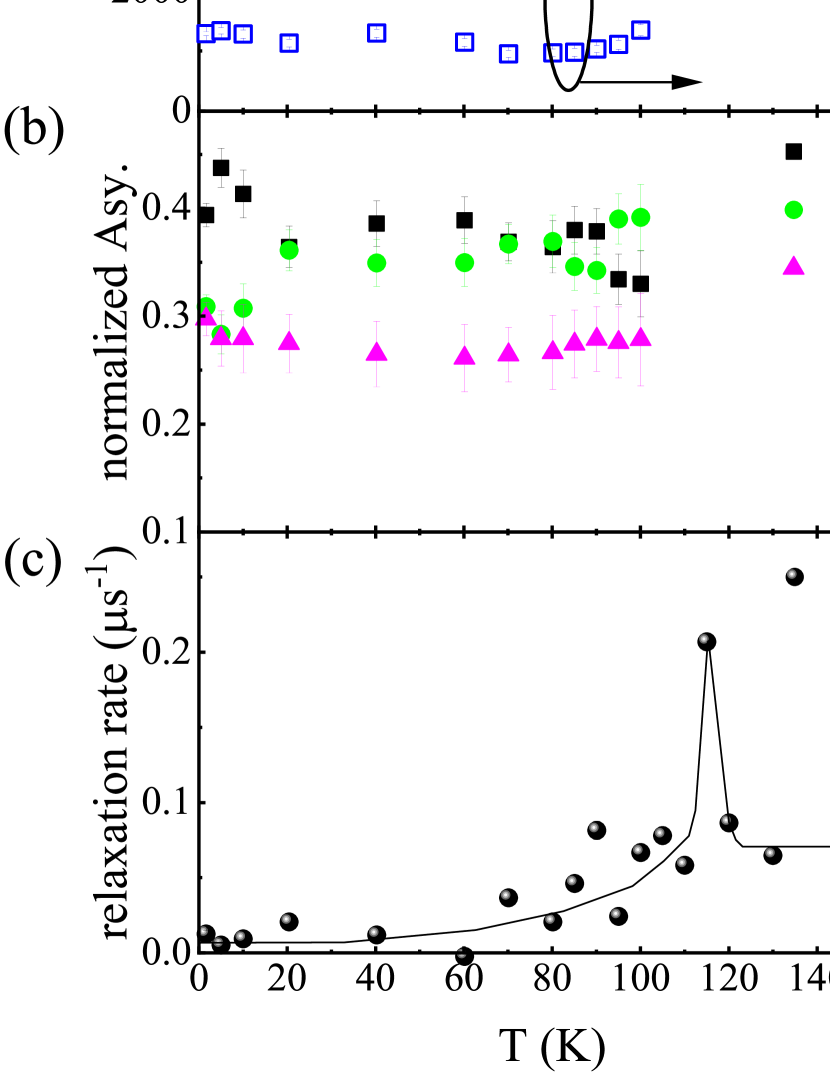
The temperature dependence of the extracted parameters are shown in Fig. 7. Two internal fields can be resolved at the base temperature and these remain almost constant until 60 K. With the increase in the temperature, the difference gets smaller, and becomes indistinguishable around , denoted as in Fig. 7(a). It is worth noting that the depolarization rate is almost one order larger than , indicating a much broader distribution for the component. The amplitude for these two components, and , are comparable over the whole temperature range. On the other hand, the fitted component, which reflects the portion of muons with the spin parallel to the internal fields, is 0.3 at temperatures below 100 K, indicating that nearly 100% of the spin system is static not . This is further corroborated from the weak transverse field (wTF) measurement as shown in Fig. 6(b). The paramagnetic volume fraction is proportional to the oscillation amplitude, and it is clearly seen that the oscillation amplitude is almost absent below 100 K. Finally, the magnetic transition temperature can also be inferred from the divergent behavior of , which reflects the critical slowing down of the electronic spins, and a sharp peak can be observed at 115 K, as shown in Fig. 7(c), consistent with the heat capacity and high temperature magnetic transition.
III.5 neutron powder diffraction
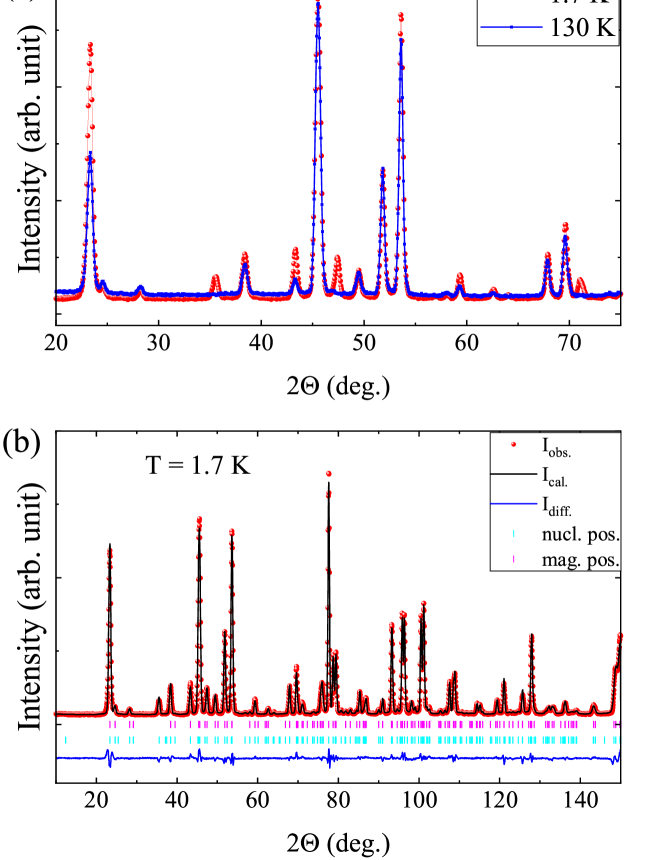
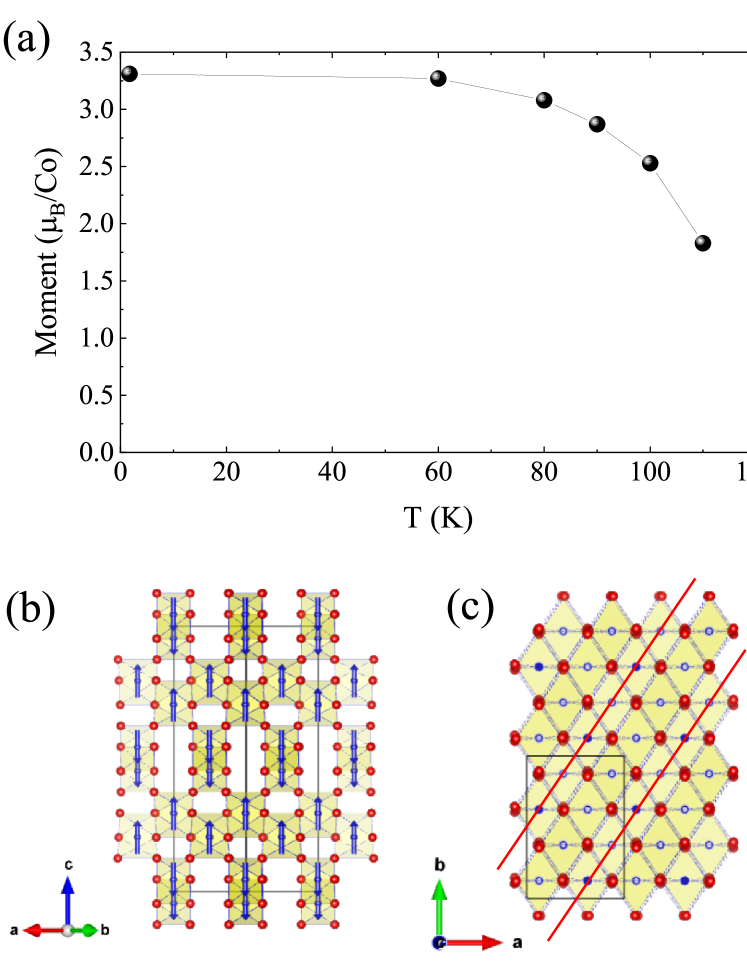
More insights to the magnetic ground state of this compound are obtained from neutron powder diffraction measurements. Figure 8(a) compares the neutron pattern measured just above the transition temperature and at the base temperature. Substantial magnetic intensities can be observed on top of the nuclear reflections, indicating a k = 0 propagation vector. No qualitative difference is observed in the intermediate temperature range (data not shown). The magnetic structure was determined with the aid of irreducible representation analysis using the BasIreps program. For the Co ions at the 16g site with space group Fddd and propagation vector k = 0, the magnetic reducible representation is decomposed into eight irreducible representations (IRs). The basis vectors for each IR can be found in SM Tab. S1. The complexity due to stacking faults, as will be discussed later, and mixing valence state of Co ions are neglected during the refinement. Therefore, the obtained magnetic structure should be considered as an averaged one. Finally, it was found that only the IR can describe the pattern satisfactorily. The refined pattern is shown in Fig. 8, and the temperature dependence of the moment size of Co ion is presented in Fig. 9(a). The Co moments are pointing either parallel or antiparallel to the c-axis. The moments along the zig-zag chains are coupled ferromagnetically, while the interchain moments are coupled antiferromagnetically, following the Goodenough-Kanamori rules Kanamori (1959). Note that the moment size at the base temperature amounts to 3.31 /Co, which is larger than the spin only value for the high spin state of Co2+ (3 ), consistent with the expectation that substantial orbital moments are not quenched from the high temperature Curie-Weiss fitting.
IV Discussions
The most striking observation of the orthorhombic Li3Co2SbO6 is the multiple transitions below from the dc and ac susceptibility measurements. These transitions have the following characters: 1) they are ferromagnetic, although the overall ground state is antiferromagnetic; 2) they are quite soft and can be easily suppressed by a modest magnetic field; 3) they are not detected by other measurements such as heat capacity, SR and neutron diffraction. These results suggest that these transitions originate from a minor part of the sample and are reminiscent of transitions seen in the layered manganites La2-2xSr1+2xMn2O7 (x = 0.4), for which the ground state is ferromagnetic with 125 K, but additional ferromagnetic feature was observed near room temperature, that was also suppressed, or masked, by an applied magnetic field Seshadri et al. (1997), and was attributed to stacking faults of the perovskite layers Moreno et al. (2000) and other members of the Ruddlesden-Popper series. These peaks are also reminiscent of the multiple transitions observed in the RuCl3 due to stacking faults of the honeycomb layers Yamauchi et al. (2018). Such a stacking faults scenario is also plausible for the Li3Co2SbO6 case. From Fig. 9(c), one sees that the close-packed anion layered are stacked either along the [110] or the [1-10] direction, and the Co ions are sandwiched between these layers. If some of the layers as indicated by the red lines are missing, ferromagnetic regions could appear.
There could be other possibilities such as antisite disorder between the Li and Co ions as proposed by Brown et al. Brown et al. (2019), or the coexistence of Co2+ and Co3+ ions as found by our refinement. In both cases, the appearance of Li or Co3+ ions at the Co2+ site could disturb the long range magnetic ordering. For example, as shown in Fig. 9(b), the zig-zag chains running along the [110] and [1-10] directions are connected by corner-shared CoO6 octahedra, which favors antiferromagnetic interaction between the chains. If one of the Co2+ ions mediating this inerchain interaction is missing, the local structure around this defect may become ferromagnetic. Finally, the real situation could be a complicate combination of these individual effects.
The stacking faults or local site disorders may be inferred from the SR results. In Fig. 7(a), the relaxation rate, which is proportional to the internal field distribution width, corresponding to the internal field is much larger than that of . It can be surmised that muons that stopped around the stacking faults or local disorders contribute to the component, while those far from the defects contribute to the component, as was observed in Na2IrO3 Choi et al. (2012). Note that the amplitude of and are comparable, which seems to contradict with the conjecture that the ferromagnetic component only have a minor volume fraction. The argument is that the muons feel the field distribution via long range dipolar field, which extends over the ferromagnetic boundaries. On the other hand, the possibility that there exists two inequivalent muon sites with similar population cannot be ruled out, future DFT calculations will be helpful to clarify this point.
Another enigmatic phenomenon is the distinct transition temperature observed by ac and dc magnetic susceptibility measurements. One possibility is the different amplitude of the magnetic fields applied during the measurement, and the pinning barriers for the domains are too high for the ac measurement, as observed in the ferrimagnetic system FeCr2S4 Tsurkan et al. (2001). Nevertheless, unexplained differences between static and dynamic susceptibility are rare, and the origins are still open.
V Conclusions
The magnetic properties of the orthorhombic Li3Co2SbO6 have been studied in detail by means of dc and ac susceptibility, muon spin relaxation and neutron diffraction measurements. The sample forms an antiferromagetic ground state, with ferromagnetic chains stacked antiferromagnetically along the c axis. Additional transitions below are observed by dc and ac magnetic susceptibility measurements, which are ascribed to possible stacking faults and/or local disorders, resulting in the ferromagnetic component within the overall antiferromagnetic matrix. However, single crystal studies, probing local magnetic and crystallographic structure are required to fully understand the magnetic response in orthorhombic Li3Co2SbO6. Those findings are also suggestive for the honeycomb phase in which the honeycomb layers are prone to stacking faults, either nuclear structurally or magnetically, which may not be readily detected by bulk structural measurements.
H. G. acknowledges the support from the NSF of China with Grant No. 12004270, and Guangdong Basic and Applied Basic Research Foundation (2019A1515110517). This research is also partly supported by the NSF of China with Grant No. U1932155. A portion of this work was supported by the Laboratory Directed Research and Development (LDRD) program of Oak Ridge National Laboratory, managed by UT-Battelle, LLC for the U.S. Department of Energy.
References
- Liu and Khaliullin (2018) H. Liu and G. Khaliullin, Phys. Rev. B 97, 014407 (2018).
- Sano et al. (2018) R. Sano, Y. Kato, and Y. Motome, Phys. Rev. B 97, 014408 (2018).
- Xiao et al. (2019) G. Xiao, Z. Xia, W. Zhang, X. Yue, S. Huang, X. Zhang, F. Yang, Y. Song, M. Wei, H. Deng, and D. Jiang, Cryst. Growth Des. 19, 2658 (2019).
- Yan et al. (2019) J. Q. Yan, S. Okamoto, Y. Wu, Q. Zheng, H. D. Zhou, H. B. Cao, and M. A. McGuire, Phys. Rev. Materials 3, 074405 (2019).
- Liu et al. (2020) H. Liu, J. Chaloupka, and G. Khaliullin, Phys. Rev. Lett. 125, 047201 (2020).
- Songvilay et al. (2020) M. Songvilay, J. Robert, S. Petit, J. A. Rodriguez-Rivera, W. D. Ratcliff, F. Damay, V. Balédent, M. Jiménez-Ruiz, P. Lejay, E. Pachoud, A. Hadj-Azzem, V. Simonet, and C. Stock, Phys. Rev. B 102, 224429 (2020).
- Yao and Li (2020) W. Yao and Y. Li, Phys. Rev. B 101, 085120 (2020).
- Lin et al. (2021) G. Lin, J. Jeong, C. Kim, Y. Wang, Q. Huang, T. Masuda, S. Asai, S. Itoh, G. G nther, M. Russina, Z. Lu, J. Sheng, L. Wang, J. Wang, G. Wang, Q. Ren, C. Xi, W. Tong, L. Ling, Z. Liu, L. Wu, J. Mei, Z. Qu, H. Zhou, X. Wang, J.-G. Park, Y. Wan, and J. Ma, Nat. Commun. 12, 5559 (2021).
- Lefrançois et al. (2016) E. Lefrançois, M. Songvilay, J. Robert, G. Nataf, E. Jordan, L. Chaix, C. V. Colin, P. Lejay, A. Hadj-Azzem, R. Ballou, and V. Simonet, Phys. Rev. B 94, 214416 (2016).
- Bera et al. (2017) A. K. Bera, S. M. Yusuf, A. Kumar, and C. Ritter, Phys. Rev. B 95, 094424 (2017).
- Brown et al. (2019) A. J. Brown, Q. Xia, M. Avdeev, B. J. Kennedy, and C. D. Ling, Inor. Chem. 58, 13881 (2019).
- Cao et al. (2016) H. B. Cao, A. Banerjee, J. Q. Yan, C. A. Bridges, M. D. Lumsden, D. G. Mandrus, D. A. Tennant, B. C. Chakoumakos, and S. E. Nagler, Phys. Rev. B 93, 134423 (2016).
- Choi et al. (2012) S. K. Choi, R. Coldea, A. N. Kolmogorov, T. Lancaster, I. I. Mazin, S. J. Blundell, P. G. Radaelli, Y. Singh, P. Gegenwart, K. R. Choi, S.-W. Cheong, P. J. Baker, C. Stock, and J. Taylor, Phys. Rev. Lett. 108, 127204 (2012).
- Vivanco et al. (2020) H. K. Vivanco, B. A. Trump, C. M. Brown, and T. M. McQueen, Phys. Rev. B 102, 224411 (2020).
- Suter and Wojek (2012) A. Suter and B. M. Wojek, Physics Procedia 30, 69 (2012).
- Rodríguez-Carvajal (1993) J. Rodríguez-Carvajal, Physica B 192, 55 (1993).
- Guo et al. (2021) H. Guo, L. Zhao, M. Baenitz, X. Fabrèges, A. Gukasov, A. Melendez Sans, D. I. Khomskii, L. H. Tjeng, and A. C. Komarek, Phys. Rev. Research 3, L032037 (2021).
- Guo et al. (2016) H. Guo, K. Manna, H. Luetkens, M. Hoelzel, and A. C. Komarek, Phys. Rev. B 94, 205128 (2016).
- Guo et al. (2013) H. Guo, H. Tanida, R. Kobayashi, I. Kawasaki, M. Sera, T. Nishioka, M. Matsumura, I. Watanabe, and Z.-a. Xu, Phys. Rev. B 88, 115206 (2013).
- (20) .
- Kanamori (1959) J. Kanamori, J. Phys. Chem. Solids 10, 87 (1959).
- Seshadri et al. (1997) R. Seshadri, M. Hervieu, C. Martin, A. Maignan, B. Domenges, B. Raveau, and A. N. Fitch, Chem. Mater. 9, 1778 (1997).
- Moreno et al. (2000) N. O. Moreno, P. G. Pagliuso, C. Rettori, J. S. Gardner, J. L. Sarrao, J. D. Thompson, D. L. Huber, A. Garcia-Flores, and S. B. Oseroff, Physica B 292, 1 (2000).
- Yamauchi et al. (2018) I. Yamauchi, M. Hiraishi, H. Okabe, S. Takeshita, A. Koda, K. M. Kojima, R. Kadono, and H. Tanaka, Phys. Rev. B 97, 134410 (2018).
- Tsurkan et al. (2001) V. Tsurkan, J. Hemberger, M. Klemm, S. Klimm, A. Loidl, S. Horn, and R. Tidecks, J. Appl. Phys. 90, 4639 (2001).
VI Supporting Information
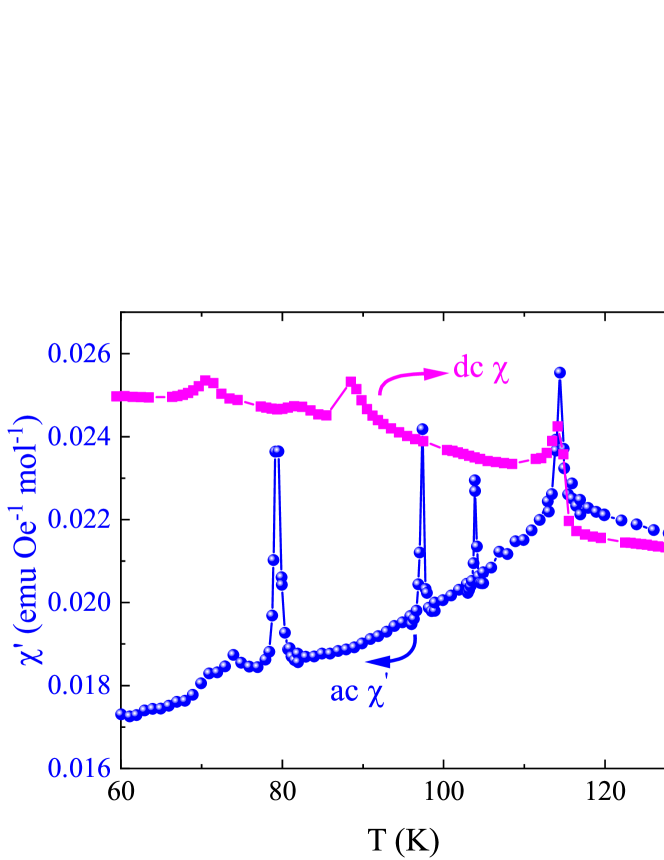
Figure S1 shows additional magnetic susceptibility measurements exactly on the same sample using the AC and DC mode of the ACMS option in the PPMS. The dc susceptibility was measured in the zero-field-cooled mode, and a magnetic field of 0.1 T was applied during the measurement. The ac susceptibility was measured at 3782 Hz with the driving field of 5 Oe. These results are similar to the ones shown in the main text, with sharp peaks, e.g. at 79 and 97 and 104 K, only appearing in the ac susceptibility. Some missing points in the dc susceptibility is due to touchdown operation during the measurements. The magnetic symmetry has been analyzed by the irreducible representation (IR) theory using the BasIrep program within the FullProf program suite. The basis vectors for each IR are listed in Tab. S1, together with the factor obtained by the Rietveld refinement.
| IRs | (%) | site1 | site2 | site3 | site4 | |
|---|---|---|---|---|---|---|
| 5.70 | (0 0 1) | (0 0 -1) | (0 0 1) | (0 0 -1) | ||
| 60.9 | (0 0 1) | (0 0 -1) | (0 0 -1) | (0 0 1) | ||
| 69.3 | (0 0 1) | (0 0 1) | (0 0 1) | (0 0 1) | ||
| 88.3 | (0 0 1) | (0 0 1) | (0 0 -1) | (0 0 -1) | ||
| 72.1 | (1 0 0) | (-1 0 0) | (1 0 0) | (-1 0 0) | ||
| (0 1 0) | (0 1 0) | (0 1 0) | (0 1 0) | |||
| 63.2 | (1 0 0) | (-1 0 0) | (-1 0 0) | (1 0 0) | ||
| (0 1 0) | (0 1 0) | (0 -1 0) | (0 -1 0) | |||
| 69.8 | (1 0 0) | (1 0 0) | (1 0 0) | (1 0 0) | ||
| (0 1 0) | (0 -1 0) | (0 1 0) | (0 -1 0) | |||
| 56.5 | (1 0 0) | (1 0 0) | (-1 0 0) | (-1 0 0) | ||
| (0 1 0) | (0 -1 0) | (0 -1 0) | (0 1 0) |