COVYT: Introducing the Coronavirus YouTube and TikTok speech dataset featuring the same speakers with and without infection
Abstract
More than two years after its outbreak, the COVID-19 pandemic continues to plague medical systems around the world, putting a strain on scarce resources, and claiming human lives. From the very beginning, various AI-based COVID-19 detection and monitoring tools have been pursued in an attempt to stem the tide of infections through timely diagnosis. In particular, computer audition has been suggested as a non-invasive, cost-efficient, and eco-friendly alternative for detecting COVID-19 infections through vocal sounds. However, like all AI methods, also computer audition is heavily dependent on the quantity and quality of available data, and large-scale COVID-19 sound datasets are difficult to acquire – amongst other reasons – due to the sensitive nature of such data. To that end, we introduce the COVYT dataset – a novel COVID-19 dataset collected from public sources containing more than 8 hours of speech from 65 speakers. As compared to other existing COVID-19 sound datasets, the unique feature of the COVYT dataset is that it comprises both COVID-19 positive and negative samples from all 65 speakers. We analyse the acoustic manifestation of COVID-19 on the basis of these perfectly speaker characteristic balanced ‘in-the-wild’ data using interpretable audio descriptors, and investigate several classification scenarios that shed light into proper partitioning strategies for a fair speech-based COVID-19 detection.
Keywords COVID-19 speech dataset speech pathology computer audition disease detection machine learning
1 Introduction
In March, 2020, the world health organisation (WHO) has categorised the novel coronavirus disease (COVID-19) as a pandemic, i. e., a disease characterised by worldwide spread. Following this characterisation, and the immense accompanying strain on healthcare systems, several countries have taken a series of protective measures, including testing, mask mandates, movement restrictions, and vaccination campaigns – all in an attempt to stem the devastating effects of the virus. Today, more than two years after the outbreak of COVID-19, the world is still dealing with its repercussions. As of 1 May 2022, the WHO has documented more than 510 million cases. A substantial number of cases was only recorded in the first quarter of 2022 due to the recent surge of the Omicron variant of COVID-19.
Widespread testing is a cornerstone of the response against COVID-19. It informs public health agencies about the extent of virus spread in the community, enables the detection of new, potentially dangerous, variants, and helps citizens protect themselves and those around them by seeking timely medical assistance and self-isolating. Currently, reverse transcription polymerase chain reaction (RT-PCR) and rapid antigen tests dominate the testing strategies used to identify COVID-19 positive cases.
Recently, a plethora of artificial intelligence (AI) tools have been proposed for the automatic detection of COVID-19 111The term ‘detection’ is typically used as an indication of presence of a specific event (i. e., sound event detection). In our work, we are performing a classification of samples into ‘negative’ and ‘positive’. Nevertheless, we use the two terms interchangeably, as detection is widely used in medical testing.; the main justification in their favour are their significantly lower costs, their eco-friendly nature, and their potential to be deployed at a vastly larger scale. Suggested tools analyse different types of bio-signals to make their prediction, ranging from CT-scans [1, 2, 3], to heart rate signals [4], to vocal [5, 6, 7, 8, 9] and breathing [10] sounds. So far, none of them has received medical certification and is, thus, not part of any official testing strategy mainly due to a lower accuracy as compared to standard test approaches. However, as those tools become increasingly more sophisticated, and the virus seems to gradually transition to an endemic stage requiring less stringent monitoring, they can nicely complement the arsenal of COVID-19 detection mechanisms at the disposal of authorities and individuals alike.
The automatic analysis of CT-scans by means of computer vision techniques has shown much promise in detecting COVID-19 infection, with accuracies reaching over 90 % in some studies [11]; yet the major downside is that this approach requires the use of sophisticated medical equipment (computer tomographs) and the (suspected) patient to visit a medical facility – both aspects hamper a large-scale applicability. In contrast, heart rate and/or vocal signals can be easily obtained using everyday sensors, such as wristbands and/or smartphones, and thereby, provide a useful basis for an AI-based COVID-19 detection in a large group of people without a need for them to leave their homes.
In the present work, we focus on vocal sounds, in particular speech, as the bio-signal of choice for detecting and investigating the manifestation of COVID-19. COVID-19 as a respiratory disease suggests that acoustic information can assist in its detection: coughing, shortness of breath, and sore throat are amongst the most common reported symptoms. Patients with mild-to-moderate symptoms frequently report dysphonia. Accordingly, sound researchers have investigated the effectiveness of acoustic information to differentiate between patients with COVID-19 and controls. A substantial amount of that work has concentrated on non-verbal sounds, such as coughing or breathing [6, 12]. In contrast, [13] investigated sustained vowels. Both non-verbal sound data and sustained vowels are usually obtained through standardised procedures in controlled settings. Thereby, exactly the same type of vocal sound can be compared across patients and controls with less expectable effects of language and culture as compared to speech. However, a recorded sequence of speech covers a broader range of language-inherent sounds and sound transitions and might, thus, contain more potentially relevant acoustic information for distinguishing between individuals with and without a COVID-19 infection. Moreover, providing a speech sample usually represents a more natural setting for people than following the instruction to cough, breath, or produce a sustained vowel.
AI-based digital health tools are often criticised for making unrealistic assumptions that limit their applicability in real-world applications. Recently, [12] provided an overview of seven specific criticisms on audio-based COVID-19 detection – denominated as seven ‘grains of salt’:
-
1.
Just investigating COVID-19 vs healthy condition (neglecting other diseases),
-
2.
Presence of (confounding) background noise,
-
3.
Subject knowledge of infection status which potentially impacts vocal expression (e. g., through emotion),
-
4.
Questionable validity of (self-reported) COVID-19 status,
-
5.
Lack of sound data and code availability,
-
6.
Ignorance of demographic characteristics,
-
7.
Lack of speaker-disjoint experiments.
In the present work, we introduce the Coronavirus YouTube and TikTok (COVYT) speech dataset, which attempts to mitigate several of those issues. Using an easily scalable collection and pre-processing protocol allowing to make data from social media channels scientifically exploitable, we provide a unique multilingual dataset for investigating COVID-19 detection from free speech that features COVID-19 positive and negative speech samples from exactly the same speakers. Thereby, we guarantee for minimal bias potentially introduced by imbalances in intrinsic speaker characteristics, such as gender, age, and language. In addition, the presence of both positive and negative samples from the same speakers allows us to explore personalisation approaches which disentangle the effects of infection from individual voice characteristics that can confound analysis [9]. We present dataset baselines with respect to (i) the manifestation of a COVID-19 infection in different acoustic descriptors and (ii) automatic COVID-19 detection in various scenarios addressing several factors that influence model performance. The COVYT dataset as well as the code for our machine learning experiments are publicly available to facilitate reproducibility and to motivate further research comparable to the provided baselines222## Links will be added upon manuscript acceptance..
The remainder of this work is organised as follows. In Section 2, we introduce our COVYT speech dataset and present related data collection and pre-processing protocols, statistics, and partitioning. In Section 3, we compare the COVYT speech dataset to other relevant currently existing vocal sound datasets for COVID-19 detection. Section 4 then reveals our dataset baselines, while Section 5 positions the COVYT dataset and our findings with respect to previous research and Section 4.2 discusses the strengths and limitations of our work, connecting it to the above mentioned seven ‘grains of salt’. We conclude our work in Section 7.
2 COVYT dataset
2.1 Data collection
As the pandemic is a global phenomenon that has dominated the public’s attention since its very beginning, people – and in particular celebrities – have often ‘announced’ their positive results on social media. Some of those cases, like that of the former US president Donald Trump Jr., receive considerable media attention due to the nature and position of the person affected. It became common for news outlets to run features using footage of well-known people discussing their experiences on having (had) a COVID-19 infection; or even the celebrities spread footage by themselves through their private channels. Respective footage is typically recorded in the days following a positive COVID-19 test, when subjects are required to stay in quarantine. Here, the COVID-19 status labels are self-reported and cannot be officially verified.
The data collection phase for the COVYT speech dataset took place between November 2020 and November 2021. During that time, two popular media platforms are combed for appropriate material, namely YouTube and TikTok. Different data collection protocols for positive cases are utilised for each platform. A targeted search is performed on YouTube, where high-profile cases, e. g., actors, politicians, celebrities, etc. that come to the authors’ attention through the media, are intentionally looked for. In contrast, a global search is performed on TikTok by using keywords like “COVID“ or “symptoms“. In both scenarios, when finding an eligible COVID-19 positive example, we search for uploads of the same speakers preceding the date of infection to serve as negative examples. In case we easily find more than one positive or negative examples of a speaker, all clips are included. Different protocols serve to mitigate potential biases in our data collection process by incorporating diverse recording scenarios, ranging from high-quality, professional interviews to homemade smartphone videos. In all identified clips, the speakers were audio-video recorded or recorded themselves, while talking, e. g., during an interview, a public speech, a narrative, or a ‘story’. As most clips were released by speakers to explicitly inform the community about their infection status, we are able to harness them for acoustic analysis and model training. Recordings during the COVID-19 positive state were taken mostly indoors – at home, a hospital, a TV/ Radio studio, or a press conference room – as subjects had to be under quarantine. To avoid undesired interference, only videos with minimal background noise or quiet music, e. g., as known from news reports and media covers, are accepted for this work. In total, we include videos – positive and negative examples. Of these, just contain a single speaker, whereas the rest contain multiple ones – requiring additional processing to extract the utterances of the target speaker.
2.2 Data preparation
First of all, we download all identified videos in .MP4 format using freely available tools. We then manually annotate the acoustic environment of each video according to recording location – ‘indoor’ vs ‘outdoor’ – and recording setting. For recording setting, we distinguish between: 1. speeches (or press-releases), which are longer recordings, where the target speaker releases a statement in front of staged, professional-grade cameras; 2. interviews, where the target speaker is part of a (present or online) conversation; and 3. self-recordings, where the target speaker uses his or her own smartphone to make a short video (usually a social-media-style ‘story’). Following this annotation, we extract the audio streams and store them as .WAV files in format 16 kHz, 16 bit, single-channel, PCM. The clips range in duration from s to h m – some clips contain long monologues of the target speaker. Therefore, we segment all clips into single utterances for further processing. We choose a semi-automatic segmentation approach conservative in the amount of utterances it keeps. We employ an recurrent neural network (RNN)-based voice activity detection (VAD) model [14] as the initial stage, followed by a manual verification stage using ELAN333https://archive.mpi.nl/tla/elan [15]. Utterances that do not exclusively contain speech of the target speaker or samples that contain music, or background noise are excluded.
2.3 Facts and figures
An overview of dataset statistics is given in Table 1. The COVYT dataset contains utterances with a total duration of h m of speech from speakers – females and males – at ages ranging from to years at time of infection (mean years years standard deviation). Each speaker has a median number of utterances – COVID-19 positive and COVID-19 negative examples. Henceforth, the respective point in time at which the speakers had a COVID-19 infection is referred to as T+; the point in time at which they did not have a COVID-19 infection is referred to as T–. Speakers are celebrities of various domains: actors, athletes, journalists, models, musicians, politicians, presenters, reporters, singers, and writers. Moreover, the dataset covers different languages, namely Chinese (CN), English (EN), French (FR), German (DE), Greek (GR), Polish (PL), Portuguese (PT), Slovakian (SK), and Spanish (ES), with a majority of English speakers () followed by Greek speakers (). The number of speakers and utterances is given in detail in Table 1. With regard to location and setting, most clips were recorded indoors rather than outdoors (T–: 92 vs 4; T+: 83 vs 6); most clips were recorded in an interview setting (T–: 55; T+: 27), followed by a speech/press-release setting (T–: 29; T+: 6), and, lastly, by a self-recording setting (T–: 12; T+: 56). Naturally, the chance to give a speech or an interview decreases following a COVID-19 diagnosis, as speakers have to self-quarantine or are hospitalised for a certain time. Interviews at T+ took place through online teleconferencing, and speeches were made in front of staged cameras (presumably without the presence of reporters or assistants due to quarantine restrictions).
| T+ | T– | ||||
| Language | # Speakers | # Utterances | Duration (hh:mm:ss) | # Utterances | Duration (hh:mm:ss) |
| Chinese | 2 (0 / 2) | 112 (0 / 112) | 00:03:43 (00:00:00 / 00:03:43) | 28 (0 / 28) | 00:00:53 (00:00:00 / 00:00:53) |
| English | 40 (28 / 12) | 2 454 (1 988 / 466) | 01:59:45 (01:36:00 / 00:23:45) | 4 686 (4 068 / 618) | 03:45:54 (03:12:52 / 00:33:03) |
| French | 2 (2 / 0) | 84 (84 / 0) | 00:04:10 (00:04:10 / 00:00:00) | 96 (96 / 0) | 00:03:04 (00:03:04 / 00:00:00) |
| German | 2 (1 / 1) | 27 (16 / 11) | 00:01:26 (00:00:48 / 00:00:38) | 85 (65 / 20) | 00:04:28 (00:02:59 / 00:01:29) |
| Greek | 14 (5 / 9) | 544 (187 / 357) | 00:29:28 (00:08:33 / 00:20:55) | 869 (179 / 690) | 00:43:27 (00:08:46 / 00:34:41) |
| Polish∗ | 1 (1 / 0) | 23 (23 / 0) | 00:02:01 (00:02:01 / 00:00:00) | 254 (254 / 0) | 00:11:59 (00:11:59 / 00:00:00) |
| Portuguese | 1 (1 / 0) | 21 (21 / 0) | 00:00:50 (00:00:50 / 00:00:00) | 118 (118 / 0) | 00:05:33 (00:05:33 / 00:00:00) |
| Slovakian | 1 ( 1 / 0) | 54 (54 / 0) | 00:02:54 (00:02:54 / 00:00:00) | 273 (273 / 0) | 00:12:41 (00:12:41 / 00:00:00) |
| Spanish | 2 (1 / 1) | 35 (18 / 17) | 00:01:02 (00:00:29 / 00:00:33) | 650 (632 / 18) | 00:23:35 (00:22:32 / 00:01:03) |
| Total | 65 (40 / 25) | 3 354 (2 391 / 963) | 02:45:18 (01:55:45 / 00:49:33) | 7 059 (5 685 / 1374) | 05:31:35 (04:20:26 / 01:11:09) |
-
A portion of the negative utterances of this speaker is actually in English; however, we consider this to have a negligible effect on our analysis.
2.4 Partitioning
Proper partitioning is a crucial aspect of any dataset if used for machine learning (ML) purposes, as the data must be split in a way that allows for building well-performing models, but also enables a fair evaluation. Taking into account the relatively small size of the COVYT dataset, with a total of 10 413 samples, we opt for a cross-validation scheme, for which we provide training/development/testing folds. Given that we also aim to investigate different scenarios of COVID-19 detection, we introduce four different partitioning strategies, each targeted to a different aspect of interest.
-
1.
Speaker-disjoint partitioning: As discussed in [12], a major limitation of several existing COVID-19 datasets is their lack of subject-disjoint evaluation. If data from the same speaker is involved in both training and testing, performance will be most probably higher because the model might re-identify the speaker identity instead of performing the actual target task. Individual voice characteristics often negatively impact generalisation; having the same speaker in the training and testing partitions results in obtaining over-optimistic performance scores. This particular partitioning scheme is implemented by randomly splitting the speakers into disjoint groups (), and subsequently taking all possible permutations of this set, resulting in folds (the permutations are obtained by training on , validating on , testing on , then training on , validating on , testing on – so each fold is train/validated/tested on twice).
-
2.
Speaker-inclusive partitioning: This partitioning is intentionally introduced to quantify the effect of having negative and positive data of the same speakers in training and testing. The data of all files from each speaker is randomly split into three partitions; then, the partitions are permuted to obtain folds in similar fashion as before.
-
3.
File-disjoint partitioning: With this partitioning strategy, we want to investigate whether a speaker-inclusive, but file-disjoint partitioning would also yield a disproportionately good performance. In particular, we ensure that the same speaker is present in the test and either the training or development partitions, but the same file is not. This enables us to quantify whether it is indeed the individual speaker characteristics that cause models to overperform in the speaker-inclusive scenario, or whether it is simply the side-effect of having an identical recording (which contains data from the same acoustic conditions). Given that for most speakers the COVYT dataset contains only one original clip per state (COVID-19 negative or COVID-19 positive), we randomly split speakers into two groups, and . We then create two test sets, and , with containing all instances of and all instances of , and in contrast with all instances from and all instances of . This ensures that each test set contains files from all speakers but in only one of the two conditions (COVID-19 negative or COVID-19 positive), thus, ensuring that files are disjoint (as each recording contains the speaker in only one condition). For each fold, we additionally create variants where the training set is randomly split into training/development sets (this time in speaker-disjoint fashion, as most speakers have only one clip per condition), resulting in a total of folds when taking all permutations.
-
4.
Language-disjoint partitioning: For this final scheme, we split the data by taking language information into account. As most of our data is either English or Greek, we bundle all other languages in a separate ‘other’ group, thus resulting in folds. Once again, we utilise all permutations to create folds.
We note that the information regarding partitioning is included in the metadata released together with the dataset, thus ensuring reproducibility of our results and a fair comparison of different scenarios. However, not all partitioning schemes are relevant for potential real-world applications. We encourage authors to primarily use our speaker-disjoint partitioning for future work. Moreover, it is often the case that practitioners try to avoid the computational overhead of cross-validation (in particular for resource intensive deep learning (DL) architectures that are currently state of the art in the field). While we encourage the proper use of all folds to get a more robust estimation of performance and generalisation, we acknowledge the practical considerations and recommend authors that want to avoid the overhead to use the 1st fold of the speaker-disjoint scheme (). To facilitate comparisons with future studies, we will also include those results in our manuscript, even though we primarily focus on our full cross-validation experiments.
3 COVYT vs other datasets
| Dataset | # Speakers in total () | Sound type | # Languages | Data availability | COVID-19 labels | from same speaker |
| COVIDTelephone[16] | 19 (10) | free speech | N/A | ✓ | level-1 | ✗ |
| AI4COVID[17] | 543 (70) | coughing | N/A | ✗ | unknown∗ | ✗ |
| Coswara [18, 19] | 941 (104) | breathing coughing vowels digit counting | multiple∗∗ | ✓ | level-1 | ✗ |
| COUGHVID [20] | 14787 (410 | coughing | N/A | ✓ | level-1 | ✗ |
| YourVoiceCounts [13] | 22 (11) | coughing vowels read speech | 1 | ✗ | level-2 | ✗ |
| CoughAgaistCovid [21] | 3621 (2001) | coughing | N/A | ✗ | level-2 | ✗ |
| COVID19 [22] | 78 (29) | coughing vowel / voiced consonant counting digits | 1∗∗∗ | ✗ | level-2 | ✗ |
| YourVoiceCounts audEERING [5] | 39 (19) | coughing vowels read speech | 1 | ✗ | level-1/2 | ✗ |
| DiCOVA [19] | 366 (-) | coughing read speech | 8 | \faLock | level-2 | ✓ |
| Cambridge Longitudinal [9] | 212 (106) | breathing coughing read speech | 8 | \faLock | level-1 | ✓ |
| COVID-19 Sounds [23] | 36116 (2496) | breathing coughing read speech | 8 | \faLock | level-1 | ✓ |
| COVYT | 65 (65) | free speech | 9 | ✓ | level-1 | ✓ |
-
# = number of; = COVID-19 positive; = COVID-19 positive and COVID-19 negative (samples)
-
level-1 self-assessment / no test required; level-2 Medically certified COVID-19 test result required
-
Not specified; however, most likely level-2 as the study was conducted in medical facilities
-
Speakers came mainly from India, which has 2 official and 22 recognised regional languages.
-
Not mentioned; presumably Hebrew as the study was conducted in Israel
Table 2 provides a representative overview of currently existing COVID-19 sound datasets and specifies aspects that the COVYT dataset is meant to set value on. In particular, we focus on the type of audio content that each dataset contains. The COVYT dataset contains free (multilingual) speech; this is in contrast to most other listed datasets that primarily focus on breathing and coughing sounds, on sustained vowels, or on read standard texts. Besides some advantages of free speech (please also see Section 1; coverage of several language-inherent sounds, natural recording setting), our motivation to use this type of sound data is a pragmatic one: Free speech is most easily available on our data sources. The amount of different languages contained in a dataset and their distribution are mostly relevant for those including linguistic sound types, such as speech or sustained vowels; however, it also serves as a proxy for demographic diversity which is an important consideration for making datasets fair and audio-based COVID-19 detection applicable across different countries. This is why we make the COVYT dataset as diverse as possible and provide different partitioning strategies including a language-disjoint one. Data availability is in turn crucial for ensuring study reproducibility and transparency of research findings, and also to foster new advances from researchers without access to own datasets. Here, the COVYT dataset enjoys an advantage over other datasets, as it is sourced entirely from the public domain.
This leads to the issue of label reliability. Relying on self-reported labels and crowdsourced data holds lots of potential for scaling the size of a dataset. However, it comes with the danger of erroneous labels. In contrast, manually collected datasets with strict medical protocols, where the label is verified through proper medical examination and further audited by a medical practitioner is the gold standard for digital health applications, but is harder to scale due to the amount of resources it requires. Our approach lies somewhere in between. While technically, we still rely on self-reported labels, we make use of the scrutiny that celebrities come under from the press, which renders a fake COVID-19 report rather unlikely (though not impossible). To roughly distinguish between different quality types of labelling protocols, we adopt a -level system, which ranks datasets according to whether they solely rely on self-reported labels (level-1), or whether a medically certified test result was required (level-2). The COVYT dataset falls under the level-1 category.
Finally, we include another indicator in our comparison, namely whether a dataset contains samples of the same speaker with and without infection. We consider this as an important aspect towards minimising potential biases caused by imbalances in specific speaker characteristics, such as gender, age, or any other intrinsic anatomical/voice-physiological properties. Investigating exactly the same voice with vs without infection across many speakers, respectively, increases the chance to effectively identify disease-related phenomena. Moreover, recent findings from the Cambridge Longitudinal dataset [9] suggest that there are individual effects in the manifestation of COVID-19 in the voice (in their case, non-linguistic vocalisations). To the best of our knowledge, the COVYT dataset is the only dataset alongside Cambridge Longitudinal and COVID-19 Sounds (both variants of the same data) to fulfill the criterion of having COVID-19 positive and negative samples from the same speakers, and, in particular, the only one to fulfill this criterion and to contain free speech samples, which enables the use of personalised ML algorithms, which have been shown to improve performance in other speech-based tasks [24]. However, it has to be considered, that the recording setting (recording equipment, location, situation, speaker mood, etc.) might differ between the respective positive and negative sample of one and the same speaker, which potentially introduces systematic acoustic bias.
4 Baseline evaluations
In the following, we provide standard solutions for answering two main research questions (RQs) on the basis of COVYT data: (4.2) Which speech parameters differ most between speakers at T– vs T+? (4.3) Can T– and T+ be automatically differentiated from speech? To this end, we derive different audio representations from the available utterances. The generated results shall serve as a benchmark for future analyses carried out on the basis of the COVYT dataset.
4.1 Audio representations
Speech processing applications typically rely on hand-crafted sets of less than 100 until several 1000 features, which attempt to holistically describe an input utterance [25, 26]; though, certain features allow for signal interpretation from a voice-physiological perspective. In recent years, however, learnt representations have shown superior performance and robustness in several tasks [27, 28], driving their adaptation from the community. In the present study, we carry out experiments using three different audio representations:
We begin with the extended Geneva minimalistic acoustic parameter set (eGeMAPS) [25] – a rather small set of acoustic parameters that has previously been shown to contain relevant information for the manifestation of COVID-19 in sustained vowels [13]. In contrast, the Interspeech Computational Paralinguistics ChallengE (ComParE) set is a large-scale feature set of 6 373 acoustic parameters. As the official baseline feature set of the ComParE series from 2013 until 2021 [26, 29], it has been successfully used for several computer audition tasks over the last decade. Both the eGeMAPS and the ComParE set are extracted using the open-source toolkit openSMILE [30].
Finally, we use learnt representations from w2v2-large-xlsr [28], a multilingual variant of wav2vec2.0 [27]. This model was pre-trained in self-supervised fashion on a large corpus containing languages. We thus expect this network to generalise better to our multilingual data than the vanilla wav2vec2.0. The architecture consists of convolutional neural network (CNN) feature extraction layers followed by transformer (self-attention) layers. Here, we use the intermediate features which are extracted by the CNN layers. These roughly correspond to ms of audio with a stride of ms, which we subsequently average over time to obtain the final embeddings. We also experiment with the contextualised representations, which are extracted after the self-attention layers. However, we get consistently worse performance. As our intention here was to obtain competitive baselines, we do not fine-tun w2v2-large-xlsr on COVYT, even though this is not to lead to substantially better performance [31].
4.2 Acoustic analysis (RQ 1)
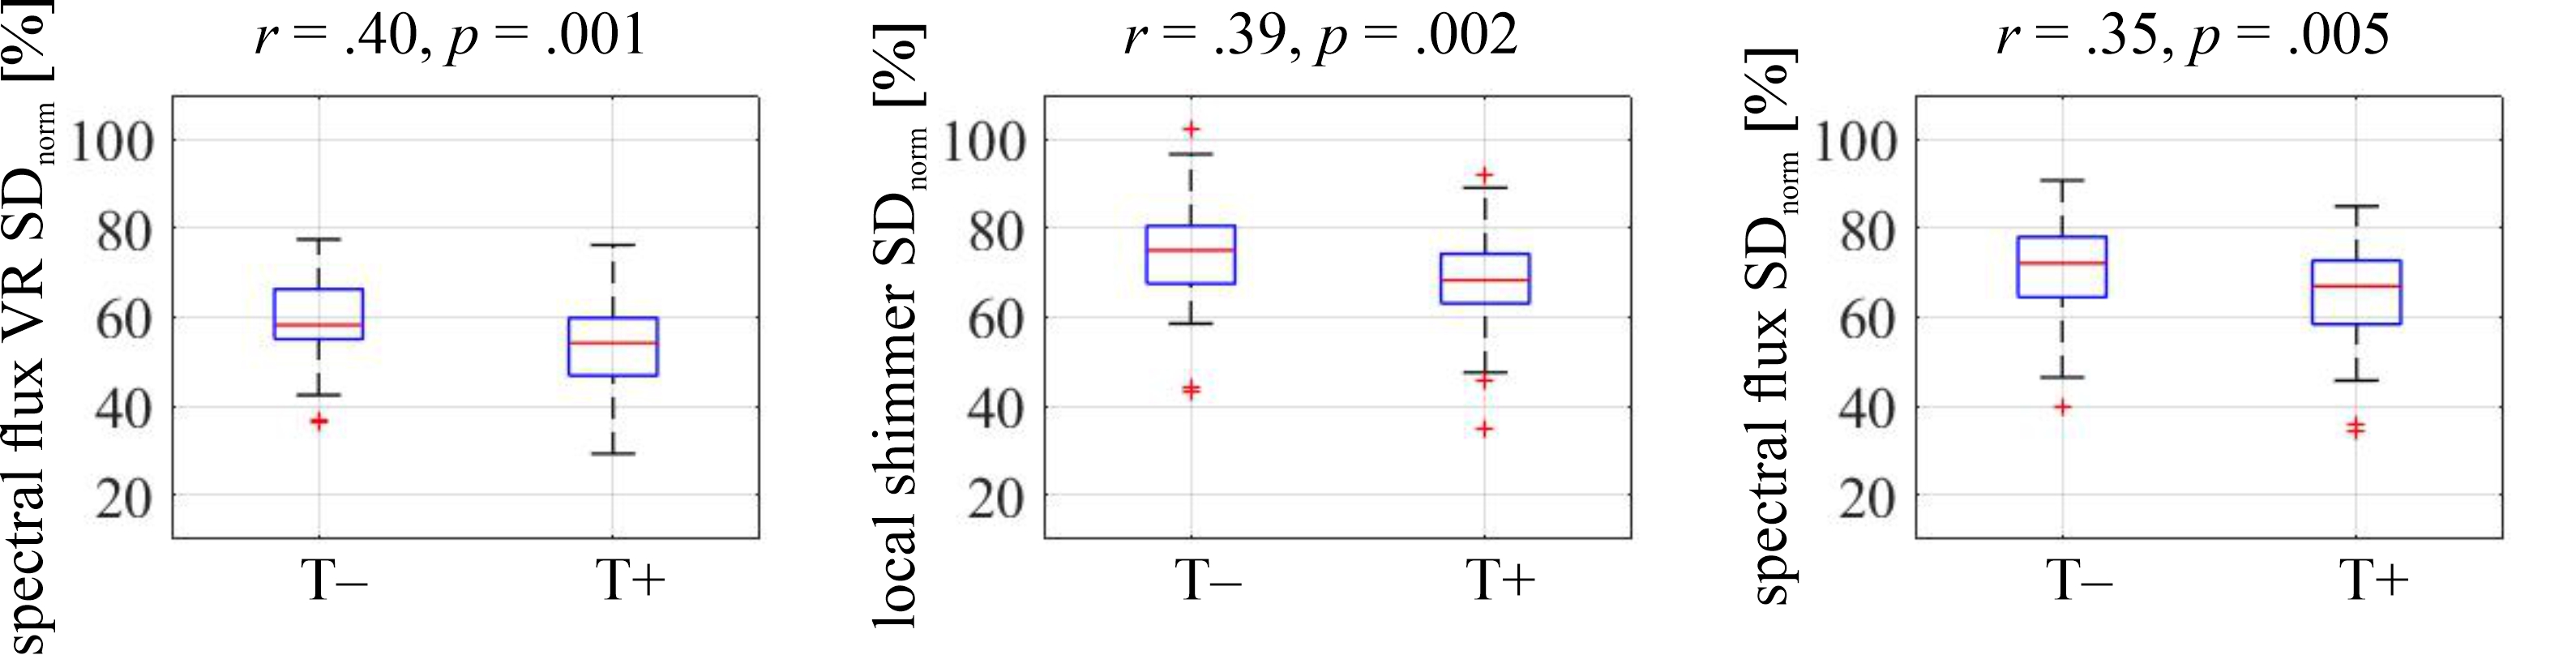
The analysis of acoustic differences between speakers at T+ vs T– is done on the basis of the extracted eGeMAPS representation, as eGeMAPS features generally offer interpretability from a clinical/voice-physiological perspective. To ensure equal speaker and COVID-19 status weighting, we average feature values across all utterances of a single speaker at T+ and T–, respectively. Thus, for each of the 88 eGeMAPS features, we produce exactly one value per speaker at T+ and one value per speaker at T–. We find that the values of the single feature at T+ and T– are not normally distributed. Thus, we feature-wisely apply the Mann-Whitney U test and derive the effect size , i. e., the absolute value of the correlation coefficient calculated as the -value divided by the square root of the number of samples [32]. We finally rank the eGeMAPS features according to the effect size and define top features to have an (fair correlation at minimum). In addition, we report two-sided -values.
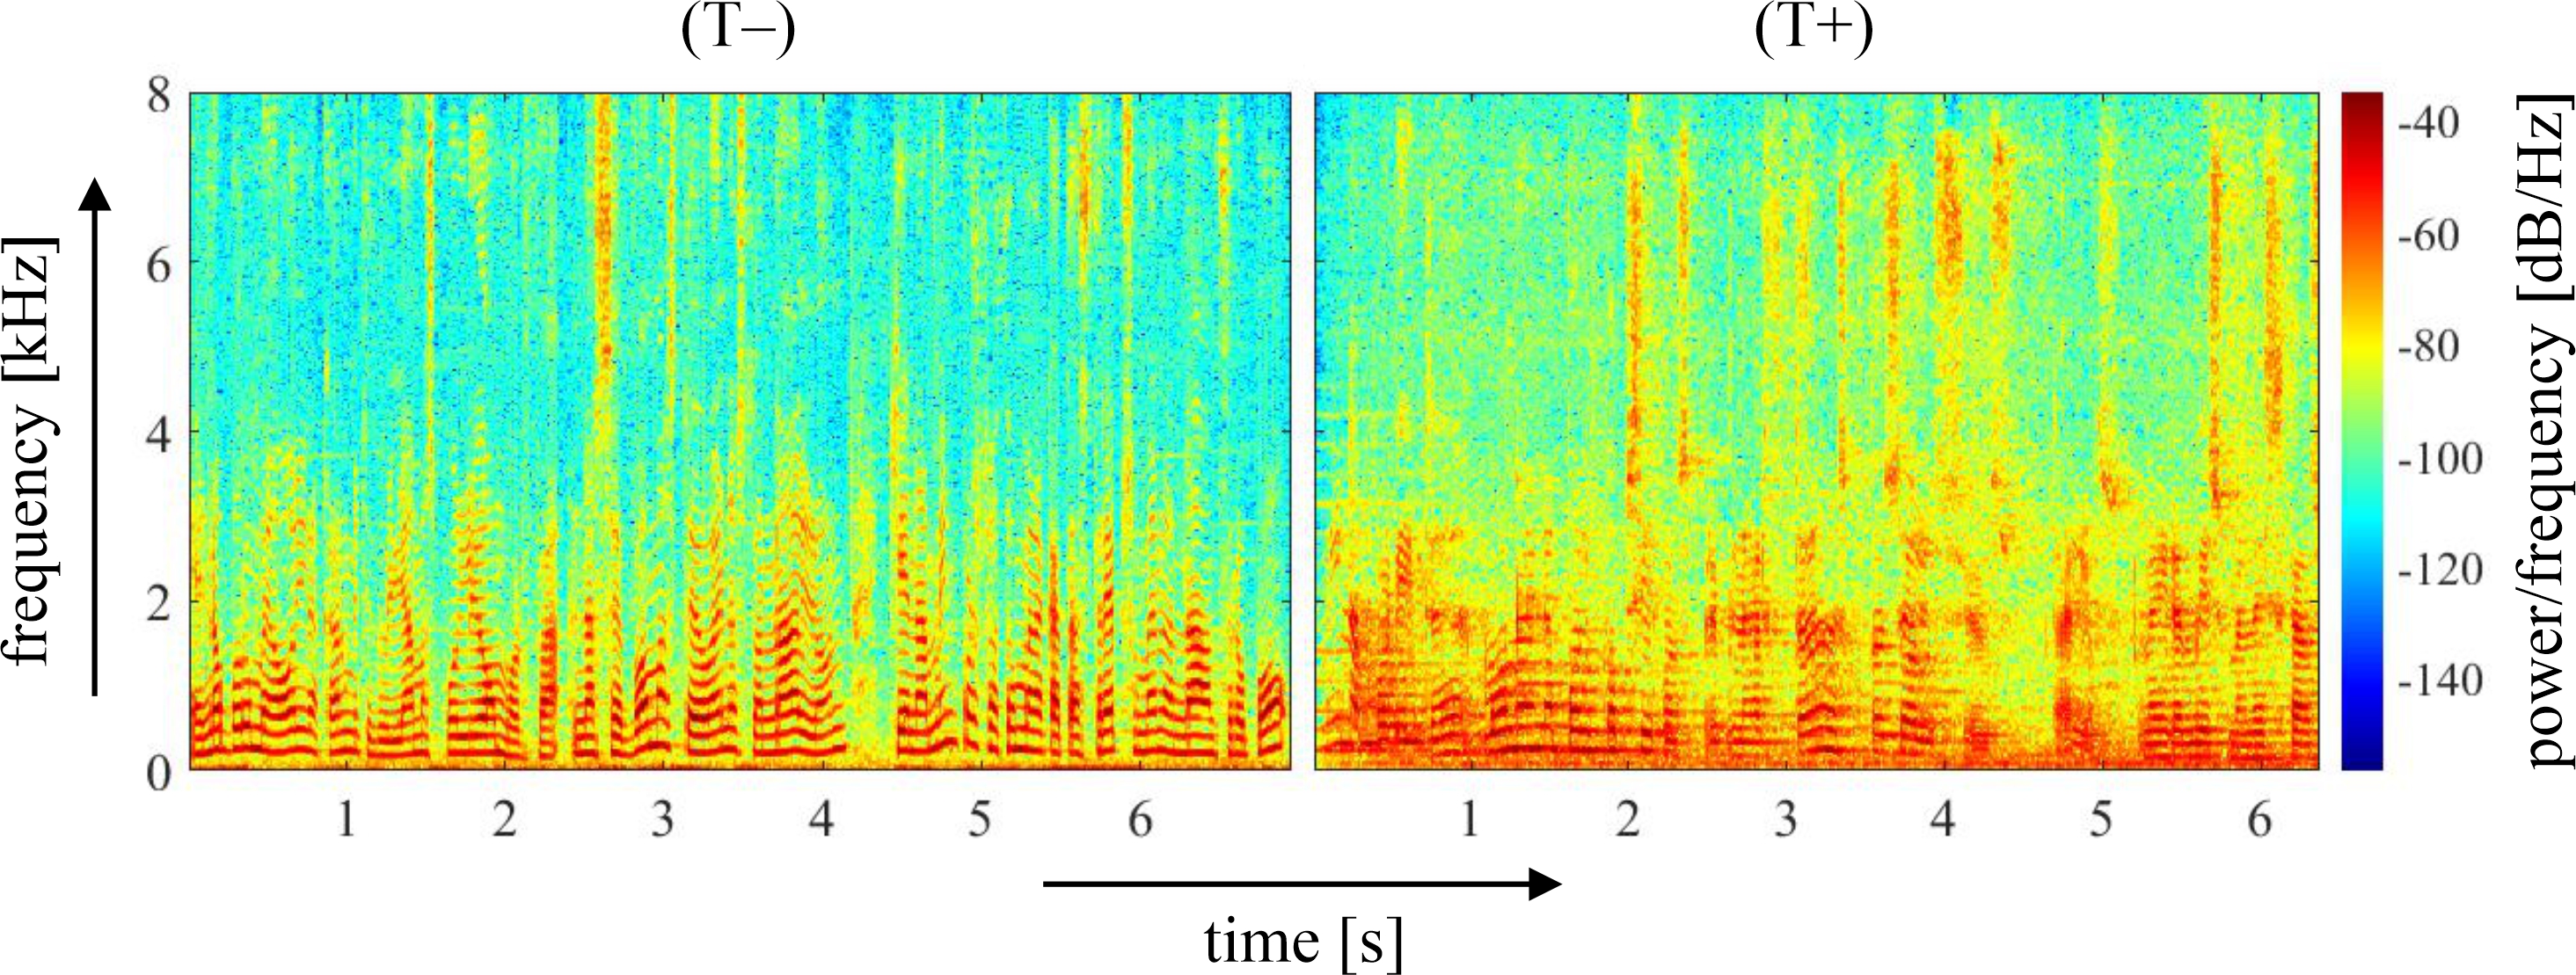
We identify three top features, namely (I) the coefficient of variation of the spectral flux, i. e., spectral change between consecutive time frames [25], in voiced regions, (II) the coefficient of variation of local shimmer, i. e., change in amplitude between consecutive fundamental frequency periods [25], and (III) the coefficient of variation of the spectral flux in the entire speech segment. Figure 1 reveals the respective boxplots for T– vs T+ alongside the effect sizes and -values. In all three top features, T+ is characterised by a lower coefficient of variation as compared to T–. This means that there is restricted variation with regard to spectral and amplitude change within an utterance in COVID-19-related speech. Figure 2 exemplarily shows the spectrograms of an utterance produced at T– and an utterance produced at T+. Both utterances originate from the same speaker, namely the speaker with the highest average top feature (coefficient of variation of spectral flux in voiced regions) difference between T+ and T–. Obviously, the utterance produced at T+ exhibits more inharmonic overtones in voiced sounds as compared to the utterance produced at T–, which is associated with more vocal coarseness as typical for a respiratory disease. Moreover, the presented spectrogram related to T+ indeed suggests less variation of spectral change over time in voiced regions. However, this finding has to be interpreted with caution, as not only mechanisms of voice production but also room acoustics affect the recorded audio signal and, thereby, a wide range of derived acoustic features. An auditory inspection of the utterances presented in Figure 2 yields that the utterance produced at T+ was obviously recorded in a room with a longer reverberation time as compared to the utterance recorded at T– (please also see limitations discussed in Section 6).
4.3 Automatic COVID-19 detection (RQ 2)
In this subsection, we present our automatic COVID-19 classification performance results on all four partitioning strategies described in Section 2.4. In all cases, we perform z-score normalisation on each feature separately, computing the statistics on the training set of each fold in our cross-validation setup separately, and consequently applying them on the development and test partitions. As a typical baseline classifier, we utilise support vector machines (SVMs), where we optimise the complexity parameter in [, , , , , , , , ] as well as the kernel function across the types linear, polynomial, and radial basis function (RBF). Optimisation is always done on the development partition of each fold. We additionally utilise two distinct evaluation protocols, each highlighting a different aspect of the underlying problem. The first is adhering to standard ML practice. As discussed in Section 2.2, the downloaded clips are segmented into utterances, which we use as training/validation/testing instances in the context of a ML pipeline. These instances inherit the label (presence or absence of a COVID-19 infection) from the file they originate from. In each fold, the model is trained on the training instances and evaluated on the test instances, resulting in one prediction value per instance. These predictions are then evaluated against the ground truth labels over the entire test set to provide a general, instance-level performance score. This procedure is repeated for each fold in each partitioning scheme. The second protocol is motivated by the clinical evaluation setting for which our application is intended. Under this perspective, the different utterances resulting from the segmentation process can be seen as repeated measurements of the same underlying variable, namely the manifestation of COVID-19 in the speaker’s voice. In this setting, instance-level decisions are aggregated to provide a final, holistic evaluation, which takes all utterances into account and provides a single label for each file in the test partition. As our present focus is on providing a set of competitive baselines, we adopt the simplest possible aggregation process, namely max voting, where the label corresponding to each file is defined as the most often-predicted label across all its utterances. As our metric of choice we use the unweighted average recall (UAR), which accounts for a certain label imbalance in some folds.
We present UAR results for all partitioning scheme and audio representation combinations in Table 3. At first glance, wav2vec2.0results in the highest performance across all schemes, followed by ComParE, while eGeMAPS is lagging further behind. This demonstrates the power of learnt representations for COVID-19 detection in free speech samples.
The different partitioning schemes allow us to find the answers of two important questions:
-
1.
How important is the use of speaker-disjoint sets? The vastly superior performance of all audio representations on speaker-inclusive experiments, where wav2vec2.0 reaches an average UAR of 98 % on the instance- and 96 % on the file-level, compared to the alternative partitioning strategies, where wav2vec2.0reaches a maximum average UAR of 71 % and 74 % on instance- and file-level evaluations, respectively, shows that this partitioning can result in a large overestimation of real-world performance and should, therefore, be avoided. However, the drop of performance observed when switching to file-, but not speaker-disjoint evaluations also indicates that it is not necessarily the presence of the same speaker in training and testing partitions per se that causes this overestimation, but potentially (also) the splitting of the same recording (whose utterances form repeated measurements of the same speaker in the same acoustic environment). Actually, the difference between our speaker-disjoint and file-disjoint partitioning schemes is negligible, showing that the speaker effect is small when taking care to avoid other confounders (e. g., recording conditions, background noise, etc.). Still, to be on the safe side, future work on the COVYT dataset and comparable datasets (where applicable) should avoid the use of speaker-inclusive partitions in order to obtain accurate generalisation estimates.
-
2.
Is a speech-based detection of COVID-19 universally possible, i. e., across languages? The evidence here is inconclusive. Our language-disjoint partitioning turns out to be the most challenging for the audio representations tested here, with performance dropping to 63/66 % even for the best-performing wav2vec2.0, while resulting in random-chance performance for eGeMAPS (49/51 %). This is expected, as several speech-based computer audition tasks struggle with cross-language generalisation. Even so, the fact that the learnt representations of wav2vec2.0, which has been pre-trained on several languages, still shows the highest performance is a promising sign that future ‘multilingual’ foundation models might bridge this gap and form the basis of a universal COVID-19 detection model. Though, until that time, it is highly recommended that models are applied with special care to different languages/cultures, and (if possible) evaluated on a representative test set beforehand.
| Partitioning | Speaker-disjoint | Speaker-inclusive | File-disjoint | Language-disjoint | ||||
| Audio representation | Segment-level UAR [%] | File-level UAR [%] | Segment-level UAR [%] | File-level UAR [%] | Segment-level UAR [%] | File-level UAR [%] | Segment-level UAR [%] | File-level UAR [%] |
| eGeMAPS | 59.0 (5.8) | 58.9 (0.7) | 85.8 (0.6) | 78.2 (0.6) | 58.9 (4.9) | 59.2 (3.5) | 48.8 (2.1) | 51.4 (4.3) |
| ComParE | 69.4 (6.5) | 68.6 (3.1) | 87.1 (1.1) | 78.6 (2.1) | 67.9 (0.2) | 65.9 (2.0) | 57.0 (1.1) | 57.7 (3.1) |
| wav2vec2.0 | 71.2 (10.3) | 74.2 (4.9) | 97.5 (0.6) | 95.7 (1.3) | 71.9 (2.3) | 69.9 (2.8) | 62.7 (8.6) | 66.5 (1.8) |
| Audio representation | Segment-level UAR[%] | File-level UAR[%] |
| eGeMAPS | 51.1 (49.3–52.9) | 59.8 (50.8–69.4) |
| ComParE | 60.4 (58.7–62.0) | 71.0 (60.4–80.9) |
| wav2vec2.0 | 56.6 (54.8–58.3) | 72.7 (61.6–83.5) |
Finally, Table 4 provides UAR and 95 % confidence intervals (CIs) obtained with 1000-sample bootstrapping (with replacement) for the 1st fold of the speaker-disjoint partitioning. As discussed in Section 2.4, these results are only provided for comparison purposes with (future) approaches that are too intensive to run on all folds. Here, the ComParE set gives the best performance for segment-level evaluations while w2v2-large-xlsr does for file-level ones; however, the CIs show a big overlap in both cases indicating that the differences are not relevant. In contrast, the eGeMAPS lags considerably behind in both cases. We note that the CIs for segment-level evaluations have a smaller range than the CIs for file-level evaluations, because the sample sizes differ (there are a lot more segments than files).
5 Discussion
Our findings confirm that COVID-19 detection from free speech samples is basically feasible. Using standard procedures, we are able to obtain detection rates in the range of 70 % UAR for the most realistic testing scenarios – which are comparable to those achieved for other datasets with free speech. For example, [29] report the best result for the COVID-19 speech sub-task of the 2021 ComParE (the baseline) at 72 % UAR, whereas [9] report an AUC of 66 % on CambridgeLongitudinal, which increases to 79 % when utilising the longitudinal nature of the data. This showcases that speech is suitable for the detection of COVID-19. Free speech is easier to obtain than read texts/scripted speech, as it can be unobtrusively collected by means of passive recordings instead of requiring the speaker to actively record data and follow any instructions; we therefore expect this type of data to prove highly relevant for future COVID-19 speech research.
An undesirable side-effect of the ‘wildness’ of our data is that it makes the task harder to solve with interpretable features. This is reflected both in the lower detection performance obtained with eGeMAPS and the fact that our acoustic analysis did not yield that clear trends as seen, e. g., in studies using data acquired in a more controlled setting, such as [13]. Nevertheless, there is some consistency between our present findings and those of [13]: Both studies report shimmer and spectral flux to be relevant for the identification of speakers with COVID-19. The fact that other features, such as variations in the fundamental frequency or the harmonics-to-noise ratio are not found to be relevant in our study might be related to the different sound type used – free speech in the present study vs sustained vowels in [13]. Moreover, it needs to be considered that the COVYT dataset used in the present study includes multiple languages and, thus, a huge range of phonemes and phoneme transitions, making a feature comparison with monolingual studies difficult.
6 Contributions and limitations
The COVYT dataset is the first of its kind COVID-19 speech dataset sourced from public multimedia platforms – a heretofore untapped resource for such data. Moreover, the presence of the same speaker with and without infection makes it a natural candidate for personalisation approaches, which are expected to improve COVID-19 detection performance as previous work found its symptom manifestation to have an individualised component [9]. These two aspects, combined with the open-source nature of the data, make the COVYT dataset a prime basis for further research in voice-based COVID-19 detection, which has a huge potential to massively increase future testing capacities while saving waste at the same time. However, the COVYT dataset inherently comes with a number of limitations, especially as the exploited video clips were not recording with the intention to generate data for later scientific analyses. We thus return to the ‘seven grains of salt’ of [12], and attempt to position the contributions and limitations of our work accordingly.
-
1.
COVID-19 vs other diseases. The COVYT dataset does not fulfill this requirement as it primarily contains healthy or COVID-19 positive samples. Information about potential chronic diseases, such as asthma, are not reliably available. However, this also holds true for most previous works. Minor limitation.
-
2.
Background noise. Due to our strict data collection and preparation protocols, we expect only a limited amount of background noise (if at all) to be present in our processed utterances. Furthermore, by collecting data ‘in-the-wild’ from several sources, we cover a wide gamut of recording conditions relevant for potential future test applications while still ensuring a higher data quality as compared to fully crowd-sourced datasets. On the downside, most COVID-19 positive samples were recorded in isolated environments without other people present, as subjects were under quarantine, whereas COVID-19 negative samples encompass a wider gamut of recording environments; see data statistics in Section 2.3. Thus, we are aware of potential systematic differences in background noise and room acoustics/reverberation as well as recording setting, which models may be able to exploit. Balanced.
-
3.
Subject knowledge of infection status. Subjects were not only aware of their infection status, but in many cases created the recordings ad hoc to convey this status to a wider public. Given that our dataset consists of celebrities who rely on building emotional ties with their audience, it is highly possible that some of them modulated their voice accordingly. Thus, (intended) emotion could be a potential confounder when building COVID-19 detection models on the basis of the COVYT dataset. Nevertheless, (negative) affect is also a potential disease indicator [33]. Furthermore, it is possible that the vocabulary speakers use when infected (T+) and are making a press-release/interview contains explicit mentions to their health status which can act as ‘shortcuts’ for the models to learn instead of the actual task. This is particularly relevant for large, pre-trained models like wav2vec2.0 which are known to rely on linguistic information (when available) [31, 34, 35]. However, this effect is stronger in the deeper transformer layers [34, 35], not the earlier convolution ones whence we extracted our embeddings here – thus we expect this effect to be absent from our study. Major limitation.
-
4.
Validity of labels. Although the labels used here are essentially self-reported, the high level of scrutiny which celebrities are being subject to (especially w. r. t. a positive diagnosis in the early days of the pandemic) strengthens our confidence in label validity. More problematic than the fact of just knowing a speaker’s COVID-19 status in terms of negative vs positive is the missing knowledge about (i) the period between a positive COVID-19 test and the time of recording, (ii) the type of the used COVID-19 test, (iii) the cycle threshold (CT) value at the time of recording in case of a PCR test, (iv) the specific COVID-19 variant, (v) the range and severity of the speaker’s symptoms at the time of recording, (vi) potential diagnoses of other (chronic) diseases, (vii) the speaker’s vaccination status, etc. Minor limitation.
-
5.
Data and code availability. The COVYT dataset as well as the code for all experiments presented in this work are publicly released (see Section 1). Major contribution.
-
6.
Demographic variability. The COVYT dataset does not cover subjects from a wide range of socioeconomic backgrounds; celebrities typically come from the upper echelons. Nevertheless, we provide samples in different languages, produced by speakers from different ethnicities (not all English speakers were natives) and age groups. Minor contribution.
-
7.
Speaker-disjoint experiments. Speaker identity is available for all utterances. Thus, speaker-disjoint partitions can be created. We provide a baseline partitioning scheme to allow standardised evaluation protocols. Furthermore, the COVYT dataset is the only dataset alongside the Cambridge Longitudinal dataset [9], which contains data of the same speakers with and without infection, which enables future research in personalised approaches that account for individual differences in the manifestation of COVID-19 in human voices. Major contribution.
7 Conclusion
We introduced the COVYT speech dataset for the investigation of (i) the acoustic manifestation of a COVID-19 infection as well as (ii) the audio-based automatic detection of COVID-19 in free speech samples. The dataset contains 8+ hours of publicly available audio material and, in contrast to most other datasets in this research field, it features both COVID-19 positive and negative speech samples of all 65 included speakers. In our baseline experiments, we identified three acoustic features – two related to spectral flux and one related to local shimmer – to differ between the COVID-19 positive and negative samples. Moreover, we obtained a UAR near 70 % for the automatic classification of speech samples according to COVID-19 status by using pre-trained speech models.
The COVYT dataset together with the provided benchmarks shall boost further research in the field of speech-based COVID-19 detection while ensuring reproducibility and comparability of results. Furthermore, as the dataset contains samples of the same speakers with and without COVID-19 infection, we expect it to prove a valuable conduit for future efforts in personalisation approaches that can adapt to the characteristics of individual speakers and, thus, improve performance and reliability.
8 Acknowledgements
This work has received funding from the DFG’s Reinhart Koselleck project No. 442218748 (AUDI0NOMOUS) and from the EU’s Horizon 2020 grant agreement No. 826506 (sustAGE).
9 References
References
- [1] Linda Wang, Zhong Qiu Lin and Alexander Wong “COVID-net: A tailored deep convolutional neural network design for detection of COVID-19 cases from chest X-Ray images” In Scientific Reports 10.1 Nature Publishing Group, 2020, pp. 1–12
- [2] Vruddhi Shah, Rinkal Keniya, Akanksha Shridharani, Manav Punjabi, Jainam Shah and Ninad Mehendale “Diagnosis of COVID-19 using CT scan images and deep learning techniques” In Emergency Radiology 28.3 Springer, 2021, pp. 497–505
- [3] Kumar T. Rajamani, Hanna Siebert and Mattias P. Heinrich “Dynamic deformable attention network (DDANet) for COVID-19 lesions semantic segmentation” In Journal of Biomedical Informatics 119, 2021, pp. 103816
- [4] Shuo Liu, Jing Han, Estela Laporta Puyal, Spyridon Kontaxis, Shaoxiong Sun, Patrick Locatelli, Judith Dineley, Florian B Pokorny, Gloria Dalla Costa and Letizia Leocani “Fitbeat: COVID-19 estimation based on wristband heart rate using a contrastive convolutional auto-encoder” In Pattern Recognition 123 Elsevier, 2022, pp. 108403
- [5] Pascal Hecker, Florian B Pokorny, Katrin D Bartl-Pokorny, Uwe Reichel, Zhao Ren, Simone Hantke, Florian Eyben, Dagmar M Schuller, Bert Arnrich and Björn W Schuller “Speaking Corona? Human and machine recognition of COVID-19 from voice” In Proceedings INTERSPEECH, 2021, pp. 701–705
- [6] Mina A Nessiem, Mostafa M Mohamed, Harry Coppock, Alexander Gaskell and Björn W Schuller “Detecting COVID-19 from breathing and coughing sounds using deep neural networks” In Proceedings International Symposium on Computer-Based Medical Systems, 2021, pp. 183–188 IEEE
- [7] Björn Wolfgang Schuller, Dagmar M Schuller, Kun Qian, Juan Liu, Huaiyuan Zheng and Xiao Li “COVID-19 and Computer Audition: An overview on what speech & sound analysis could contribute in the SARS-CoV-2 corona crisis” In Frontiers in digital health 3 Frontiers, 2021, pp. 14
- [8] Gauri Deshpande, Anton Batliner and Björn W Schuller “AI-Based human audio processing for COVID-19: A comprehensive overview” In Pattern Recognition 122 Elsevier, 2022, pp. 108289
- [9] Ting Dang, Jing Han, Tong Xia, Dimitris Spathis, Erika Bondareva, Chloë Brown, Jagmohan Chauhan, Andreas Grammenos, Apinan Hasthanasombat and Andres Floto “COVID-19 disease progression prediction via audio signals: A longitudinal study” In arXiv preprint arXiv:2201.01232, 2022
- [10] Zhiang Chen, Muyun Li, Ruoyu Wang, Wenzhuo Sun, Jiayi Liu, Haiyang Li, Tianxin Wang, Yuan Lian, Jiaqian Zhang and Xinheng Wang “Diagnosis of COVID-19 via acoustic analysis and artificial intelligence by monitoring breath sounds on smartphones” In Journal of Biomedical Informatics 130, 2022, pp. 104078
- [11] Feng Shi, Jun Wang, Jun Shi, Ziyan Wu, Qian Wang, Zhenyu Tang, Kelei He, Yinghuan Shi and Dinggang Shen “Review of artificial intelligence techniques in imaging data acquisition, segmentation, and diagnosis for COVID-19” In IEEE Reviews in Biomedical Engineering 14 IEEE, 2020, pp. 4–15
- [12] Harry Coppock, Lyn Jones, Ivan Kiskin and Björn Schuller “COVID-19 detection from audio: seven grains of salt” In The Lancet Digital Health 3.9 Elsevier, 2021, pp. e537–e538
- [13] Katrin D Bartl-Pokorny, Florian B Pokorny, Anton Batliner, Shahin Amiriparian, Anastasia Semertzidou, Florian Eyben, Elena Kramer, Florian Schmidt, Rainer Schönweiler and Markus Wehler “The voice of COVID-19: Acoustic correlates of infection in sustained vowels” In The Journal of the Acoustical Society of America 149.6 Acoustical Society of America, 2021, pp. 4377–4383
- [14] Gerhard Hagerer, Vedhas Pandit, Florian Eyben and Björn Schuller “Enhancing lstm rnn-based speech overlap detection by artificially mixed data” In Audio Engineering Society Conference: 2017 AES International Conference on Semantic Audio, 2017 Audio Engineering Society
- [15] Peter Wittenburg, Hennie Brugman, Albert Russel, Alex Klassmann and Han Sloetjes “ELAN: A professional framework for multimodality research” In Proceedings LREC, 2006, pp. 1556–1559
- [16] Kotra Venkata Sai Ritwik, Shareef Babu Kalluri and Deepu Vijayasenan “COVID-19 patient detection from telephone quality speech data” In arXiv preprint arXiv:2011.04299, 2020
- [17] Ali Imran, Iryna Posokhova, Haneya N Qureshi, Usama Masood, Muhammad Sajid Riaz, Kamran Ali, Charles N John, MD Iftikhar Hussain and Muhammad Nabeel “AI4COVID-19: AI enabled preliminary diagnosis for COVID-19 from cough samples via an app” In Informatics in Medicine Unlocked 20 Elsevier, 2020, pp. 100378
- [18] N Sharma, P Krishnan, R Kumar, S Ramoji, SR Chetupalli, R Nirmala, P Kumar Ghosh and S Ganapathy “Coswara-A database of breathing, cough, and voice sounds for COVID-19 diagnosis” In Proceedings INTERSPEECH, 2020, pp. 4811–4815
- [19] Ananya Muguli, Lancelot Pinto, Nirmala R, Neeraj Sharma, Prashant Krishnan, Prasanta Kumar Ghosh, Rohit Kumar, Shrirama Bhat, Srikanth Raj Chetupalli, Sriram Ganapathy, Shreyas Ramoji and Viral Nanda “DiCOVA Challenge: Dataset, task, and baseline system for COVID-19 diagnosis using acoustics” In Proceedings INTERSPEECH, 2021, pp. 901–905
- [20] Lara Orlandic, Tomas Teijeiro and David Atienza “The COUGHVID crowdsourcing dataset, a corpus for the study of large-scale cough analysis algorithms” In Scientific Data 8.1 Nature Publishing Group, 2021, pp. 1–10
- [21] Piyush Bagad, Aman Dalmia, Jigar Doshi, Arsha Nagrani, Parag Bhamare, Amrita Mahale, Saurabh Rane, Neeraj Agarwal and Rahul Panicker “Cough against COVID: Evidence of COVID-19 signature in cough sounds” In arXiv preprint arXiv:2009.08790, 2020
- [22] Gadi Pinkas, Yarden Karny, Aviad Malachi, Galia Barkai, Gideon Bachar and Vered Aharonson “SARS-CoV-2 detection from voice” In IEEE Open Journal of Engineering in Medicine and Biology 1 IEEE, 2020, pp. 268–274
- [23] Tong Xia, Dimitris Spathis, J Ch, Andreas Grammenos, Jing Han, Apinan Hasthanasombat, Erika Bondareva, Ting Dang, Andres Floto and Pietro Cicuta “COVID-19 Sounds: A large-scale audio dataset for digital respiratory screening” In Advances in Neural Information Processing Systems: Datasets and Benchmarks Track (Round 2), 2021
- [24] Andreas Triantafyllopoulos, Shuo Liu and Björn W Schuller “Deep speaker conditioning for speech emotion recognition” In Proceedings ICME, 2021, pp. 1–6
- [25] Florian Eyben, Klaus R Scherer, Björn W Schuller, Johan Sundberg, Elisabeth André, Carlos Busso, Laurence Y Devillers, Julien Epps, Petri Laukka and Shrikanth S Narayanan “The Geneva minimalistic acoustic parameter set (GeMAPS) for voice research and affective computing” In IEEE Transactions on Affective Computing 7.2 IEEE, 2015, pp. 190–202
- [26] Björn Schuller, Stefan Steidl, Anton Batliner, Alessandro Vinciarelli, Klaus Scherer, Fabien Ringeval, Mohamed Chetouani, Felix Weninger, Florian Eyben and Erik Marchi “The INTERSPEECH 2013 computational paralinguistics challenge: Social signals, conflict, emotion, autism” In Proceedings INTERSPEECH, 2013
- [27] Alexei Baevski, Yuhao Zhou, Abdelrahman Mohamed and Michael Auli “wav2vec 2.0: A framework for self-supervised learning of speech representations” In Advances in Neural Information Processing Systems 33, 2020, pp. 12449–12460
- [28] Alexis Conneau, Alexei Baevski, Ronan Collobert, Abdelrahman Mohamed and Michael Auli “Unsupervised cross-lingual representation learning for speech recognition” In Proceedings INTERSPEECH, 2021, pp. 2426–2430
- [29] Björn W. Schuller, Anton Batliner, Christian Bergler, Cecilia Mascolo, Jing Han, Iulia Lefter, Heysem Kaya, Shahin Amiriparian, Alice Baird, Lukas Stappen, Sandra Ottl, Maurice Gerczuk, Panagiotis Tzirakis, Chloë Brown, Jagmohan Chauhan, Andreas Grammenos, Apinan Hasthanasombat, Dimitris Spathis, Tong Xia, Pietro Cicuta, Joeri Rothkrantz, Jelle Treep and Casper Kaandorp “The INTERSPEECH 2021 computational paralinguistics challenge: COVID-19 cough, COVID-19 speech, escalation & primates” In Proceedings INTERSPEECH, 2021
- [30] Florian Eyben, Martin Wöllmer and Björn Schuller “openSMILE: the Munich versatile and fast open-source audio feature extractor” In Proceedings ACM Multimedia, 2010, pp. 1459–1462
- [31] Johannes Wagner, Andreas Triantafyllopoulos, Hagen Wierstorf, Maximilian Schmitt, Florian Eyben and Björn W Schuller “Dawn of the transformer era in speech emotion recognition: closing the valence gap” In arXiv preprint arXiv:2203.07378, 2022
- [32] Robert Rosenthal “Parametric measures of effect size” In The Handbook of Research Synthesis New York: Russell Sage Foundation, 1994, pp. 231–244
- [33] Randy J Larsen and Margaret Kasimatis “Day-to-day physical symptoms: Individual differences in the occurrence, duration, and emotional concomitants of minor daily illnesses” In Journal of Personality 59.3 Wiley Online Library, 1991, pp. 387–423
- [34] Andreas Triantafyllopoulos, Johannes Wagner, Hagen Wierstorf, Maximilian Schmitt, Uwe Reichel, Florian Eyben, Felix Burkhardt and Björn W Schuller “Probing Speech Emotion Recognition Transformers for Linguistic Knowledge” In arXiv preprint arXiv:2204.00400, 2022
- [35] Jui Shah, Yaman Kumar Singla, Changyou Chen and Rajiv Ratn Shah “What all do audio transformer models hear? probing acoustic representations for language delivery and its structure” In arXiv preprint arXiv:2101.00387, 2021