The common envelope origins of the fast jet in the planetary nebula M 3-38
Abstract
We present the analysis of Multi-Espectrógrafo en GTC de Alta Resolución para Astronomía (MEGARA) high-dispersion integral field spectroscopic observations of the bipolar planetary nebula (PN) M 3-38. These observations unveil the presence of a fast outflow aligned with the symmetry axis of M 3-38 that expands with a velocity up to 225 km s-1. The deprojected space velocity of this feature can be estimated to be 320 km s-1, which together with its highly collimated morphology suggests that it is one of the fastest jet detected in a PN. We have also used Kepler observations of the central star of M 3-38 to unveil variability associated with a dominant period of 17.7 days. We attribute this to the presence of a low-mass star with an orbital separation of 0.12–0.16 au. The fast and collimated ejection and the close binary system point towards a common envelope formation scenario for M 3-38.
]Submitted to ApJL
1 Introduction
Planetary nebulae (PNe) are formed by mass lost by solar-like stars on their way of becoming white dwarfs, mostly during the asymptotic giant branch (AGB) phase (Vassiliadis & Wood, 1993). The resultant stellar remnant becomes hot enough to produce a high UV flux and fast stellar wind that ionizes and compresses the material ejected in the late AGB phase, giving birth to a PN (Kwok, 2000).
It has long been suggested that this generalized interacting stellar winds model of PN formation (Balick, 1987) is too simple to explain the wild variety of PN morphologies (e.g., Schwarz et al., 1992; Manchado et al., 1996). Several mechanisms were soon invoked to explain this conundrum (Soker, 1997), involving binary star interactions, including jet-like ejections during the late AGB or early post-AGB phases (Sahai & Trauger, 1998).
Jets or bipolar fast outflows have been known to exist in PNe for a long time since the first discovery in NGC 2392 (Gieseking et al., 1985). The statistical analysis of a sample of 85 collimated outflows detected in 58 PNe (Guerrero et al., 2020, and references therein) found a bimodal distribution, with 30% of collimated outflows showing velocities 100 km s-1. These high-velocity jets are prime candidates to have been launched by a binary system at the core of the PN.
The presence of fast collimated outflows can be gleaned by observing images of PNe as their action is typically associated with highly-elongated structures, S-shaped filaments and V-shaped structures (Rechy-García et al., 2020a). Complementary kinematical information has been traditionally obtained using long-slit high-dispersion spectroscopic observations, which is otherwise the only method to detect fast collimated outflows in compact PNe (Rechy-García et al., 2017). The advent of high-dispersion integral field spectroscopy provides kinematical information with broad spatial coverage. This technique has allowed, for instance, to map for the first time the extension of the extremely faint bipolar jet in NGC 2392 (Guerrero et al., 2021), to dissect the abundances and kinematics of the born-again PN HuBi 1 (Rechy-García et al., 2020b; Montoro-Molina et al., 2022) and the spatio-kinematical structure of M 2-31 (Rechy-García et al., 2021).
In this letter, we present the discovery of one of the fastest collimated outflows in a PN. We use Multi-Espectrógrafo en GTC de Alta Resolución para Astronomía (MEGARA; Gil de Paz et al., 2018) observations obtained at the Gran Telescopio Canarias (GTC) of the PN M 3-38 (PN G356.904.4) to unveil its extreme kinematic structure. Its central star (CSPN) is further found to exhibit a Kepler/K2 light-curve consistent with a post-common envelope (post-CE) binary system, which can be blamed as responsible for the collimation of the fast outflow in the recent past. The observations and archival data analysis of M 3-38 were motivated by the presence of extremely fast ejections revealed in a long-slit echelle spectrum on the H+[N ii] emission lines available at the San Pedro Mártir Spectroscopic Catalogue of PNe (López et al., 2012), and by the highly elongated bipolar morphology displayed in a narrow-band HST WFPC2 F656N image (see figure 14 in Guzman-Ramirez et al., 2014).
2 Observations and data preparation
M 3-38 was observed with GTC MEGARA on 2021 August 29 using the Integral Field Unit (IFU) mode. This provides a field of view of 125113 with a spaxel size of 062. We used the high-resolution (HR) Volume-Phased Holographic (VPH) grism VPH665-HR covering the 6405.6-6797.1 Å wavelength range at a spectral dispersion of 0.098 Å with a resolution of 18,700 ( km s-1). Three 900 s exposures were obtained with a seeing of 12.
The data reduction process was carried out using the Data Reduction Cookbook provided by the Universidad Complutense de Madrid (Pascual et al., 2019). Through the pipeline, we subtracted the sky and bias contributions, correct for flat field effects, and perform wavelength calibration, spectra tracing and extraction. Sky subtraction is performed via 56 ancillary fibers located from the center of the IFU. We apply the regularization grid task megararss2cube111Task developed by J. Zaragoza-Cardiel available at https://github.com/javierzaragoza/megararss2cube to obtain square spaxels with sizes of 0215. The final cube has dimensiones of 52584300 equivalent to a total of 3016 spectra in the datacube. The flux calibration was done using observations of the spectrophotometric standard star HR7596 taken immediately after the observations of M 3-38.
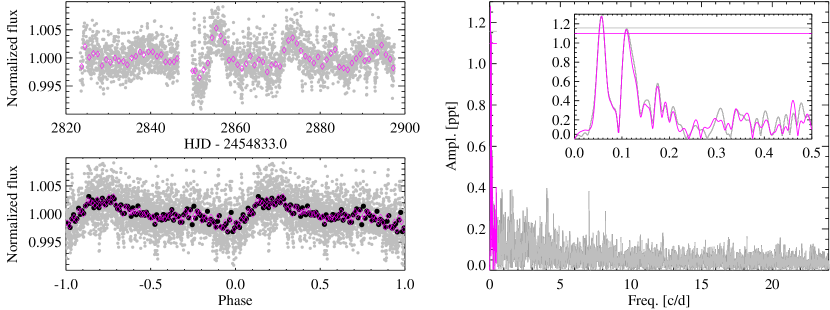
M 3-38 was observed by the Kepler/K2 mission (Howell et al., 2014) during Campaign 11 in 2016 during September 24 to December 8. Campaign 11 suffered a three day interruption (October 18–20) to make a pointing correction of in the spacecraft attitude. As a result, the dataset was splitted in two parts, designated Campaign 111 and 112, spanning 23 and 48 days, respectively (see Figure 5, upper left), that were processed separately using new target apertures in the second part of the campaign (see the Data Release Notes222https://archive.stsci.edu/missions/k2/doc/drn/KSCI-19151-002_K2-DRN30_C11.pdf for more information). We retrieved the two lightcurves from the Mikulski Archives for Space Telescopes333https://mast.stsci.edu/portal/Mashup/Clients/Mast/Portal.html and used the Pre-search Data Conditioning Simple Aperture Photometry (PDCSAP) datasets, already cleaned for systematic errors. After removing outliers, the flux was normalized and the two datasets joined together resulting in a total of 3166 useful points with a 30 minute cadence along a 74 days time baseline.
3 Results
3.1 Kinematics of the collimated outflow
The MEGARA IFS observations of M 3-38 indicate diffuse emission in the H, [N ii] 6548,6584, [S ii] 6717,6731, and He ii 6560 lines. Emission from the [N ii] 6435.61,6527.23, C i 6674.11,6683.95, and C ii 6578.05 lines is also detected in the innermost regions. The spatio-kinematics of M 3-38 will be investigated here using the brightest H and [N ii] 6584 emission lines.
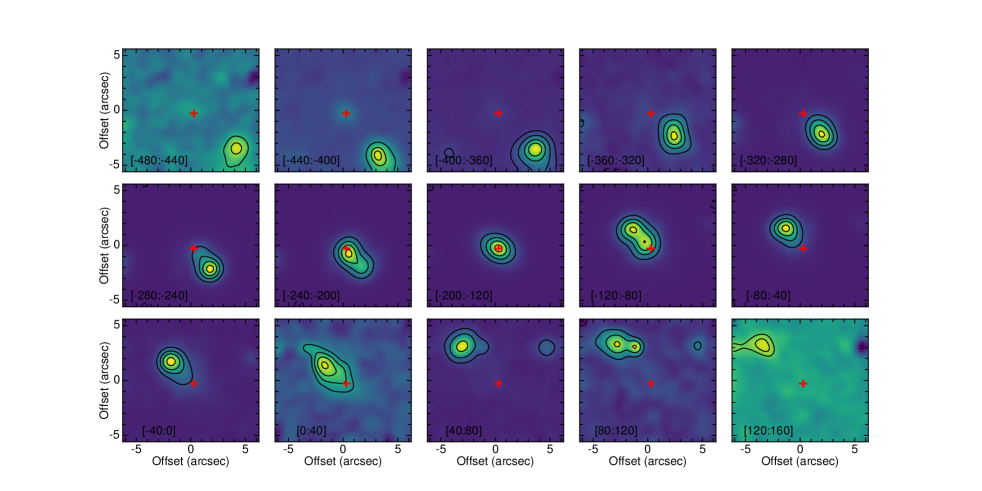
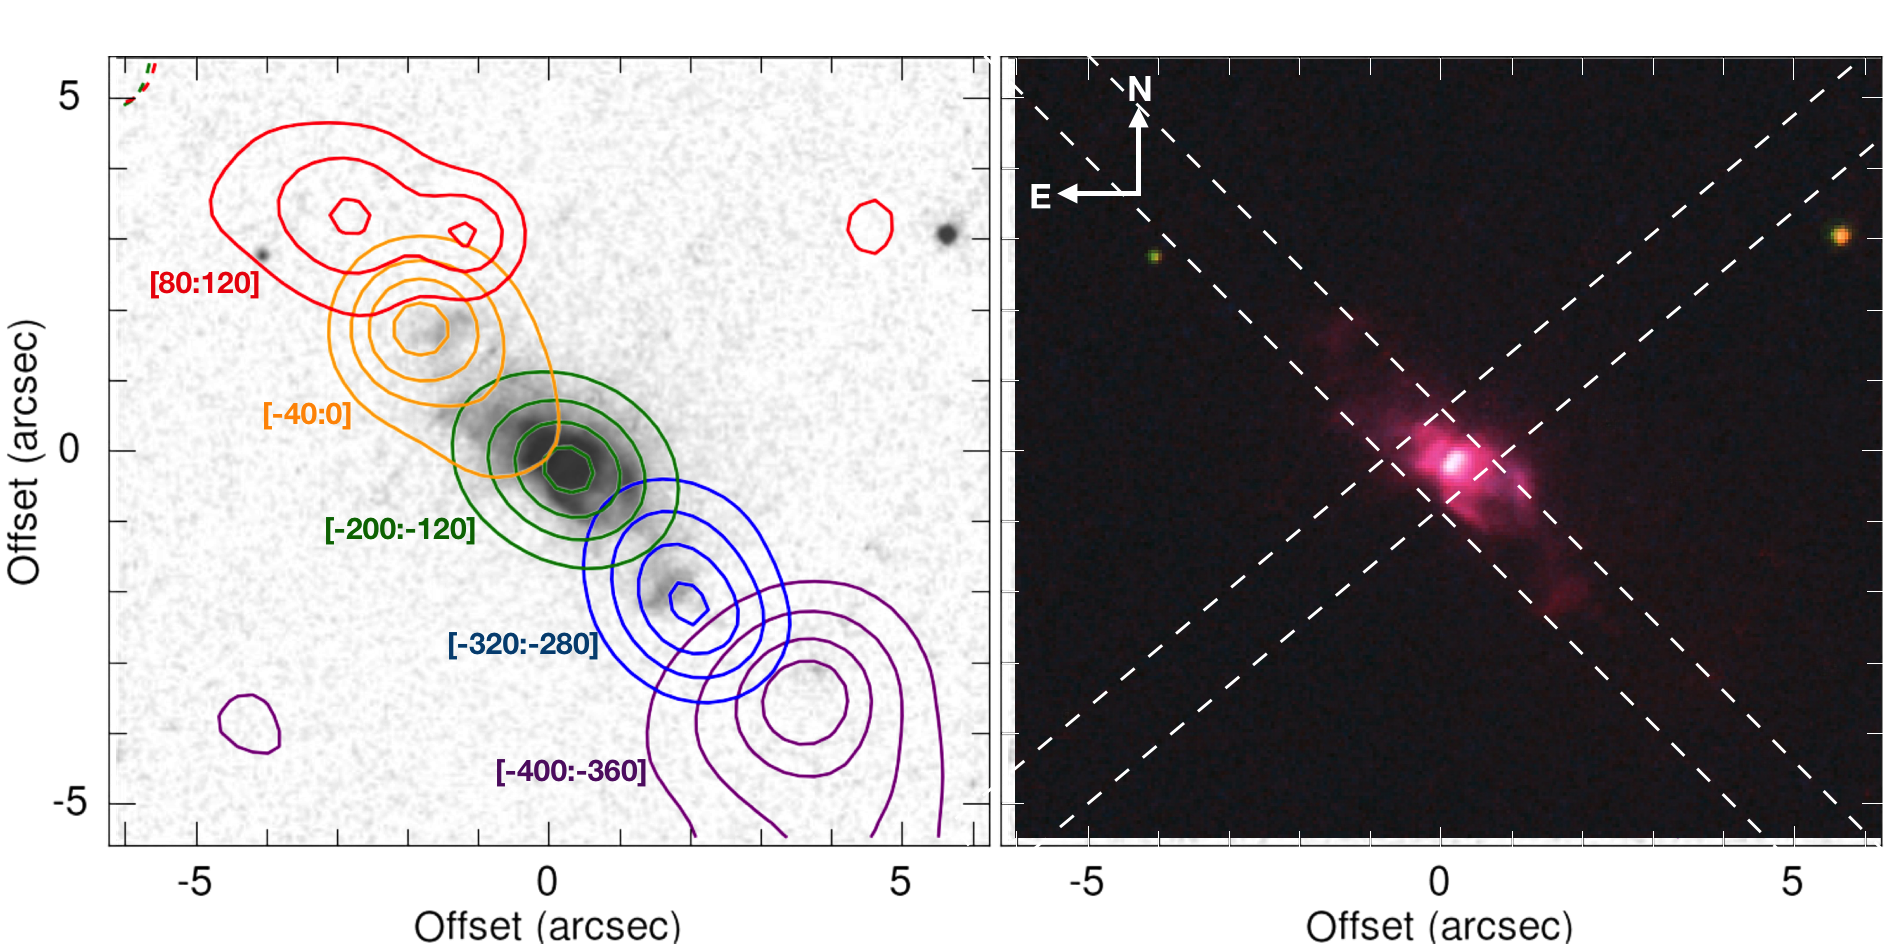
A tomographic view of M 3-38 is displayed in Figure 1, with channel maps of the [N ii] 6584 emission line spanning from radial velocities in the range 480 to 160 km s-1 with a width of 40 km s-1. For a systemic velocity in the Local Standard Rest (LSR) frame of 160.5 km s-1 (central panel of Fig. 1), the emission in the most extreme panels implies expansion velocities in the range 225 km s-1. The emission of the fast outflow of M 3-38 is aligned along a position angle (PA) of , with the southwest emission approaching (blue-shifted) and the northeast emission receding (red-shifted). The emission is thus mostly aligned with the symmetry axis of M 3-38, as illustrated in the left panel of Figure 2, where contours of the emission in different velocity ranges are overplotted on an HST WFPC2 H image. In this image, M 3-38 exhibits a highly axisymmetric morphology with two 5.3′′ in size bipolar lobes aligned along a PA of terminating in bow-shock-like clumps. The emission from the intermediate-velocity ranges from to 0 km s-1 (orange in Fig. 2-left) and to 280 km s-1 (blue in Fig. 2-left) is associated with those clumps, but the emission from the extreme-velocity ranges from to km s-1 (red in Fig. 2-left) and to km s-1 (violet in Fig. 2-left) peaks at from the CSPN, i.e., they extend beyond the emission detected in the HST H image.
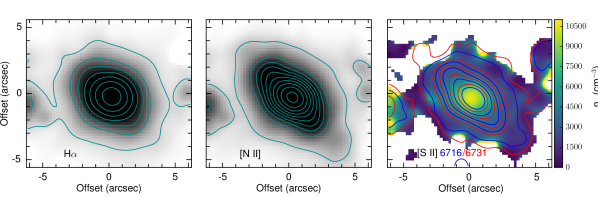
The extent of the emission detected by MEGARA is illustrated in the continuum-subtracted H and [N ii] 6584 maps presented in Figure 3. A density map is also presented in the right panel of this figure. The density has been computed from the [S ii] 6716 to [S ii] 6731 ratio map using in python getTemDen function of the PyNeb package (Luridiana et al., 2015) for the analysis of emission lines assuming an electron temperature444The calculation of the density using the [S ii] doublet is rather insensitive to the adopted value of electron temperature for typical values in the range 8000–12000 K found in PNe. of 10000 K. This map indicates a clear density gradient from the innermost regions of M 3-38 to the inner outflow ( cm-3) and to its outermost tip ( cm-3).
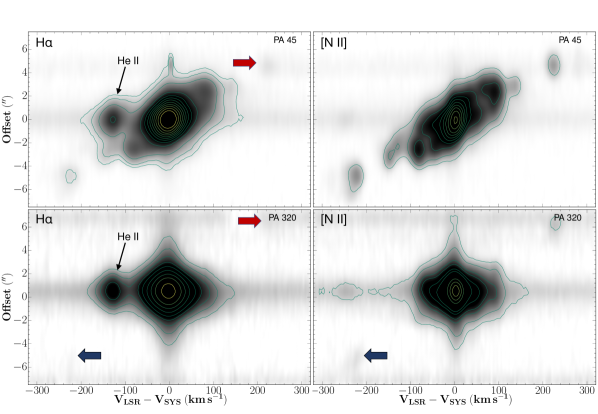
To investigate the expansion-law of the outflow of M 3-38, classical position-velocity (PV) diagrams in the H and [N ii] 6584 emission lines have been extracted from a pseudo long-slit along its bipolar axis at PA 45∘ (Fig. 4-top). These PV diagrams are consistent with a homologous expansion with a velocity gradient 60 km s-1 arcsec-1. We note that these PV diagrams are suggestive of a double-S shape that could be attributed to precession. The highest-velocity components at the tip of this outflow reach expansion velocities 220 km s-1, with the SW clump showing an intriguing hook-like shape extending up to 7′′ from the CSPN with expansion velocity of 240 km s-1.
The MEGARA observations also detect another pair of high-velocity clumps, as denoted by the violet and red contours in Fig. 2-left, located from the CSPN towards the SE and NW of M3-38, respectively. Quite surprisingly, these clumps are aligned along a direction which is almost orthogonal to the bipolar axis of M 3-38. To illustrate further their presence, H and [N ii] 6584 PV diagrams have also been extracted from a -wide pseudo long-slit along PA=320∘ (Fig. 2-right). These PV diagrams (Fig. 4-bottom), and particularly the [N ii] one, confirm the presence of high-velocity components along this direction with an expansion velocity of 230 km s-1.
Incidentally, we shall mention that the PV diagrams shown in Figure 4 reveal the presence of an extended component at the systemic velocity of M 3-38 that seems to fill the whole field of view of the MEGARA IFU. This component is broad and unresolved, with an intrinsic FWHM of 40 km s-1 and a line-tilt up to 6 km s-1. It can thus be interpreted as a low-velocity non-spherical halo around M 3-38.
3.2 Photometric variations of the central star
We used Period04 (Lenz & Breger, 2005) to search for periodicities in the Kepler/K2 light curve of the CSPN of M 3-38 derived from Campaign C111 and C112 (Fig. 5-left-top). The amplitude spectra was calculated up to the Nyquist frequency, corresponding to 24 cycle day-1. A frequency is considered significant when its amplitude is at least four times the noise level (Breger et al., 1993), which is equivalent to a 99.9% confidence level (Kuschnig et al., 1997). Since no significant frequencies were found in the high frequency range, the original light curve was binned to one day bins to search for periodicities up to the 0.5 cycle day-1 Nyquist limit (Fig. 5-top-left panel). In both amplitude spectra (Fig. 5-right panel), we found the highest amplitude frequency at 0.0565 cycle day-1 to be significant, corresponding to a main period of 17.7 d, and its first harmonic at 0.1199 cycle day-1, corresponding to 9.0 d period. We note that the analysis of the same Kepler/K2 data by Jacoby et al. (2021) deemed it non-variable, as these authors conservatively excluded cases of low-amplitude variability if the best period was close to or more than half of the sampling window that could have resulted from spurious variability.
Fig. 5-bottom-left panel shows the folded individual and one day binned light curve to the main frequency, as well as mean values for a 0.01 phase bins for better appreciation. The light curve shows a dominant peak at phase 0.2 with a main minimum at phase 0.0 and a subtle through at phase 0.55. Within the limits of the low signal, there seem to be a hint of a secondary peak at phase 0.75. The CSPN of M 3-38 is classified as an H-deficient, weak emission line star (DePew et al., 2011), but the coherence of its light-curve precludes wind variability (see, for instance, the light-curve of H 2-48 in Figure 3c of Jacoby et al., 2021), whereas long-lived bright spots on the stellar surface would have resulted in shorter periods associated with the stellar rotation. The variations in the light-curve of M 3-38 could be attributed to irradiation onto a companion, as an ellipsoidal modulation due to tidal distortion would require a much shorter period.
4 Discussion
In the previous section we have discussed the presence of a fast collimated outflow and a binary star in M 3-38. Their properties are discussed below.
The main outflow of M 3-38 is aligned along its bipolar axis and has expansion velocities up to 225 km s-1 (Fig. 2 and 4). This makes the outflow in M 3-38 one of the fastest among PNe, only surpassed by those in M 1-16 and MyCn 18 and as fast as that in KjPn 8 (Guerrero et al., 2020, and references therein). The high velocity, linear PV diagram, and elongated morphology of this outflow makes it a “bona-fide” jet candidate. The jet space velocity cannot be derived because its inclination angle with the line of sight is unknown. If an inclination of 45 were to be adopted, then the space velocity of the jet would be km s-1. The outermost fastest component of this jet is projected about 5′′ from the central star of M 3-38 (Fig. 2). Adopting the most recent distance estimate of 8 kpc to M 3-38555 Distance estimates to M 3-38 in the literature range from 5.3 to 14.1 kpc, with an average value very similar to the one adopted in the text. derived from MSX MIR flux densities by Ortiz et al. (2011) and a similar inclination angle, the projected distance from the PN center of 0.19 pc would imply a true linear radius of 0.27 pc. This translates into a jet kinematic age of 860 yr. We remark that the values of the projected distance, true linear radius, and kinematic age given above scale with the distance, which has been adopted to be 8 kpc.
The ionized mass of the jet can be computed from the relationship (Pottasch, 1984):
| (1) |
where the intrinsic H flux is in units of erg cm-2 s-1 and in kpc. The intrinsic H flux of the jet is derived to be erg cm-2 s-1 from the observed H flux of erg cm-2 s-1 for a logarithmic extinction (H) of 2.0 (Tylenda et al., 1992) and case B recombination. The density of the jet is 2,500 cm-3, as derived from the density-sensitive [S ii] doublet (Fig. 3-right). Assuming a value of 10,000 K for , an ionized mass of 0.011 M⊙ is derived. Alternatively, the volume occupied by the jet and its density can be used to estimate the ionized mass assuming a conservative value of 0.1 for the “filling factor” and a standard value of 1.4 for the mean molecular weight. Adopting a single cylindrical geometry with radius 0.5′′ and height 5′′ tilted by with the line of sight, a value of 10-3 M⊙ is derived. Given the uncertainties and assumptions of both methods, we shall adopt an intermediate value for the ionized mass of 10-3 M⊙.
The values of space velocity666 An average radial expansion velocity of 70 km s-1, which is representative of the bulk of emission, was adopted in the calculations of the linear momentum and mechanical luminosity, rather than the extreme 225 km s-1 expansion velocity., kinematic age, and ionized mass can be combined to derive a mass-loss rate in the range M⊙ yr-1, a linear momentum from to dyn, and a mechanical luminosity of L⊙ for the bulk of the emission.
The analysis of the Kepler/K2 light-curve reveals a dominant frequency that corresponds to a period of 17.7 d, suggesting that M 3-38 host a binary system. The variability type is unclear as it can be assigned either to irradiation of a main sequence companion (Hillwig et al., 2016a) or to ellipsoidal modulation, which is always interpreted in CSPNe as a case for a double degenerate system (DD; Hillwig et al., 2010). By adopting a total mass for the binary CSPN of M 3-38 of 0.7–1.6 M⊙ (0.4-1.0 M⊙ for the CSPN and 0.3-0.6 M⊙ for the companion whatever it is a WD or a main sequence star), an orbital separation of 0.12–0.16 au (25–34 R⊙) is estimated. This orbital separation favors irradiation as a viable mechanism to produce the small amplitude variation seen in M 3-38 (see the top-left panel of figure 1 in De Marco et al., 2008), whereas it makes ellipsoidal variability highly unlikely for the expected Roche lobe size of several solar radii.
The small orbital separation and the presence of highly-collimated, fast ejections from M 3-38 leads us to suggest that it might have formed as the result of CE evolution (e.g., Paczynski, 1976; Ivanova et al., 2013; Jones & Boffin, 2017). During the CE phase the massive component overflows its Roche lobe and the companion is engulfed. Models predict that the orbit decays and orbital energy and angular momentum are transferred to the CE within a timescale of months-to-years (e.g., Chamandy et al., 2020). The subsequent evolution naturally explains the formation of bipolar ejections (see, e.g., García-Segura et al., 2021; Ondratschek et al., 2021; Zou et al., 2020; López-Cámara et al., 2021, and references therein) of material in the direction perpendicular to the orbital plane (see Hillwig et al., 2016b). Indeed, high-resolution ALMA observations of water fountain objects, which are often interpreted as transitional sources between the AGB and proto-PNe phases, imply that they have experienced a recent (200 yr) CE evolution (Khouri et al., 2021).
Mass estimates and kinematics of PNe that experienced a CE phase can be directly contrasted with theoretical predictions (Alcolea et al., 2007; Frew & Parker, 2007; Corradi et al., 2015; Santander-García et al., 2022). The mass-loss rate of the jets of M 3-38 is about one to two orders of magnitude larger than those reported for the jets of PNe with post-CE close binaries (Tocknell et al., 2014) and for the jet in NGC 2392 (Guerrero et al., 2021), but consistent with those of the late AGB jets in BD46∘442 and IRAS 191353937 reported by Bollen et al. (2020). The linear momentum and mechanical luminosity of the jet in M 3-38 are in the high end of the range presented by those authors, but still notably smaller than the values reported for outflows in proto-PNe (Bujarrabal et al., 2001).
If the jet in M 3-38 were launched by a CE interaction, its velocity should be of the order of the escape velocity of the secondary star launching the jet,
| (2) |
where and are its mass and radius, and is the gravitational constant. Jet velocities of 540 and 480 km s-1 can be estimated for M5 V and M8 V stars with masses of 0.21 and 0.06 M⊙, respectively (see Cox, 2000). These values are close to the upper limit estimated for the real jet velocity, but we note that the interaction of the jet with the material ejected previously during the AGB phase might have slowed it down.
The 17.7 d period proposed for the binary CSPN of M 3-38 is relatively long compared to the majority of binary CSPNe (see the compilation presented by Boffin & Jones, 2019, and references therein). In contrast, simulations of CE evolution result in relatively large separations of the order of 10–20 R⊙ and periods larger than 3 d (see, e.g., Chamandy et al., 2018, 2020; Iaconi & De Marco, 2019), more alike that of M 3-38.
To conclude, M 3-38 could be a new addition to the select group of PNe with fast collimated outflows and post-CE CSPNe (e.g., Fleming 1, Boffin et al., 2012). A more accurate characterization of the light-curve of its CSPN and properties of its jet are urgent, as M 3-38 could be a case study of the late evolution of low- and intermediate-mass stars in binary systems and the launch of high-velocity jets in a CE phase. Its unusually long orbital period among binary post-CE CSPNe makes it also a key case for the comparison of CE evolution simulations and observations.
Finally, it is interesting to remark the presence of an additional high-velocity ejection almost orthogonal to the main one.
While astonishing, this is not uncommon among PNe, with examples of collimated outflows almost orthogonal (e.g. IC 4593; Corradi et al., 1997) or along very different directions (see the compilation presented by Guerrero et al., 2021), with the record case of NGC 6210 with five different symmetry axes (Henney et al., 2021).
It has been noted that jets misaligned with the main nebular axis might be characteristic of PNe with a post-CE binary (Bond & Livio, 1990; De Marco, 2009).
There is not an obvious interpretation for these phenomena (see, e.g., Bear & Soker, 2017), but, if associated with a CE phase, it is clearly suggestive of dramatic changes in the preferential ejection direction of the stellar system.
JSRG acknowledges support from the Programa de Becas posdoctorales of the Direccion General de Asuntos del Personal Académico of the Universidad Nacional Autonoma de México (DGAPA, UNAM, Mexico). JAT acknowledges support by the Marcos Moshinsky Foundation (Mexico), UNAM PAPIIT project IA101622 (Mexico), and the Visiting-Incoming programme of the Centro de Excelencia Severo Ochoa (Spain). MAG acknowledges support of grant PGC 2018-102184-B-I00 of the Ministerio de Educación, Innovación y Universidades cofunded with FEDER funds. CR-L and MAG acknowledge financial support from the State Agency for Research of the Spanish MCIU through the “Center of Excellence Severo Ochoa” award to the Instituto de Astrofísica de Andalucía (SEV-2017-0709). LS acknowledges support from UNAM PAPIIT Grant IN110122. JAT AND GR-L acknowledges support from CONACyT (grant 263373). The authors are thankful to the referee, Prof. Orsola De Marco, for comments and suggestions that improved the interpretation of the results presented here, to E. Rodríguez for helpful discussions on the binary nature of the CSPN of M 3-38, and to G. Jacoby and D. Jones for discussions and further clarification of the methods and results presented in their work (Jacoby et al., 2021). This work has made extensive use of the NASA’s Astrophysics Data System.
References
- Alcolea et al. (2007) Alcolea, J., Neri, R., & Bujarrabal, V. 2007, A&A, 468, L41. doi:10.1051/0004-6361:20066956
- Balick (1987) Balick, B. 1987, AJ, 94, 671. doi:10.1086/114504
- Bear & Soker (2017) Bear, E. & Soker, N. 2017, ApJ, 837, L10. doi:10.3847/2041-8213/aa611c
- Boffin & Jones (2019) Boffin, H. M. J. & Jones, D. 2019, The Importance of Binaries in the Formation and Evolution of Planetary Nebulae, Springer Briefs in Astronomy, Springer Nature Switzerland AG. ISBN 978-3-030-25058-4. doi:10.1007/978-3-030-25059-1
- Boffin et al. (2012) Boffin, H. M. J., Miszalski, B., Rauch, T., et al. 2012, Science, 338, 773. doi:10.1126/science.1225386
- Bollen et al. (2020) Bollen, D., Kamath, D., De Marco, O., et al. 2020, A&A, 641, A175. doi:10.1051/0004-6361/202038414
- Bond & Livio (1990) Bond, H. E. & Livio, M. 1990, ApJ, 355, 568. doi:10.1086/168789
- Breger et al. (1993) Breger, M., Stich, J., Garrido, R., et al. 1993, A&A, 271, 482
- Bujarrabal et al. (2001) Bujarrabal, V., Castro-Carrizo, A., Alcolea, J., et al. 2001, A&A, 377, 868. doi:10.1051/0004-6361:20011090
- Chamandy et al. (2020) Chamandy, L., Blackman, E. G., Frank, A., et al. 2020, MNRAS, 495, 4028. doi:10.1093/mnras/staa1273
- Chamandy et al. (2018) Chamandy, L., Frank, A., Blackman, E. G., et al. 2018, MNRAS, 480, 1898. doi:10.1093/mnras/sty1950
- Corradi et al. (2015) Corradi, R. L. M., García-Rojas, J., Jones, D., et al. 2015, ApJ, 803, 99. doi:10.1088/0004-637X/803/2/99
- Corradi et al. (1997) Corradi, R. L. M., Guerrero, M., Manchado, A., et al. 1997, New A, 2, 461. doi:10.1016/S1384-1076(97)00032-8
- Cox (2000) Cox, A. N. 2000, Allen’s Astrophysical Quantities, 1
- DePew et al. (2011) DePew, K., Parker, Q. A., Miszalski, B., et al. 2011, MNRAS, 414, 2812. doi:10.1111/j.1365-2966.2011.18337.x
- De Marco (2009) De Marco, O. 2009, PASP, 121, 316. doi:10.1086/597765
- De Marco et al. (2008) De Marco, O., Hillwig, T. C., & Smith, A. J. 2008, AJ, 136, 323. doi:10.1088/0004-6256/136/1/323
- Frew & Parker (2007) Frew, D. J. & Parker, Q. A. 2007, Asymmetrical Planetary Nebulae IV, 475
- García-Segura et al. (2021) García-Segura, G., Taam, R. E., & Ricker, P. M. 2021, ApJ, 914, 111. doi:10.3847/1538-4357/abfc4e
- Gieseking et al. (1985) Gieseking, F., Becker, I., & Solf, J. 1985, ApJ, 295, L17. doi:10.1086/184529
- Gil de Paz et al. (2018) Gil de Paz, A., Carrasco, E., Gallego, J., et al. 2018, Proc. SPIE, 10702, 1070217. doi:10.1117/12.2313299
- Guerrero et al. (2021) Guerrero, M. A., Cazzoli, S., Rechy-García, J. S., et al. 2021, ApJ, 909, 44. doi:10.3847/1538-4357/abe2aa
- Guerrero et al. (2020) Guerrero, M. A., Suzett Rechy-García, J., & Ortiz, R. 2020, ApJ, 890, 50. doi:10.3847/1538-4357/ab61fa
- Guzman-Ramirez et al. (2014) Guzman-Ramirez, L., Lagadec, E., Jones, D., et al. 2014, MNRAS, 441, 364. doi:10.1093/mnras/stu454
- Henney et al. (2021) Henney, W. J., López, J. A., García-Díaz, M. T., et al. 2021, MNRAS, 502, 1070. doi:10.1093/mnras/staa4014
- Hillwig et al. (2010) Hillwig, T. C., Bond, H. E., Afşar, M., et al. 2010, AJ, 140, 319. doi:10.1088/0004-6256/140/2/319
- Hillwig et al. (2016a) Hillwig, T. C., Bond, H. E., Frew, D. J., et al. 2016, AJ, 152, 34. doi:10.3847/0004-6256/152/2/34
- Hillwig et al. (2016b) Hillwig, T. C., Jones, D., De Marco, O., et al. 2016, ApJ, 832, 125. doi:10.3847/0004-637X/832/2/125
- Howell et al. (2014) Howell, S. B., Sobeck, C., Haas, M., et al. 2014, PASP, 126, 398. doi:10.1086/676406
- Iaconi & De Marco (2019) Iaconi, R. & De Marco, O. 2019, MNRAS, 490, 2550. doi:10.1093/mnras/stz2756
- Ivanova et al. (2013) Ivanova, N., Justham, S., Chen, X., et al. 2013, A&A Rev., 21, 59. doi:10.1007/s00159-013-0059-2
- Jacoby et al. (2021) Jacoby, G. H., Hillwig, T. C., Jones, D., et al. 2021, MNRAS, 506, 5223. doi:10.1093/mnras/stab2045
- Jones & Boffin (2017) Jones, D. & Boffin, H. M. J. 2017, Nature Astronomy, 1, 0117. doi:10.1038/s41550-017-0117
- Khouri et al. (2021) Khouri, T., Vlemmings, W. H. T., Tafoya, D., et al. 2021, Nature Astronomy. doi:10.1038/s41550-021-01528-4
- Kuschnig et al. (1997) Kuschnig, R., Weiss, W. W., Gruber, R., et al. 1997, A&A, 328, 544
- Kwok (2000) Kwok, S. 2000, The origin and evolution of planetary nebulae / Sun Kwok. Cambridge ; New York : Cambridge University Press, 2000. (Cambridge astrophysics series ; 33)
- Lenz & Breger (2005) Lenz, P. & Breger, M. 2005, Communications in Asteroseismology, 146, 53. doi:10.1553/cia146s53
- López et al. (2012) López, J. A., Richer, M. G., García-Díaz, M. T., et al. 2012, Rev. Mex. Astron. Astrofis., 48, 3
- López-Cámara et al. (2021) López-Cámara, D., De Colle, F., Moreno Mendez, E., et al. 2021, arXiv:2110.02227
- Luridiana et al. (2015) Luridiana V., Morisset C., Shaw R. A., 2015, A&A, 573, A42. doi:10.1051/0004-6361/201323152
- Manchado et al. (1996) Manchado, A., Guerrero, M. A., Stanghellini, L., et al. 1996, The IAC morphological catalog of northern Galactic planetary nebulae, Publisher: La Laguna, Spain: Instituto de Astrof ısica de Canarias (IAC), ISBN: 8492180609
- Montoro-Molina et al. (2022) Montoro-Molina, B., Guerrero, M. A., Pérez-Díaz, B., et al. 2022, MNRAS. doi:10.1093/mnras/stac336
- Ondratschek et al. (2021) Ondratschek, P. A., Roepke, F. K., Schneider, F. R. N., et al. 2021, arXiv:2110.13177
- Ortiz et al. (2011) Ortiz, R., Copetti, M. V. F., & Lorenz-Martins, S. 2011, MNRAS, 418, 2004. doi:10.1111/j.1365-2966.2011.19619.x
- Paczynski (1976) Paczynski, B. 1976, Structure and Evolution of Close Binary Systems, 73, 75
- Pascual et al. (2019) Pascual S., Cardiel N., Gil de Paz A., Carasco E., Gallego J., Iglesias-Páramo J., Cedazo R., 2019, hsax.conf, 227
- Pottasch (1984) Pottasch, S. R. 1984, Astrophysics and Space Science Library, Dordrecht: Reidel, 1984. doi:10.1007/978-94-009-7233-9
- Rechy-García et al. (2020a) Rechy-García, J. S., Guerrero, M. A., Duarte Puertas, S., et al. 2020a, MNRAS, 492, 1957. doi:10.1093/mnras/stz3326
- Rechy-García et al. (2020b) Rechy-García, J. S., Guerrero, M. A., Santamaría, E., et al. 2020b, ApJ, 903, L4. doi:10.3847/2041-8213/abbe22
- Rechy-García et al. (2021) Rechy-García, J. S., Toalá, J. A., Cazzoli, S., et al. 2021, MNRAS, 508, 2254. doi:10.1093/mnras/stab2531
- Rechy-García et al. (2017) Rechy-García, J. S., Velázquez, P. F., Peña, M., et al. 2017, MNRAS, 464, 2318. doi:10.1093/mnras/stw2524
- Sahai & Trauger (1998) Sahai, R. & Trauger, J. T. 1998, AJ, 116, 1357. doi:10.1086/300504
- Santander-García et al. (2022) Santander-García, M., Jones, D., Alcolea, J., et al. 2022, A&A, 658, A17. doi:10.1051/0004-6361/202142233
- Schwarz et al. (1992) Schwarz, H. E., Corradi, R. L. M., & Melnick, J. 1992, A&AS, 96, 23
- Soker (1997) Soker N., 1997, ApJS, 112, 487. doi:10.1086/313040
- Tocknell et al. (2014) Tocknell, J., De Marco, O., & Wardle, M. 2014, MNRAS, 439, 2014. doi:10.1093/mnras/stu079
- Tylenda et al. (1992) Tylenda, R., Acker, A., Stenholm, B., et al. 1992, A&AS, 95, 337
- Vassiliadis & Wood (1993) Vassiliadis, E. & Wood, P. R. 1993, ApJ, 413, 641. doi:10.1086/173033
- Zou et al. (2020) Zou, Y., Frank, A., Chen, Z., et al. 2020, MNRAS, 497, 2855. doi:10.1093/mnras/staa2145