The role of highly vibrationally excited H2 initiating the N chemistry
The formation of hydrides by gas-phase reactions between H2 and a heavy element atom is a very selective process. Reactions with ground-state neutral carbon, oxygen, nitrogen, and sulfur atoms are very endoergic and have high energy barriers because the H2 molecule has to be fragmented before a hydride bond is formed. In cold interstellar clouds, these barriers exclude the formation of CH, OH, NH, and SH radicals through hydrogen abstraction reactions. Here we study a very energetically unfavorable process, the reaction of N () atoms with H2 molecules. We calculated the reaction rate coefficient for H2 in different vibrational levels, using quantum methods for = 07 and quasi-classical methods up to = 12; for comparison purposes, we also calculated the rate coefficients of the analogous reaction S ()+ H2() SH + H. Owing to the high energy barrier, these rate coefficients increase with and also with the gas temperature. We implemented the new rates in the Meudon photodissociation region (PDR) code and studied their effect on models with different ultraviolet (UV) illumination conditions. In strongly UV-irradiated dense gas (Orion Bar conditions), the presence of H2 in highly vibrationally excited levels ( 7) enhances the NH abundance by two orders of magnitude (at the PDR surface) compared to models that use the thermal rate coefficient for reaction N() H2 NH + H. The increase in NH column density, (NH), across the PDR is a factor of 25. We investigate the excitation and detectability of submillimeter NH rotational emission lines. Being a hydride, NH excitation is very subthermal ( ) even in warm and dense gas. We explore existing Herschel/HIFI observations of the Orion Bar and Horsehead PDRs. We report a 3 emission feature at the 974 GHz frequency of the NH = line toward the Bar. The emission level implies (NH) 1013 cm-2, which is consistent with PDR models using the new rate coefficients for reactions between N and UV-pumped H2. This formation route dominates over hydrogenation reactions involving the less abundant N+ ion. JWST observations will quantify the amount and reactivity of UV-pumped H2 in many interstellar and circumstellar environments.
Key Words.:
ISM: molecules — molecular processes – photon-dissociation region (PDR) — line: identification1 Introduction
The abundances of interstellar hydrides provide key information about the physical conditions where they are found, the H2/H fraction, and the ionization rate (Gerin et al., 2016). Much of the interstellar chemistry begins with the reaction of H2 molecules with a heavy element atom X. The dominant ionization state of X in neutral clouds depends on its ionization potential (IP). Indeed, only far-ultraviolet (FUV) photons with energies below 13.6 eV – that is to say those that cannot ionize hydrogen – penetrate diffuse neutral clouds (Snow & McCall, 2006) and the illuminated rims of denser molecular clouds, in other words their photodissociation regions (PDRs; Hollenbach & Tielens, 1997; Wolfire et al., 2022). In consequence, the initial gas reservoir is ionized for elements such as C (IP = 11.26 eV) and S (10.36 eV), but neutral111The existence of small amounts of O+ and N+ ions in these clouds is related to the ionization produced by energetic cosmic-ray particles and X-rays. The presence of abundant C+ and S+ ions is generally related to the presence of stellar or secondary FUV photons. for elements such as N (IP = 14.53 eV) and O (13.62 eV).
Even for small amounts of H2 in the gas, the reaction
| (1) |
with X = X0 or X+ and XH = XH0 or XH+, initiates the formation of interstellar hydrides. This happens in diffuse clouds of initially atomic gas ( 100500 cm-3; e.g., Federman et al., 1995; Gerin et al., 2010; Neufeld et al., 2010; Sonnentrucker et al., 2010; Schilke et al., 2014), and also in dense PDRs, as demonstrated by the detection of OH, CH, CH+, SH+, OH+, and HF rotational emission lines toward the Orion Bar (Naylor et al., 2010; Goicoechea et al., 2011, 2021; Nagy et al., 2013; van der Tak et al., 2013; Joblin et al., 2018; Kavak et al., 2019).
The rate coefficient of reaction (1) greatly depends on the element X involved (see Sect. 2). If we restrict ourselves to neutral C, N, O, and S, these hydrogen abstraction reactions are very endoergic and have substantial energy barriers. When X is a cation, reaction (1) are endoergic but barrierless. The only exception is X = O+, for which the reaction is exothermic and thus fast. Indeed, OH+ is readily detected in interstellar clouds (e.g., Indriolo et al., 2015). In general, the endothermicity of these reactions ( / of several thousand kelvin) is significantly above the bulk gas temperatures in diffuse interstellar clouds ( 30100 K). In particular, the presence of CH+ and SH+ absorption lines toward these low density clouds has always been puzzling (e.g., Godard et al., 2012). Plausible explanations are the formation of these hydrides in hot gas ( 1000 K) heated by shocks (e.g., Elitzur & Watson, 1980; Pineau des Forets et al., 1986; Draine & Katz, 1986; Neufeld et al., 2002), dissipation of turbulence and ion-neutral drift (Godard et al., 2014), or triggering by the presence of hot H2 from phase mixing (Lesaffre et al., 2007; Valdivia et al., 2017). These mechanisms, however, are not relevant in dense molecular clouds and PDRs.
Reaction (1) for X = N is a very energetically unfavorable process: / 15,000 K, and it has a high barrier. Hence, this reaction is not considered to be a relevant formation pathway for NH in diffuse clouds (Godard et al., 2010), despite line absorption observations showing the presence of NH (Meyer & Roth, 1991; Crawford & Williams, 1997; Persson et al., 2010, 2012).
It has long been suggested that the presence of high densities of FUV-pumped H2 in dense PDRs enhances the reactivity of reaction (1) (Stecher & Williams, 1972; Freeman & Williams, 1982; Tielens & Hollenbach, 1985; Sternberg & Dalgarno, 1995). The prototypical example is the Orion Bar, a nearly edge-on rim of the Orion cloud (Tielens et al., 1993; Goicoechea et al., 2016). FUV-pumping in the Lyman and Werner bands of H2, followed by radiative or collisional de-excitation, populates H2 in highly vibrationally excited levels within the ground-electronic state (Black & Dalgarno, 1976; Sternberg & Dalgarno, 1989; Burton et al., 1990). Infrared ro-vibrational lines from these very excited levels are readily detected in PDRs (Kaplan et al., 2021).
In order to treat the increase in reactivity of vibrationally excited H2, early PDR models assumed state-specific rate coefficients in which the energy of each H2 vibrational state () was subtracted from the reaction endothermicity. That is, exp . However, the reactivity of reaction (1) for H is a very selective process, and the above assumption is often not realistic and can lead to uncertain predictions. Hence, an accurate estimation of hydride abundances requires one to compute the H2() level populations and to implement -state-specific rates in chemical networks (Agúndez et al., 2010). This also applies to the chemistry of irradiated protoplanetary disks (e.g., Fedele et al., 2013; Ruaud, 2021).
When laboratory measurements are not possible, state-specific reaction rate coefficients, , can be determined through ab initio calculations of the potential energy surface (PES) followed by a study of the reaction dynamics. Detailed calculations of state-specific rates of reaction (1) exist for X = C+ (Zanchet et al., 2013b), X = S+ (Zanchet et al., 2013a, 2019a), X = O+ (Gómez-Carrasco et al., 2014), X = N+, (Grozdanov et al., 2016; Gómez-Carrasco et al., 2022), X = S and SH+ (Goicoechea et al., 2021), and X = O (Veselinova et al., 2021). The above calculations contributed to explain the observed abundances of hydride molecules in interstellar and circumstellar environments. Furthermore, the formation of very reactive hydrides (most notably CH+) from hydrogen abstraction reactions involving vibrationally excited H2 also determines much of the hydride excitation (Godard & Cernicharo, 2013; Faure et al., 2017) and explains the observed extended CH+ emission from FUV-irradiated molecular cloud surfaces (Morris et al., 2016; Goicoechea et al., 2019).
Here we study the state-specific behavior of reaction
| (2) |
through dynamical (quantum and quasi-classical) calculations. Based on PDR model predictions using our new rate coefficients, we also searched for NH emission lines toward the Orion Bar and the Horsehead PDRs.
The paper is organized as follows. In Sec. 2 we briefly discuss the most salient differences of reaction (1) when X = C, N, O, and S are neutral or ionized. In Sec. 3 we focus on reaction (2) and summarize the details of our dynamical calculations to determine the state-specific reactive rate coefficients. In Sec. 4 we investigate their impact on PDR models adapted to the physical and illumination conditions in the two prototypical PDRs. Finally, in Sec. 5 we study the excitation of NH rotational lines, search for NH emission lines in submillimeter observations, and present a 3 detection toward the Orion Bar PDR.
2 Reactivity of H2 () with abundant elements
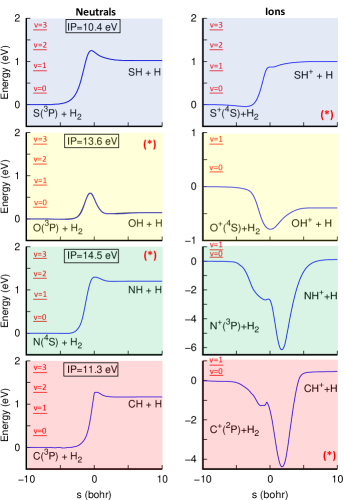
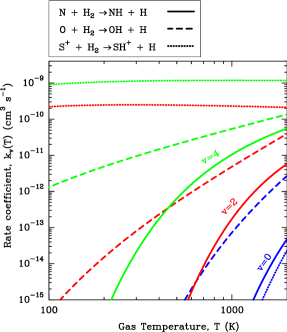
The formation rate of hydride XH through reaction (1) depends on the abundance of element X, the population of H2 in different vibrational levels, and the particular characteristics and dynamics of reaction (1). Figure 1 shows the minimum energy paths for reactions of H2 with X. To make these plots, we took the analytical PESs from different studies: S() + H2 from Maiti et al. (2004); S+() + H2 from Zanchet et al. (2019a); O() + H2 from Zanchet et al. (2019b); O+() + H2 from Martínez et al. (2004); N() + H2 from Poveda & Varandas (2005); N+() + H2 from Nyman & Wilhelmsson (1992); C(3P) + H2 from Harding et al. (1993); and C+() + H2 from Stoecklin & Halvick (2005).
In general, the endoergicity of reaction (1) depends on the relative stability of the species XH with respect to H2 (i.e., their dissociation energy). Reactions involving cations X+ present a diverse behavior: exothermic for O+, endothermic for C+ and S+, and nearly thermoneutral for N+ (although Zymak et al. (2013) report a low endothermicity of 17 meV that is still under debate). Some of these reactions present a deep insertion well (C+ and N+) and others present a shallow well (O+). However, none of them present an energy barrier, except for the one attributted to the endothermicity. The lack of energy barriers is ultimately attributed to the presence of dangling orbitals in the atomic cations. These orbitals allow for the formation of new chemical bonds before H2 bond dissociation.
Reactions involving neutral atoms, however, display a different and more homogeneous behavior. For all cases where X is in the ground electronic state, which is by far the most common situation in molecular clouds, reaction (1) is endoergic and possesses an energy barrier due to the lack of free dangling orbitals of the reactant and neutral atoms. The absence of dangling orbitals requires, first, the fragmentation of the H2 molecule and, second, the formation of the hydride bond. This gives rise to a reaction barrier222The situation is different if one considers the first excited electronic states of the following reactants: N(), O(), or S(). In these cases a deep insertion well appears, but there is no reaction barrier. Inside molecular clouds these elements are largely present in the ground state..
The presence of a well and/or a barrier along the reaction path introduces an important difference in the reaction mechanisms and, hence, in the reaction rate coefficients. For example, the presence of deep wells between the reactants leads to the formation of long-lived molecular complexes (e.g., CH) in which there is an important energy transfer among all internal degrees of freedom.
During the approach of the two reactants in a reaction with no wells, one can consider that there is no flow of energy, from vibrational or rotational, to the translation degrees of freedom. If there is no barrier, the reaction threshold opens as soon as the total energy is above the zero-point energy of the products, thus overcoming the endothermicity. However, the presence of a barrier posses constraints depending on how the energy is distributed among the degrees of freedom and on the particular location of the barrier. According to Polany’s rules for barriers at the entrance channel (early barrier), the translational energy between reactants must be above the height of the barrier to overpass it (Polanyi & Wong, 1969; Mok & Polanyi, 1969). However, when the barrier is located in the products channel (late barrier), then the vibrational energy has to be higher than the reaction path333These are qualitative arguments that depend on the involved masses and not all can be extrapolated to polyatomic systems. For that purpose, Guo & Jiang (2014) developed a semi-quantitative model, the “sudden vector projection model,” which should be considered as approximate since the problem is generally more complex..
3 Ab initio study of reaction N() + H2() NH + H
In this section we describe our study of reaction (2) and we determine the state-specific rate coefficients up to = 12. We also compare the rates of analogous reactions having a different heavy element atom as reactant.
Figure 1 shows that reaction (2) is very endoergic when H2 in the ground vibrational state ( = 0). However, the reaction becomes exoergic for H2 ( 3). Here we compute the state-specific reaction rates from accurate quantum dynamics calculations employing a wave packet method for H2( 7). For H2( 7), quantum calculations become computationally demanding and we employ a quasi-classical trajectory method (QCT), which is a classical method that uses quantum initial conditions. These kinds of reaction dynamics studies require an accurate PES. Here we use the PES determined by Poveda & Varandas (2005) from very accurate ab initio calculations of the ground adiabatic electronic state.
3.1 Quantum and quasi-classical calculations
Following our previous studies, we used the quantum wave packet method implemented in the MADWAVE3 package (Roncero, 2021; Gómez-Carrasco & Roncero, 2006; Zanchet et al., 2009). We used reactant Jacobi coordinates and determined the state-to-state reaction probabilities for each calculated angular momentum (Gómez-Carrasco & Roncero, 2006). Table1 lists the parameters used in the calculations. We performed these calculations for total angular momentum ( ) and parity () under the inversion of coordinates, extracting the total reaction probability, . The total integral cross section for reaction N + H2(, =0) NH + H was then obtained from the following usual partial wave expression:
| (3) |
where is the initial rotational state of H2 (here we adopt = 0), is the translational energy, and , and is the reduced mass of the N + H2 system.
| , 0.1, 24 Å | =320 |
| = 11 Å | |
| , 0.001, 24Å | =512 |
| = 11 Å | |
| = 140 | in |
| = 10 Å | = 1,0.4 eV |
| = 4 Å |
We calculated the reaction probabilities for = 0, 10, … , 80. We employed the -shifting-interpolation and extrapolation method (Aslan et al., 2012) to obtain the reaction probabilities of the intermediate values by evaluating the total integral reactive cross section using the partial wave expansion up to =80. Finally, we determined the state-specific reaction rate coefficients by numerical integration of the cross section with a Boltzmann distribution for the translational energy (Zanchet et al., 2013b; Gómez-Carrasco et al., 2014). That is to say,
| (4) |
where is the electronic partition function.
For H2(), we performed quasi-classical calculations using the MDwQT code (Sanz-Sanz et al., 2015; Zanchet et al., 2016; Ocaña et al., 2017). We sampled the initial conditions with the usual Monte Carlo method (Karplus et al., 1965). For each vibrational state of H2, the initial internuclear distance and velocity distributions were obtained with the adiabatic switching method (Grozdanov & Solov’ev, 1982; Qu & Bowman, 2016; Nagy & Lendvay, 2017). The initial rotational state of H2 was set to zero. The distance between N and H2 center of mass was initially set to 50 bohr, and we stopped the trajectories when the internuclear distance was longer than 60 bohr. The initial impact partameter was sampled between 0 an 15 bohr, according to a quadratic distribution. For each translational temperature, we ran between 2104 and 105 trajectories for each and . The lower temperatures ( 100 K) and vibrational states = 7 and 8 require the largest number of trajectories. We determined the QCT state-specific rate coefficients as follows:
| (5) |
where is the maximum impact parameter and is the reaction probability at a constant temperature.
3.2 State-specific reaction rates and discussion
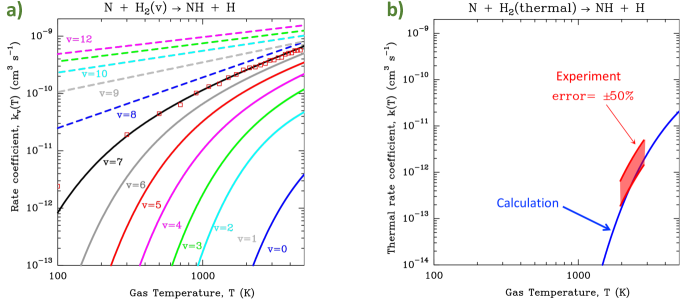
Figure 2 shows the calculated state-specific rate coefficients from = 0 to 12. Continuous curves show the quantum calculations and dashed lines show the QCT calculations. We specifically compared the quantum (curves) and classical (red squares) rate coefficients for H2( = 7). They show very good agreement except at 100 K, at which the reaction probability is very low and thus the statistical error is large. This supports the validity of the QCT rates obtained for 7. The right panel of Fig. 2 shows the resulting thermal rate coefficient computed as the Boltzmann average of the individual state-specific coefficients:
| (6) |
Most astrochemical models use . This is the rate coefficient commonly provided by theorists and experimentalists. At low temperatures ( ), in most interstellar applications, the thermal rate coefficient is roughly that of H2 in the ground vibrational state: (Agúndez et al., 2010). Figure 2 also shows the available experimental rate coefficient of reaction (2) in the temperature range = 1950-2850 K (Davidson & Hanson, 1990). For 2300 K, our calculated thermal rate coefficient lies within the relatively large experimental error of the laboratory measurement (red shaded area). For 2300 K, our calculated rate is slightly below the experimental error. We attribute these slight differences to the fact that we neglect the rotational levels in the Boltzmann average. Still, we are confident that the overall good agreement validates the results of our calculations.
| (eV) | (cm3 s-1) | (K) | ||
|---|---|---|---|---|
| 0 | 0.270 | 0.721 10-10 | 0.000 | 14629.000 |
| 1 | 0.784 | 1.631 10-10 | 0.000 | 10161.600 |
| 2 | 1.270 | 1.922 10-10 | 0.000 | 7005.160 |
| 3 | 1.727 | 0.501 10-10 | 0.596 | 4078.190 |
| 4 | 2.156 | 0.410 10-10 | 0.758 | 2273.080 |
| 5 | 2.557 | 0.537 10-10 | 0.766 | 1420.000 |
| 6 | 2.931 | 0.534 10-10 | 0.856 | 817.174 |
| 7 | 3.275 | 0.501 10-10 | 0.943 | 305.879 |
| 8 | 3.599 | 6.581 10-11 | 0.885 | 0.000 |
| 9 | 3.884 | 1.873 10-10 | 0.520 | 0.000 |
| 10 | 4.134 | 3.516 10-10 | 0.380 | 0.000 |
| 11 | 4.349 | 5.132 10-10 | 0.317 | 0.000 |
| 12 | 4.523 | 6.757 10-10 | 0.295 | 0.000 |
| thermal | 5.000 10-10 | 0.000 | 15900.000 |
Table 2 lists the obtained state-specific reaction rate coefficients fitted by the usual Arrhenius-like form . We note that these rate coefficients increase with temperature and with the initial H2 vibrational level . For H2( 3), the reaction becomes exoergic, but the reaction rate still behaves as if it has an energy threshold due to the location of the energy barrier in the PES.
Figure 3 (second panel from the bottom) shows the PES of a colinear H-H-N configuration as a function of the Jacobi distances , the distance between the N and the H2 center-of-mass (whose derivative is proportional to the initial translational velocity), and also as a function of , the H2 internuclear distance, thus associated with the vibrational energy. In this plot, the top of the barrier is along the thick black arrow, which is a graphical approximation of the reactive coordinate at the saddle point.
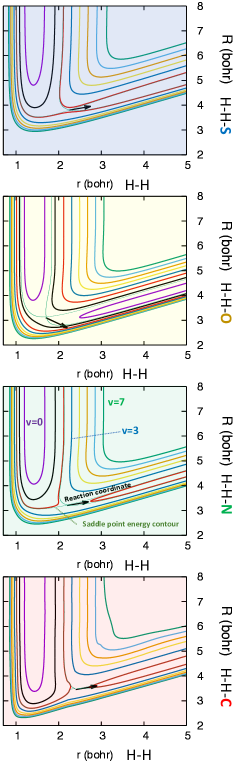
This saddle point corresponds to a long distance, that is to say a late barrier. This means that in order to overcome the energy barrier, some vibrational energy needs to be given to the coordinate. The forth blue contour plot corresponds to the energy of H2( = 3) and it is open, thus connecting reactants and products. Interestingly, one would expect that for H2( = 3), the reaction becomes exoergic without any threshold. However, this is not the case because the direction of the reaction coordinate at the top of the barrier is only approximately parallel to the arrow (Figure 3). With an arrow parallel to the axis, the slope to overpass the barrier would have been along the coordinate, and the reaction with H2( = 3) would be roughly exoergic. However, the arrow has a non-negligle contribution along the coordinate. Hence, some energy must be given to the system along this coordinate initially (i.e., translational energy) to overcome the barrier. This late energy barrier implies that the reaction rate coefficients are very small at low temperatures but increase with and with the vibrational state even for very high- H2 levels.
3.2.1 Comparison with analogous reactions
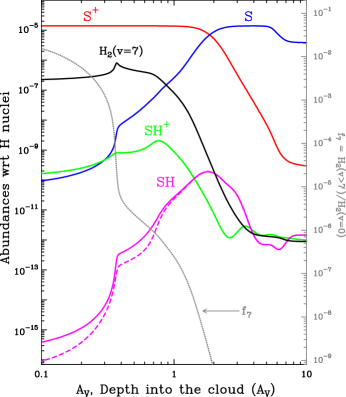
Figure 3 summarizes the qualitatively similar PESs of reactions between neutral atomic N, S, C, and O and vibrationally excited H2. These reactions show a similar behavior, all being endothermic with a late barrier and no well. The moderate increase in the state-specific rate coefficients with and temperature is produced by the presence of these barriers. On the other hand, endothermic hydrogen abstraction reactions involving N+, S+, and C+, thus lacking energy barriers, behave differently. For example, reaction S+ + H2() SH+ + H (Fig. 1) becomes exoergic for 2 and its associated rate coefficients do not show any threshold for 2 (Zanchet et al., 2019a). That is, they do not vary with temperature much. Figure 4 explicitly compares the = 0, 2, and 4 state-specific rate coefficients of reactions between H2() and N(), S+(), and O() (the latter is from Veselinova et al., 2021). As expected, the rate coefficients of reaction S+ + H2() for 2 are nearly independent of temperature. However, the rate coefficients of reaction O + H2() still increase with . A relevant difference between hydrogen abstraction reactions with O and N is the lower height of the energy barrier for reaction O() + H2(). This translates into higher rate coefficients for the lower– H2 vibrational states, and thus a stronger dependence on the production of interstellar OH, compared to NH, with gas temperature (Veselinova et al., 2021). As we demonstrate in the next section, the formation of abundant NH specifically requires FUV-pumped H2 and the subsequent population of highly excited levels. These processes take place at the irradiated surface of PDRs where elements with IP IP(H), such as O and N, are in predominantly neutral form. On the other hand, reactions of neutral atomic carbon and sulfur with vibrationally excited H2 are less important because neutral atomic C and S only become abundant deeper inside the PDR, where the FUV radiation field is more attenuated and the fraction of H2 in vibrationally excited states drastically decreases. For comparison purposes, in Appendix A we calculate QCT state-specific rate coefficients of the analogous reaction S() + H2( = 0-12) SH + H2 (see Table 5). Despite the similar behavior of the rate coefficients of reactions N() + H2() and S() + H2(), the impact of the latter ones on the formation of SH radicals is very minor. The difference arises from the fact the S+ ions, and not S atoms, are the dominant sulfur reservoir in the PDR layers where vibrationally excited H2 is abundant (see Fig. 11).
4 Effects of the state-specific rates on the NH abundance in FUV-irradiated gas
Dense PDRs contain enhanced densities of FUV-pumped H2. Infrared observations of the Orion Bar show the presence of H2 ro-vibrational emission lines from excited levels up to = 12 (e.g., Kaplan et al., 2021). The relative populations of these highly excited levels depart from thermal (purely collisional) excitation. Here we study the reactivity of highly vibrationally excited H2 with N atoms in illumination conditions appropriate to two iconic PDRs, the Orion Bar and the rim of the Horsehead nebula. Their impinging FUV radiation fields are 2104 (Marconi et al., 1998) and 100 (Abergel et al., 2002), respectively.
| Model parameter | Orion Bar | Horsehead |
|---|---|---|
| FUV radiation field, | 2104 Habing (a) | 100 Habing (b) |
| Thermal pressure | 2108 cm-3K (c) | 4106 cm-3K (d) |
| = (H) + 2(H2) | = | |
| Cosmic Ray | 10-16 H2 s-1 | |
| = / | 5.5 (e) | |
| Abundance O / H | 3.210-4 (f) | |
| Abundance C / H | 1.410-4 (g) | |
| Abundance N / H | 7.510-5 (h) | |
| Abundance S / H | 1.410-5 (i) | |
To model the nitrogen chemistry in these two PDRs, we used the Meudon PDR code (Le Petit et al., 2006). We implemented the state-specific rates of reaction (2) calculated in Sect. 3 up to H2 (). In addition, we updated the rate coefficient of the destruction reaction NH + H N + H2 (relevant in PDRs due to the enhanced abundance of hydrogen atoms). We adopted the rate coefficient computed by Han et al. (2010), which is consistent with laboratory experiments of Adam et al. (2005). Our models also include specific reactions of H2 and H2 with N+ ions, for which we computed the H2 ortho-to-para (OTP) ratio at each cloud depth. We adopted the rate coefficients fitted from low-temperature ion trap experiments of Zymak et al. (2013). The reaction N+ + H2 is thought to initiate555The rate coefficient of reaction N+() + H2() NH+ + H depends on the H2() rotational level population (i.e., on the OTP ratio). At low temperatures, reactions with -H2 are faster (e.g., Marquette et al., 1988; Zymak et al., 2013), but -H2 is also less abundant. In our models, we ignore the different reactivities of N+ in its three fine structure levels (separated by / = 70 K and 188 K, respectively). Zymak et al. (2013) derived the rate coefficients considering that only the three lower spin-orbit states contribute to the reaction and that the highest excited N+ fine-structure state is not reactive (adiabatic behavior). Such an approximation changes the determination of the reaction rate coefficients for -H2 and -H2, especially at low temperatures. Recent quantum calculations including transitions among all spin-orbit states find that the reactivity of the state is not zero (Gómez-Carrasco et al., 2022). This implies a slight reduction in the rate coefficients for -H2, especially at low temperatures. This agrees with new experimental results of Fanghaenel (2018), which take the contribution of the state into account. the nitrogen chemistry in cold gas shielded from FUV radiation (e.g., Le Bourlot, 1991; Dislaire et al., 2012). The PDR model performs a detailed treatment of the H2 FUV-pumping and vibrational excitation as well as of the penetration of FUV radiation into the cloud (Goicoechea & Le Bourlot, 2007). Since we are mainly interested in the most irradiated outer layers of the PDR, where H2 molecules are effectively pumped by FUV photons, our models only include gas-phase chemistry (except for H2 formation; Bron et al., 2014). Following our previous studies, we use a constant thermal pressure ( = ). Table 4 summarizes the main parameters and gas-phase abundances adopted in our models.
4.1 Strongly FUV-irradiated gas: The Orion Bar PDR case
Figure 5 dissects the physical structure of the Orion Bar model as a function of cloud depth (along the illumination direction and in magnitudes of visual extinction, ). Figure 5 shows the decreasing gas temperature and increasing H2 density gradient from the PDR edge to the more FUV-shielded cloud interior. It is important to note that H2 molecules are efficiently photodissociated at the irradiated PDR surface ( 1 mag). In these hot gas layers, the abundance of H atoms is higher than that of H2. However, a significant fraction of the existing H2 is in highly excited vibrational states (shown in Fig. 5). In particular, the fractional abundance of H2 molecules in states () with respect to those in the ground reaches 3%. On the other hand, beyond 2 mag, most hydrogen is in a molecular form, but becomes negligible and the fractional abundance of H2 in vibrationally excited states ((H2 1) / ) sharply declines below 10-8. Therefore, we expect that any enhanced formation of XH hydrides through reactions of X with highly vibrationally excited H2 will take place in these 2 mag surface layers.
Figure 5 shows , the contribution of each H2 vibrational state to the N + H2() rate coefficient, as a function of cloud depth. Here is the fractional population of H2 in the vibrational level . This plot demonstrates that the formation of NH radicals through reaction (2) is dominated by H2 in highly vibrationally excited states ( 7). To visualize the impact of the state-specific rate coefficients of reaction (2), Fig. 5 shows the resulting NH abundance profile ((NH) = (NH) / ; blue curves, right axis) and the total N + H2 rate coefficient (black curves, left axis). Continuous curves refer to a PDR model that includes state-specific rate coefficients, whereas the dashed curves show a model that uses the thermal rate. Any difference between the continuous and dashed curves is produced by the nonthermal populations of the highly vibrationally excited levels of H2.
Remarkable differences appear even at the PDR surface ( 0.1 mag), where the fraction of H2 molecules in highly vibrationally states is large. These still semi-atomic ((H) / (H2) 1) hot gas layers show (NH) abundances about two orders of magnitude higher than the predictions of the model that uses the thermal rate coefficient. The enhancement of the NH abundance is very large even in hot gas ( 2000 K in this model) because NH formation is driven by the highly excited vibrationally H2 states that cannot be thermally populated.
The predicted NH abundance peak, (NH) 4 10-9, is located at 0.8 mag. Beyond 2 mag, the amount of H2 in vibrationally excited states sharply declines and both models predict the same NH abundance. The inclusion of state-specific rates for reaction (2) increases the total NH column density (integrated from = 0 to 10 mag) by at factor of 25, from (NH) = 2.11011 cm-2 to 5.51012 cm-2. According to these models, most of the NH column density is located close to the PDR surface, between 0.5 and 2 mag.
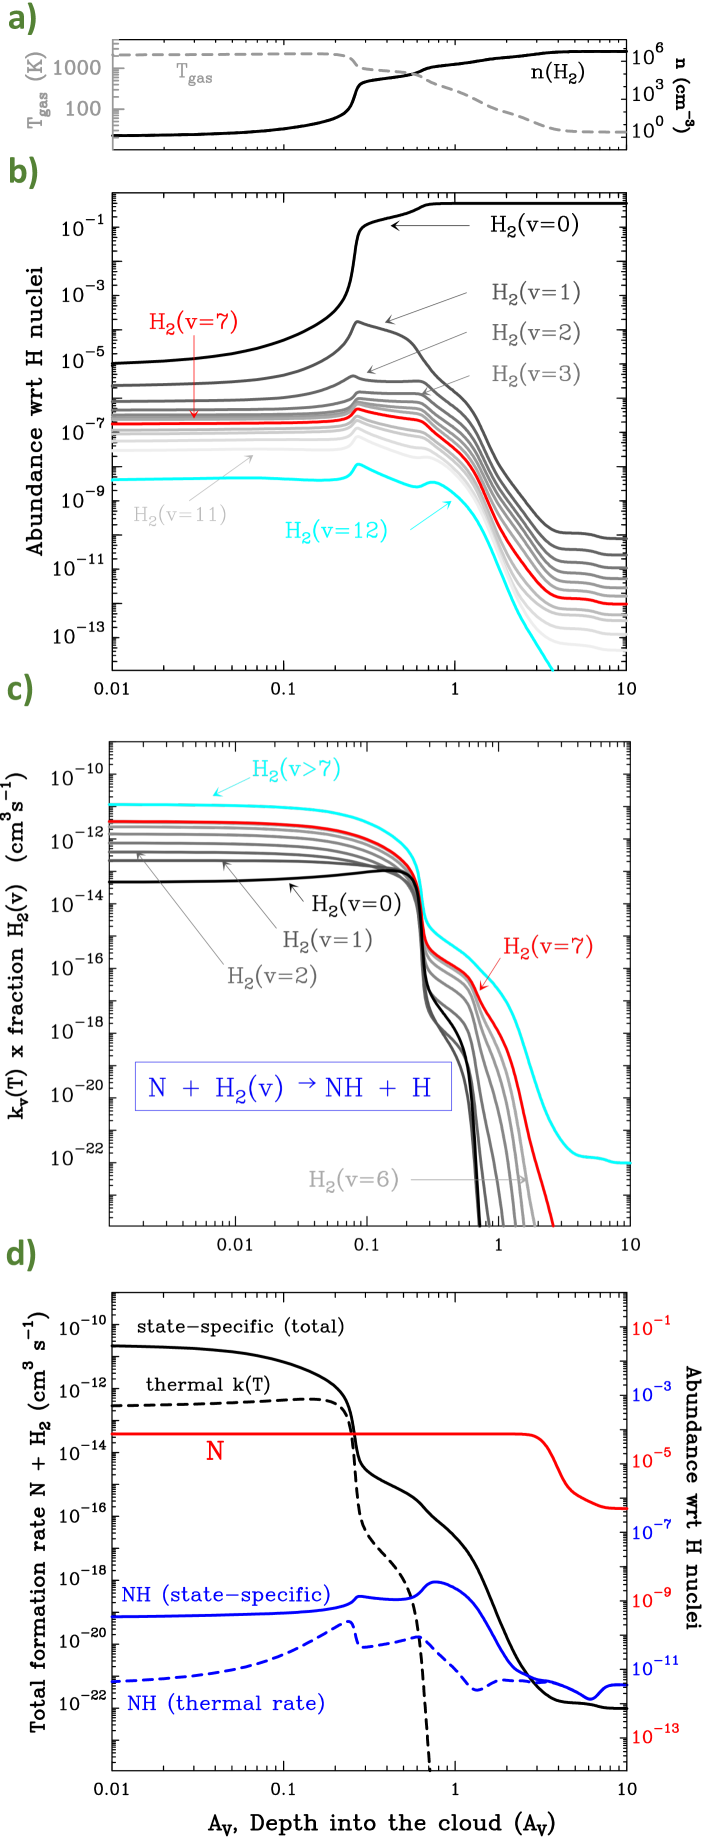
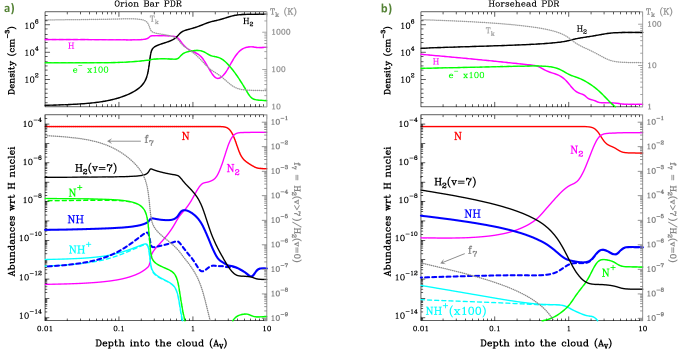
Figure 6 shows the predicted (N), (N2), (NH), (N+), (NH+), and (H2 ( = 7)) abundance profiles, and the fraction of H2 in 7 states (). Owing to the high ionization potential of neutral N atoms, IP(N) IP(H), neutral N atoms are the major nitrogen reservoir at the PDR surface and up to 4 mag. In the most irradiated PDR layers, even if the abundance of H2 with respect to H nuclei is still low, NH readily forms by reactions of N with highly vibrationally excited H2 (which is the main destruction pathway of N in these layers). Destruction of NH is initially driven by reactive collisions with abundant H atoms (NH + H N + H2). At the NH abundance peak, the density of H atoms decreases (upper panel of Fig. 6), but the FUV radiation field is still high. Hence, photodissociation dominates NH destruction. This happens because NH does not easily react with H2. Indeed, reaction NH + H2 NH2 + H is endothermic and possesses a high activation barrier, / 5700 K (Linder et al., 1995). Although NH2 is not detected in the Bar, the role of the above reaction might be more relevant for FUV-pumped H2. However, state-specific reaction rates have not been computed yet.
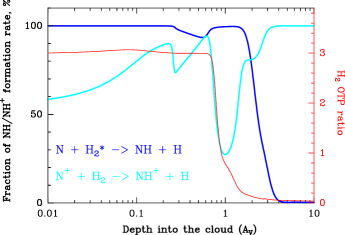
Beyond the NH abundance peak, at 2 mag, most H2 is in the lowest-energy vibrational states and NH formation through reaction (2) becomes negligible (see the evolution of the total formation rate in Fig. 5). At this point, other chemical reactions – notably those initiated by the hydrogen abstraction reactions N+ NH+ NH NH and finishing with the dissociative recombination of NH and NH ions – dominate the production of NH (e.g., Boger & Sternberg, 2005; Dislaire et al., 2012). In the Orion Bar model, the number of N+ ions is controlled by the photodissociation of N-bearing ions (such as NO+ and NH+) at the PDR edge, and by the cosmic-ray ionization rate at large cloud depths (through direct ionizations of N atoms and through reactions of N2 with He+). Figure 7 shows the contribution (in percent) of reactions N + H2() and N+ + /-H2 to the total formation rate of NH and NH+, respectively. At the PDR edge, 2 mag, the production of NH is almost entirely dominated by reaction N + H2(). The reaction N+ + H2 and NH photoionization contribute to the production of NH+. However, due to the lower abundance of N+ ions compared to that of neutral N atoms, the NH / NH+ column density ratio is significantly above one. Deeper inside the cloud, as FUV radiation decreases, N2 becomes the main nitrogen reservoir (at 4 mag in this model). Here, the nitrogen chemistry is initiated by reactions of N+ with H2, which is sensitive to the H2 OTP ratio (red curve in Fig. 7). At larger , grain chemistry associated with the formation and desorption of ammonia ice (Knacke et al., 1982; Wagenblast et al., 1993) may alter the dominant formation and destruction pathways of NH.
4.2 Mildly FUV-illuminated gas: The Horsehead PDR case
Figure 6 shows the abundance profiles predicted by our model of the Horsehead PDR (less intense FUV field and lower gas density). Only at the PDR surface (AV 0.5 mag) is the abundance of H2 (with respect to H nuclei) in highly vibrationally excited states large enough, with (H2, =7) 5 10-10 at 0.5 mag (versus 3 10-7 in the Bar). In addition, the fraction of H2 in highly vibrationally excited levels is lower: 2 10-9 at 0.5 mag versus 10-6 in the Orion Bar. The higher (NH) abundance at the very surface of the Horsehead PDR compared to that in the Bar is a consequence of the lower density of H atoms and lower flux of FUV photons (i.e., lower NH destruction rate).
With respect to the nitrogen chemistry, the use of state-specific rates for reaction (2) does increase the production of NH by two orders of magnitude at the Horsehead surface. However, the enhancement factor quickly decreases deeper inside the PDR because the abundance of H2 ( ) diminishes with being steeper than in a strongly irradiated dense PDR, such as the Bar. The total NH column density predicted by the Horsehead model, integrated from = 0 to 10 mag, is (NH) = 1.21012 cm-2 (i.e., 4.5 times lower than in the Orion Bar). Compared to the Bar, the edge of Horsehead has lower abundances of N+ ions, which are solely formed by cosmic-ray ionization of N atoms and not by the photoionization of N-bearing molecular ions (their abundances are very low). On the other hand, the abundance of N+ at large is higher in the Horsehead PDR than in the Orion Bar (where the gas is warmer, (H2) is higher, and thus N+ ions are more easily destroyed).
5 Detectability of submillimeter NH emission lines
In this section we study the excitation and detectability of NH rotational lines in dense PDRs. We also explore existing high-spectral resolution submillimeter observations of the Orion Bar and Horsehead and search for NH emission lines.
The electronic ground state of the NH radical is . Hence, rotational levels with show a triplet fine structure arrangement (for an energy diagram, see Klaus et al., 1997). In addition, the = 0.5 and = 1 nuclear spins lead to a hyperfine splitting of the fine structure levels. Being a light molecule, the lowest-energy rotational lines ( = ) appear in the high-frequency submillimeter domain, at 946 GHz (), 974 GHz (), and 1000 GHz (). High resolution heterodyne observations allow one to detect and spectrally resolve some of these NH hyperfine structure (HFS) lines (Persson et al., 2010, 2012). Unfortunately, telluric absorption precludes the observation of theses lines from ground-based telescopes.
5.1 Subthermal NH emission in PDRs
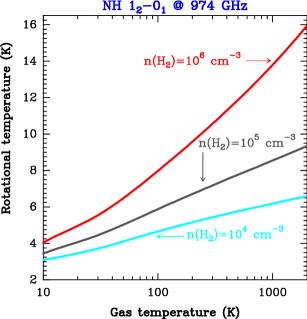
Inelastic collisions populate the rotationally excited molecular levels in dense molecular gas. However, NH is a hydride molecule with a large rotational constant and high spontaneous radiative decay rates, ( = ) several 10-3 s-1. This is about 105 times larger than those of the widely observed CO = line. This means that the gas density at which the inelastic collision de-excitation rate coefficients ( in cm3 s-1) equal the spontaneous radiative emission rate – the so-called critical density = / ( of a given rotational transition – is much higher than the gas density of the medium. For NH, ( = ) 109 cm-3. This implies that even in dense molecular clouds ( 104 cm-3), NH rotational lines will be weakly (subthermally) excited666To estimate the NH–H2 and NH–H inelastic collision rate coefficients, we simply scaled the available fine-structure-resolved NH–He rate coefficients (computed by Toboła et al. (2011) up to level = 8 and = 350 K) by the square root of the reduced mass ratio. We also extrapolated them to higher temperatures.. In other words, results in . Together with the intricate NH HFS spectrum (the rotational partition function of NH at 150 K is 15 times larger than that of CH+), this means that, unless exceptionally abundant, interstellar NH emission lines will be faint.
Figure 8 shows the rotational temperature of the NH fine-structure line (974 GHz) as a function of gas temperature for different H2 densities. These curves are “single-slab” model results obtained from detailed nonlocal thermodynamic equilibrium (LTE) excitation calculations5 using a Monte Carlo code (Goicoechea et al., 2022, and references therein). They refer to optically thin NH line emission. The inspection of Fig. 8 shows that one can expect (974 GHz) 10–15 K in the NH emitting layers of the Bar (a hot and dense PDR; Fig. 6a) and (974 GHz) 4-6 K in the cooler lower density Horsehead (Fig. 6b).
5.2 3 detection of NH in the Orion Bar PDR
The Orion Bar and Horsehead were observed at the frequencies of NH ( = ) lines with the HIFI receiver (de Graauw et al., 2010) on board Herschel. These observations are part of the HEXOS (PI. E. A. Bergin) and WADI (PI. V. Ossenkopf) guaranteed time key programs777The NH lines at 946 GHz appear in HIFI band 3b (observed in the Bar [ObsID 1342216380]). The NH lines at 974 GHz appear in HIFI band 4a (observed in the Bar [ObsID 1342218628] and in the Horsehead PDR [ObsID 1342218215]). The NH lines at 1000 GHz appear in HIFI band 4a (observed in the Orion Bar [ObsID 1342218628]).. The Orion Bar data belong to a fully calibrated line survey (Nagy et al., 2017). The Horsehead data belong to a deeper search of hydride molecules. These HIFI spectra around the NH ( = ) lines have not been discussed in the literature. In principle, the spectral resolution (1.1 MHz or 0.3 km s-1 at these frequencies) is high enough to resolve several HFS lines888We took the hyperfine levels and spectroscopic information tabulated in the Cologne Database for Molecular Spectroscopy (CDMS; Endres et al., 2016). These data contain various experimental spectra (Klaus et al., 1997; Flores-Mijangos et al., 2004; Lewen et al., 2004). of the three fine structure transitions (946 GHz), (974 GHz), and (1000 GHz).
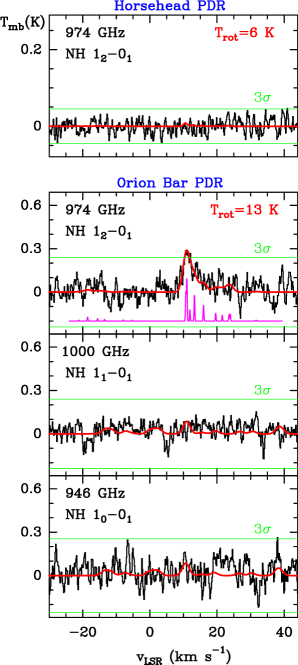
The Orion Bar: Fig. 9 shows HIFI observations of the Bar. The root mean square (rms) noise of these spectra is 80-90 mK per velocity channel. The 974 GHz spectra show an emission feature above the 3 noise level that matches the velocity of the molecular emission in the Orion Bar (vLSR 10.7 km s-1; e.g., Cuadrado et al., 2015) if the feature is at 974.479 GHz. This is exactly the frequency of the brightest , (974478.38 MHz) and , (974479.34 MHz) HFS components of the transition999We searched for other possible molecular carriers of this feature. The HCN = 1110 line is at 974487.20 GHz (at only 2.5 km s-1 of the observed emission). However, the lower excitation and lower frequency lines HCN = 109 and 98 are not detected (Nagy et al., 2017). Hence, the = 11-10 line cannot be responsible for this feature. . The gas velocity dispersion in the Orion Bar is such that the molecular emission observed by single-dish telescopes shows typical line widths of 3 km s-1 (e.g., Cuadrado et al., 2015; Nagy et al., 2017). This implies that the width and shape of the observed feature is a blend of several HFS lines (individually shown by the pink spectra in the 974 GHz panel of Fig. 9).
We modeled the NH HFS spectrum of the Orion Bar adopting = 13 K and a nonthermal gas velocity dispersion of = 1 km s-1 ( = 2.355). We reproduced the amplitude of the observed feature at 974 GHz with (NH) = 1.31013 cm-2. The red curve in Fig. 9 shows the resulting synthetic NH spectra. Given the low signal-to-noise ratio101010In terms of the integrated line intensity, the detection significance of the 974.479 GHz feature over a 10 km s-1 wide window is 5. (S/N) of the data, the model is also consistent with the nondetection of the fainter (946 GHz) and (1000 GHz) HFS lines. The data do not show any features at the frequency (1012 GHz) of the NH+ line either.
Horsehead: The upper panel of Fig. 9 shows HIFI observations at 974 GHz. Despite this spectrum having a higher sensitivity (rms of 15 mK per channel) than that of the Bar, it does not show any emission features above 3. We created a synthetic spectrum adopting (NH) 1.31013 cm-2, = 6 K, and = 0.4 km s-1, consistent with the typical line width of molecular lines in the Horsehead PDR (v 1 km s-1; e.g., Pety et al., 2012). Because of the lower rotational temperatures, the (974 GHz) emission lines will be much fainter in the Horsehead PDR, below the sensitivity achieved in these observations. Hence, the (NH) adopted in the radiative transfer model just reflects an upper limit value in the Horsehead PDR.
6 Discussion
In order to take into account the predicted gradients of the NH emitting layers in a PDR, here we use the full cloud-depth dependent (H), (H2), , and (NH) profiles of the PDR model calculation (Fig. 6) as inputs of a non-LTE radiative transfer multislab model of NH rotational lines. Table 11 shows the total NH column density of each PDR model as well as the resulting NH 12-01 line intensity (integrating from = 0 to 10 mag).
As anticipated, the predicted NH emission in the Horsehead PDR is below the sensitivity reached by Herschel observations. For the Orion Bar, only the PDR model including state-specific reaction rate coefficients is consistent with the observed level of NH emission, especially if one considers that the PDR is not completely edge-on and one allows for a small tilt angle of 20o with respect to a fully edge-on geometry (Jansen et al., 1995; Melnick et al., 2012; Andree-Labsch et al., 2017). This geometry implies that optically thin lines are limb-brightened, with an intensity enhancement of sin-1 with respect to a face-on PDR. The NH emission detected in the Bar is consistent with its formation by gas-phase reactions of N atoms with highly vibrationally excited H2 at the PDR surface and producing (NH) 1013 cm-2. Compared to other PDRs, the higher gas density in the Bar contributes to a more efficient collisional excitation of submillimeter NH rotational lines, thus leading to detectable emission lines. The nondetection of NH+, however, is consistent with the low column density predicted by PDR models, that is to say (NH+) of several 1010 cm-2.
| Input | (NH) (cm-2) | |
| PDR model | Orion Bar | Horsehead |
| () | ||
| Input | W(NH at 974 GHz) (mK km s-1) | |
| PDR model | Orion Bar | Horsehead |
| 5 | 11(a) | |
| () | 290 | 17(a) |
| Observations | 700 | 25 |
Our study implies that the detection of NH emission in PDRs traces strongly FUV-irradiated dense gas121212Submillimeter NH lines are also detected in absorption toward the dust continuum emitted by massive (Fuente et al., 2010; Bruderer et al., 2010; Benz et al., 2010) and low-mass (Hily-Blant et al., 2010; Bacmann et al., 2010) star-forming cores. These detections refer to lower density ( 104 cm-3) and cold ( = 10-20 K) envelopes of gas shielded from strong FUV fields (i.e., negligible abundances of vibrationally excited H2) and the nitrogen chemistry is initiated by reaction N+ + /–H2 (e.g., Dislaire et al., 2012; Le Gal et al., 2014).. Protostellar cores such as OMC-2 FIR 4 (Kama et al., 2013), the Orion hot core (Crockett et al., 2014), or Orion South (Tahani et al., 2016) do not show NH emission lines. Interestingly, bright NH submillimeter and far-IR lines have been reported in the circumstellar envelope around the eruptive massive binary system Carinae (Morris et al., 2020; Gull et al., 2020). This unusual nitrogen-rich gas environment ((NH) = 51015 cm-2; Gull et al., 2020) is strongly illuminated by X-ray and FUV radiation emitted by the central massive hot evolved stars. We suspect that much of the NH formation in this complex environment is driven by reactions of overabundant N atoms with highly vibrationally excited H2.
7 Summary and conclusion
Hydrogen abstraction reactions X + H2( = 0) XH + H involving neutral atoms such as O, C, S, and N are very endoergic and have substantial energy barriers. This implies that even their H2() vibrational state-dependent reaction rate coefficients rise with an increasing level and gas temperature.
Due to its high ionization potential, neutral N atoms constitute the initial reservoir of available gas-phase nitrogen in FUV-illuminated environments. We calculated the state-specific rate coefficients of reaction for H2 in vibrationally excited levels up to = 12. The newly computed rate coefficients imply that reactions of N atoms with highly vibrational excited H2 molecules (after FUV-pumping) enhance the formation of NH in strongly irradiated dense PDRs. For the Orion Bar conditions, we find a total NH column density enhancement of a factor 25 with respect to models that use the thermal rate coefficient. We predict that most of the NH column density in the Orion Bar arises from the PDR surface, between 0.5 and 2 mag, where reactions of N atoms and H2 molecules in 7 vibrational levels dominate the formation of NH radicals. Prompted by this result we searched for NH emission lines in the Herschel/HIFI spectra of the Orion Bar and Horsehead PDRs. Only toward the Bar we do report a 3 emission feature at the 974.479 GHz frequency of the NH line. This emission level implies a NH column density of about 1013 cm-2, which can only be matched by PDR models using the newly computed state-specific rate coefficients.
Owing to very subthermal excitation and endoergic formation, the rare detection of submillimeter NH emission lines seems associated with strongly FUV-irradiated dense gas. In addition to the Orion Bar, another likely candidate is the circumstellar environment around Carinae, where particularly bright NH emission lines have been detected (Morris et al., 2020; Gull et al., 2020). JWST will soon detect the infrared H2 emission from highly vibrationally excited levels in many FUV-irradiated environments. This will be a unique opportunity to quantify their populations and role in interstellar and circumstellar chemistry.
Acknowledgements.
We thank Antonio J. C. Varandas (N + H2), George C. Schatz (C + H2), Gyorgy Lendvay (S + H2), Alex Zanchet (O + H2), Gunnar Nyman (N+ + H2), Philipe Halvick (C+ + H2), and Miguel González (O+ + H2) for providing the potential energy surfaces of the reactions in parenthesis. We warmly thank David Teyssier for providing the HIFI spectrum of the Horsehead PDR around 974 GHz and Franck Le Petit and Emeric Bron for useful discussions about vibrationally excited H2. We thank the referee for concise but useful suggestions. JRG thanks the Observatoire de Paris (LERMA) for hosting him when this manuscript was written. We thank the Spanish MCINN for funding support under grants PID2019-106110GB-I00 and PID2021-122549NB-C21.References
- Abergel et al. (2002) Abergel, A., Bernard, J. P., Boulanger, F., et al. 2002, A&A, 389, 239
- Adam et al. (2005) Adam, L., Hack, W., Zhu, H., Qu, Z. W., & Schinke, R. 2005, J. Chem. Phys., 122, 114301
- Agúndez et al. (2010) Agúndez, M., Goicoechea, J. R., Cernicharo, J., Faure, A., & Roueff, E. 2010, ApJ, 713, 662
- Andree-Labsch et al. (2017) Andree-Labsch, S., Ossenkopf-Okada, V., & Röllig, M. 2017, A&A, 598, A2
- Aslan et al. (2012) Aslan, E., Bulut, N., Castillo, J. F., et al. 2012, Astrophys. J., 739, 31
- Bacmann et al. (2010) Bacmann, A., Caux, E., Hily-Blant, P., et al. 2010, A&A, 521, L42
- Benz et al. (2010) Benz, A. O., Bruderer, S., van Dishoeck, E. F., et al. 2010, A&A, 521, L35
- Black & Dalgarno (1976) Black, J. H. & Dalgarno, A. 1976, ApJ, 203, 132
- Boger & Sternberg (2005) Boger, G. I. & Sternberg, A. 2005, ApJ, 632, 302
- Bron et al. (2014) Bron, E., Le Bourlot, J., & Le Petit, F. 2014, A&A, 569, A100
- Bruderer et al. (2010) Bruderer, S., Benz, A. O., van Dishoeck, E. F., et al. 2010, A&A, 521, L44
- Burton et al. (1990) Burton, M. G., Hollenbach, D. J., & Tielens, A. G. G. M. 1990, ApJ, 365, 620
- Cardelli et al. (1989) Cardelli, J. A., Clayton, G. C., & Mathis, J. S. 1989, ApJ, 345, 245
- Crawford & Williams (1997) Crawford, I. A. & Williams, D. A. 1997, MNRAS, 291, L53
- Crockett et al. (2014) Crockett, N. R., Bergin, E. A., Neill, J. L., et al. 2014, ApJ, 781, 114
- Cuadrado et al. (2015) Cuadrado, S., Goicoechea, J. R., Pilleri, P., et al. 2015, A&A, 575, A82
- Davidson & Hanson (1990) Davidson, D. & Hanson, R. 1990, International Journal of Chemical Kinetics, 22, 843
- de Graauw et al. (2010) de Graauw, T., Helmich, F. P., Phillips, T. G., et al. 2010, A&A, 518, L6
- Dislaire et al. (2012) Dislaire, V., Hily-Blant, P., Faure, A., et al. 2012, A&A, 537, A20
- Draine & Katz (1986) Draine, B. T. & Katz, N. 1986, ApJ, 310, 392
- Elitzur & Watson (1980) Elitzur, M. & Watson, W. D. 1980, ApJ, 236, 172
- Endres et al. (2016) Endres, C. P., Schlemmer, S., Schilke, P., Stutzki, J., & Müller, H. S. P. 2016, Journal of Molecular Spectroscopy, 327, 95
- Fanghaenel (2018) Fanghaenel, S. 2018, PhD thesis, Universität zu Köln
- Faure et al. (2017) Faure, A., Halvick, P., Stoecklin, T., et al. 2017, MNRAS, 469, 612
- Fedele et al. (2013) Fedele, D., Bruderer, S., van Dishoeck, E. F., et al. 2013, A&A, 559, A77
- Federman et al. (1995) Federman, S. R., Cardell, J. A., van Dishoeck, E. F., Lambert, D. L., & Black, J. H. 1995, ApJ, 445, 325
- Flores-Mijangos et al. (2004) Flores-Mijangos, J., Brown, J. M., Matsushima, F., et al. 2004, Journal of Molecular Spectroscopy, 225, 189
- Freeman & Williams (1982) Freeman, A. & Williams, D. A. 1982, Ap&SS, 83, 417
- Fuente et al. (2010) Fuente, A., Berné, O., Cernicharo, J., et al. 2010, A&A, 521, L23
- Gerin et al. (2010) Gerin, M., de Luca, M., Black, J., et al. 2010, A&A, 518, L110
- Gerin et al. (2016) Gerin, M., Neufeld, D. A., & Goicoechea, J. R. 2016, ARA&A, 54, 181
- Godard & Cernicharo (2013) Godard, B. & Cernicharo, J. 2013, A&A, 550, A8
- Godard et al. (2010) Godard, B., Falgarone, E., Gerin, M., Hily-Blant, P., & de Luca, M. 2010, A&A, 520, A20
- Godard et al. (2012) Godard, B., Falgarone, E., Gerin, M., et al. 2012, A&A, 540, A87
- Godard et al. (2014) Godard, B., Falgarone, E., & Pineau des Forêts, G. 2014, A&A, 570, A27
- Goicoechea et al. (2021) Goicoechea, J. R., Aguado, A., Cuadrado, S., et al. 2021, A&A, 647, A10
- Goicoechea & Cuadrado (2021) Goicoechea, J. R. & Cuadrado, S. 2021, A&A, 647, L7
- Goicoechea et al. (2011) Goicoechea, J. R., Joblin, C., Contursi, A., et al. 2011, A&A, 530, L16
- Goicoechea & Le Bourlot (2007) Goicoechea, J. R. & Le Bourlot, J. 2007, A&A, 467, 1
- Goicoechea et al. (2022) Goicoechea, J. R., Lique, F., & Santa-Maria, M. G. 2022, A&A, 658, A28
- Goicoechea et al. (2016) Goicoechea, J. R., Pety, J., Cuadrado, S., et al. 2016, Nature, 537, 207
- Goicoechea et al. (2019) Goicoechea, J. R., Santa-Maria, M. G., Bron, E., et al. 2019, A&A, 622, A91
- Gómez-Carrasco et al. (2022) Gómez-Carrasco, S., Féliz-González, D., Aguado, A., & Roncero, O. 2022, submitted
- Gómez-Carrasco et al. (2014) Gómez-Carrasco, S., Godard, B., Lique, F., et al. 2014, Astrophys. J., 794, 33
- Gómez-Carrasco & Roncero (2006) Gómez-Carrasco, S. & Roncero, O. 2006, J. Chem. Phys., 125, 054102
- Grozdanov et al. (2016) Grozdanov, T. P., McCarroll, R., & Roueff, E. 2016, A&A, 589, A105
- Grozdanov & Solov’ev (1982) Grozdanov, T. P. & Solov’ev, E. A. 1982, J. Phys. B, 15, 1195
- Gull et al. (2020) Gull, T. R., Morris, P. W., Black, J. H., et al. 2020, MNRAS, 499, 5269
- Guo & Jiang (2014) Guo, H. & Jiang, B. 2014, Accounts Chem. Research, 47, 3679
- Habart et al. (2005) Habart, E., Abergel, A., Walmsley, C. M., Teyssier, D., & Pety, J. 2005, A&A, 437, 177
- Han et al. (2010) Han, B., Yang, H., Zheng, Y., & Varandas, A. J. C. 2010, Chemical Physics Letters, 493, 225
- Harding et al. (1993) Harding, L., Guadagnini, R., & Schatz, G. 1993, Journal of Physical Chemistry, 97, 5472
- Hily-Blant et al. (2010) Hily-Blant, P., Maret, S., Bacmann, A., et al. 2010, A&A, 521, L52
- Hollenbach & Tielens (1997) Hollenbach, D. J. & Tielens, A. G. G. M. 1997, ARA&A, 35, 179
- Indriolo et al. (2015) Indriolo, N., Neufeld, D. A., Gerin, M., et al. 2015, ApJ, 800, 40
- Jansen et al. (1995) Jansen, D. J., Spaans, M., Hogerheijde, M. R., & van Dishoeck, E. F. 1995, A&A, 303, 541
- Joblin et al. (2018) Joblin, C., Bron, E., Pinto, C., et al. 2018, A&A, 615, A129
- Kama et al. (2013) Kama, M., López-Sepulcre, A., Dominik, C., et al. 2013, A&A, 556, A57
- Kaplan et al. (2021) Kaplan, K. F., Dinerstein, H. L., Kim, H., & Jaffe, D. T. 2021, ApJ, 919, 27
- Karplus et al. (1965) Karplus, M., Porter, R. N., & Sharma, R. D. 1965, J. Chem. Phys., 43, 3259
- Kavak et al. (2019) Kavak, Ü., van der Tak, F. F. S., Tielens, A. G. G. M., & Shipman, R. F. 2019, A&A, 631, A117
- Klaus et al. (1997) Klaus, T., Takano, S., & Winnewisser, G. 1997, A&A, 322, L1
- Knacke et al. (1982) Knacke, R. F., McCorkle, S., Puetter, R. C., Erickson, E. F., & Kraetschmer, W. 1982, ApJ, 260, 141
- Le Bourlot (1991) Le Bourlot, J. 1991, A&A, 242, 235
- Le Gal et al. (2014) Le Gal, R., Hily-Blant, P., Faure, A., et al. 2014, A&A, 562, A83
- Le Petit et al. (2006) Le Petit, F., Nehmé, C., Le Bourlot, J., & Roueff, E. 2006, ApJS, 164, 506
- Lesaffre et al. (2007) Lesaffre, P., Gerin, M., & Hennebelle, P. 2007, A&A, 469, 949
- Lewen et al. (2004) Lewen, F., Brünken, S., Winnewisser, G., Šimečková, M., & Urban, Š. 2004, Journal of Molecular Spectroscopy, 226, 113
- Linder et al. (1995) Linder, D. P., Duan, X., & Page, M. 1995, The Journal of Physical Chemistry, 99, 11458
- Maiti et al. (2004) Maiti, B., Schatz, G. C., & Lendvay, G. 2004, J. Phys. Chem. A, 108, 8772
- Marconi et al. (1998) Marconi, A., Testi, L., Natta, A., & Walmsley, C. M. 1998, A&A, 330, 696
- Marquette et al. (1988) Marquette, J. B., Rebrion, C., & Rowe, B. R. 1988, J. Chem. Phys., 89, 2041
- Martínez et al. (2004) Martínez, R., Millán, J., & González, M. 2004, J. Chem. Phys., 120, 4705
- Melnick et al. (2012) Melnick, G. J., Tolls, V., Goldsmith, P. F., et al. 2012, ApJ, 752, 26
- Meyer et al. (1997) Meyer, D. M., Cardelli, J. A., & Sofia, U. J. 1997, ApJ, 490, L103
- Meyer et al. (1998) Meyer, D. M., Jura, M., & Cardelli, J. A. 1998, ApJ, 493, 222
- Meyer & Roth (1991) Meyer, D. M. & Roth, K. C. 1991, ApJ, 376, L49
- Mok & Polanyi (1969) Mok, M. & Polanyi, J. C. 1969, J. Chem. Phys., 51, 1451
- Morris et al. (2020) Morris, P. W., Charnley, S. B., Corcoran, M., et al. 2020, ApJ, 892, L23
- Morris et al. (2016) Morris, P. W., Gupta, H., Nagy, Z., et al. 2016, ApJ, 829, 15
- Nagy & Lendvay (2017) Nagy, T. & Lendvay, G. 2017, J. Phys. Chem. Lett., 8, 4621
- Nagy et al. (2017) Nagy, Z., Choi, Y., Ossenkopf-Okada, V., et al. 2017, A&A, 599, A22
- Nagy et al. (2013) Nagy, Z., Van der Tak, F. F. S., Ossenkopf, V., et al. 2013, A&A, 550, A96
- Naylor et al. (2010) Naylor, D. A., Dartois, E., Habart, E., et al. 2010, A&A, 518, L117
- Neufeld et al. (2010) Neufeld, D. A., Goicoechea, J. R., Sonnentrucker, P., et al. 2010, A&A, 521, L10
- Neufeld et al. (2002) Neufeld, D. A., Kaufman, M. J., Goldsmith, P. F., Hollenbach, D. J., & Plume, R. 2002, ApJ, 580, 278
- Nyman & Wilhelmsson (1992) Nyman, G. & Wilhelmsson, U. 1992, J. Chem. Phys., 96, 5198
- Ocaña et al. (2017) Ocaña, A. J., Jiménez, E., Ballesteros, B., et al. 2017, AstroPhys. J., 850, 28
- Persson et al. (2010) Persson, C. M., Black, J. H., Cernicharo, J., et al. 2010, A&A, 521, L45
- Persson et al. (2012) Persson, C. M., De Luca, M., Mookerjea, B., et al. 2012, A&A, 543, A145
- Pety et al. (2012) Pety, J., Gratier, P., Guzmán, V., et al. 2012, A&A, 548, A68
- Pineau des Forets et al. (1986) Pineau des Forets, G., Flower, D. R., Hartquist, T. W., & Dalgarno, A. 1986, MNRAS, 220, 801
- Polanyi & Wong (1969) Polanyi, J. & Wong, W. 1969, J. Chem. Phys., 51, 1439
- Poveda & Varandas (2005) Poveda, L. A. & Varandas, A. J. C. 2005, PCCP, 2867
- Qu & Bowman (2016) Qu, C. & Bowman, J. M. 2016, J. Phys. Chem. A, 120, 4988
- Roncero (2021) Roncero, O. 2021, https://github.com/octavioroncero/madwave3
- Ruaud (2021) Ruaud, M. 2021, ApJ, 916, 103
- Sanz-Sanz et al. (2015) Sanz-Sanz, C., Aguado, A., Roncero, O., & Naumkin, F. 2015, J. Chem. Phys., 143, 234303
- Schilke et al. (2014) Schilke, P., Neufeld, D. A., Müller, H. S. P., et al. 2014, A&A, 566, A29
- Snow & McCall (2006) Snow, T. P. & McCall, B. J. 2006, ARA&A, 44, 367
- Sofia et al. (2004) Sofia, U. J., Lauroesch, J. T., Meyer, D. M., & Cartledge, S. I. B. 2004, ApJ, 605, 272
- Sonnentrucker et al. (2010) Sonnentrucker, P., Neufeld, D. A., Phillips, T. G., et al. 2010, A&A, 521, L12
- Stecher & Williams (1972) Stecher, T. P. & Williams, D. A. 1972, ApJ, 177, L141
- Sternberg & Dalgarno (1989) Sternberg, A. & Dalgarno, A. 1989, ApJ, 338, 197
- Sternberg & Dalgarno (1995) Sternberg, A. & Dalgarno, A. 1995, ApJS, 99, 565
- Stoecklin & Halvick (2005) Stoecklin, T. & Halvick, P. 2005, Phys. Chem. Chem. Phys., 7, 2446
- Tahani et al. (2016) Tahani, K., Plume, R., Bergin, E. A., et al. 2016, ApJ, 832, 12
- Tielens & Hollenbach (1985) Tielens, A. G. G. M. & Hollenbach, D. 1985, ApJ, 291, 722
- Tielens et al. (1993) Tielens, A. G. G. M., Meixner, M. M., van der Werf, P. P., et al. 1993, Science, 262, 86
- Toboła et al. (2011) Toboła, R., Dumouchel, F., Kłos, J., & Lique, F. 2011, J. Chem. Phys., 134, 024305
- Valdivia et al. (2017) Valdivia, V., Godard, B., Hennebelle, P., et al. 2017, A&A, 600, A114
- van der Tak et al. (2013) van der Tak, F. F. S., Nagy, Z., Ossenkopf, V., et al. 2013, A&A, 560, A95
- Veselinova et al. (2021) Veselinova, A., Agúndez, M., Goicoechea, J. R., et al. 2021, A&A, 648, A76
- Wagenblast et al. (1993) Wagenblast, R., Williams, D. A., Millar, T. J., & Nejad, L. A. M. 1993, MNRAS, 260, 420
- Wolfire et al. (2022) Wolfire, M. G., Vallini, L., & Chevance, M. 2022, arXiv e-prints, arXiv:2202.05867
- Zanchet et al. (2013a) Zanchet, A., Agúndez, M., Herrero, V. J., Aguado, A., & Roncero, O. 2013a, AJ, 146, 125
- Zanchet et al. (2013b) Zanchet, A., Godard, B., Bulut, N., et al. 2013b, ApJ, 766, 80
- Zanchet et al. (2019a) Zanchet, A., Lique, F., Roncero, O., Goicoechea, J. R., & Bulut, N. 2019a, A&A, 626, A103
- Zanchet et al. (2019b) Zanchet, A., Menéndez, M., Jambrina, P. G., & Aoiz, F. J. 2019b, J. Chem. Phys., 151, 094307
- Zanchet et al. (2016) Zanchet, A., Roncero, O., & Bulut, N. 2016, Phys. Chem. Chem. Phys., 18, 11391
- Zanchet et al. (2009) Zanchet, A., Roncero, O., González-Lezana, T., et al. 2009, J. Phys. Chem. A, 113, 14488
- Zymak et al. (2013) Zymak, I., Hejduk, M., Mulin, D., et al. 2013, Astrophys. J., 768, 86
Appendix A State-specific rates of reaction S(3P) + H2 (,v) SH (X) + H
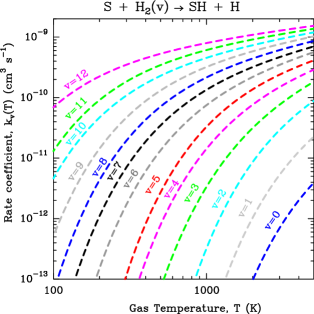
To further support the similar behavior of reaction (1) when X is a neutral atom, we also studied the analogous reaction of H2() molecules with S() atoms. This reaction also presents a late barrier (see Fig. 3). Goicoechea et al. (2021) previously reported quantum wave packet calculations of the reaction rate coefficients for 2 and 3. For , the reaction becomes exoergic, and the initial vibrational energy of H2 is higher than the energy barrier (see Fig. 1). Here we extend the calculations to higher values using QCT calculations similar to those described in Sect. 3.1.
A.1 QCT reaction rate coefficients up to = 12
We considered S atoms in levels, with nine spin-orbit states, with energies 0, 396.640, and 573.64 cm-1 for =2, 1, and 0, respectively. We introduced the spin-orbit splitting a posteriori.
First, we calculated the rate coefficients for each vibrational state of H2() for each adiabatic electronic state of the H2+S() system, neglecting spin-orbit couplings. The three adiabatic states correlate to S(), with =0, being the projection of the atomic electronic angular momentum. The SH(X) state correlates with S(), which are degenerate at the collinear geometries considered in Figs. 1 and 3. The S() state correlates with the SH(A) state, which is at 3.85 eV above SH(X), and therefore its contribution to the reactivity is negligible at the energies considered here.
The two ground adiabatic states of the SH2 system describing the S(3P) + H2() SH(X) + H reaction are the 1 and 1 states, and here we consider the three-dimensional potential energy surfaces of Maiti et al. (2004). We performed quasi-classical trajectory calculations for each of these two adiabatic electronic states, and for H2( = 0,1, … 12). For each electronic vibrational states and each temperature, we calculated about 105 trajectories. The two electronic states present very similar rate coefficients, and the rates of the two electronic and states were averaged for simplification purposes, that is, .
Second, considering that these two triply degenerate states correspond to S() (five states) and to one S() (one state) adiabatically, the total rate constant is then given by
| (7) |
The obtained rate coefficients are shown in Fig. 10, and the Arrhenius parameters used to fit them are listed in
Table 5 (including our determination
of the thermal rate coefficient). They show a very similar behavior to that of
reaction N() + H2() discussed in the main text. In particular, the rate coefficients show
a threshold even for , for which the reaction is exoergic and the vibrational energy is above the reaction barrier. This implies rate coefficients that have
a positive dependence with temperature, even for vibrational excited
H2 levels. On the other hand, the analogous hydrogen abstraction reaction with S+ ions,
reaction S + H2() SH+ + H2, shows the typical behavior of an exothermic reaction for 2, in other words a rate
coefficient that is nearly independent of temperature (see Fig. 4).
| (eV) | (cm3 s-1) | (K) | ||
|---|---|---|---|---|
| 0 | 0.270 | 0.052 10-10 | 0.636 | 10390.9 |
| 1 | 0.784 | 0.140 10-10 | 0.738 | 8000.0 |
| 2 | 1.270 | 0.363 10-10 | 0.712 | 5572.2 |
| 3 | 1.727 | 0.337 10-10 | 0.835 | 3305.9 |
| 4 | 2.156 | 0.766 10-10 | 0.646 | 2454.9 |
| 5 | 2.557 | 1.590 10-10 | 0.492 | 2163.0 |
| 6 | 2.931 | 1.362 10-10 | 0.598 | 1312.4 |
| 7 | 3.275 | 1.914 10-10 | 0.531 | 989.3 |
| 8 | 3.599 | 2.718 10-10 | 0.466 | 790.3 |
| 9 | 3.884 | 3.567 10-10 | 0.419 | 608.7 |
| 10 | 4.134 | 4.227 10-10 | 0.399 | 407.6 |
| 11 | 4.349 | 5.773 10-10 | 0.332 | 342.4 |
| 12 | 4.523 | 6.632 10-10 | 0.313 | 191.5 |
| thermal | 4.000 10-10 | 15500.0 |
A.2 Impact on the SH abundance in the Orion Bar
Figure 11 shows the impact of the state-specific rate coefficients of reaction S () + H2 () SH + H, computed here up to = 12, in a PDR model of the Orion Bar. The pink continuous curve shows the SH abundance profile using these rate coefficients. The pink dashed curve is for a model that uses the thermal rate coefficient. Despite these state-specific rate coefficients showing the same fundamental behavior as those of reaction N() + H2() NH + H, the impact on the formation of SH radicals is very minor (an increase of 1% in column density). This difference arises from the fact that S+ ions, and not S atoms, are the dominant gas-phase sulfur reservoir in the PDR surface layers where highly vibrationally excited H2 exist.
Goicoechea et al. (2021) present a detailed study of the chemistry of sulfur bearing hydrides in the Orion Bar. The SH abundance profile shown in Fig. 11 is very similar to their Fig. 12 (implementing quantum rate coefficients up to = 3 for reaction S() + H2() SH + H).