These authors contributed equally to this work.
These authors contributed equally to this work.
These authors contributed equally to this work.
These authors contributed equally to this work.
1]\orgdivOperations Research Center, \orgnameMassachusetts Institute of Technology, \orgaddress\street1 Amherst St, \cityCambridge, \postcode02139, \stateMA, \countryUSA
2]\orgdivSloan School of Management, \orgnameMassachusetts Institute of Technology, \orgaddress\street100 Main St, \cityCambridge, \postcode02139, \stateMA, \countryUSA
3]\orgdivAbdul Latif Jameel Clinic for Machine Learning in Health, \orgnameMassachusetts Institute of Technology, \orgaddress\street25 Carleton St, \cityCambridge, \postcode02139, \stateMA, \countryUSA
TabText: A Flexible and Contextual Approach to Tabular Data Representation
Tabular data is an essential data format for applying machine learning tasks across various industries. However, traditional data processing methods do not fully utilize all the information available in the tables, ignoring important contextual information such as column header descriptions. In addition, pre-processing data into a tabular format can remain a labor-intensive bottleneck in model development. This work introduces TabText, a processing and feature extraction framework that extracts contextual information from tabular data structures. TabText addresses processing difficulties by converting the content into language and utilizing pre-trained large language models (LLMs). We evaluate our framework on nine healthcare prediction tasks ranging from patient discharge, ICU admission, and mortality. We show that 1) applying our TabText framework enables the generation of high-performing and simple machine learning baseline models with minimal data pre-processing, and 2) augmenting pre-processed tabular data with TabText representations improves the average and worst-case AUC performance of standard machine learning models by as much as 6%.
keywords:
Feature Extraction, Large Language Models, Contextual Information, Healthcare Tabular Structures, Machine Learning1 Introduction
Tabular data remains the most widely used and readily available data format across various fields ranging from education, healthcare, and technology, where it serves a vital role in capturing all domains of information. Preprocessing tabular data accurately and efficiently is essential for creating reliable downstream models in machine learning applications. Yet, two significant limitations exist for directly incorporating tabular data into modeling pipelines: they require labor-intensive, often manual, data processing to standardize information across heterogeneous tabular structures and data sources, and they ignore contextual information such as column headers and meta content descriptions.
In contrast to tabular approaches, language is a very flexible data modality that can easily represent information about different data points without imposing any structural similarity between them. Furthermore, recent developments on off-the-shelf large language models (LLMs) based on the Transformer architecture [20] offer state-of-the-art performances on a wide range of language tasks, including translation, sentence completion, and question answering. These pre-trained models are often developed with very large and diverse data sets, allowing them to exploit prior knowledge and make accurate predictions with very few new training samples. Some LLMs are trained to target specific domain knowledge and technical challenges, making them particularly useful in the corresponding applications. For example, LLMs fine-tuned on clinical notes and biomedical corpora such as ClinicalBERT [1], BioBERT[11], and BioGPT[13] offer substantial advantages for medical learning tasks, and LLMs that specifically target long token sequences unveil opportunities for dealing with data that contains long texts [2, 12].
These successful language models offer a natural solution to represent and process contextual information from tabular structures. Standard machine learning models only utilize the explicit table contents, disregarding all accompanying context like column headers and table descriptions. Incorporating these metadata into the model via language could give meaning to the data values within the broader context. For example, a numerical value might be very relevant for disease prediction if it represents a person’s age but not so much if it corresponds to the ward census. Moreover, LLMs could save significant manual labor for selecting, encoding, and imputing data [19, 5, 16]. Missing data, in particular, is a challenging and frequent problem that requires attentive processing and expert knowledge. Current predictive models either exclude such attributes, potentially ignoring rare-occurring but valuable data or impute missing values with very few recorded instances. Additional processing challenges arise when units of measurement or data types are inconsistent across tabular data systems. By leveraging language, these difficulties could be addressed, for instance, by simply writing that particular values are missing and converting inconsistent values into text.
Previous works using LLMs have shown the potential of using natural language processing (NLP) models to systematically and efficiently process tabular data in the form of language [9, 21, 17, 18]. However, they have mainly relied on training fixed BERT-based models that are not flexible to changes in tabular structures. These works have mostly assumed that encoding data using LLMs leads to better performance than traditional data processing methods, but concrete evidence has not been provided. Other works augment tabular data with external unstructured data [7] but do not leverage contextual data from the original tabular source. In addition, language models are considered sensitive to their input representations [14], and most previous works do not thoroughly investigate how the choice of language affects their results. [8] do investigate different language variants, but in the context of zero-shot and few-shot classification as opposed to feature representation. Thus, guidance on the best way to construct the language data remains in need.
This paper builds and evaluates a new feature extraction methodology and addresses the aforementioned questions.
We process tabular data by creating a text representation for each data sample. This text contains the column attribute with its corresponding value and potentially other available contextual information.
We then use this text as input for a finetuned pre-trained Clininal-Longformer model to generate TabText embeddings of a fixed dimension (768).
Finally, we augment the tabular features with these TabText embeddings to train any standard machine learning model (e.g., decision trees, support vector machines, gradient-boosted trees) for downstream prediction tasks. Figure 1 illustrates the overall TabText framework.
The main contributions of this work are as follows:
-
1.
We develop TabText, a systematic framework that leverages language to extract contextual information from tabular structures, resulting in more complete data representations.
-
2.
We show the effectiveness of using TabText representations for general data pre-processing. Our experiments demonstrate that augmenting tabular data with our TabText representations can improve the AUC score by up to across nine healthcare classification tasks.
-
3.
We investigate the impact of several language syntactic parsing schemes on the performance of TabText representations and demonstrate the flexibility of our framework compared with traditional labor-consuming processing of unorganized data into a tabular feature space.

2 Results
This section presents extensive computational experiments evaluating the performance of our TabText framework. First, we show how our pipeline can quickly generate machine-learning models with competitive performance without any data cleaning by leveraging the flexibility of language. We then demonstrate with pre-processed data that augmenting standard tabular representations with our TabText embeddings can increase out-of-sample AUC by up to , with the largest improvements observed for the most challenging predictions.
2.1 High Performance with Minimal Pre-Processing
Traditional machine learning approaches using tabular data typically require thorough data cleaning before data is input into the models. For instance, [15] utilized hospital Electronic Medical Records (EMR) data to predict major inpatient outcomes related to mortality, discharges, and ICU transfers. Their model development required a series of data pre-processing steps, including merging raw data tables, parsing string columns, encoding categorical variables, constructing features, and imputing missing data, as described in Section 4.2. The authors reported approximately one year of effort jointly by machine learning researchers and hospital specialists on obtaining, cleaning, and processing the data.
The TabText framework can be leveraged to replace these heavy liftings by simply creating a text representation for each data sample using the information as it appears in the raw data tables. In particular, columns that require data cleaning to be converted to appropriate data types can be simply transformed into text. For example, the sentence corresponding to a numerical column for a sedation score with the value “-4 deep sedation” can be written as “sedation score is -4 deep sedation”, as opposed to parsing the original string into a numeric value of -4 as part of the traditional pre-processing steps. Therefore, TabText representations enable us to quickly build baseline machine learning models utilizing the tabular data in its raw form.
We apply this approach on a large data set of medical records to predict nine classification tasks largely overlapping with [15] (details provided in Section 4.1). Only minimal data preprocessing was required, including constructing the meta information of the tables and categorizing columns for different language representations, which is estimated to have taken only a couple of hours of manual work. We then followed our TabText pipeline to train a gradient-boosted tree model for each classification task using four years’ worth of inpatient data from a large hospital (see details in the appendix, Table 3). The baseline TabText models with minimally processed data already achieve high out-of-sample AUC performance, where the average AUCs across 10 random 75%-25% train-validation splits are close or above for all prediction tasks except for Enter ICU 48 hr, which is a notoriously difficult classification task [15].
| Prediction Task | TabText Baseline AUC |
|---|---|
| Discharge 24 hr | 0.803 |
| Discharge 48 hr | 0.790 |
| Enter ICU 24 hr | 0.801 |
| Leave ICU 24 hr | 0.839 |
| Enter ICU 48 hr | 0.757 |
| Leave ICU 48 hr | 0.835 |
| Expire 24 hr | 0.943 |
| Expire 48 hr | 0.933 |
| Mortality | 0.895 |
2.2 Enhanced Performance with Contextual Representation
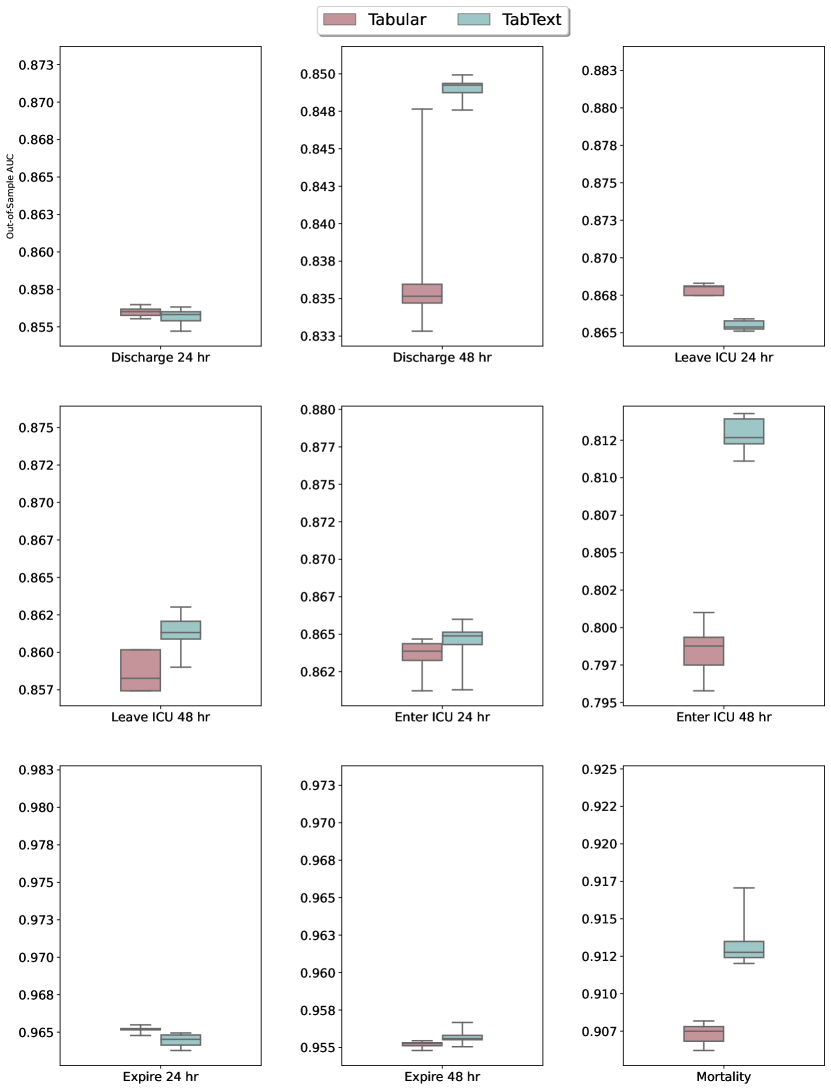
We next process the data and group all features into 6 tables (see a summary in Table 2), which we combine and feed into the TabText Framework from Figure 1. We perform experiments on the same data and classification tasks as in Section 2.1 but using the cleaned data this time. The results obtained using the standard Tabular approach and our TabText framework are shown in Table 2. The average AUCs across 10 random 75%-25% train-validation splits for the Enter ICU 48 hr and Discharge 48 hr prediction task are improved by an additive increment of 1.2%–1.4%. We also see a substantial but smaller benefit for Mortality risk prediction. For the remaining tasks, Tabular and TabText achieve similar performance with differences in average AUC smaller than 0.25%. We also notice in Figure 2 that the largest TabText benefits occur for the classification tasks with the lowest Tabular performance (high variability and low AUCs), while practically no effect was observed for the tasks with stable Tabular results (low variability and high AUCs).
2.3 Larger Benefits for Harder Predictions
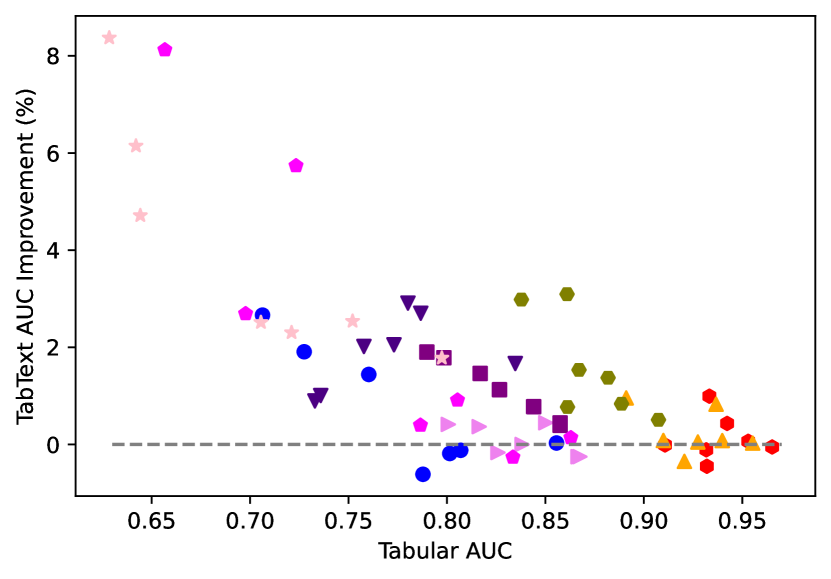
To better understand the regimes in which TabText provides the largest improvements in AUC performance, we repeat this experiment using smaller and larger training data sets. For each prediction task, we consider the original training data size as well as smaller data sizes (ranging from 2000, 3000, 5000, 10000, 25000, and 50000 patient days). We plot in Figure 3(a) (resp. Figure 3(b)) the average (resp. worst-case) TabText AUC improvement percentage across 10 random 75%-25% train-validation splits, where the x-axis corresponds to the average (resp. worst-case) AUC of the standard Tabular approach and the y-axis quantifies the relative percentage improvement on average (resp. worst-case) AUC achieved with TabText. Each scatter point represents the result of a prediction task (denoted by legends) on one of the 7 different data subsets. As in Section 2.2, we observe larger improvements on the more difficult prediction tasks with Tabular AUCs below 85%. On easier prediction tasks, where Tabular models already achieve AUCs over 90%, the benefit of TabText is near or below zero. When the Tabular AUCs are less than 78%, Tabtext brings a positive improvement on all results, including several instances of improvement over 5–6%. This suggests more potential benefits of augmenting tabular models with TabText representations for tasks with low Tabular performance.

improvement at varying data sizes.
3 Discussion
In this paper, we introduce TabText, a novel framework for processing tabular data by converting it into a text representation that captures important contextual information such as column descriptions. Our experiments show that augmenting standard tabular data with our TabText representations can improve the performance of standard machine learning models across nine critical healthcare operations tasks, with larger improvements observed for the more challenging tasks. In addition, we demonstrate the efficiency of TabText in simplifying data pre-processing and cleaning, offering an alternative and flexible pipeline for generating high-performing baseline models.
Our experiments reveal the potential of TabText for improving the performance of standard machine learning models, and there are several research directions for further improving our framework. For instance, TabText relies on the use of NLP models that could generate high-quality embeddings for the input text, which motivates the development of more LLMs pre-trained with domain-specific data. Moreover, augmenting tabular data with TabText embeddings adds a layer of complexity to the interpretability of the model output, and developing tools for maintaining the interpretability of the tabular data would be an interesting direction for future research. TabText is a general framework that can be particularly useful for difficult classification tasks (for instance, those with limited data availability), and we hope that this work motivates further research for leveraging language in general machine learning applications.
4 Methods

4.1 Data and Classification Tasks
Data: We use a confidential hospital data set that contains medical records of all inpatients from a large comprehensive teaching hospital over a four-year period. Each data point represents a patient day.
There are 160 columns of different patient attributes on demographics, patient status, vital signs, laboratory results, diagnoses, treatments, and other information. The summary of the tables utilized can be found in the appendix in Table 2.
Prediction Tasks: We consider several binary classification tasks related to the length of stay, ICU, and mortality for each inpatient in the hospital. Two discharge-related outcomes are whether patients are discharged or not within the next 24 hours (resp. 48 hours).
Four ICU-related outcomes include whether the patient will enter (resp. leave) the intensive care unit (ICU) for patients currently not in the ICU (resp. in the ICU) within the next 24 hours (resp. 48 hours). Two short-term expiration outcomes concern whether each patient will die in the next 24 hours (resp. 48 hours).
One end-of-stay mortality outcome indicates whether patients die or not at the end of their stay.
We make predictions on each patient day, and we summarize the number of data points for each prediction task in the appendix in Table 3.
4.2 Data Pre-processing
Given the raw tabular data files, we perform several data processing steps following [15] to obtain the final feature space described below.
String Parsing:
Some columns in string format require string parsing to extract numerical features as continuous variables. For instance, the normal ranges of laboratory tests in forms such as “50–70” are replaced with two columns: one with a value of 50 for the lower bound and another with a value of 70 for the upper bound.
Categorical Encoding:
Categorical columns (e.g., department, mobility level, the reason for visit) must be converted to ordered numerical levels (consecutive integers) using label-encoding or binary categories using one-hot encoding. Due to the large number of categories, we use label encoding for all categorical variables.
Feature Engineering: To better capture the clinical information, we compute various auxiliary variables:
-
1)
Current conditions extracted from records (e.g., whether the patient is in ICU or IV)
-
2)
Normal indicators (whether the clinical measurement is within the normal/critical range) instead of the ranges themselves.
-
3)
Counts (e.g., number of days in ICU, number of attending physicians).
-
4)
Pending procedures/results (time until surgery, whether MRI is pending, etc.).
-
5)
Historical record linked to the patient (e.g., number of days since the previous admission and length of the previous stay).
-
6)
Non-patient-specific operational variables (e.g., day of the week, ward census and utilization, hospital admission volume on the previous day).
Missing Data Imputation: Since the raw data comes from a hospital system, it contains many missing values. We impute most missing entries with 0, except for a few cases. From communications with the hospital, we impute certain variables with prior knowledge of the meaning of missingness (e.g., missing Do Not Resuscitate (DNR) means the patient did not sign a DNR form). For some auxiliary variables, we apply some rules, such as imputing counts with 0 if no record exists and imputing the number of days since previous admission with a large number (e.g., 9999) if no previous admission exists.
4.3 LLM Selection
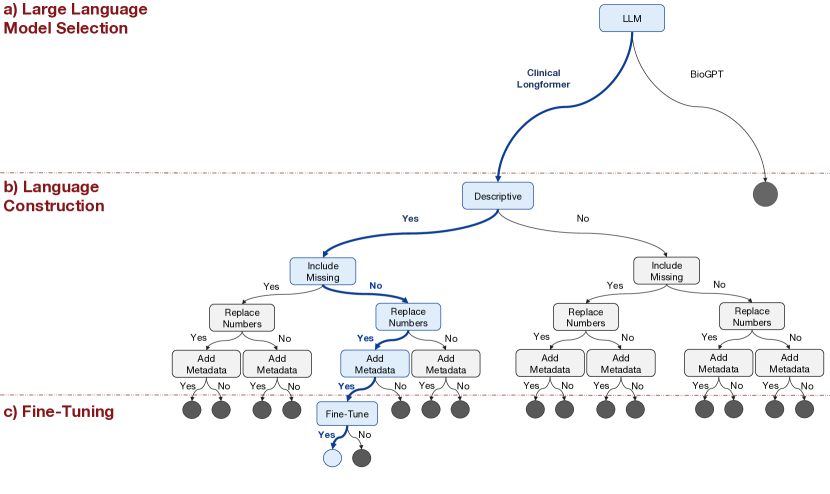
We consider two different Transformer models, BioGPT and Clinical-Longformer [12], both of which were pre-trained with MIMIC-III clinical notes [10]. To compare them, we perform experiments with the same data and prediction tasks described in Section 4.1. Following the TabText framework, we convert the tables into simple text: for each row, the cell from column “attribute” with value X is transformed into “attribute: X” and the texts from all columns are concatenated into a single sentence with the comma character. We next create TabText embeddings and finally train gradient-boosted tree models. Figure 4(a) shows the boxplots for the out-of-sample AUC over 10 random 75%-25% train-validation splits for each task and each model. Both NLP models achieve similar performance across tasks, and we therefore choose the Clinical-Longformer model, as it allows for input text of larger size.
4.4 Language Construction
The versatility of language creates a challenge for consistency, as multiple textual expressions can convey the same information. Moreover, tabular data in healthcare is often split across multiple tabular sources (e.g., vitals table, medications table), some of which include information only for a particular group of patients. This results in even more possibilities for textual representation.
The TabText framework creates a single paragraph for each data sample (e.g., for each patient day) as follows: we first create a sentence for each column in each table. Next, for each table, we concatenate contextual information and the sentences of its columns using the colon (“:”) and comma (“,”) characters, respectively. We then merge the text from all tables into a single paragraph using the period (“.”) character. While the exact punctuation doesn’t significantly impact BERT-based transformers [4], the exact text chosen to build each sentence might have a larger impact on the final embedding. We therefore investigate different ways to construct sentences for each column attribute.
Descriptiveness: We consider whether or not to use descriptive language to construct text sentences. Specifically, consider a cell from column “attribute” that has value “X”. If the column is non-binary, we consider the following options:
-
•
Non-Descriptive Sentence: “attribute: X”;
-
•
Descriptive Sentence: “attribute is X”.
For binary columns, we consider the verb associated with the specific attribute. For instance, if the column attribute is associated with the verb “to have” we consider
-
•
Non-Descriptive Sentence: “has X: yes” or “has X: no”;
-
•
Descriptive Sentence: “has X” or “does not have X”.
Missing Values: When the value for a column “attribute” is missing, we consider two options, to explicitly mention in the text that this information is not available (“attribute is missing”), or to simply skip this column when building the text representation.
Numerical Data: Transformer models often struggle to represent language with numerical data [6]. Therefore, we also consider whether or not to replace numerical values with text. For replacement, we compute the average (AVG) and standard deviation (SD) of the corresponding column with respect to the training data. We then replace a given cell value as follows:
-
•
“very low” if ;
-
•
“low” if ;
-
•
“normal” if ;
-
•
“high” if ;
-
•
“very high” if .
Including Metadata: We investigate the added value of including metadata as part of the text representation. This corresponds to descriptions of table content (e.g., “This table contains information about the medications administered to this patient”) or the prediction task of interest (e.g., “We want to predict mortality risk”).
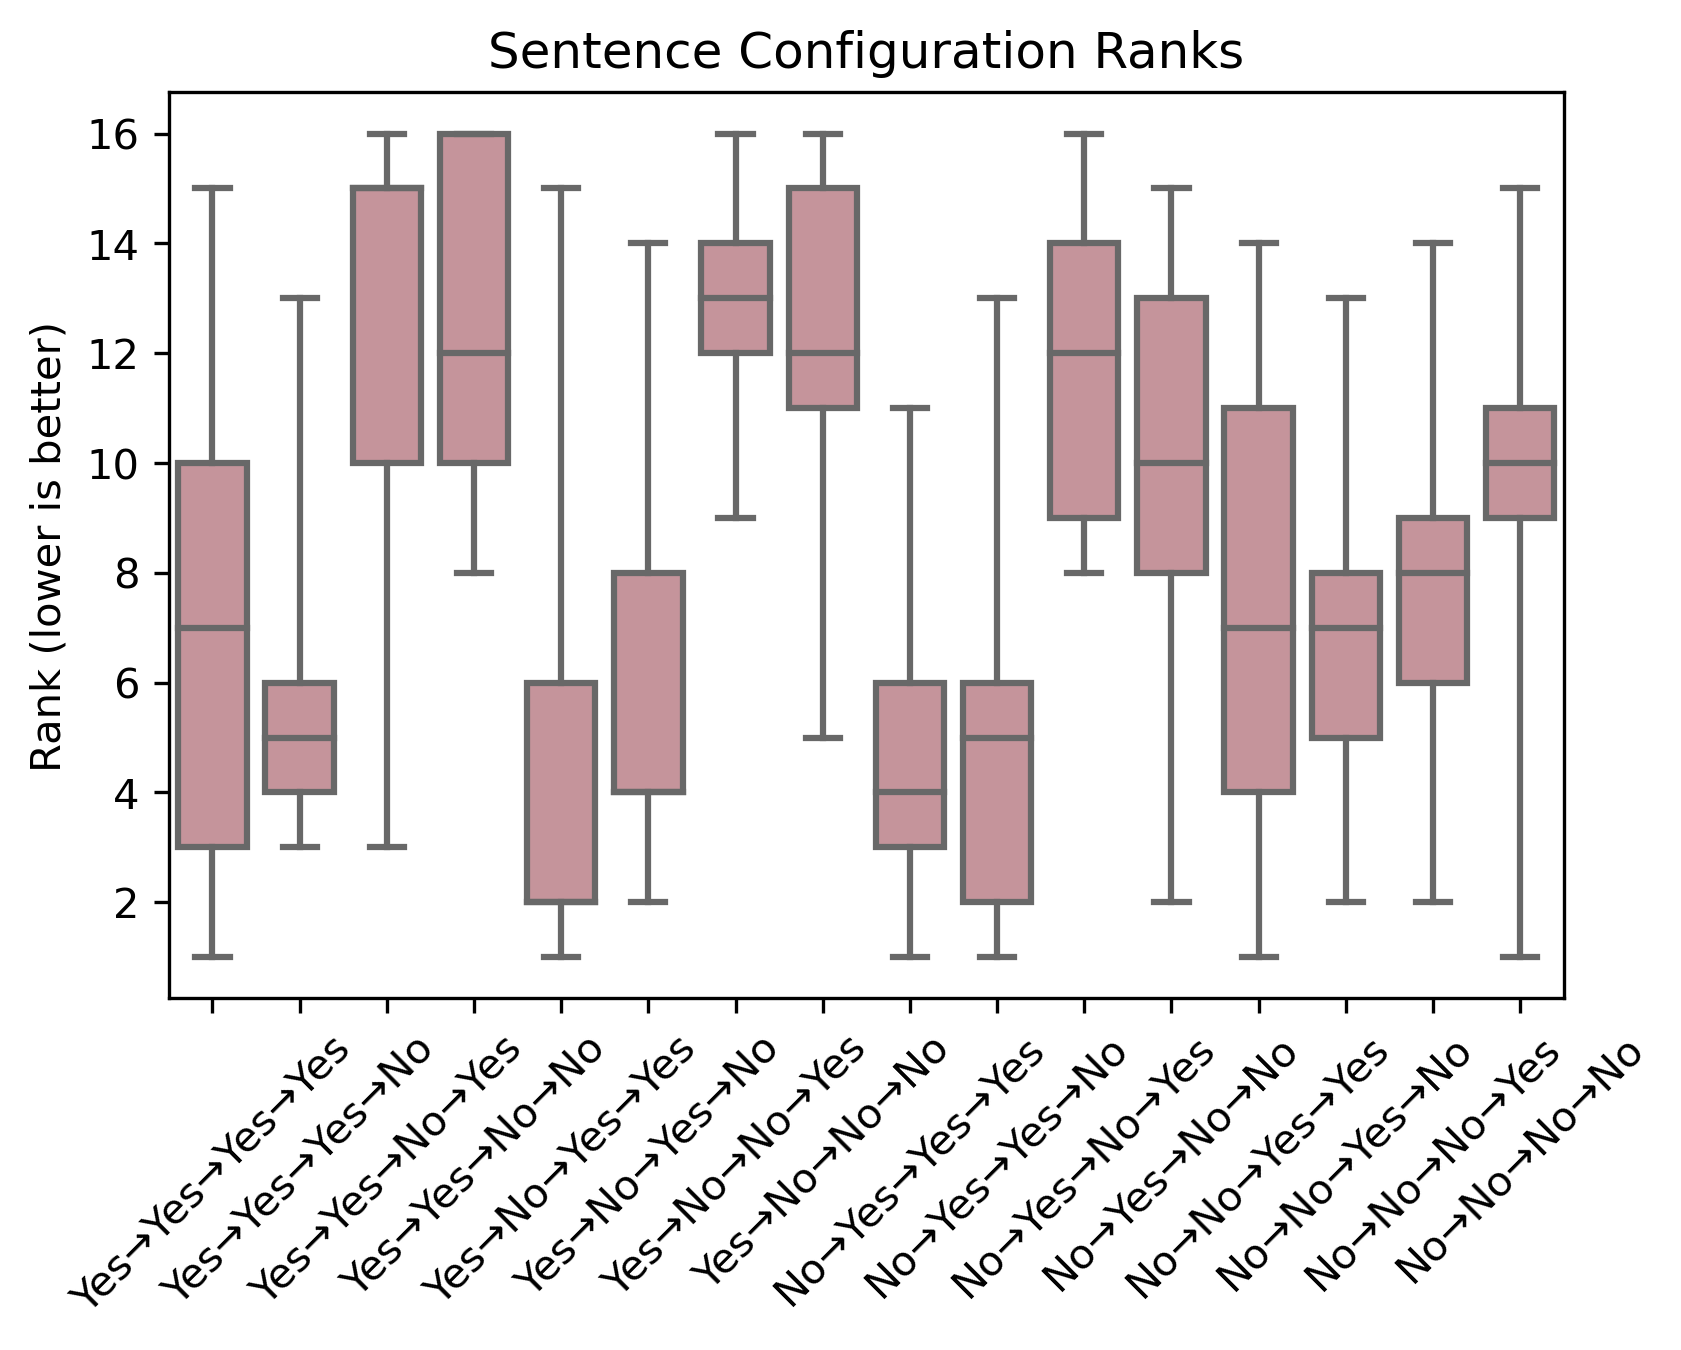
For each possible sentence configuration, we use default values of the Clinical-Longformer model to obtain TabText embeddings that are given as input to a gradient-boosted tree model. For this small experiment, we utilize 63 data features corresponding to laboratory results. We use data samples for training, for validation, and for testing. We use the same data and prediction tasks described in Section 4.1. In Figure 4(b), the Language Construction results show the boxplot for the rank achieved with each configuration across tasks, where lower numbers correspond to better ranking. We choose the sentence configuration with the lowest median ranking; specifically, we use descriptive language, omit missing values from the text, replace numerical values with text, and include metadata.
4.5 Fine-Tuning
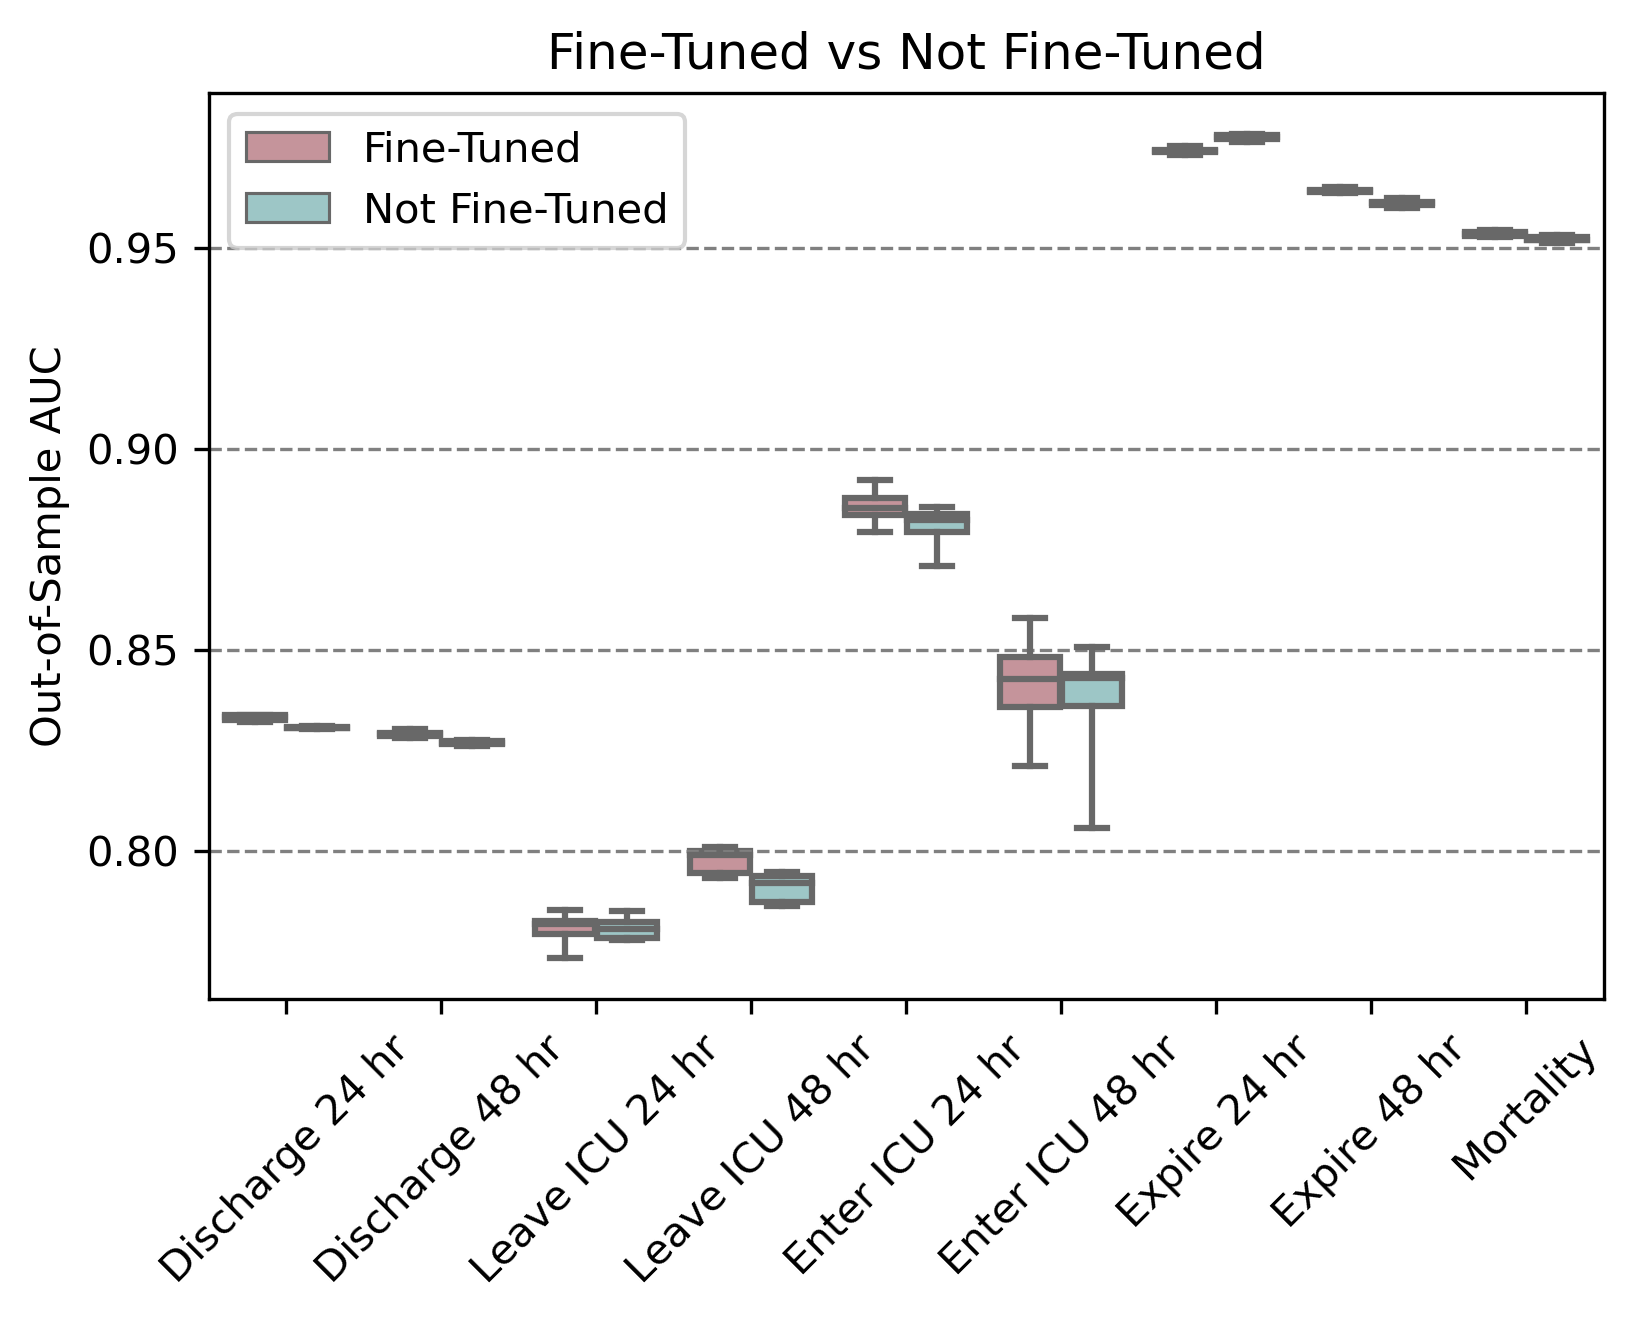
Although Clinical-Longformer was pre-trained with large language data sets, we can further improve its performance with a few more training iterations using our training data. Specifically, we convert our training data into language following the sentence configuration selected in Section 4.4, and we use it to fine-tune Clinical-Longformer following the original BERT training methodology, which includes self-supervised masked word prediction. We fine-tune for 3 epochs and with the default values for all hyperparameters. We show in Figure 4 the boxplots for the out-of-sample AUC over 10 random 75%-25% train-validation splits for each task. We see that fine-tuning the model with our local data slightly improves performance for eight out of the nine classification tasks of interest.
4.6 Training Methodology
Text Encoder: We first convert the input training data from tabular to textual format as described previously in Section 4.4. We use the sentence configuration that led to the highest average AUCs (i.e., skipping sentences for missing values, replacing numbers with text, using descriptive language, and adding metadata). Then, we use the fine-tuned Clinical-Longformer model to extract language embeddings of size 768.
Training Methodology: For each prediction task, we compare two approaches: our TabText framework (see Figure 1) and the standard Tabular approach in which only the tabular data is given as input to the machine learning model.
We use gradient-boosted tree models in all experiments performed.
For all reported results, the average performance is computed over 10 random 75%-25% train-validation splits (identical 10 splits across all experiments) for a fair comparison. The optimal model is selected using a hyperparameter grid search (see details in the appendix) based on its performance on the validation set.
Implementation: All our code is written in Python 3.8.2. We trained all models using one Intel Xeon Platinum 8260 or Intel Xeon Gold 6248 CPU and GPU. We conducted all of our predictive experiments using the XGBoost [3] library from Python. The Clinical-Longformer model is directly accessed from HuggingFace.
Declarations
Funding The authors have no relevant financial or non-financial interests to disclose.
Competing interests The authors declare that no funds, grants, or other support were received during the preparation of this manuscript.
Ethics approval Not applicable.
Consent to participate Not applicable.
Consent for publication Not applicable.
Availability of data and materials. We use a confidential hospital data set which is not publicly available.
Authors’ contributions
Kimberly Villalobos Carballo
developed the code, performed the experiments and the corresponding results’ analysis, and co-wrote the paper.
Liangyuan Na and Yu Ma developed parts of the code, performed some of the experiments and results’ analysis, and edited the paper.
Léonard Boussioux and Cynthia Zeng performed some of the results’ analysis and edited the paper. Luis Soenksen participated in the early stages of the research and helped formulate the idea and discussed some of the results.
Dimitris Bertsimas inspired, supported, and supervised the presented work and edited the paper.
References
- \bibcommenthead
- Alsentzer et al [2019] Alsentzer E, Murphy JR, Boag W, et al (2019) Publicly available clinical bert embeddings. 10.48550/ARXIV.1904.03323, URL https://arxiv.org/abs/1904.03323
- Beltagy et al [2020] Beltagy I, Peters ME, Cohan A (2020) Longformer: The long-document transformer. arXiv preprint arXiv:200405150
- Chen and Guestrin [2016] Chen T, Guestrin C (2016) Xgboost: A scalable tree boosting system. In: Proceedings of the 22nd ACM SIGKDD International Conference on Knowledge Discovery and Data Mining. Association for Computing Machinery, p 785–794
- Ek et al [2020] Ek A, Bernardy JP, Chatzikyriakidis S (2020) How does punctuation affect neural models in natural language inference. In: Proceedings of the Probability and Meaning Conference (PaM 2020). Association for Computational Linguistics, Gothenburg, pp 109–116, URL https://aclanthology.org/2020.pam-1.15
- Geneviève et al [2019] Geneviève LD, Martani A, Mallet MC, et al (2019) Factors influencing harmonized health data collection, sharing and linkage in denmark and switzerland: A systematic review. PLOS ONE 14(12):e0226015. 10.1371/journal.pone.0226015, URL https://doi.org/10.1371/journal.pone.0226015
- Gorishniy et al [2022] Gorishniy Y, Rubachev I, Babenko A (2022) On embeddings for numerical features in tabular deep learning. 10.48550/ARXIV.2203.05556, URL https://arxiv.org/abs/2203.05556
- Harari and Katz [2022] Harari A, Katz G (2022) Few-shot tabular data enrichment using fine-tuned transformer architectures. In: Proceedings of the 60th Annual Meeting of the Association for Computational Linguistics (Volume 1: Long Papers), pp 1577–1591
- Hegselmann et al [2023] Hegselmann S, Buendia A, Lang H, et al (2023) Tabllm: Few-shot classification of tabular data with large language models. In: Ruiz F, Dy J, van de Meent JW (eds) Proceedings of The 26th International Conference on Artificial Intelligence and Statistics, Proceedings of Machine Learning Research, vol 206. PMLR, pp 5549–5581, URL https://proceedings.mlr.press/v206/hegselmann23a.html
- Herzig et al [2020] Herzig J, Nowak PK, Müller T, et al (2020) TaPas: Weakly supervised table parsing via pre-training. In: Proceedings of the 58th Annual Meeting of the Association for Computational Linguistics. Association for Computational Linguistics, Online, pp 4320–4333, 10.18653/v1/2020.acl-main.398, URL https://aclanthology.org/2020.acl-main.398
- Johnson et al [2016] Johnson AE, Pollard TJ, Shen L, et al (2016) Mimic-iii, a freely accessible critical care database. Scientific data 3(1):1–9
- Lee et al [2019] Lee J, Yoon W, Kim S, et al (2019) BioBERT: a pre-trained biomedical language representation model for biomedical text mining. Bioinformatics 36(4):1234–1240. 10.1093/bioinformatics/btz682, URL https://doi.org/10.1093/bioinformatics/btz682, https://academic.oup.com/bioinformatics/article-pdf/36/4/1234/48983216/bioinformatics_36_4_1234.pdf
- Li et al [2022] Li Y, Wehbe RM, Ahmad FS, et al (2022) Clinical-longformer and clinical-bigbird: Transformers for long clinical sequences. arXiv preprint arXiv:220111838
- Luo et al [2022] Luo R, Sun L, Xia Y, et al (2022) BioGPT: generative pre-trained transformer for biomedical text generation and mining. Briefings in Bioinformatics 23(6). 10.1093/bib/bbac409, URL https://doi.org/10.1093%2Fbib%2Fbbac409
- Miyajiwala et al [2022] Miyajiwala A, Ladkat A, Jagadale S, et al (2022) On sensitivity of deep learning based text classification algorithms to practical input perturbations. arXiv:2201.00318
- Na et al [2023] Na L, Villalobos Carballo K, Pauphilet J, et al (2023) Patient outcome predictions improve operations at a large hospital network. arXiv:2305.15629
- Nan et al [2022] Nan Y, Ser JD, Walsh S, et al (2022) Data harmonisation for information fusion in digital healthcare: A state-of-the-art systematic review, meta-analysis and future research directions. Information Fusion 82:99–122. 10.1016/j.inffus.2022.01.001, URL https://doi.org/10.1016/j.inffus.2022.01.001
- Padhi et al [2021] Padhi I, Schiff Y, Melnyk I, et al (2021) Tabular transformers for modeling multivariate time series. In: ICASSP 2021 - 2021 IEEE International Conference on Acoustics, Speech and Signal Processing (ICASSP), pp 3565–3569, 10.1109/ICASSP39728.2021.9414142
- Somepalli et al [2021] Somepalli G, Goldblum M, Schwarzschild A, et al (2021) Saint: Improved neural networks for tabular data via row attention and contrastive pre-training. 10.48550/ARXIV.2106.01342, URL https://arxiv.org/abs/2106.01342
- Sweeney [2017] Sweeney E (2017) Experts say ibm watson’s flaws are rooted in data collection and interoperability. URL https://www.fiercehealthcare.com/analytics/ibm-watson-s-flaws-trace-back-to-data-collection-interoperability
- Vaswani et al [2017] Vaswani A, Shazeer N, Parmar N, et al (2017) Attention is all you need. Advances in neural information processing systems 30
- Yin et al [2020] Yin P, Neubig G, Yih Wt, et al (2020) TaBERT: Pretraining for joint understanding of textual and tabular data. In: Proceedings of the 58th Annual Meeting of the Association for Computational Linguistics. Association for Computational Linguistics, Online, pp 8413–8426, 10.18653/v1/2020.acl-main.745, URL https://aclanthology.org/2020.acl-main.745
Appendix A Supplementary Experiment Information
In this appendix, we provide additional information on the Results section.
The following are the hyperparameters that we grid-searched to obtain the optimal XGBoost model:
-
•
Number of estimators: {100, 200, 300},
-
•
Maximum depth: {3, 5, 7},
-
•
Learning rate: {},
-
•
regularization parameter: {}.
| Table # | Table Meta Information | Example Columns |
|---|---|---|
| 1 | Lab values | Platelet, Sodium |
| 2 | Chart measurements | Respiratory rate, oxygen concentration |
| 3 | Counting statistics | Number of medications, number of orders |
| 4 | Current condition | Oxygen device, is in ICU |
| 5 | Historical patient record | Previous admission, previous length of stay |
| 6 | Non-patient-specific data | Day of the week, ward census |
| Prediction Task | Training | Testing |
|---|---|---|
| Discharge 24 hr | 572,964 | 265,917 |
| Discharge 48 hr | 572,964 | 265,917 |
| Enter ICU 24 hr | 385,132 | 180,075 |
| Leave ICU 24 hr | 73,013 | 34,669 |
| Enter ICU 48 hr | 292,659 | 138,947 |
| Leave ICU 48 hr | 68,472 | 33,011 |
| Expire 24 hr | 572,964 | 265,917 |
| Expire 48 hr | 572,964 | 265,917 |
| Mortality | 572,964 | 265,917 |