1]organization=Sabanci University, city=Istanbul, country=Turkey
1]organization=Huawei R&D Center, city=Istanbul, country=Turkey
[<tnote number>]
[<tnote number>]<tnote text>
url]<URL>
<Credit authorship details>
1]organization=Sabanci, addressline=, city=, postcode=, state=, country=
url]
<aff no>]organization=, addressline=, city=, postcode=, state=, country=
[1]Corresponding author
[1]
Measuring Gender Bias in Educational Videos: A Case Study on YouTube
Abstract
Students are increasingly using online materials to learn new subjects or to supplement their learning process in educational institutions. Issues regarding gender bias have been raised in the context of formal education and some measures have been proposed to mitigate them. However, online educational materials in terms of possible gender bias and stereotypes which may appear in different forms are yet to be investigated in the context of search bias in a widely-used search platform. As a first step towards measuring possible gender bias in online platforms, we have investigated YouTube educational videos in terms of the perceived gender of their narrators. We adopted bias measures for ranked search results to evaluate educational videos returned by YouTube in response to queries related to STEM (Science, Technology, Engineering, and Mathematics) and NON-STEM fields of education. Gender is a research area by itself in social sciences which is beyond the scope of this work. In this respect, for annotating the perceived gender of the narrator of an instructional video we used only a crude classification of gender into Male, and Female. Then, for analysing perceived gender bias we utilised bias measures that have been inspired by search platforms and further incorporated rank information into our analysis. Our preliminary results demonstrate that there is a significant bias towards the male gender on the returned YouTube educational videos, and the degree of bias varies when we compare STEM and NON-STEM queries. Finally, there is a strong evidence that rank information might affect the results.
keywords:
Gender bias\sepYouTube\sepEducational Videos \sepOnline Educationfigure[<options>]
1 Introduction
Stereotypes are defined as beliefs regarding the characteristics, attributes, and behaviors of members of certain groups (Hilton & Von Hippel, 1996). Such beliefs, referring to society’s stereotypes, often contain oversimplifications and prejudices about a specific group (Piatek-Jimenez et al., 2018). Gender stereotypes begin to develop in early ages and these stereotypes about science, technology, engineering and mathematics (STEM) have severe consequences for motivation towards STEM fields (McGuire et al., 2020). The early emerging gender stereotypes related to STEM are further strengthened in adolescence by the presence of male teachers and gender-imbalanced classrooms in STEM majors (Riegle-Crumb et al., 2017). A common stereotype is that STEM careers are for certain social groups such as European or American white males, (Bodzin & Gehringer, 2001; Barman, 1997) and this stereotype might signal to women and racial minority students that their group does not belong and is not successful in the STEM field (Good et al., 2012), thereby making them feel less welcoming, more insecure, and less motivated in STEM (London et al., 2011). Further, these stereotypes continue in the workplace and broader society, leading to the underrepresentation of woman in STEM fields (Piatek-Jimenez et al., 2018). For instance, in the UK only 22%, and in the US only 24% of the STEM workforce is constituted by women (Wise, 2018; Noonan, 2017).
Gender stereotypes are a common source of bias that emerge when an individual or a group is systematically treated favourably or unfavourably, referring to individual or group fairness respectively and there is a need to investigate gender representation in educational resources. In fact, the European Institute for Gender Equality states that gender stereotypes still exist in educational materials (EU, 2017). There are some guidelines on how to evaluate diversity in educational materials, for example Michigan in the United States issued a report in 2020 as a guidance for the experts in evaluating instructional materials in terms of bias (Center, 2020). These guidelines contain templates for scorecards to help the experts in their evaluation. Schools may try to implement the suggested guidelines and update/change their educational materials to mitigate the bias, but the problem may still persist since students are increasingly referring to online materials such as blogs, online educational websites, and YouTube videos. Nonetheless, gender seems to be an influential factor even in online search; it has been observed that university female students might be more readily to be affected by contexts than male students during online information seeking (Zhou, 2014). Thus, evaluating bias in online educational materials is very critical as well. According to recent studies, YouTube has been declared as the world’s second-most visited website and second-most used social platform worldwide (Aslam, 2021). In the third quarter of 2020 during the pandemic, YouTube had roughly 80% market penetration in the UK, outperforming Facebook, WhatsApp, Instagram, and Twitter by number of active users and it had the highest reach among users aged 15 to 25 with 82% of this demographic group (Ceci, 2021). Although YouTube is popular as an entertainment medium, it has become a valuable alternative learning resource to written textual content such as blogs (Chintalapati et al., 2016). Chtouki et al. (2012) report a study showing that visual explanations help students to understand and remember the complex concepts much better. These studies justify that YouTube has been a widely-used platform as well as an effective tool for improving student’s learning and engagement.
YouTube states that they audit their machine learning systems to avoid cases leading to gender discrimination (YouTube, 2018). However, this does not guarantee that the returned videos are not biased towards a specific gender. In this study, our aim is to investigate educational videos returned by YouTube in terms of possible gender bias via objective measures. We focus on group fairness since we investigate if the online materials are affected by societal stereotypes about gender in the context of education. Moreover in group fairness, we specifically focus on statistical parity, demographic parity or more generally known as equality of outcome, i.e. given a population divided into groups, the groups in the output of the system should be equally represented. In the scope of this work, equality of outcome is a more appropriate standard since we require equal gender representations in results. Our main aim in this study is to detect bias with respect to equality of outcome using the perceived gender of narrators in videos returned by YouTube in response to educational queries comprising of keywords regarding some educational field. For this purpose, we use educational queries that are derived from the course modules of STEM and NON-STEM fields.
Our contributions can be summarised as follows:
-
1.
We present two new measures of bias which are explained in Section 4.1 in detail that treat our two protected groups equal, and generate bias values which are symmetric and easy to interpret.
-
2.
We implement our bias measures to investigate possible perceived gender bias for educational searches in YouTube about different majors from STEM and NON-STEM fields.
-
3.
We also compare the relative bias for educational queries in YouTube from various majors from STEM and NON-STEM fields.
-
4.
We further incorporate rank information into the bias analysis to investigate if various rank values affect first the existence of bias, then difference in magnitude of bias between STEM and NON-STEM fields as well as in the same field.
2 Related Work
Before presenting our methodology for evaluating perceived gender bias in YouTube video results, we review the prior work related first to fair ranking evaluation, and second to search bias quantification.
2.1 Fairness in Ranking
Many recent studies have investigated two different notions of fairness as individual fairness and group fairness in ranked outputs. Individual fairness requires that similar individuals should be treated similarly, whereas group fairness requires that the disadvantaged group be treated similar to the advantaged group or the entire population (Dwork et al., 2012). Formal definitions of group fairness is composed of statistical parity, demographic parity or more generally known as equality of outcome (Dwork et al., 2012), and equality of opportunity (Hardt et al., 2016). Various fairness evaluation measures in ranked results have been proposed in the literature. Yang & Stoyanovich (2016) propose a synthetic ranking generation procedure and three measures inspired by utility-based information retrieval (IR) evaluation measures that are related to normalized Discounted Cumulative Gain (nDCG) in the scope of statistical parity. Zehlike et al. (2017) present an algorithm based on Yang & Stoyanovich (2016)’s work using statistical tests to produce and evaluate fair rankings. These measures are difficult to use in practice since they rely on a normalisation term which is computed stochastically, i.e. the notion of an ideal list for normalisation similar to nDCG, and they do not consider relevance which is crucial in search settings. Gezici et al. (2021) then improve these measures by addressing their limitations in the context of search results. In this work, we focus on perceived gender bias and propose two new bias measures that address the shortcomings of the measures proposed by Gezici et al. (2021). Our measures compute percentage scores of representation and exposure bias which are easy to interpret to assess equality of outcome in search results. Unlike Gezici et al. (2021), in both of our bias measures, we take into account the YouTube video results only annotated with male and female gender labels meaning that we compute the score of a male/female gender over the sum of male and female scores using the two proposed bias measures. In this way, difference in computed metric values which shows the inequality between the perceived gender groups becomes more significant and the scores of each gender group are symmetric around , which is the desired case. Additionally, in our exposure measure with logarithmic weighting we require a normalisation term for interpretable results, yet we do not include the notion of an ideal list that was used by the researchers in Yang & Stoyanovich (2016) since its definition differs with each ranked list in our dataset which is not practical to compute.
Geyik et al. (2019) present two measures in the scope of equality of opportunity, one of these measures is based on Yang & Stoyanovich (2016)’s measures and the other one compares the representation of a gender group in a given list with respect to the entire population. Lipani et al. (2021) propose a measure which compares the representation of a categorical sensitive attribute in result documents with all the documents indexed by the search system. Gómez et al. (2021) propose two measures which evaluate a given ranked list in terms of representation, i.e. proportion without including rank information, and exposure, i.e. incorporating stronger rank information with logarithmic weighting; both measures compare the given list with the full dataset. Thus, unlike us, Gómez et al. (2021); Geyik et al. (2019); Lipani et al. (2021) propose measures to achieve equality of opportunity, yet the measures are computed on search results in Geyik et al. (2019); Lipani et al. (2021), while in Gómez et al. (2021) they are applied in recommendation settings. As discussed in Section 1, our methodology implements equality of outcome in search settings instead, since we analyse gender equality in the context of online educational materials. This requires that narrators should be treated equally regardless of their gender which is a sensitive attribute that should not affect the decision of the ranking algorithm.
2.2 Bias Quantification in Search
Although the algorithms of search platforms are not transparent to researchers, auditing techniques can help us to reveal biases to which users are being exposed without even being aware of the existence of bias. Moreover, it was shown that people are more susceptible to bias when they are unaware of it (Bargh et al., 2001). Thus, there have been several attempts to audit bias on web search for a variety of topics, for instance Diakopoulos et al. (2018); Robertson et al. (2017); Epstein & Robertson (2015); Robertson et al. (2018a, b); Hu et al. (2019) particularly focus on partisan bias in search results. Apart from partisan bias, recent studies have investigated gender bias in search. Chen & Yang (2006) examine gender bias in various resume search engines using a regression analysis in the context of individual and group fairness and found that there is a significant and consistent group unfairness against female candidates. Using a similar approach, Hannák et al. (2017) investigate perceived gender and race bias in two prominent online freelance websites to capture correlations between the profile features of workers and their reviews/ratings as well as their search rank position. They found that perceived gender and race bias are negatively correlated with search rank in one of these freelance websites. Kay et al. (2015) investigate the gender bias in image search results for a variety of occupations by only applying statistical significance tests without modelling the bias problem in the context of search and revealed that image search results exaggerate gender stereotypes and display the minority gender rather unprofessionally. Similarly, Singh et al. (2020) examine the image-based representation of highly gender-discriminated professions, e.g. nurse, computer programmer, in four digital platforms by simply comparing the ratio of male and female images in those platforms with the national labor statistics and found that women are largely underrepresented. Likewise, Otterbacher et al. (2017) inspect gender stereotypes by directly computing the gender proportions in image search results returned by Bing without proposing any specific measures and showed that photos of women are more often retrieved for ‘emotional’ and similar traits, whereas men for ‘rational’ and related traits. In a follow-up work, by using a regression analysis the authors showed that sexist people are less likely to detect and report gender biases in search results (Otterbacher et al., 2018). In addition to these studies which view gender bias in the context of search, some researchers also examine the relationship between how the course is displayed, i.e. the course is presented with a gender-inclusive photo, descriptions that contain more negative sentiment etc. which are the psychological cues, and the enrollment/engagement of different genders to STEM courses in online learning platforms (Kizilcec & Saltarelli, 2019; Kizilcec & Kambhampaty, 2020; Brooks et al., 2018).
Users typically pay more attention to top positions in a ranked list of search results which is called position bias and this phenomenon leads users to click those top positions with greater probability (Joachims et al., 2005). Therefore, if search results are biased then users will be affected due to search engine manipulation effect (SEME) (Epstein & Robertson, 2015) and the impact is high if top positions are more biased. Since users tend to click the top positions with higher probability, this implicit user feedback will be logged, then fed to the ranking algorithm which will probably cause users to be exposed to an even higher bias – societal biases will be reinforced in the search results. Thus, even if the bias comes from the data itself, search platforms should still be responsible for mitigating it. As stated by Culpepper et al. (2018), an information retrieval system should be fair, accountable, and transparent. For preventing the severe consequences of bias in society, the first step is to reveal it, which is our main focus in this work, thereby further alerting users which could be effective in suppressing search engine manipulation effect (Robertson et al., 2017).
3 Preliminaries and Research Questions
We assume a scenario where a query such as "Gravity" or "Python Programming" is issued to YouTube and a result page with a list of videos is returned in response to the query. We call such queries educational queries and we use the abbreviation of YVRP for the YouTube video result page for a given query throughout the paper. We consider the gender of the narrator in this work and our first task is to label the videos with respect to the perceived gender of the narrator. A perceived gender label can have the following values:
male, neutral, female, not-relevant, and N/A with respect to the viewer’s overall perception and their meanings are as follows:
-
•
male () If the video is mostly narrated by people whose gender is perceived as male;
-
•
neutral () When the video does not favour either male or female gender in narration. Therefore, the video does not help the viewer to infer any gender dominance;
-
•
female () If the video is mostly narrated by people whose gender is perceived as female;
-
•
not-relevant () when the video is not-relevant with respect to the educational query;
-
•
N/A () When the annotation is not applicable for the video – the video is not in English or it has been removed from the system, or there is no narrator.
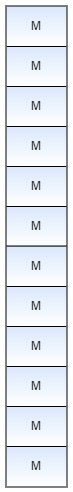
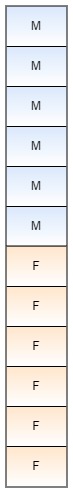
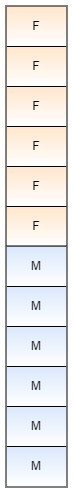
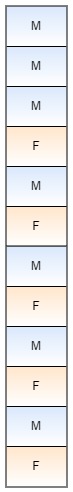
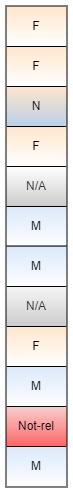
A YVRP contains 12 video links. In Figure 1(e) we provide different ranked lists of labelled results. In Figure 1(e) (a) the perceived gender of all the narrators is labelled as male which demonstrates a clear bias. In Figure 1(e) (b) and (c) half of the perceived genders are male and half of them are female however in Figure 1(e) (b) the top 6 ranked videos are labelled as male while in Figure 1(e) (c) the top 6 are labelled as female. In Figure 1(e) (d) there is no obvious bias, while in the videos of Figure 1(e) (e) we have neutral, not-relevant, and N/A labels which further complicate the bias evaluation. We need to issue many and different queries and evaluate the results for possible bias before we reach a conclusion. The first research question we aim to answer is:
- RQ1:
-
On a perceived male-female binary gender space, does YouTube return biased YVRPs in response to various educational queries?
There are different fields of education which are broadly categorized as STEM and NON-STEM where the number of female students in some STEM fields has been considerably less than the males. Our second research question is:
- RQ2:
-
Is there a significant difference in perceived gender bias in YVRPs returned in response to STEM vs. NON-STEM educational queries?
We provide bias evaluation measures that take into account the rank of the results. One of the measure looks at the top results in comparison to the rest of the 12 results, where is the cut-off value. For example in the videos of Figure 1(e) (d) when we have a cut-off value of 3, there will be a significant difference in bias in top 3 vs top 12. Our third research question is:
- RQ3:
-
Do different cut-off values affect the existence of perceived bias and magnitude of bias difference between STEM and NON-STEM fields?
Finally, in addition to the impact of different cut-off values on the existence of perceived bias in STEM and NON-STEM fields, we further examine how the cut-off values influence on the magnitude of bias in each field. Our last research question is:
- RQ4:
-
Do different cut-off values affect the magnitude of perceived bias of STEM and NON-STEM fields?
4 Gender Bias Evaluation Methodology
In this section we describe our perceived gender bias evaluation methodology with the gender binary assumption. We present two measures of bias and a protocol to identify possible bias with respect to those measures.
4.1 Measures of Bias
Let be the set of educational queries about major areas of study in STEM and NON-STEM fields. When a query is issued to YouTube, YouTube returns a YVRP . We define the perceived gender of the -th retrieved video with respect to as . For reference, Table 2 shows a summary of all the symbols, functions and labels used throughout the paper.
For satisfying the group fairness criterion of equality of outcome, male and female genders should be equally represented in the retrieved YouTube videos. In the scope of perceived gender bias analysis, we can mention the existence of bias in a ranked list of videos retrieved by YouTube, if the perceived gender representation significantly deviates from equal representation. Thus, we need to measure the difference between the representation of two genders, which we indicate here as male and female.
| Symbols | |
| set of queries. | |
| a query . | |
| a ranked list of the given YVRP (list of retrieved videos). | |
| the video in retrieved at rank . | |
| size of (number of videos in the ranked list). | |
| number of videos considered in (cut-off). | |
| number of videos in which are annotated as male or female (excluding neutral, not-relevant, and N/A). | |
| Functions | |
| returns the label associated to . | |
| an evaluation measure for YVRPs. | |
| Labels | |
| perceived male gender. | |
| perceived neutral gender. | |
| perceived female gender. | |
| not-relevant wrt a query. | |
| N/A - gender annotation is not applicable. |
Formally, we measure the perceived gender bias in a YVRP as follows:
| (1) |
where is a function that measures the likelihood of in satisfying the information need of the user about the perceived gender of male () and female (). When = 0 we consider that to be bias-free. When > 0, the YVRP is biased towards male (), with maximal bias when = 1. When < 0, then the YVRP is biased towards female (), with maximal bias when = -1.
For the function , we propose two novel bias measures in the scope of equality of outcome. Please note that only the videos annotated with the perceived gender labels of male () and female (), that are relevant to the query, are taken into account. We discard the videos for which returns neutral (), not-relevant (), or N/A (). Note that, returns the label of video specifying its gender group. Based on this, refers to a conditional statement which returns 1 if the video is annotated as the member of and 0 otherwise. The two new measures of representation and exposure are denoted by and respectively. The measure of deals with the bias in gender proportion, while aims to reveal the bias caused by exposure effects, i.e. attention received by ranked items. Our first measure of bias, which is interpreted with respect to the perceived gender label of male as follows:
| (2) |
| (3) |
Although the first bias measure of is very intuitive, it is insensitive to the rank positions since all the search results in the first documents contribute to the bias score equally, regardless of their rank positions. Thus, we propose the second measure of to address this issue by defining a discount function based on rank which helps us to include a strong concept of ranking information in our bias analysis. Our logarithmic discounting method is inspired by the weighted discount mechanism of nDCG which is a widely used utility-based IR metric. Our new measure of computes the exposure percentage which belongs to each gender group of male and female. The proposed measure of which is interpreted with respect to the perceived gender label of male as follows:
| (4) |
| (5) |
The scores of the proposed measures are easy to interpret, for a given ranked list the scores of each gender group sum up to 1. If we interpret the bias scores with respect to the equal representation using , then we can infer which gender group is more/less represented than the desired representation. Same applies to the exposure measure, . For interpreting the results, if we subtract the value of which is the desired case, from the measure scores, then the remaining bias scores of male and female are symmetric. Same holds for the exposure measure. These bias measures are calculated for the sample ranked lists in Figure 1(e) as follows:
-
•
In Figure 1(e) (a), the perceived gender of all the narrators are labelled as male. For this ranked list , = , whereas = , thereby = which is the maximal bias. Same exposure bias score is computed for this ranked list.
-
•
In Figure 1(e) (b), half of the perceived genders are male and the top 6 ranked videos are labelled as male. For this ranked list , = and = , thus = indicating no representation bias. On the other hand, = and = , thus = . Since the first measure only looks at the proportion of gender groups in the given ranked list without taking into account the rank information, no representation bias is observed. However, using the second measure which uses rank information with a logarithmic discount function, it can be seen that there exists an exposure bias towards the male gender since > 0.
-
•
In Figure 1(e) (c), again half of the perceived genders are male however unlike Figure 1(e) (b), the top-6 ranked videos are labelled as female. For this ranked list , our representation bias measure computes the same scores with the ranked list in (b) as = and = , thus = showing no representation bias. On the other hand, = , whereas = , thus = . As with the ranked list in (b), there does not exist representation bias since = , while there exists an exposure bias towards the female gender since < 0.
-
•
In Figure 1(e) (d), the ranked list contains almost the same number of male and female perceived gender labels, yet in the top-3 all the narrators are labelled as male. For this ranked list , = , whereas = , thereby = indicating a low representation bias, very close to the bias-free case. On the other hand, = , whereas = , thus = revealing a higher bias in exposure than the representation. In this case, a higher exposure bias is observed bias since the exposure measure takes into account the rank information. Moreover, if bias is measured for different cut-off values, then various level of bias might be obtained in representation and exposure. For instance, let’s only look at the top-3 positions in the ranked list , where = . Then, = and = , thus = which is the maximal bias in comparison to the full list. Similarly, = which is the maximal bias for exposure as well.
-
•
In Figure 1(e) (e), the ranked list contains the same number of male and female perceived gender labels, yet female gender appears more in the top positions. Additionally, unlike the previous lists this ranked list contains neutral, not-relevant, and N/A. Since the perceived gender labels of neutral, not-relevant, and N/A do not contribute to detect gender bias, these labels are not included in our computations. Therefore, for this ranked list , = and = , thus = , no representation bias. This is because if the aforementioned labels are discarded, the ranked list turns into the same lists as in (b) and (c). On the other hand, = , while = , thus = which indicates that there is an exposure bias. Similar to the ranked lists in (b) and (c), no representation bias is observed since = , whereas there exists an exposure bias towards the female gender since < 0.
These computations demonstrate that both of the proposed measures are necessary since they provide different types of information for the analysis. Moreover, the findings show that the magnitude of bias we observe differs with different cut-off values (), therefore we will use various values of in Section 5. Since users tend to pay more attention to the top positions in search results, the impact of higher bias in these positions could be more severe in the scope of gender equality. In addition to the bias computations, for interpreting the bias scores in representation, we can subtract the value of to obtain the relative representations of male and female in a ranked list . For instance, in Figure 1(e) (d), we obtained = and = for male and female gender labels respectively. Thus, if we subtract the value of , we obtain for male and for female which means that the male gender is represented 8% more, and the female gender is represented 8% less than the equal representation. Similarly, we obtained = and = for male and female gender labels respectively and if we subtract the value of , we obtain for the male and for female genders. From this, we can infer that the male gender obtains 17% more exposure while the female gender gets 17% less exposure than the desired case.
After the computation of representation and exposure bias scores, we compute the mean bias (MB) and mean absolute bias (MAB) of these measures over a set of queries in the dataset to aggregate the bias results. MB score of STEM field computes a mean value over all the STEM queries’ scores for the corresponding measure, whereas MAB computes a mean value over all the absolute value of the measure scores for the STEM queries. Note that MB shows towards which perceived gender the results are biased and MAB solves the limitation of MB if different queries have bias contributions with opposite signs and cancel each other out. Thus, MB and MAB measures are complementary for aggregating the results and interpreting those results in a proper way.
Please note that in the scope of this work, we assign the gender label of a given video merely based on the narrators’ perceived gender and we make gender binary assumption. However, our definitions and thereby our measures of bias can easily be applied to studies where the gender label is defined in a more refined manner. Labels can also be assigned based on the male/female dominance, similar to the viewpoints presented by Draws et al. (2021). Yet, in the scope this work, we accept the perceived gender label as binary for the preliminary results. Moreover, the proposed measures are also suitable for studies that use similar categorical features like age, education, ethnicity, or geographic location (Lipani et al., 2021) and seek for demographic parity specifically, in search settings.
4.2 Quantifying Bias
Using the measures of bias defined in Section 4.1, we quantify the perceived gender bias of STEM and NON-STEM fields in YVRPs returned in response to the educational queries in various majors, and we compare them. We describe our methodology for quantifying perceived gender bias.
-
•
Collecting YVRPs. We obtained the educational queries issued for searching in YouTube from TheUniGuide 111https://www.theuniguide.co.uk/. TheUniGuide is a free university advice service which is part of The Student Room 222Free student discussion forum in UK that helps students make more informed decisions about their higher education choices. We submitted each query to YouTube using a UK proxy in incognito mode and crawled the top-12 video results returned by YouTube. Note that the data collection process was done in a controlled environment such that the queries are sent to YouTube by avoiding long time-lags. After the crawling of all the YVRPs related to the majors in both STEM and NON-STEM fields, we labelled them. We annotated the perceived gender label of each video with respect to the educational queries by analysing the gender(s) of the narrator(s) from the viewer’s perspective.
-
•
Bias Evaluation. We compute the bias scores for every YVRP with two new bias measures with three different cut-off values: and for = , , . We then aggregate the results using the MB and MAB. Then, we first examine the existence of bias for each field, further compare the bias results of STEM and NON-STEM fields with different measures and cut-off values. Finally, we investigate the impact of different cut-off values on bias scores of STEM and NON-STEM fields.
-
•
Statistical Analysis. To identify whether the bias measured is not due to noise, we compute a one-sample t-test: the null hypothesis is that no difference exists and that the true mean is equal to zero. Note that since our sample size is sufficiently large (> 30), according to the central limit theorem the sampling distribution is considered normal (Kwak & Kim, 2017). If this hypothesis is rejected, hence there is a significant difference and we claim that the YVRPs of the evaluated field, STEM or NON-STEM is biased. We compare the difference in bias measured across the two fields using a two-tailed independent t-test since we have a different set of queries for each field: the null hypothesis is that the difference between the true means of the two independent groups is equal to zero. If this hypothesis is rejected, hence there is a significant difference, we claim that there is a difference in bias between the two fields. The acceptance or rejection of the null hypothesis is fulfilled based on the p-values. Note that before applying the two-tailed independent t-test, we do not check if the two samples have equal or unequal variances, but rather directly use the independent t-test with unequal variances (Delacre et al., 2017). Nonetheless, in the context of our analysis, it seems that independent t-test with equal or unequal variances do not make a noticeable difference in p-values based on our initial analysis. In addition to the statistical significance, namely p-values, we report effect sizes using Cohen’s d. Statistical significance in our analysis helps us examine whether the findings show systematic bias or they are the result of noise, whereas effect sizes provide information about the magnitude of the differences which makes both p-values and effect sizes complementary for the interpretation of our results.
Apart from these, to investigate the effect of different cut-off values on bias results in the same field, STEM or NON-STEM, we compute a two-tailed paired t-test since in this analysis we examine the same query set only with different cut-off values. Moreover, we further apply Bonferroni correction (Sedgwick, 2012) for multiple hypothesis testing since there are 24 hypotheses in total in the context of cut-off value analysis. Thus, without the Bonferroni correction, with the significance level, and 24 hypotheses, the probability of identifying at least one significant result due to chance is around which means that the results could be misleading. Based on these, we further apply the Bonferroni correction for more reliable results in the scope of the cut-off value analysis in Section 5.2. Note that for the significance level where , and with the Bonferroni correction new . Thus, Bonferroni correction rejects the null hypothesis for each p-value () if <= instead of .
| STEM | Course Modules | NON-STEM | Course Modules | ||||
| Biology | Biochemistry | Evolution and biodiversity | Marine and terrestrial ecology | English Language and Literature | Explorations in literature | Chaucer: texts, contexts, conflicts | Shakespeare in performance english language and literature |
| Plant science in biology | Human physiology | Habitat ecology in biology | Renaissance literature | Modernist fiction | Creative writing: drama | ||
| Environmental issues | Molecular methodology for biologists | Cell structure and function | British romanticism | Literary and cultural theory | Stylistics in literature | ||
| Principles of genetics | Aspects of modernism in literature | ||||||
| Chemistry | Solid state chemistry | Shapes, properties and reactions of molecules | Organic and biological chemistry | Politics | Central themes in political thought | Modern British politics | Capital labour and power: Britain 1707-1939 |
| Chemistry for the physical sciences | Molecular pharmacology | States of matter in chemistry | The holocaust in politics | War in the industrial age politics 333Total War in the modern era | Freedom, power and resistance: an introduction to political ideas | ||
| Chemistry of materials | Inorganic chemistry | The global Earth system | International politics | Making of the modern world in politics | The political economy of development | ||
| Mineralogy and petrology (typo exists in the original query) | Comparing extremism in European liberal democracies | ||||||
| Computer Science | Organisational behaviour in practice | Principles of programming | Data management in computer science | Psychology | Cell biology in psychology | Mind and behaviour | Exploring effective learning in psychology |
| Mathematics for computer science | Languages and computability | Fundamentals of Computer Design 444Fundamentals of Design | Experimental methods and statistical | Individual and social processes | Development psychology | ||
| Personal Computer technology 555PC technology | Image processing | Software systems development in computer science | Brain and cognition in psychology | Social psychology | Humans in biological perspective in psychology | ||
| Human computer interaction | Evolution and behaviour in psychology | ||||||
| Mathematics | Calculus | Algebra | Structured programming | Public Relations | Business strategy | Internal corporate communication | Social media or public relations |
| Algorithms and applications | Coordinate and vector geometry | Differential equations | Work and organisational change | Behavioural science 666Human behaviour | Management in context | ||
| Probability | Regression and anova | Analytical and computational foundations in maths | Work experience in public relations 777Transition to work | Business fundamentals | Managing the brand | ||
| Problem solving methods in maths | Design in marketing | ||||||
| Physics | Laboratory physics | Contemporary physics | Mathematical techniques in physics | Sociology | Observing in sociology | Urban sociology | Understanding deviance and social problems in sociology |
| Quantum physics | Newtonian and relativistic mechanics | Fabric of physics | Individual and society | Applied ethics | Media and crime in sociology | ||
| Plasma and fluids in physics | Special and general relativity | Analysing the nanoscale and magnetism | Nature and society in sociology | Sexuality and social control in sociology | Contemporary work and organisational life in sociology | ||
| Stellar physics | Mobilisation, social movements and protest in sociology | ||||||
5 Experimental Setup
In this section we provide a description of our experimental setup based on the proposed methodology as defined in Section 4. We initially provide information about the dataset and the annotation process. Then, we show our perceived gender bias results and discuss them.
5.1 Dataset Preparation
In this work, we aim to mimic a user scenario in which the user is trying to decide on his/her major through searching educational queries or course modules of various majors on YouTube. Thus, we designed our study accordingly and obtained all the educational queries from TheUniGuide. The first reason why we chose TheUniGuide is that when we searched a query of "university chemistry courses" in incognito mode with a UK proxy to construct the set of educational queries for chemistry, TheUniGuide appears as the top result in Google search. Second, the other search results were mainly the official pages of different universities about the corresponding major and we did not want to select the curriculum information of a specific university. Third, we examined the webpages for different majors from STEM and NON-STEM fields and observed that TheUniGuide website provides comprehensive information about a major 888For the major of ”chemistry”, please go to https://www.theuniguide.co.uk/subjects/chemistry..
We selected 5 STEM majors which are chemistry, physics, biology, maths, and computer science, and 5 NON-STEM majors which are sociology, psychology, politics, public relations, and English language and literature. We selected these majors since we believe that they span distinct areas in STEM and NON-STEM fields which might have different male/female gender proportions. Initially, we crawled the course modules of each selected major from TheUniGuide. We used a UK proxy, the YouTube desktop version in incognito mode and the region was set as UK, language as English automatically and the other settings were left as default. In the scope of this work, since personalised search might complicate the bias analysis, we decided to design our analysis in unpersonalised search settings. In our initial design, we included top-12 relevant videos and recommended videos by YouTube. However, we observed that the recommended video results were not context-specific about the issued query. Thus, we changed the data crawling process, decided to crawl only relevant YVRPs for a given query and obtained all the course modules from TheUniGuide to use them as user queries. Note that TheUniGuide has 10 course modules for each major, thus each STEM and NON-STEM fields has 50 queries and 50 ranked lists in total. Since we only crawled the top 12 relevant YVRPs per query, for each course module/query we obtained 12 video URLs and for each major we obtained 120, thus crawling the 1200 video URLs in total.
| MB | STEM | 0.6200*** | 0.5460*** | 0.5558*** | 0.6012*** | 0.5541*** | 0.5600*** | ||||||
| NON-STEM | 0.3067*** | 0.2820*** | 0.3266*** | 0.3083*** | 0.2880*** | 0.3144*** | |||||||
| p-value | |||||||||||||
| effect size d | |||||||||||||
| MAB | STEM | 0.7000*** | 0.5940*** | 0.5794*** | 0.7136*** | 0.6225*** | 0.5877*** | ||||||
| NON-STEM | 0.5467*** | 0.4767*** | 0.4808*** | 0.5566*** | 0.4683*** | 0.4449*** | |||||||
| p-value | |||||||||||||
| effect size d |
Additionally, for some queries YouTube did not return relevant video results in the educational context, therefore we slightly modified the queries/course modules as highlighted by red color in Table LABEL:tab:dataset_new. For the majority of the queries, we took them as they are written in TheUniGuide with lowercase/uppercase letters as well as punctuation symbols to avoid injecting our personal bias. For the rest, if we observed that YouTube did not return context-specific video results in response to the original query, we slightly modified the original query solely by adding the context/major field information as displayed in Table LABEL:tab:dataset_new. If this solution was not sufficient, then we had to change the query itself to specify the context properly. For instance, for the original query of Human behaviour, YouTube returned the music videos of Björk, an Icelandic singer, therefore we paraphrased those queries. We first collected sufficient information on the Web to change those queries properly to obtain more context-specific results. In this way, we believe that our search scenario became more realistic in the educational context which can help us to better detect perceived gender bias that the user is exposed to in real world. For the sake of reproducibility, the annotated dataset is publicly available at https://github.com/gizem-gg/Youtube-Gender-Bias.
| STEM | NON-STEM | STEM | NON-STEM | STEM | NON-STEM | ||||||||
| MB | 0.6200*** | 0.3067*** | 0.5460*** | 0.2820*** | 0.6200*** | 0.3067*** | |||||||
| 0.5460*** | 0.2820*** | 0.5558*** | 0.3266*** | 0.5558*** | 0.3266*** | ||||||||
| p-value | |||||||||||||
| 0.6012*** | 0.3083*** | 0.5541*** | 0.2880*** | 0.6012*** | 0.3083*** | ||||||||
| 0.5541*** | 0.2880*** | 0.5600*** | 0.3144*** | 0.5600*** | 0.3144*** | ||||||||
| p-value |
| STEM | NON-STEM | STEM | NON-STEM | STEM | NON-STEM | ||||||||
| MAB | 0.7000*** | 0.5467*** | 0.5940*** | 0.4767*** | 0.7000*** | 0.5467*** | |||||||
| 0.5940*** | 0.4767*** | 0.5794*** | 0.4808*** | 0.5794*** | 0.4808*** | ||||||||
| p-value | |||||||||||||
| 0.7136*** | 0.5566*** | 0.6225*** | 0.4683*** | 0.7136*** | 0.5566*** | ||||||||
| 0.6225*** | 0.4683*** | 0.5877*** | 0.4449*** | 0.5877*** | 0.4449*** | ||||||||
| p-value | .001 |
| 0.4333 | 0.5667 | 0.7667 | 0.7333 | 0.5667 | 0.6333 | 0.3667 | 0.3000 | -0.1667 | 0.4333 | ||
| 0.2833 | 0.5033 | 0.5533 | 0.7667 | 0.6067 | 0.7033 | 0.3833 | 0.3400 | -0.1667 | 0.1667 | ||
| 0.2061 | 0.5699 | 0.5930 | 0.6833 | 0.7098 | 0.7722 | 0.3701 | 0.3619 | -0.0466 | 0.1809 | ||
| 0.4524 | 0.5235 | 0.7366 | 0.7631 | 0.5007 | 0.5831 | 0.3765 | 0.2656 | -0.1696 | 0.5088 | ||
| 0.3523 | 0.4846 | 0.5858 | 0.7762 | 0.5527 | 0.6446 | 0.3857 | 0.3022 | -0.1681 | 0.2908 | ||
| 0.2736 | 0.5451 | 0.6031 | 0.7119 | 0.6478 | 0.7138 | 0.3781 | 0.3241 | -0.0917 | 0.2560 |
As for the annotation procedure, a video in a YVRP is annotated based on its relevancy with respect to the given query as relevant, not-relevant, or N/A. If the video is relevant to the given query, then its narrators’ gender perceived by the viewer is annotated using the gender labels of male, female, or neutral. Before the annotation of the actual dataset, as two annotators we initially annotated the dataset of top-12 relevant YVRPs in which we crawled for the first user study. Then, we modified the design of our study and, thus the data crawling procedure. Nonetheless, we computed inter-rater agreement score which is calculated as a percentage of agreement between two annotators. We examined pairwise agreement; enter 1 if there is agreement and 0 if there is no agreement. After that, we calculated the mean of the fractions and the inter-rater agreement score for our initial study on the top-12 relevant YVRPs was over 0.90. Since the inter-rater agreement score is high, it shows that the annotation procedure does not prone to disagreements due to the simplicity of the task and does not require expert knowledge. Thus, the labelling has been fulfilled using a single annotator. Conditions of annotating a video with these labels are detailed in Section 3.
5.2 Results & Discussion
Initially, we verify if the YVRPs are biased using our representation and exposure measures (RQ1). If so, we then investigate if the YVRPs returned in response to the educational queries of STEM and NON-STEM fields suffer from a different level of bias (RQ2) by examining if the difference between the bias scores of the corresponding YVRPs are statistically significant. In Table 4, all MB scores are positive and regarding the RQ1, the YVRPs of STEM and NON-STEM fields are both biased. We applied the one-sample t-test on MB scores to check the existence of bias and these biases are statistically significant – there exists a systematic gender bias, i.e. preference of one gender over another, with p-value < .001. These results indicate that both STEM and NON-STEM fields are biased towards the male gender (all MB scores are positive). Based on MAB scores, we can observe that the YVRPs of both STEM and NON-STEM fields suffer from an absolute bias. Regarding the RQ3, we first investigate if different cut-off values have an impact on the existence of bias and further if those cut-off values affect the magnitude of bias difference between STEM and NON-STEM fields. These findings indicate that both STEM and NON-STEM fields are biased regardless of the cut-off values, yet cut-off values might impact on the magnitude of bias difference between the two fields. Lastly, we further investigate the effect of different cut-off values on the magnitude of bias in the same field of STEM or NON-STEM (RQ4).
In Table 4, the difference between the MB scores of two fields is shown to be statistically significant with the two-tailed independent t-test for the measures and regardless of the cut-off value and in terms of the magnitude, gives the highest difference in bias with the effect size of (RQ2). Unlike MBs, the difference between the MAB scores of two fields is shown to be statistically significant on , i.e. top 3 videos returned, with p-value = and statistically not significant on and . On the other hand, the difference between the MAB scores of two fields is shown to be statistically significant on the exposure measure across all three cut-off values with p-value = , , respectively for = , , (RQ2). These findings about MABs and the different user search scenarios that are modelled by the two bias evaluation measures suggest that the perceived gender bias to which the users are exposed may change based on their behaviour. A user that always reviews the first 6 or 12 results (as modelled by and ) might perceive the same gender bias between the YVRPs of STEM and NON-STEM fields. Yet, a less systematic user, which just reviews the top results, might perceive that STEM field is more biased than NON-STEM field – see the MAB scores of and for = , , in Table 4 (RQ3). Note that the exposure measure generally shows a higher difference in bias with bigger effect sizes since it is more sensitive to rank information. In addition to these, unlike MAB scores we observe significant difference in MB scores of STEM and NON-STEM fields across all measures with higher difference in magnitude (bigger effect sizes). These empirical findings imply that the NON-STEM field is biased for some educational queries towards the male gender and for others towards the female gender – they possibly cancelled each other out. Although the same situation applies to the STEM field, it seems that STEM has less number of queries that are biased towards the female gender – MB and MAB scores of STEM field are more similar.
In Table 5 and 6, we investigate if different cut-off values affect the magnitude of perceived bias in STEM and NON-STEM fields for the MBs and MABs of representation and exposure measures (RQ4). In Table 5, we observe that magnitude of bias does not differ with various cut-off values on the MB scores. The differences between the MB scores of each field with different cut-off values are shown to be statistically not significant with the two tailed paired t-test. Similarly, in Table 6, the differences between the MAB scores are statistically not significant, except the difference between the MABs of STEM field for the measures and which is statistically significant, i.e. p-value < due to Bonferroni correction.
Lastly, in Table 7 we investigate which majors show the highest/lowest bias in STEM and NON-STEM fields. The empirical findings indicate that Biology is biased on both measures towards the male gender which shows the lowest bias score in STEM field and different cut-off values do not affect this. Unlike Biology, different measures and cut-off values change the major which shows the highest bias score towards the male gender. For the exposure measure, Mathematics (a.k.a Maths) is also biased towards the male gender and shows the highest bias score regardless of the cut-off values. On the other hand, for the representation measure the major with the highest bias score depends on the cut-off value. For = , Computer Science (a.k.a CS) is the major showing the highest bias score, while for = , Mathematics (a.k.a Maths) as in the case of exposure measures, and for the full list Physics shows the highest score, where = 12. Nonetheless for the NON-STEM field, the majors showing highest/lowest bias scores change neither with different measures nor cut-off values. Among the majors in NON-STEM field, Public Relations (a.k.a Pub. Rel.) shows the lowest bias which is the only major that is biased towards the female gender, whereas English Language and Literature (a.k.a Eng. Lan. Lit.) shows the highest bias score which is biased towards the male gender like majority of the majors in STEM and NON-STEM fields.
Moreover, the majors showing the highest bias in STEM field seem to be more biased in absolute value (magnitude) on average than their counterparts in NON-STEM field. Similarly, Biology shows higher bias scores on average than Public Relations (a.k.a Pub. Rel.) when we compare the absolute value of their scores. These results seem to be consistent with our aforementioned findings in Table 4 that STEM field is more biased which is towards the male gender. Also, these empirical findings in Table 7 support our implication that the YVRPs of some majors in NON-STEM field are biased towards the male, while others towards the female gender. Furthermore, the bias scores of majors in STEM field are more similar – standard deviation is smaller than the majors in NON-STEM field, i.e. average standard deviation is for STEM majors while for NON-STEM. Finally, looking at the major-specific bias scores we can observe that there exists a noticeable bias towards the male gender, even if Public Relations (a.k.a Pub. Rel.) seems to be biased towards the female gender, yet unlike STEM majors it does not show a strong bias.
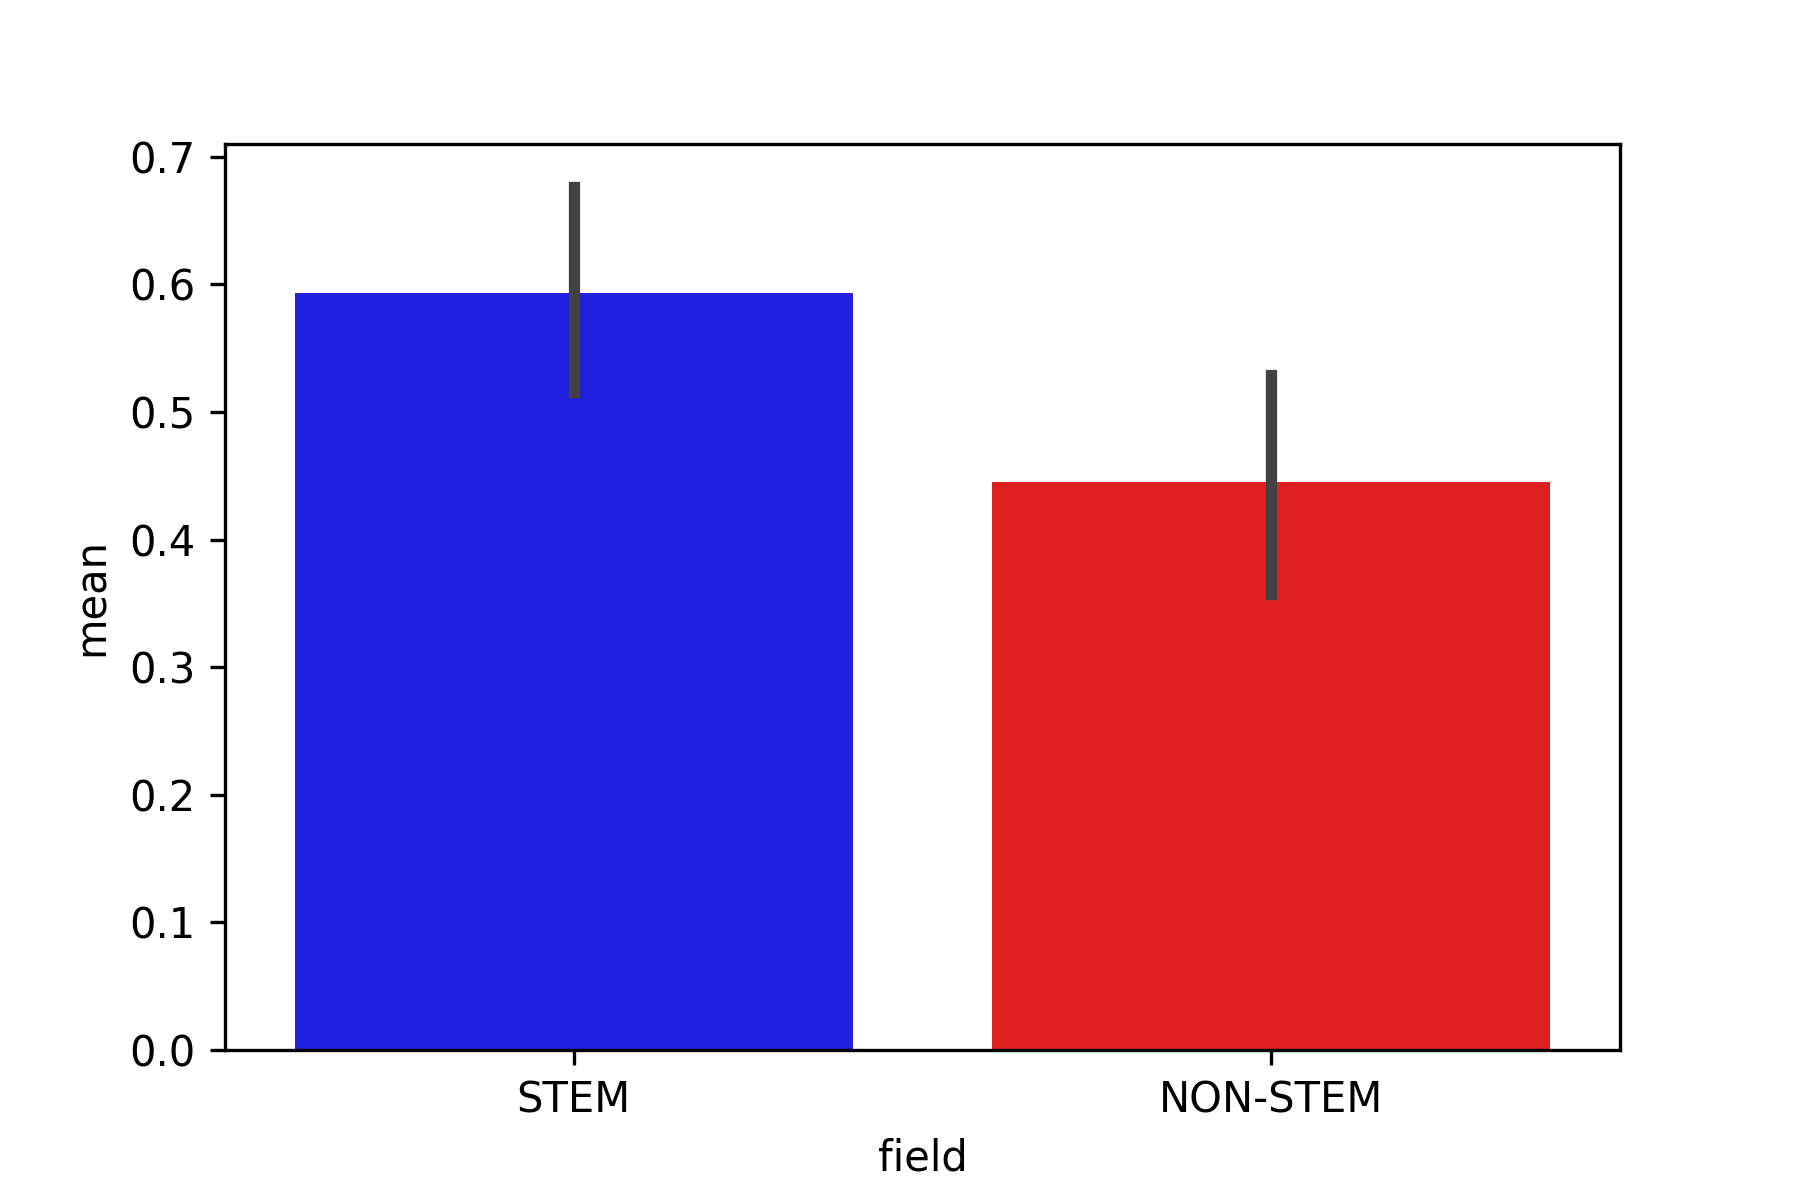
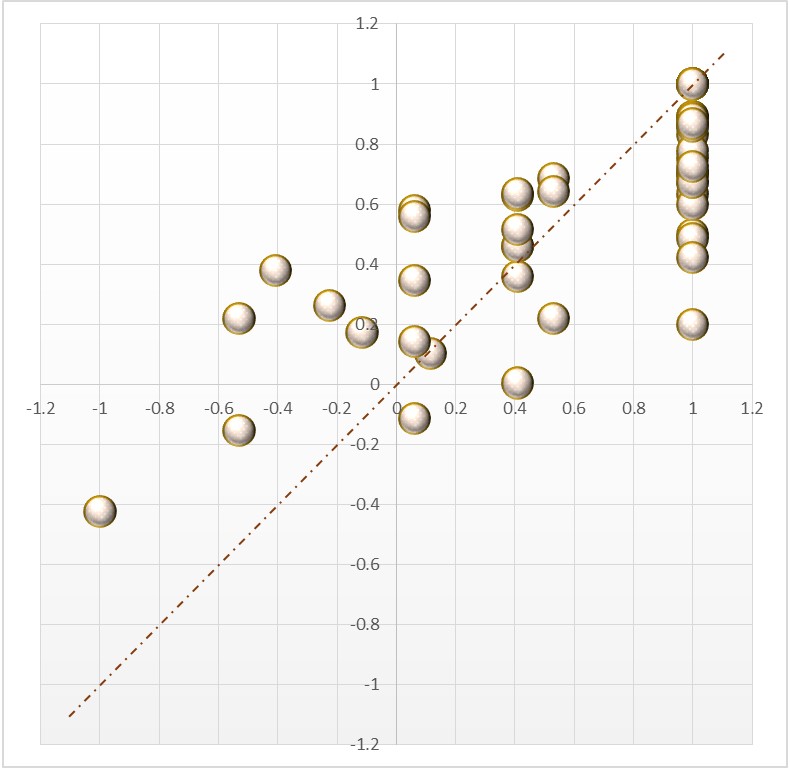
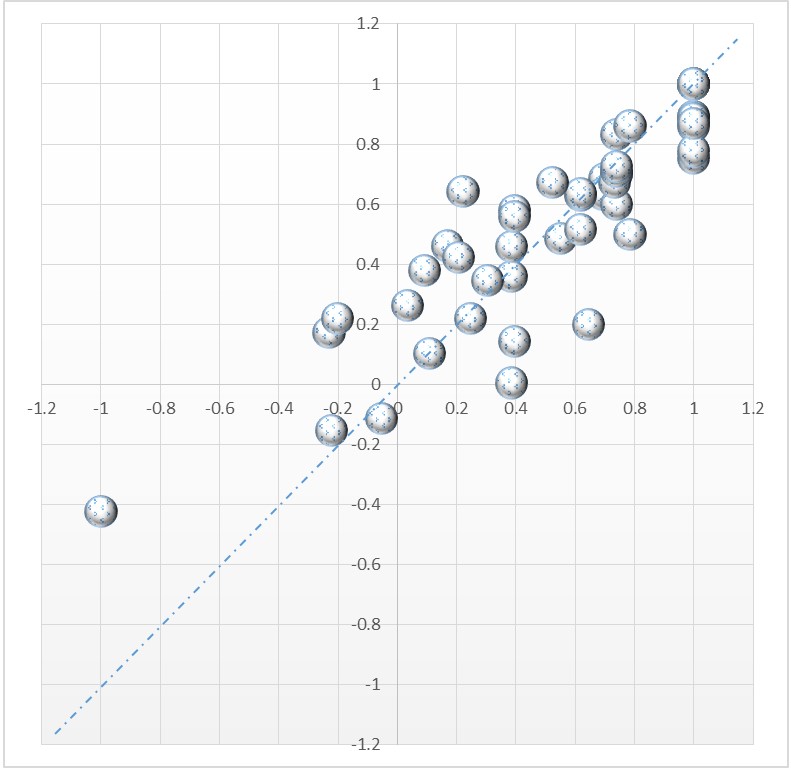
The difference in magnitude of bias between STEM and NON-STEM fields is illustrated in Figure 2 with the visual comparison of MBs for the measure since it shows the maximal difference with an effect size of (please refer to Table 4). Figure 2 also supports the conclusion that the overall results are biased towards the male gender and the STEM field is more biased. Moreover, the results are displayed in Figure 3(b) (a) and (b) which refer to the values of STEM field using MABs of exposure (), where vs and vs respectively. We deliberately display the MAB scores of in STEM field for and cut-off values since this is the only difference that is statistically significant in Table 6. In those figures, positive coordinates denote the scores of the YVRPs of queries annotated more with male gender and negative coordinates more with the female gender for two different cut-off values in the STEM field. Similarly, Figure 3(b) (a) and (b) confirm our findings that the overall results are biased towards the male gender (for the STEM) – majority of the queries are in the upper right quadrant in both figures. There are trendlines () in both of these figures and Figure 3(b) (b) displays more similar perceived bias scores in terms of magnitude for vs , i.e. bubbles are mostly around the trendline. Yet, in Figure 3(b) (a) we observe more dispersed bubbles; they are not gathered around the trendline which means that the magnitude of bias differs between and . Both Figure 3(b) (a) and (b) confirm our findings in Table 6.
6 Conclusion & Future Work
In this work, we investigated possible bias in educational videos with a case study on YouTube. In order to achieve that, we propose two new measures of bias that are suitable for the group-fairness criteria of equality of outcome. We applied these measures first to investigate the existence of perceived gender bias in the YVRPs in response to STEM and NON-STEM educational queries. Then, we examined if there is a significant difference in bias between STEM and NON-STEM fields. Lastly, we inspected the impact of different cut-off values on the bias results, i.e. on the existence of bias, difference in magnitude between the two fields, as well as in the same field. Our initial results show that both STEM and NON-STEM fields are biased towards the male gender. Also, the empirical findings indicate that STEM and NON-STEM fields generally show significantly different magnitude of perceived gender bias from each other towards the educational queries. Nonetheless, we observed that different bias measures as well as cut-off values might affect the magnitude of bias difference between STEM and NON-STEM fields. Nonetheless, we observed that different cut-off values might also impact on the magnitude of bias that a field shows. In this work, we intended to analyse YVRPs without the effect of personalisation. Therefore, these results point out that there exists perceived gender bias in YVRPs that could be observed even with a crude analysis and even though the personalisation effect is minimized. These findings suggest that the YVRPs are biased as displayed irrespective of the user’s YouTube search history, i.e. for instance there is no space for the following validation, clicking the educational videos mostly with male narrators lead to these results. We believe that this preliminary study is mainly valuable due to the following three reasons. First, this study views YouTube as an online educational platform which is the reality in practice in addition to the platforms that only serve as online educational websites. Second, this work investigates gender bias based on the perceived gender of the narrator by evaluating the gender bias in the context of search, by taking inspiration from widely-used IR measures. Third, gender bias detection in online educational systems is critical, especially by simulating a real user scenario to crawl for the bias analysis since the consequences may be severe; these platforms exacerbate existing biases connected to gender inequality in society.
We note that although the main focus of this study is not to investigate the source of bias, i.e. algorithmic or corpus bias, we believe that our results can be seen as a potential indicator. One possible future direction is to investigate a non-binary perceived gender bias analysis. Another one is to focus on the source of bias via an automatic model to detect narrators’ perceived gender. Alternative future direction could be to include personalisation in our analysis, i.e. by analysing gender bias from female and male users’ perspective to investigate if gender of the user affects the existence and/or magnitude of bias. Lastly, we can work on simple and efficient algorithms that could run in large-scale systems so even if the bias comes from the corpus, those platforms can somewhat mitigate the bias.
References
- Aslam (2021) Aslam, S., 2021. YouTube by the Numbers: Stats, Demographics & Fun Facts.
- Bargh et al. (2001) Bargh, J.A., Lee-Chai, A., Barndollar, K., Gollwitzer, P.M., Trötschel, R., 2001. The Automated Will: Nonconscious Activation and Pursuit of Behavioral Goals. Journal of personality and social psychology 81, 1014. URL: /pmc/articles/PMC3005626//pmc/articles/PMC3005626/?report=abstracthttps://www.ncbi.nlm.nih.gov/pmc/articles/PMC3005626/, doi:10.1037/0022-3514.81.6.1014.
- Barman (1997) Barman, C.R., 1997. Students’ views of scientists and science: Results from a national study. Science and Children 35, 18.
- Bodzin & Gehringer (2001) Bodzin, A., Gehringer, M., 2001. Breaking science stereotypes. Science and Children 38, 36.
- Brooks et al. (2018) Brooks, C., Gardner, J., Chen, K., 2018. How gender cues in educational video impact participation and retention, International Society of the Learning Sciences, Inc.[ISLS].
- Ceci (2021) Ceci, L., 2021. Social network web visit share held by YouTube in the United Kingdom (UK) from January 2015 to October 2021.
- Center (2020) Center, C., 2020. Tools and Guidance for Evaluating Bias in Instructional Materials .
- Chen & Yang (2006) Chen, I.X., Yang, C.Z., 2006. Position Paper: A Study of Web Search Engine Bias and its Assessment. IW3C2 WWW .
- Chintalapati et al. (2016) Chintalapati, N., Srinivas, V., Daruri, K., 2016. Examining the use of YouTube as a Learning Resource in higher education: Scale development and validation of TAM model URL: http://dx.doi.org/10.1016/j.tele.2016.08.008, doi:10.1016/j.tele.2016.08.008.
- Chtouki et al. (2012) Chtouki, Y., Harroud, H., Khalidi, M., Bennani, S., 2012. The impact of YouTube videos on the student’s learning, in: 2012 International Conference on Information Technology Based Higher Education and Training (ITHET), IEEE. pp. 1–4. doi:10.1109/ITHET.2012.6246045.
- Culpepper et al. (2018) Culpepper, J.S., Diaz, F., Smucker, M.D., 2018. Research frontiers in information retrieval: Report from the third strategic workshop on information retrieval in lorne (swirl 2018), in: ACM SIGIR Forum, ACM New York, NY, USA. pp. 34–90.
- Delacre et al. (2017) Delacre, M., Lakens, D., Leys, C., 2017. Why psychologists should by default use welch’s t-test instead of student’s t-test. International Review of Social Psychology 30.
- Diakopoulos et al. (2018) Diakopoulos, N.A.S., Trielli, D., Stark, J., 2018. I Vote For-How Search Informs Our Choice of Candidate. Digital Dominance: The Power of Google, Amazon, Facebook, and Apple, M. Moore and D. Tambini (Eds.) 22.
- Draws et al. (2021) Draws, T., Tintarev, N., Gadiraju, U., Bozzon, A., Timmermans, B., 2021. This Is Not What We Ordered: Exploring Why Biased Search Result Rankings Affect User Attitudes on Debated Topics, in: SIGIR 2021 - Proceedings of the 44th International ACM SIGIR Conference on Research and Development in Information Retrieval, Association for Computing Machinery, Inc. pp. 295–305. doi:10.1145/3404835.3462851.
- Dwork et al. (2012) Dwork, C., Hardt, M., Pitassi, T., Reingold, O., Zemel, R., 2012. Fairness Through Awareness .
- Epstein & Robertson (2015) Epstein, R., Robertson, R.E., 2015. The search engine manipulation effect (SEME) and its possible impact on the outcomes of elections doi:10.1073/pnas.1419828112.
- EU (2017) EU, 2017. Education. URL: https://eige.europa.eu/gender-mainstreaming/policy-areas/education.
- Geyik et al. (2019) Geyik, S.C., Ambler, S., Kenthapadi, K., 2019. Fairness-Aware Ranking in Search & Recommendation Systems with Application to LinkedIn Talent Search URL: http://arxiv.org/abs/1905.01989http://dx.doi.org/10.1145/3292500.3330691, doi:10.1145/3292500.3330691.
- Gezici et al. (2021) Gezici, G., Lipani, A., Saygin, Y., Yilmaz, E., 2021. Evaluation metrics for measuring bias in search engine results. Information Retrieval Journal 24, 85–113. doi:10.1007/s10791-020-09386-w.
- Gómez et al. (2021) Gómez, E., Shui Zhang, C., Boratto, L., Salamó, M., Marras, M., 2021. The Winner Takes it All: Geographic Imbalance and Provider (Un)fairness in Educational Recommender Systems, in: SIGIR 2021 - Proceedings of the 44th International ACM SIGIR Conference on Research and Development in Information Retrieval, Association for Computing Machinery, Inc. pp. 1808–1812. doi:10.1145/3404835.3463235.
- Good et al. (2012) Good, C., Rattan, A., Dweck, C.S., 2012. Why Do Women Opt Out? Sense of Belonging and Women’s Representation in Mathematics doi:10.1037/a0026659.
- Hannák et al. (2017) Hannák, A., Wagner, C., Garcia, D., Mislove, A., Strohmaier, M., Wilson, C., 2017. Bias in online freelance marketplaces: Evidence from taskrabbit and fiverr, in: Proceedings of the 2017 ACM conference on computer supported cooperative work and social computing, pp. 1914–1933.
- Hardt et al. (2016) Hardt, M., Price, E., Srebro, N., 2016. Equality of opportunity in supervised learning. Advances in neural information processing systems 29.
- Hilton & Von Hippel (1996) Hilton, J.L., Von Hippel, W., 1996. Stereotypes Article in Annual Review of Psychology · URL: https://www.researchgate.net/publication/5300883, doi:10.1146/annurev.psych.47.1.237.
- Hu et al. (2019) Hu, D., Jiang, S., Robertson, R.E., Wilson, C., 2019. Auditing the Partisanship of Google Search Snippets, in: The World Wide Web Conference, pp. 693–704. URL: https://doi.org/10.1145/3308558.3313654, doi:10.1145/3308558.3313654.
- Joachims et al. (2005) Joachims, T., Granka, L., Pan, B., Hembrooke, H., Gay, G., 2005. Accurately Interpreting Clickthrough Data as Implicit Feedback .
- Kay et al. (2015) Kay, M., Matuszek, C., Munson, S.A., 2015. Unequal representation and gender stereotypes in image search results for occupations, in: Conference on Human Factors in Computing Systems - Proceedings, Association for Computing Machinery. pp. 3819–3828. doi:10.1145/2702123.2702520.
- Kizilcec & Kambhampaty (2020) Kizilcec, R.F., Kambhampaty, A., 2020. Identifying course characteristics associated with sociodemographic variation in enrollments across 159 online courses from 20 institutions. PloS one 15, e0239766.
- Kizilcec & Saltarelli (2019) Kizilcec, R.F., Saltarelli, A.J., 2019. Psychologically inclusive design: Cues impact women’s participation in stem education, in: Proceedings of the 2019 CHI Conference on Human Factors in Computing Systems, pp. 1–10.
- Kwak & Kim (2017) Kwak, S.G., Kim, J.H., 2017. Central limit theorem: the cornerstone of modern statistics. Korean Journal of Anesthesiology 70, 144. URL: /pmc/articles/PMC5370305//pmc/articles/PMC5370305/?report=abstracthttps://www.ncbi.nlm.nih.gov/pmc/articles/PMC5370305/, doi:10.4097/KJAE.2017.70.2.144.
- Lipani et al. (2021) Lipani, A., Piroi, F., Yilmaz, E., 2021. Towards More Accountable Search Engines: Online Evaluation of Representation Bias URL: http://arxiv.org/abs/2110.08835.
- London et al. (2011) London, B., Rosenthal, L., Levy, S.R., Lobel, M., 2011. The Influences of Perceived Identity Compatibility and Social Support on Women in Nontraditional Fields During the College Transition. Basic and Applied Social Psychology 33, 304–321. URL: https://www.tandfonline.com/action/journalInformation?journalCode=hbas20, doi:10.1080/01973533.2011.614166.
- McGuire et al. (2020) McGuire, L., Mulvey, K.L., Goff, E., Irvin, M.J., Winterbottom, M., Fields, G.E., Hartstone-Rose, A., Rutland, A., 2020. STEM gender stereotypes from early childhood through adolescence at informal science centers. Journal of Applied Developmental Psychology 67, 101109. doi:10.1016/J.APPDEV.2020.101109.
- Noonan (2017) Noonan, R., 2017. Women in STEM: 2017 Update URL: https://www.census.gov/programs-surveys/acs/.
- Otterbacher et al. (2017) Otterbacher, J., Bates, J., Clough, P., 2017. Competent Men and Warm Women: Gender Stereotypes and Backlash in Image Search Results URL: http://dx.doi.org/10.1145/3025453.3025727, doi:10.1145/3025453.3025727.
- Otterbacher et al. (2018) Otterbacher, J., Checco, A., Demartini, G., Clough, P., 2018. Investigating User Perception of Gender Bias in Image Search: The Role of Sexism. Ann SIGIR 18. URL: https://doi.org/10.1145/3209978.3210094, doi:10.1145/3209978.3210094.
- Piatek-Jimenez et al. (2018) Piatek-Jimenez, K., Cribbs, J., Gill, N., 2018. International Journal of Science Education College students’ perceptions of gender stereotypes: making connections to the underrepresentation of women in STEM fields. International Journal of Science Education 40, 1432–1454. URL: https://www.tandfonline.com/action/journalInformation?journalCode=tsed20, doi:10.1080/09500693.2018.1482027.
- Riegle-Crumb et al. (2017) Riegle-Crumb, C., Moore, C., Buontempo, J., 2017. Shifting STEM Stereotypes? Considering the Role of Peer and Teacher Gender. Journal of Research on Adolescence 27, 492–505. URL: https://onlinelibrary.wiley.com/doi/full/10.1111/jora.12289https://onlinelibrary.wiley.com/doi/abs/10.1111/jora.12289https://onlinelibrary.wiley.com/doi/10.1111/jora.12289, doi:10.1111/JORA.12289.
- Robertson et al. (2018a) Robertson, R.E., Jiang, S., Joseph, K., Lazer, D., Wilson, C., Friedland, L., 2018a. Auditing Partisan Audience Bias within Google Search. Proc. ACM Hum.-Comput. Interact 2, 22. URL: https://doi.org/10.1145/3274417, doi:10.1145/3274417.
- Robertson et al. (2018b) Robertson, R.E., Lazer, D., Wilson, C., 2018b. Auditing the Personalization and Composition of Politically-Related Search Engine Results Pages, in: Proceedings of the 2018 World Wide Web Conference, ACM. pp. 955–965. URL: https://doi.org/10.1145/3178876.3186143, doi:10.1145/3178876.3186143.
- Robertson et al. (2017) Robertson, R.E., Lazer, D., Wilson, C., Epstein, R., 2017. Suppressing the Search Engine Manipulation Effect (SEME). Proc. ACM Hum.-Comput. Interact 1. URL: https://doi.org/10.1145/3134677, doi:10.1145/3134677.
- Sedgwick (2012) Sedgwick, P., 2012. Multiple significance tests: the bonferroni correction. Bmj 344.
- Singh et al. (2020) Singh, V.K., Chayko, M., Inamdar, R., Floegel, D., 2020. Female librarians and male computer programmers? gender bias in occupational images on digital media platforms. Journal of the Association for Information Science and Technology 71, 1281–1294.
- Wise (2018) Wise, 2018. 2018 workforce statistics - wise. URL: https://www.wisecampaign.org.uk/statistics/2018-workforce-statistics/.
- Yang & Stoyanovich (2016) Yang, K., Stoyanovich, J., 2016. Measuring Fairness in Ranked Outputs URL: http://arxiv.org/abs/1610.08559.
- YouTube (2018) YouTube, 2018. Youtube’s impartiality practices - how does youtube work? URL: https://www.youtube.com/howyoutubeworks/our-commitments/preventing-bias/.
- Zehlike et al. (2017) Zehlike, M., Bonchi, F., Castillo, C., Hajian, S., Megahed, M., Baeza-Yates, R., 2017. FA*IR: A Fair Top-k Ranking Algorithm, in: Proceedings of the 2017 ACM on Conference on Information and Knowledge Management, pp. 1569–1578. URL: https://doi.org/10.1145/3132847.3132938, doi:10.1145/3132847.3132938.
- Zhou (2014) Zhou, M., 2014. Gender difference in web search perceptions and behavior: Does it vary by task performance? Computers & Education 78, 174–184.
pic1 \endbio