KOLOMVERSE: KRISO open large-scale image dataset for object detection in the maritime universe
Abstract
Over the years, datasets have been developed for various object detection tasks. Object detection in the maritime domain is essential for the safety and navigation of ships. However, there is still a lack of publicly available large-scale datasets in the maritime domain. To overcome this challenge, we present KOLOMVERSE, an open large-scale image dataset for object detection in the maritime domain by KRISO (Korea Research Institute of Ships and Ocean Engineering). We collected 5,845 hours of video data captured from 21 territorial waters of South Korea. Through an elaborate data quality assessment process, we gathered around 2,151,470 4K resolution images from the video data. This dataset considers various environments: weather, time, illumination, occlusion, viewpoint, background, wind speed, and visibility. The KOLOMVERSE consists of five classes (ship, buoy, fishnet buoy, lighthouse and wind farm) for maritime object detection. The dataset has images of 38402160 pixels and to our knowledge, it is by far the largest publicly available dataset for object detection in the maritime domain. We performed object detection experiments and evaluated our dataset on several pre-trained state-of-the-art architectures to show the effectiveness and usefulness of our dataset. The dataset is available at: https://github.com/MaritimeDataset/KOLOMVERSE.
1 Introduction
In the field of computer vision and image processing, object detection is immensely popular because of its ability to accurately identify and classify objects from images. Object detection is used to localize and track objects in an image or a scene. As it is used extensively, there are many publicly available datasets for implementation, such as MS COCO [1], Pascal VOC [2], Imagenet [3] and Google Open Images [4] to name a few. MS COCO is the most frequently used public dataset and contains 328K images with 80 object categories. Object detection methods have been extensively used for face identification [5], pedestrian detection [6], vehicle position and velocity estimation [7] and autonomous vehicles [8]. These deep learning methods have become popular in the maritime domain as well with implementation of maritime object detection, segmentation, and vessel re-identification among others. However, due to the complexity and uncertainty of the sea environment, it is a challenging task to collect and annotate data [9]. Therefore, there are few maritime datasets and they are mostly not publicly available.
With the development of the shipping industry across the world, maritime datasets play a pivotal role in the development of maritime autonomous surface ships (MASS) as well as navigation safety [10, 11]. The maritime dataset contains information about vessels and surrounding water objects that help detect, monitor, and manage sea traffic, maritime safety and navigation, and military surveillance to prevent illegal activities like smuggling, infiltration, and dumping of pollutants.
To prevent accidents and ensure safety both during the day and night, maritime image datasets help obtain a ship’s location, size, and direction, among other information, to determine whether there exist other objects nearby [12]. There are a few existing applications of object detection such as harbor surveillance [13] or collision avoidance [14] for autonomously operating vessels but a lack of publicly available data and the complexity of the sea environment makes object detection in the maritime domain a complex and expensive field of research [9]. Moreover, in contrast to other domains of object detection such as street sign detection [15], pedestrian detection [6], or even face detection [5], in the maritime domain, there are comparatively few public benchmarks available. Hence, recent studies of object detection in the maritime domain contain only a few comparable results.
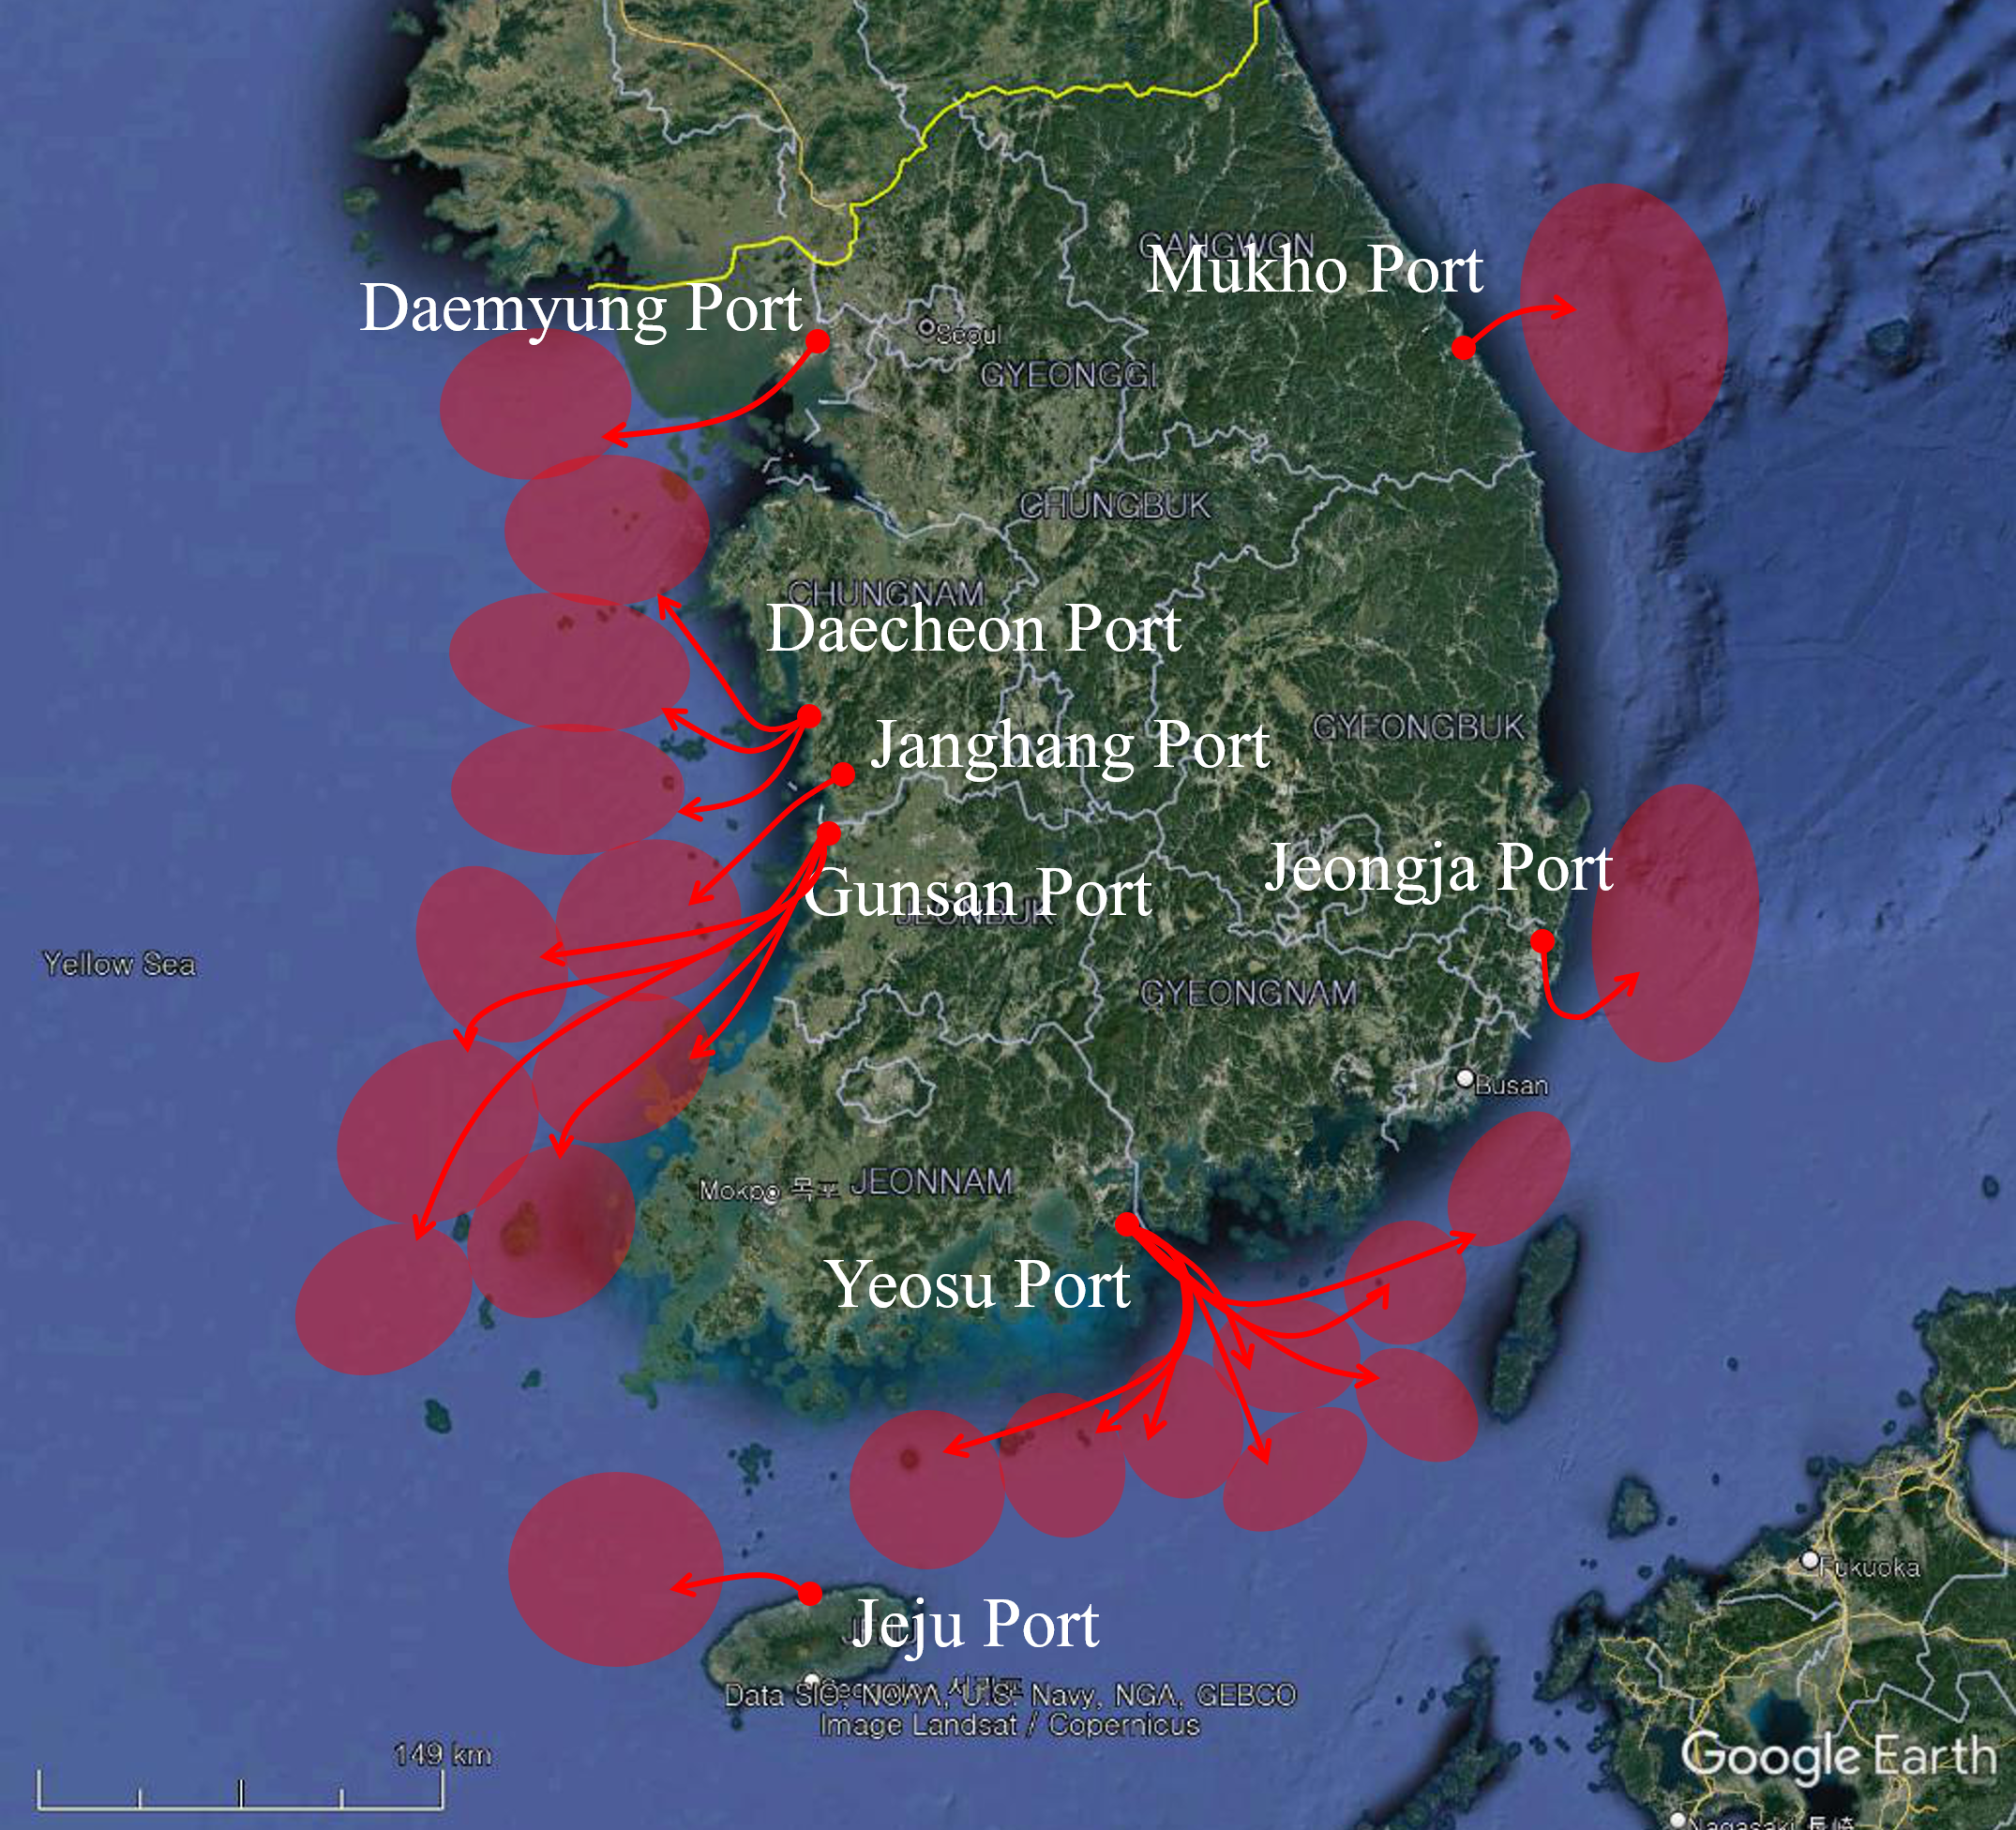
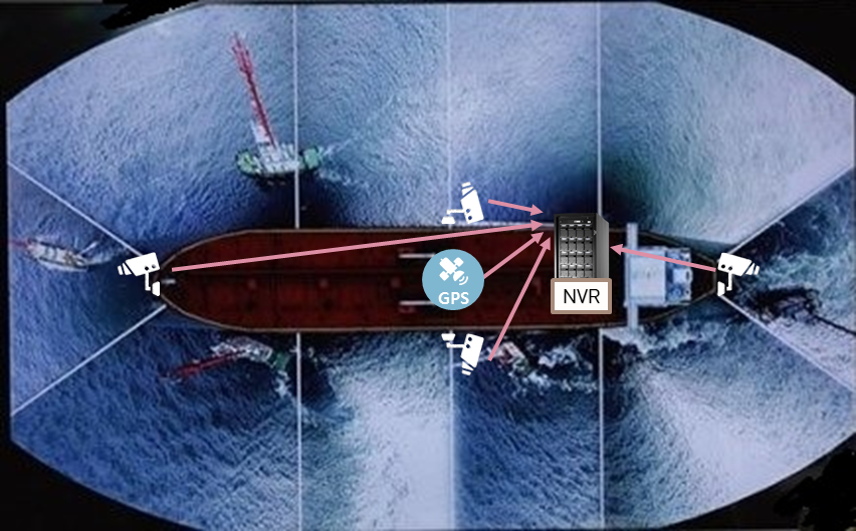
In this paper, we present a maritime object image dataset, KOLOMVERSE, for object detection. For data collection, we installed a four-channel 4K (38402160 pixels) network video recorder (NVR) system on the ship’s front, rear, left, and right sides to collect one fps of video data and built the KOLOMVERSE based on the images captured from the video data. Seventeen ships with the NVR system collected the video data from 21 territorial waters of Korea, which are overlaid on a Google Earth satellite imagery as shown in Figure 1. We collected 5,845 hours of video data from November 2020 to February 2021. Through a data quality assessment process, we acquired around 2,151,470 4K resolution images that cover various environments considering weather, time (illumination and occlusion), viewpoint, background, wind speed, visibility, and season. The KOLOMVERSE contains five categories (ship, buoy, fishnet buoy, lighthouse, and wind farm) essential for the safety and navigation of maritime vessels.
Several object detection models are publicly available such as the YOLO series [16, 17, 18, 19], SSD [20], fast and faster RCNN (FRCNN) [21, 22], R-FCN [23], Mask R-CNN [24] and CenterNet [25]. We trained and evaluated our dataset on pre-existing state-of-the-art models to show that our dataset performs effectively in deep learning applications and can be expanded to other meaningful applications. We trained our dataset on benchmarking models, so the results obtained from our dataset are reproducible. Our dataset and the trained models are publicly available at https://github.com/MaritimeDataset/KOLOMVERSE.
2 Related Work
There are a handful of maritime datasets available for ship detection and classification. Prasad et al. [26] introduced the Singapore Maritime Dataset (SMD). It is one of the few publicly available datasets specifically dedicated to object detection in maritime environments, but it lacks representative benchmarking results. Zhang et al. [27] introduced the Vais, a large dataset that contains more than 1,000 paired RGB and infrared images among six ship categories - merchant, sailing, passenger, medium, tug, and small. The dataset consists of 2,865 images with 1,623 visible, 1,242 IR, and 154 nighttime IR images. The dataset includes 264 uniquely named ships in 6 coarse-grained categories: merchant ships, sailing ships, medium passenger ships, medium "other" ships, tugboats, and small boats. Shao et al. [12] developed Seaships for training and evaluating ship object detection algorithms. The dataset consists of 31,455 images with six ship classes (ore carrier, bulk cargo carrier, general cargo ship, container ship, fishing boat, and passenger ship). Soloviev et al. [28] selected 135 videos from a sightseeing watercraft operating between the cities of Turku and Ruissalo in South-West Finland, along the Aura river and into the Finnish Archipelago. The total number of annotated vessels in this dataset is 850. They also built a second real maritime dataset in the Finnish Archipelago, consisting largely of maritime vessels in open sea landscapes. This dataset consists of 1,750 images captured using visible cameras. The number of vessel objects in the dataset is 9,137.
Other maritime datasets solve challenges like piracy detection, boat monitoring, segmentation, and vehicle classification.The IPATCH dataset (piracy detection) developed by Pationo et al. [29], uses multi-sensor surveillance to protect a vessel at sea from piracy. The dataset solves challenges from the PETS 2016 workshop, does Low-Level Video Analysis like object detection and tracking, Mid-Level Video Analysis like ’simple’ event detection: the behavior recognition of a single actor and High-Level Video Analysis that is ’complex’ event detection: the behavior and interaction recognition of several actors. Maritime Detection, Classification, and Tracking Database (MarDCT) [30] is a database of videos and images containing data coming from multiple sources (fixed, moving, and Pan-Tilt-Zoom cameras) and from different scenarios. MarDCT aims to provide visual data that can help develop intelligent surveillance systems for the maritime environment. The data sets are divided according to the type of Ground Truth in: Detection, Classification, and Tracking. Also known as the Argos Boat Classification dataset, it is used for boat classification and contains images of boats automatically extracted by the ARGOS system, which operates 24/7 in Venice (Italy). The dataset comes from an incomparable environment like Venice, but they present very interesting challenges to vehicle classification. The Marine Obstacle Detection Dataset (MODD), introduced by Kristan et al. [31] contains marine videos captured by unmanned surface vehicles (USVs). This dataset is used to segment images into the sky, the shore, and the sea and detect obstacles in the sea area. The contributions of our study compared with those of the aforementioned studies are summarized as follows:
-
1.
Autonomous navigation systems need detailed information about the objects in their environment for safe navigation. Training datasets containing information not just about the maritime vessels but also about the important surroundings produce more reliable object detection and navigation systems. Unlike other maritime datasets that contain only ship or boat categories, our dataset contains important sea environment categories such as a buoy, fishnet buoy, lighthouse, and wind farm, in addition to ships.
-
2.
A large dataset is crucial for training object detection models efficiently. Mostly, datasets with fewer samples contain less information and cannot predict new data effectively. In addition, there is a higher possibility of overfitting when training is done with smaller datasets [32]. The models built with small datasets are biased, overfitting, and unreliable. In maritime applications, building reliable models that ensure maximum safety is extremely important. The KOLOMVERSE is comparatively much larger than other maritime datasets, as shown in Table 1.
-
3.
It is important to recognize even the smallest objects visible from far away in a real-time sea environment for effective tracking and safe navigation. Networks trained on images with high resolution can locate and classify very small objects visible from far as these images contain detailed information. As shown in Appendix A, the KOLOMVERSE contains images with objects of various shapes and sizes, even small ones visible from far away. As shown in Table 1, the KOLOMVERSE contains images with a high resolution of 38402160 pixels. It is much higher compared to other datasets.
-
4.
Our dataset has diverse samples because the images were collected from 21 different water bodies. The dataset also has variations in background, scale, viewpoint, occlusion, and illumination. Therefore, models trained with our dataset are robust. In addition, unlike other object detection datasets, our dataset contains images of various shapes, sizes, and backgrounds from the real-world sea environment that produces reliable real-time detection models.
| Datasets | of images | of classes | Image size |
|---|---|---|---|
| Seaships [12] | 31,455 | 6 (Ore carrier, bulk cargo carrier, general cargo ship, container ship, fishing boat, and passenger ship) | 19201080 |
| VAIS [27] | 2,865 | 6 (Merchant ships, sailing ships, medium passenger ships, medium “other” ships, tugboats, and small boats) | 1024768 |
| SMD [26] | 17,450 | 10 (Ferry, buoy, vessel/ship, speed boat, boat, kayak, sail boat, swimming person, flying bird/plane, and other) | 19201080 |
| KOLOMVERSE | 2,151,470 | 5 (Ship, buoy, fishnet buoy, lighthouse, and wind farm) | 38402160 |
3 Dataset Collection, Annotation and Quality Assessment
3.1 Data Collection
To obtain the video data, we installed a four-channel 4K NVR system as shown in Figure 1. We installed four cameras per ship to record the front, rear, left, and right directions along with GPS equipment to store location information simultaneously in the recorded image. To reflect the characteristics of the sea in Korea, we divided it into nine zones in the South Sea, 10 zones in the West Sea, and two zones in the East Sea to collect video data from various environments. The video data included variations in contrast and color of objects according to various weather conditions and times.
Data were collected according to specific criteria as follows:
-
•
Weather: Videos were collected by classifying the weather into clear, cloudy, rainy, snowy, and strong windy. At wind speeds of 14 m/s or more per second, sailing is prohibited, so such data were excluded from the collection.
-
•
Time: The color, clarity, and contrast of the objects are different depending on the time, which varies the illuminance and the direction of light in the image. For this reason, we classified the video as morning, afternoon, sunrise, sunset, and night.
-
•
Wave height: Since the shaking and inclination of the images and the shapes of the objects in the video vary depending on the wave height, we collected the video by classifying it into 0, 1 to 2 meters, and 3 to 4 meters. Sailing is prohibited for the wave height of 4 meters or more, so those data were excluded from the collection.
-
•
Wind speed: As the movement of objects in the image and the shape of waves differ depending on the wind speed, the wind speed information was classified as 0, 1 m/s to 5 m/s, 5 m/s to 10 m/s, and 10 m/s or more. Sailing is prohibited at wind speeds of 14 m/s or higher, so such data were excluded from the collection.
-
•
Visibility: Since the color, resolution, and clarity of objects in the video vary depending on the visibility, we collected the video by classifying 0.1 to 0.2 km, 0.2 to 0.5 km, 0.5 to 1 km, 1 to 2 km, and 2 km or more.
We employed 17 ships to collect the video data. The collected video data were stored in mp4 format, and a total of 5,845 hours of data were collected with 4K resolution quality.
3.2 Data Annotation
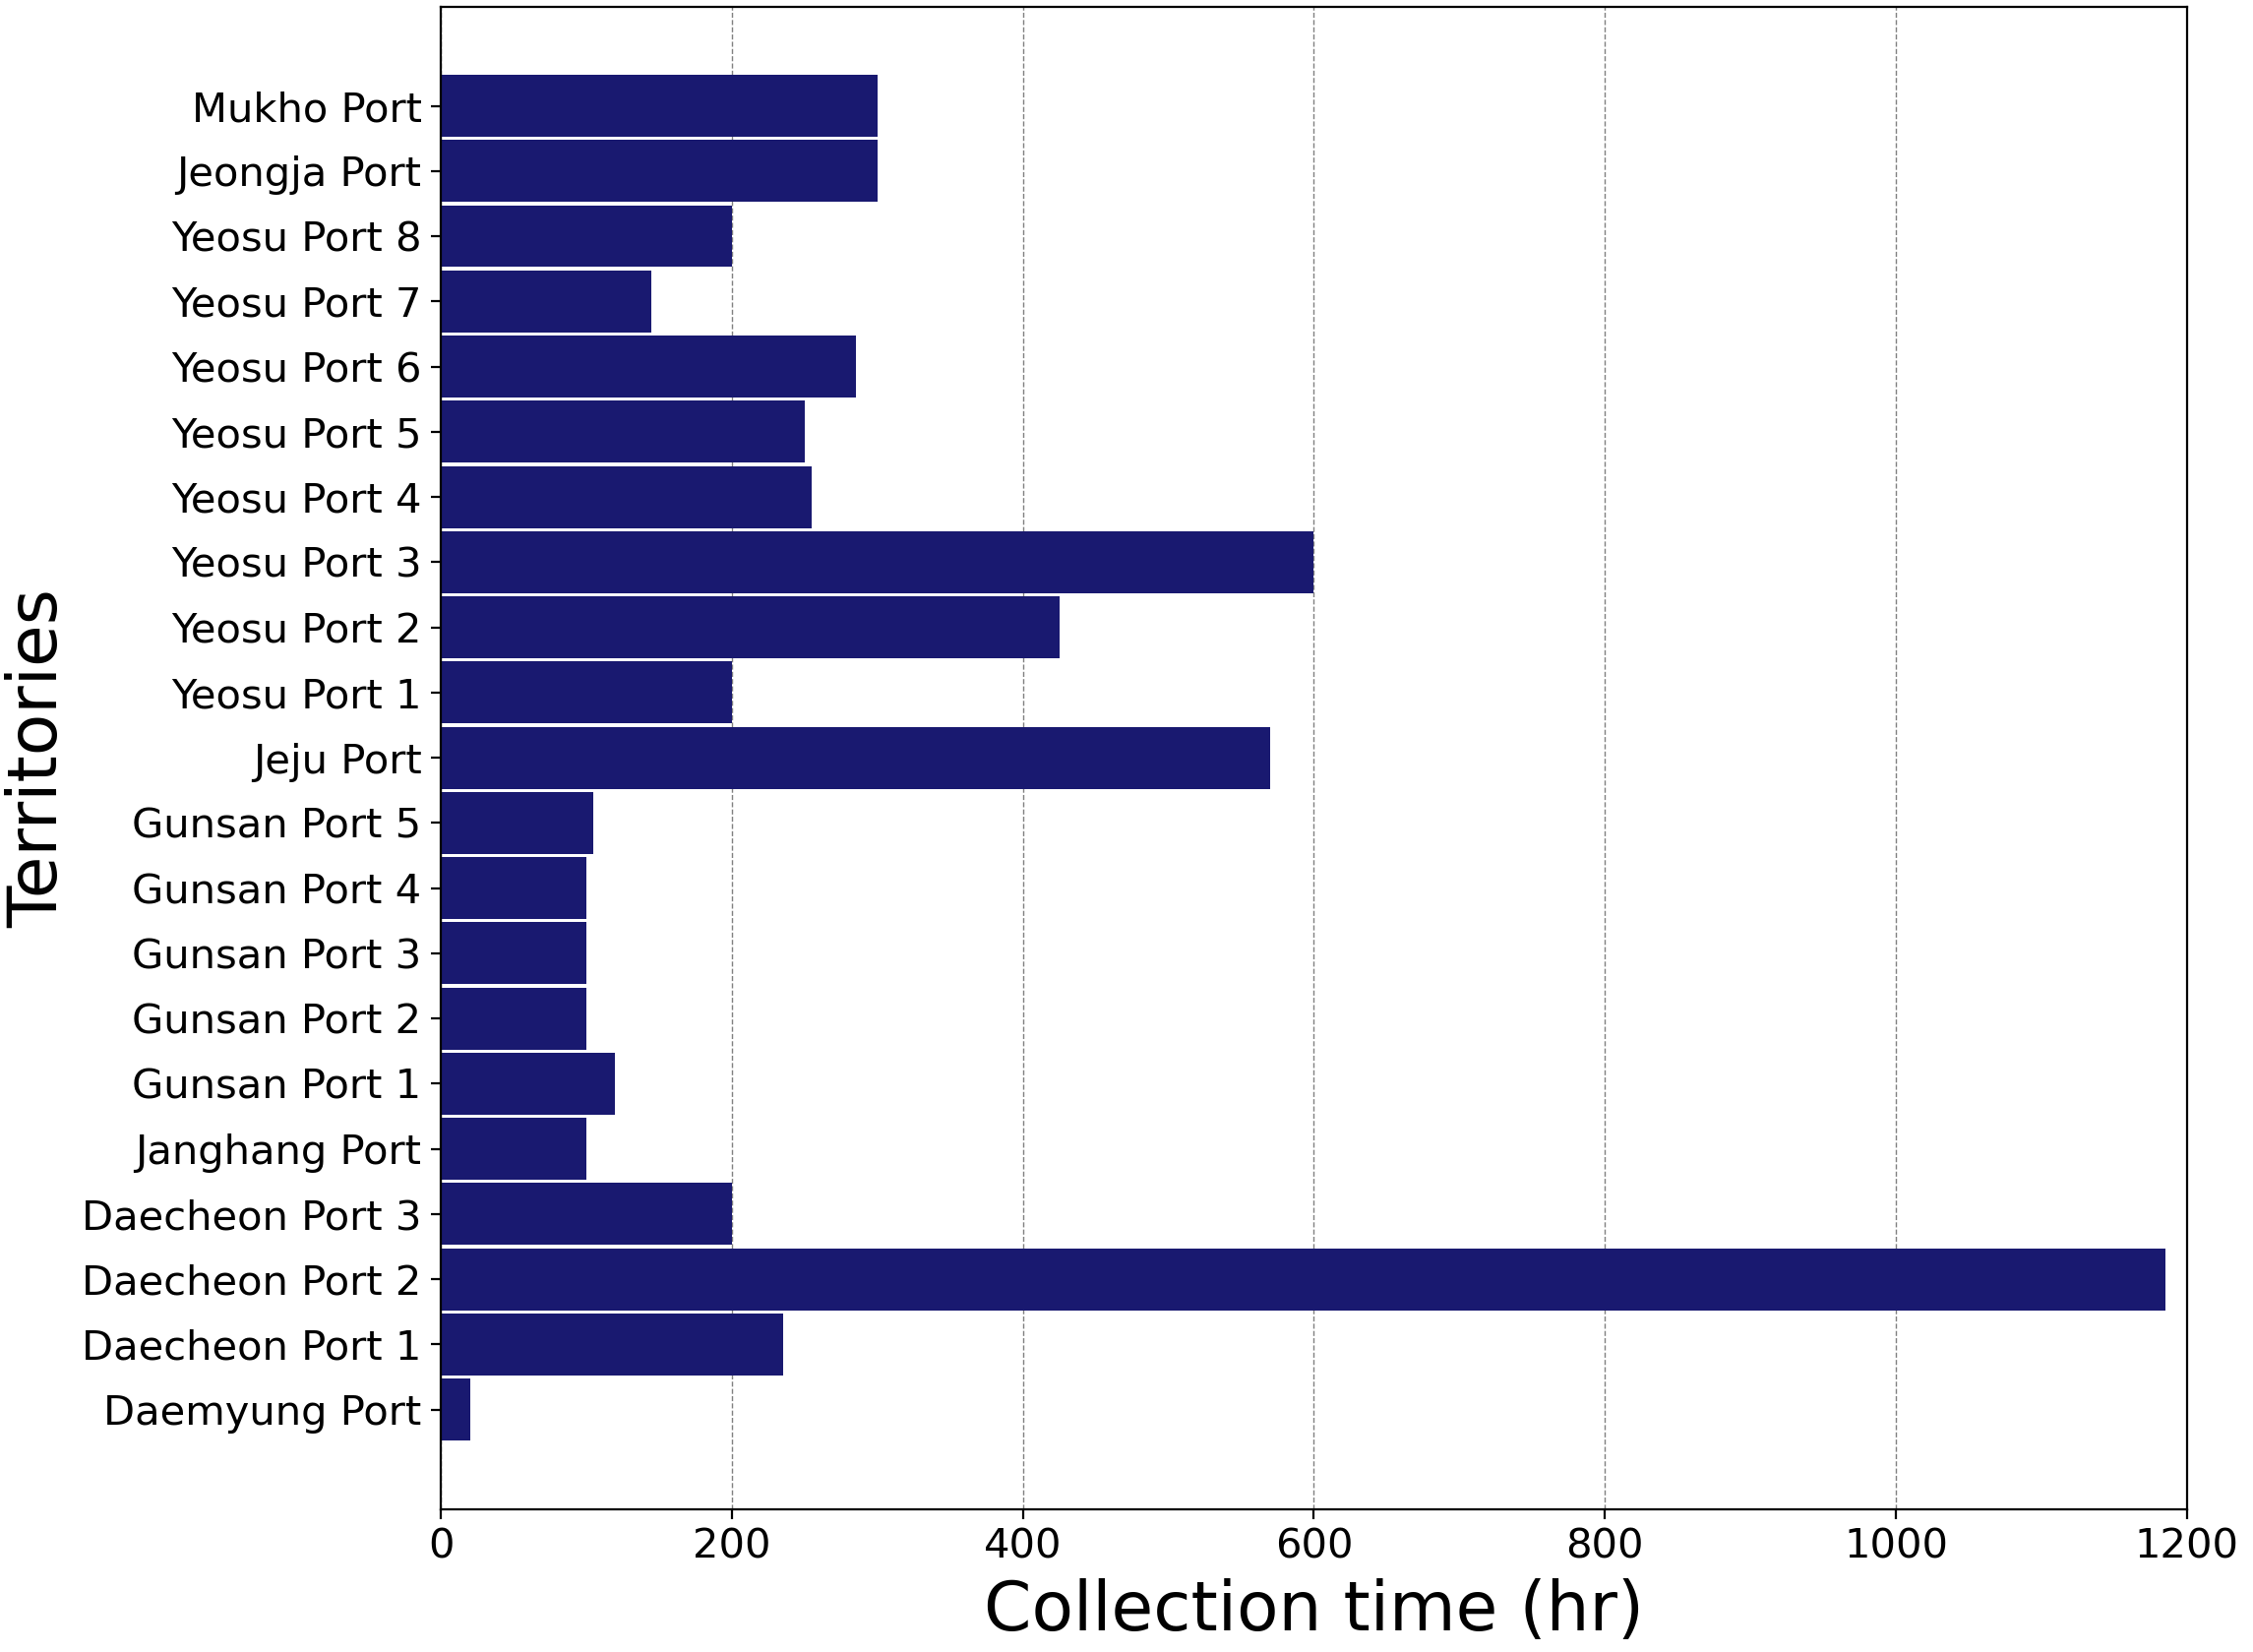
First of all, the collected video data of 5,845 hours were converted to image data in a JPG format. Figure 2 shows the distribution of the amount of time taken to collect the video data from all the 21 territories. The image sequences obtained from the video data were captured at one fps and the data had some redundancy. Therefore, we removed the images with more than 80 similarity to reduce redundancy. Moreover, monotonous images consisting of only the sea and islands without any of the five class objects were removed. When there was a glare of sunlight over an object, possibly occluding the object, or the image was of poor quality or had weak lighting that made it difficult to identify the objects, such images were excluded from annotation.
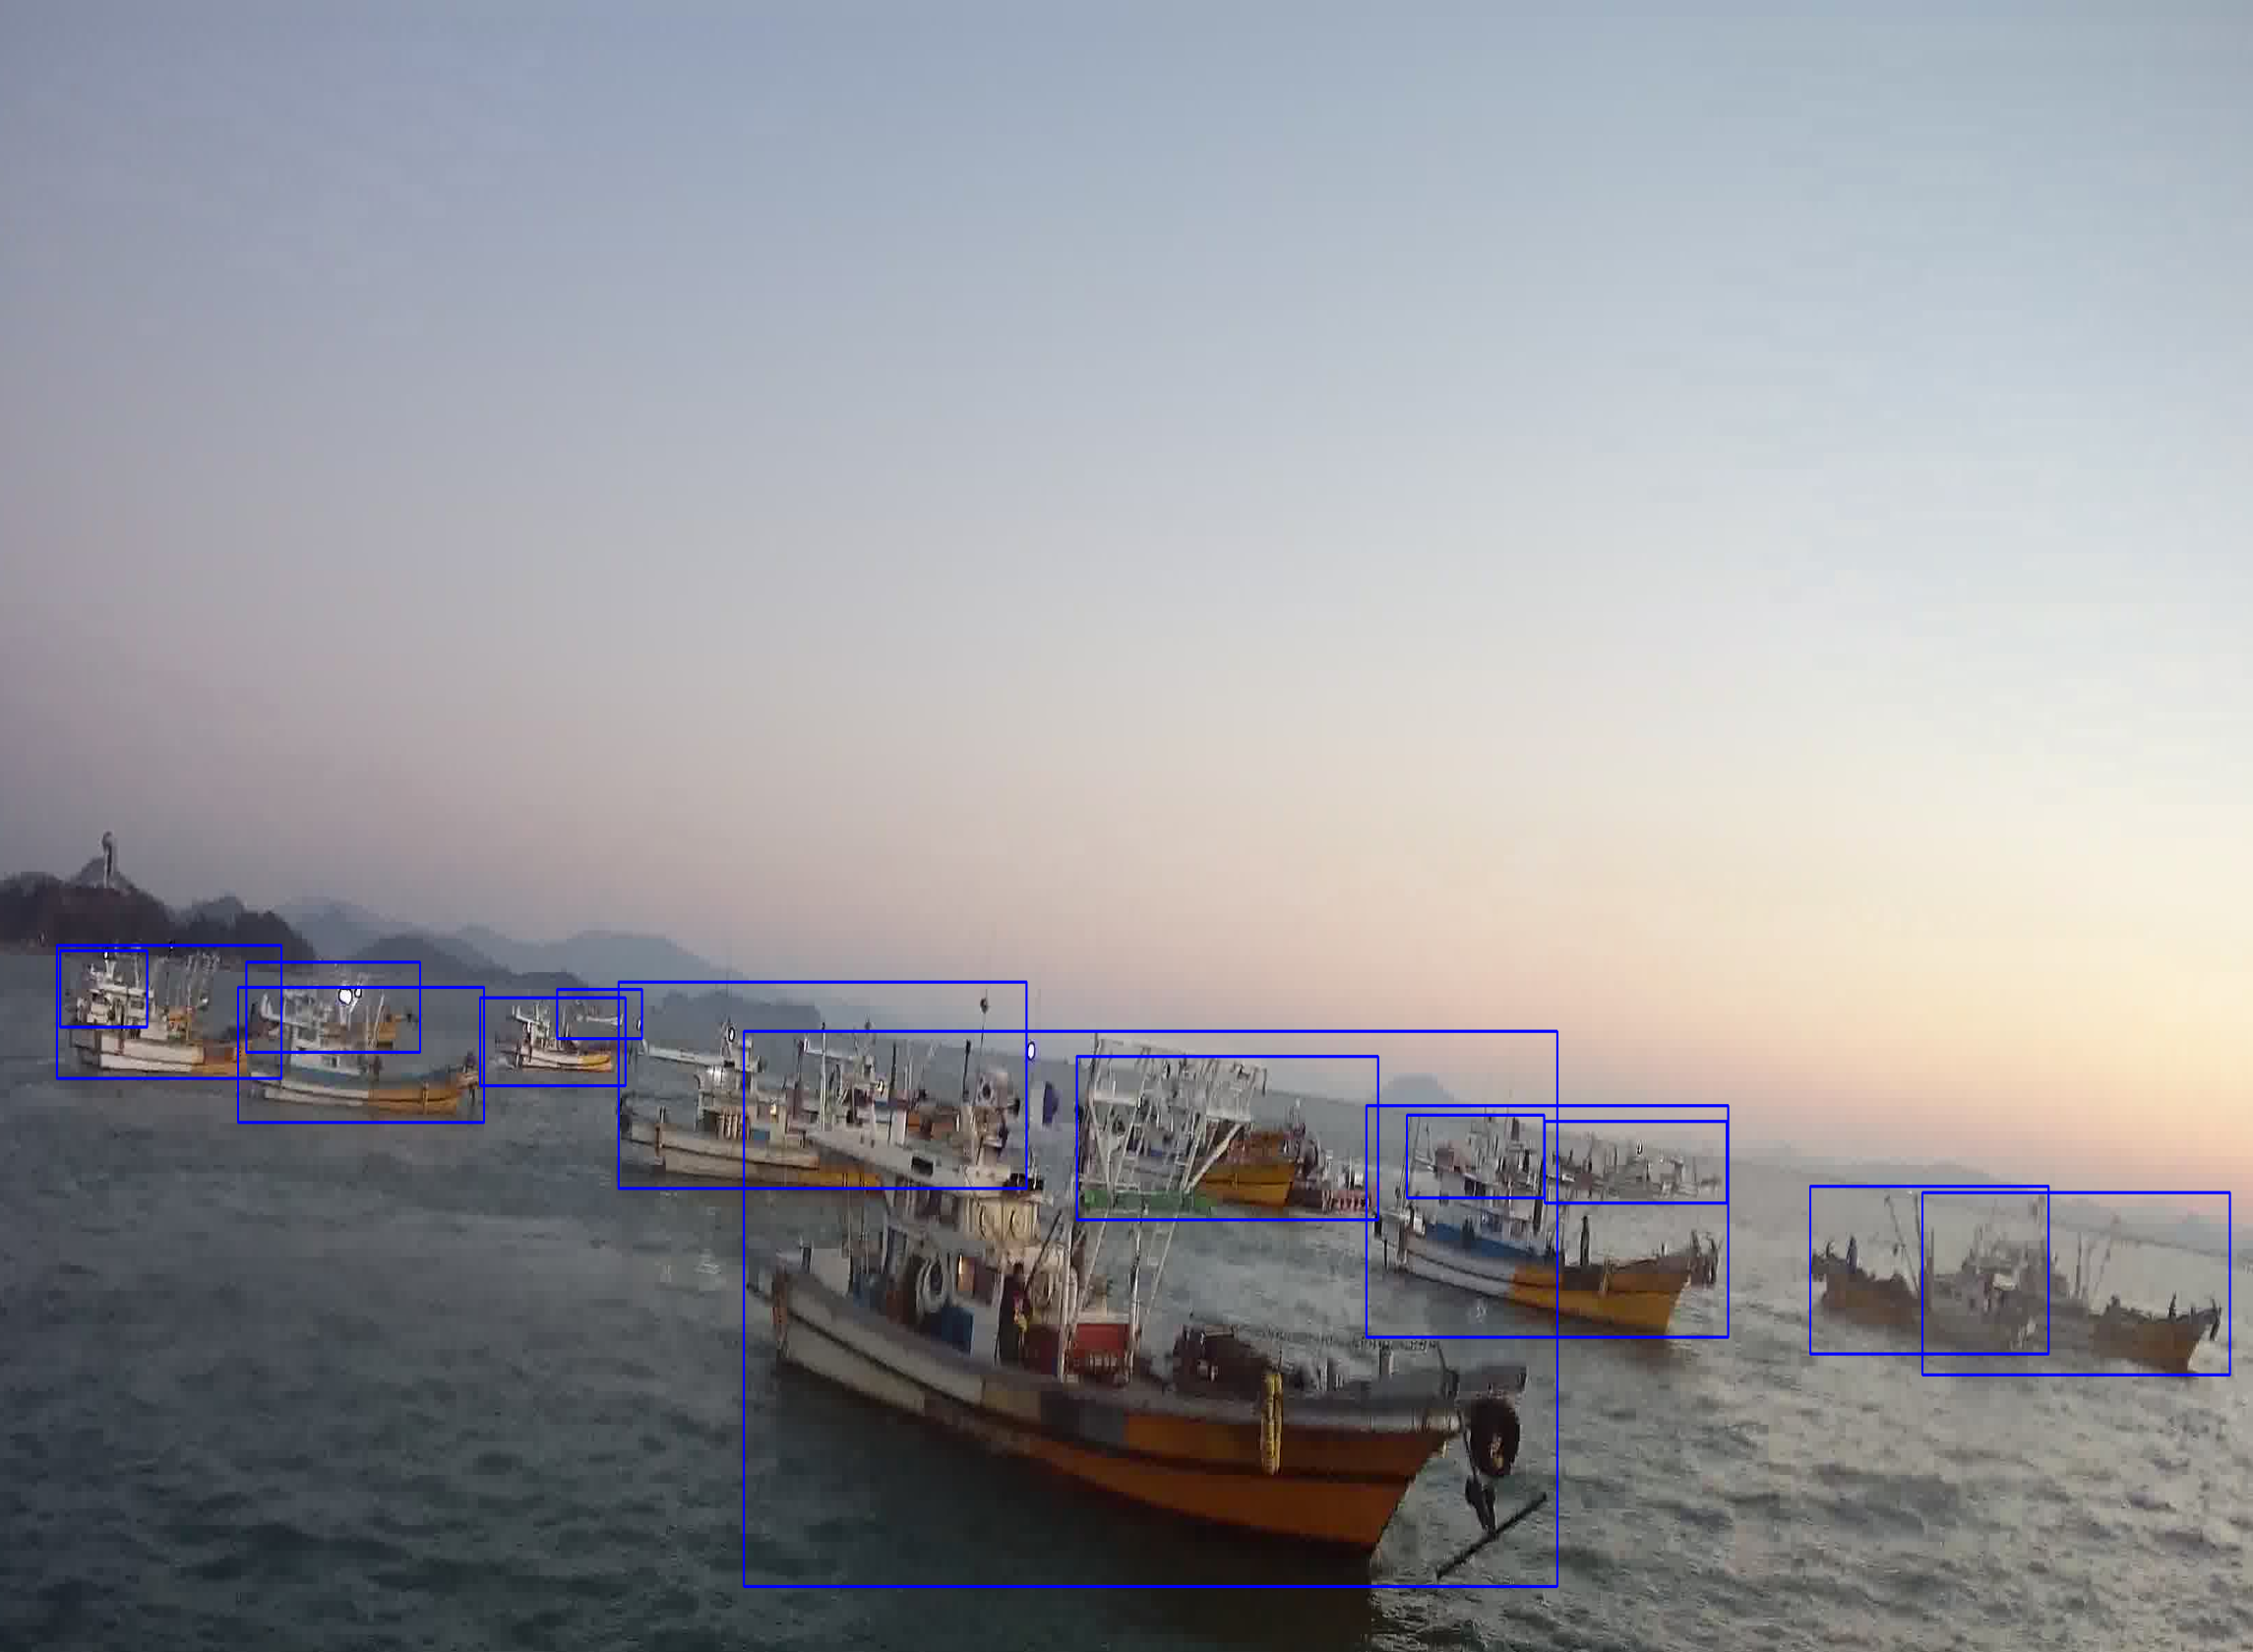
In addition, the annotated bounding box must contain all parts of the object, and the bounding box and the gap between the object should be less than 20 pixels. In cases of ship classes, sometimes persons or other objects were captured within a ship. These objects were collectively labeled as the ship. Moreover, if only a part of an object is visible, such as being obscured by another object or truncated in the image, such objects were labeled as shown in Figure 2. Afterward, as with other dataset studies, images acquired using these annotation rules were labeled manually with a bounding box. Finally, each bounding box was generated in a CSV file. We also formed a meta data file for each image of the dataset.
3.3 Data Quality Assessment
For post-annotation, we investigated our dataset to identify errors and correct them to form an accurate and reliable dataset. Firstly, we checked if the annotation criteria as described above were clearly followed. Moreover, we checked if any objects were incorrectly labeled and any objects that did not belong to any of our defined five classes were labeled. We checked for such errors and if found, we correctly re-labeled the images. In addition, if the parts of the own ships used to collect our data are visible in the dataset, such ships were excluded from annotation as they have completely different shapes from the rest of the ships in the dataset. We also checked if the bounding box is not exactly positioned on the object.
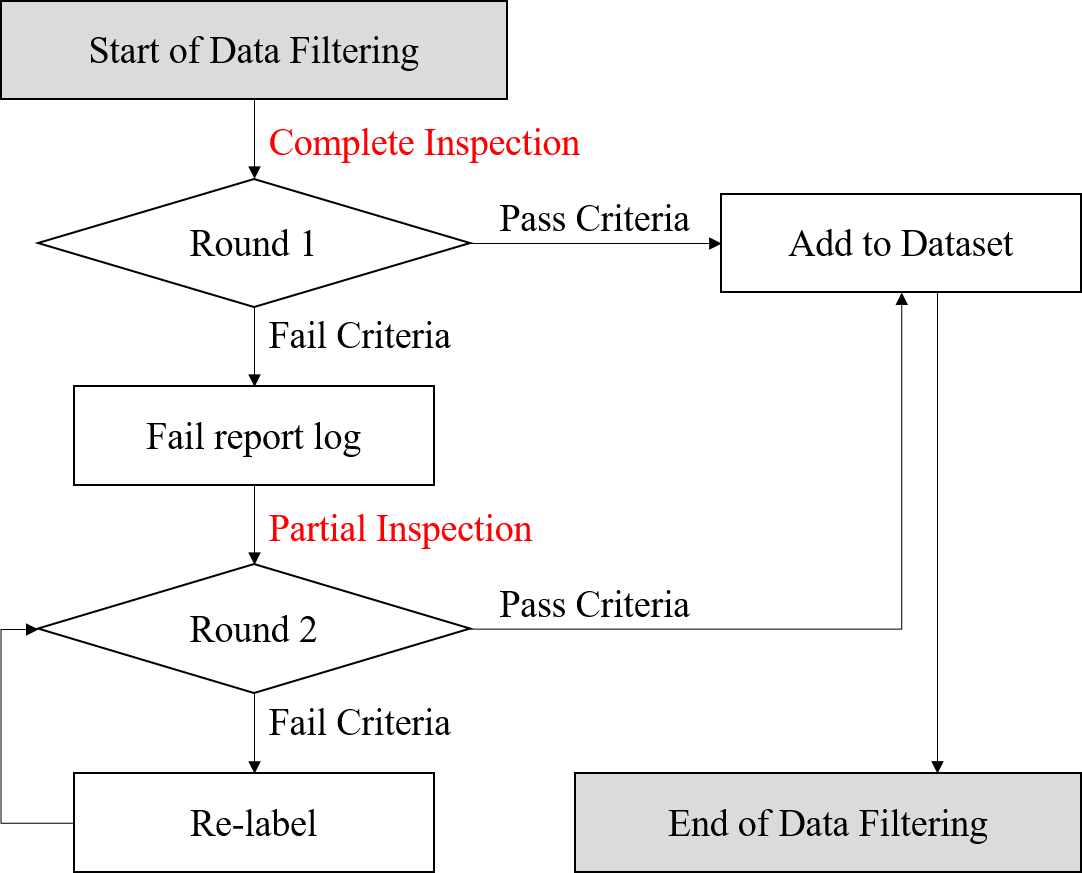
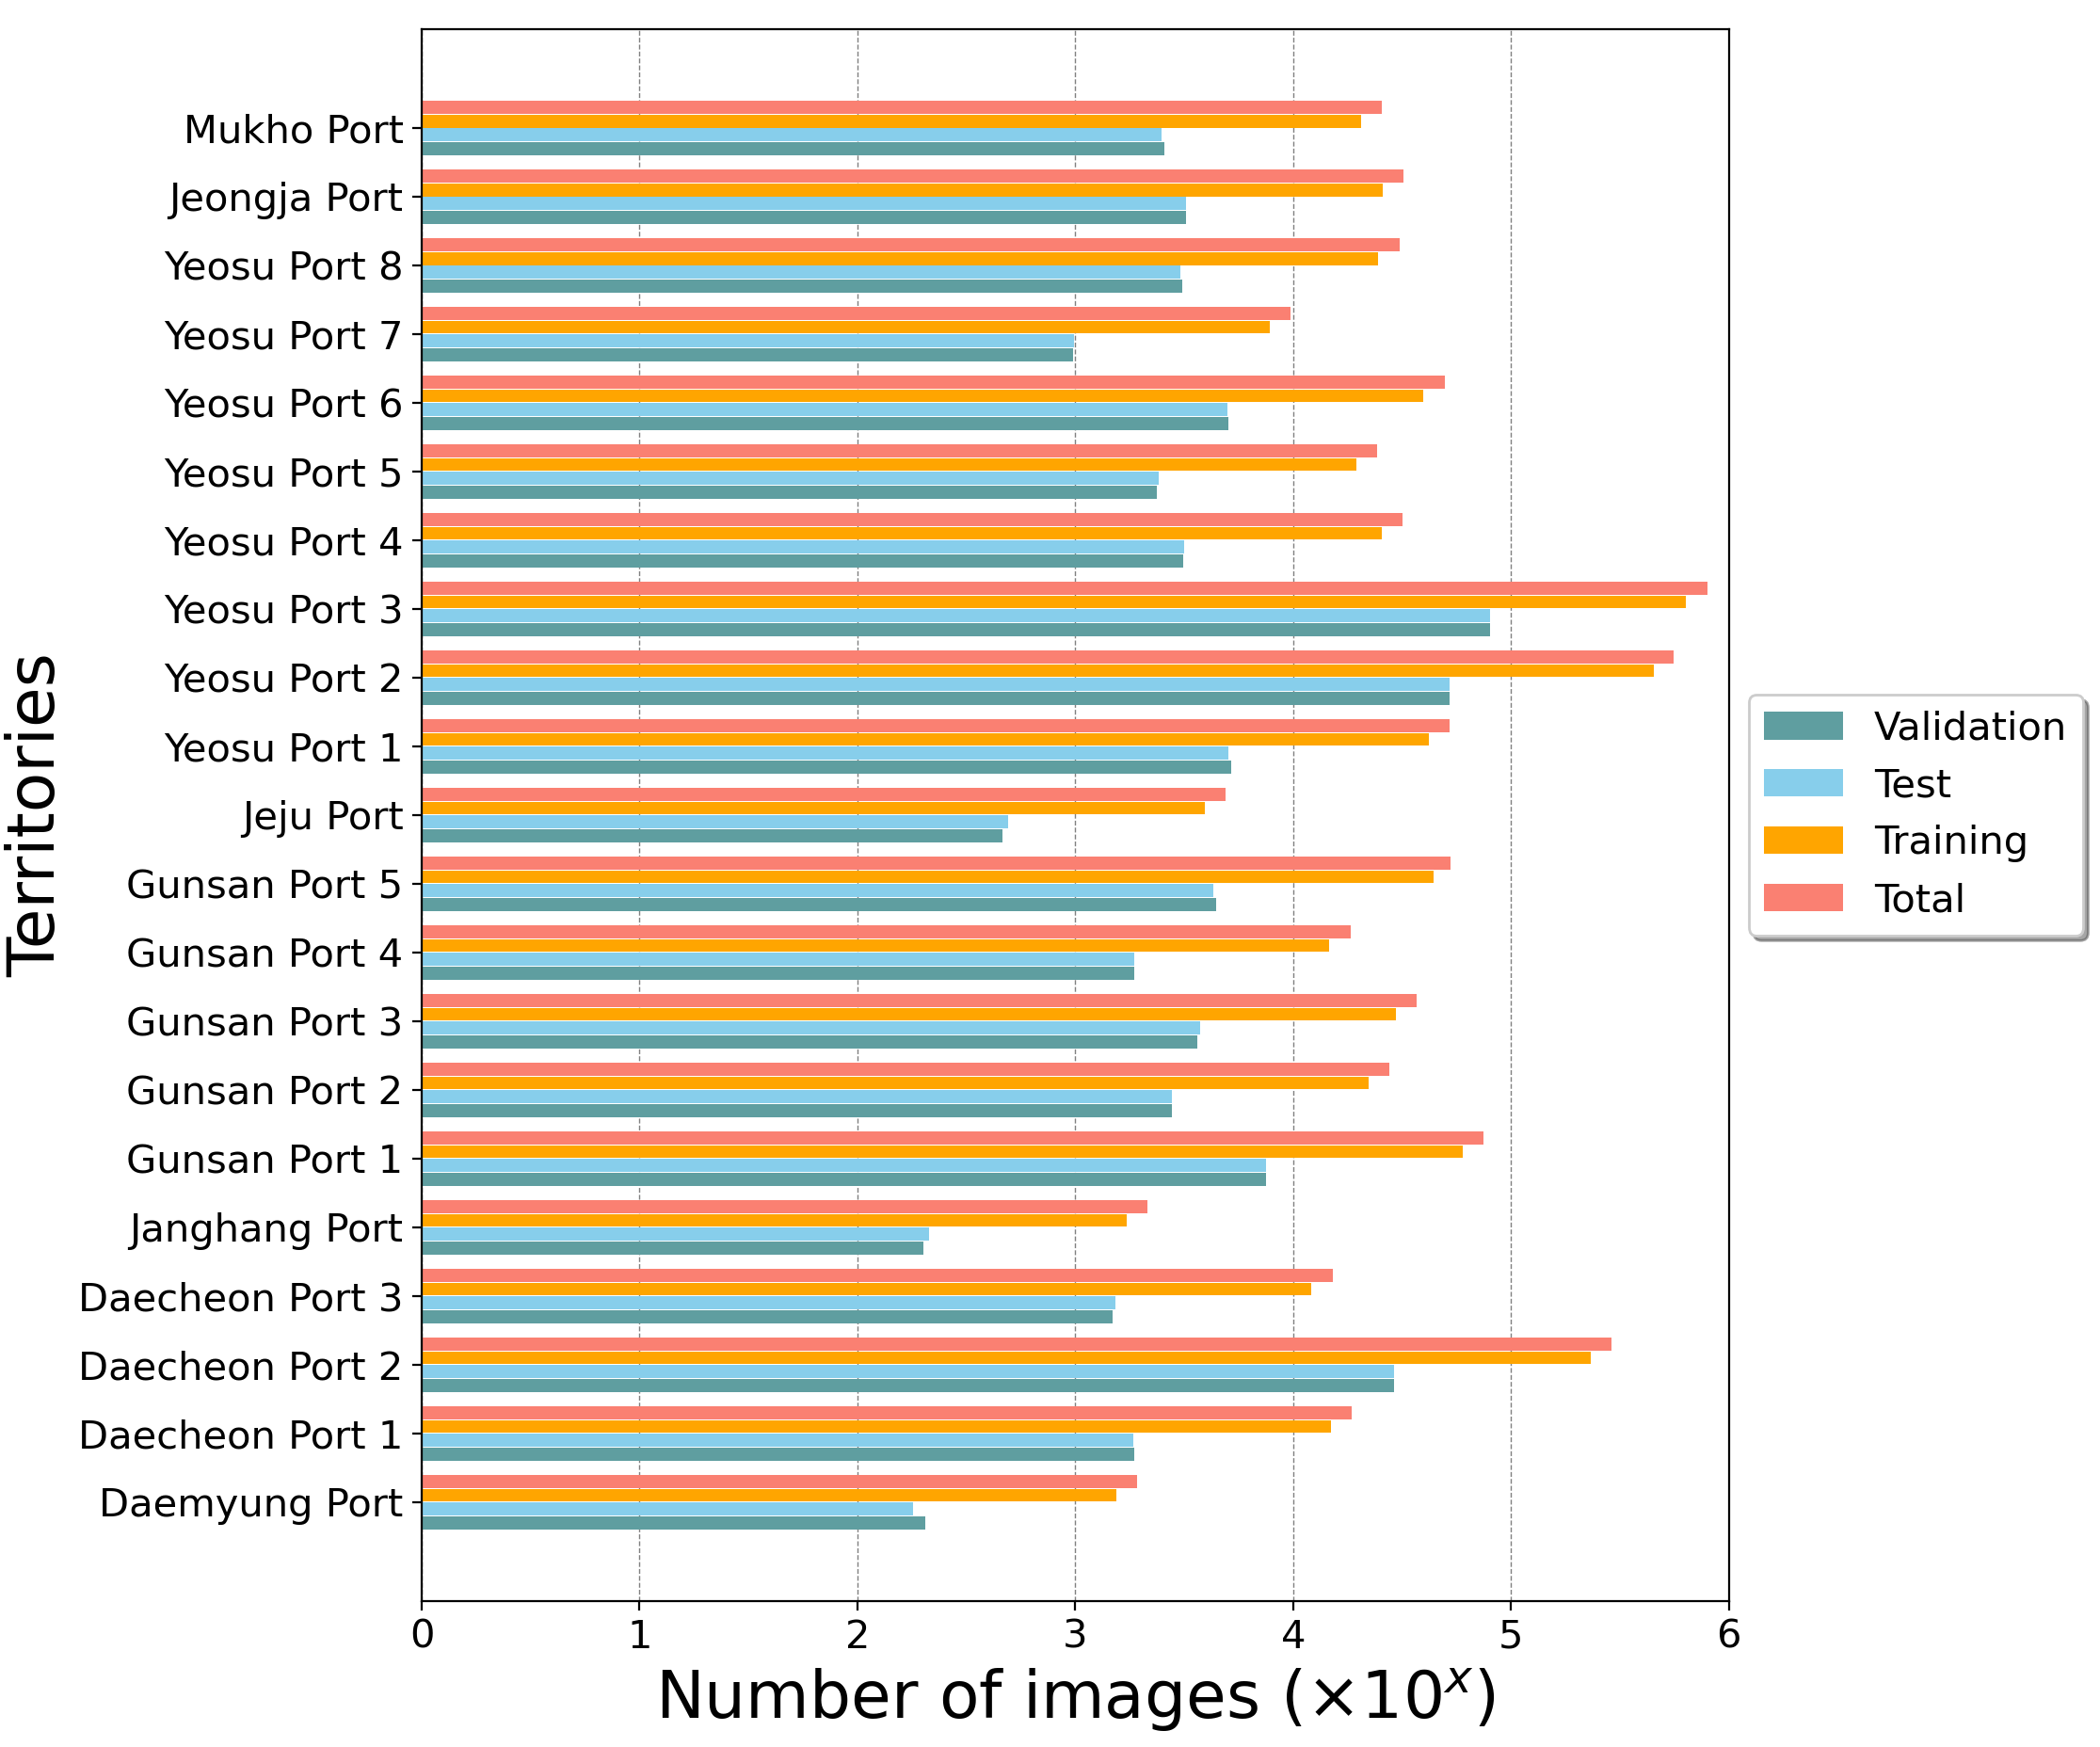
Data quality assessment is carried out through a two-step procedure to improve the data quality and reduce human errors during annotation processing. Based on our data annotation and quality assessment criteria, novice annotators first checked every anomalies in the dataset. Then, based on the report provided by the novice annotators, a set of expert annotators verified the anomalies and re-labeled the objects. As a result, from the original video data, we acquired around 2,151,470 4K resolution images in JPG format to generate our dataset. The total 2,151,470 annotated images are divided into three parts, train (1,729,601 images), validation (211,038 images) and test (210,831 images) sets. Figure 3 shows the complete pipeline of our data quality assessment process and the data split in each of the 21 environments in our final dataset.
4 Dataset Description
The KOLOMVERSE has a total of 2,151,470 4K images and contains images categorized into 5 distinct classes, namely ship (3,791,372 instances), buoy (67,048 instances), fishnet buoy (273,051 instances), lighthouse (103,358 instances) and wind farm (338,673 instances). It is important to note that each image can have multiple object instances and more than one class object often co-occur in the same image, therefore, total number of object instances are far more than the total number of images in the dataset.
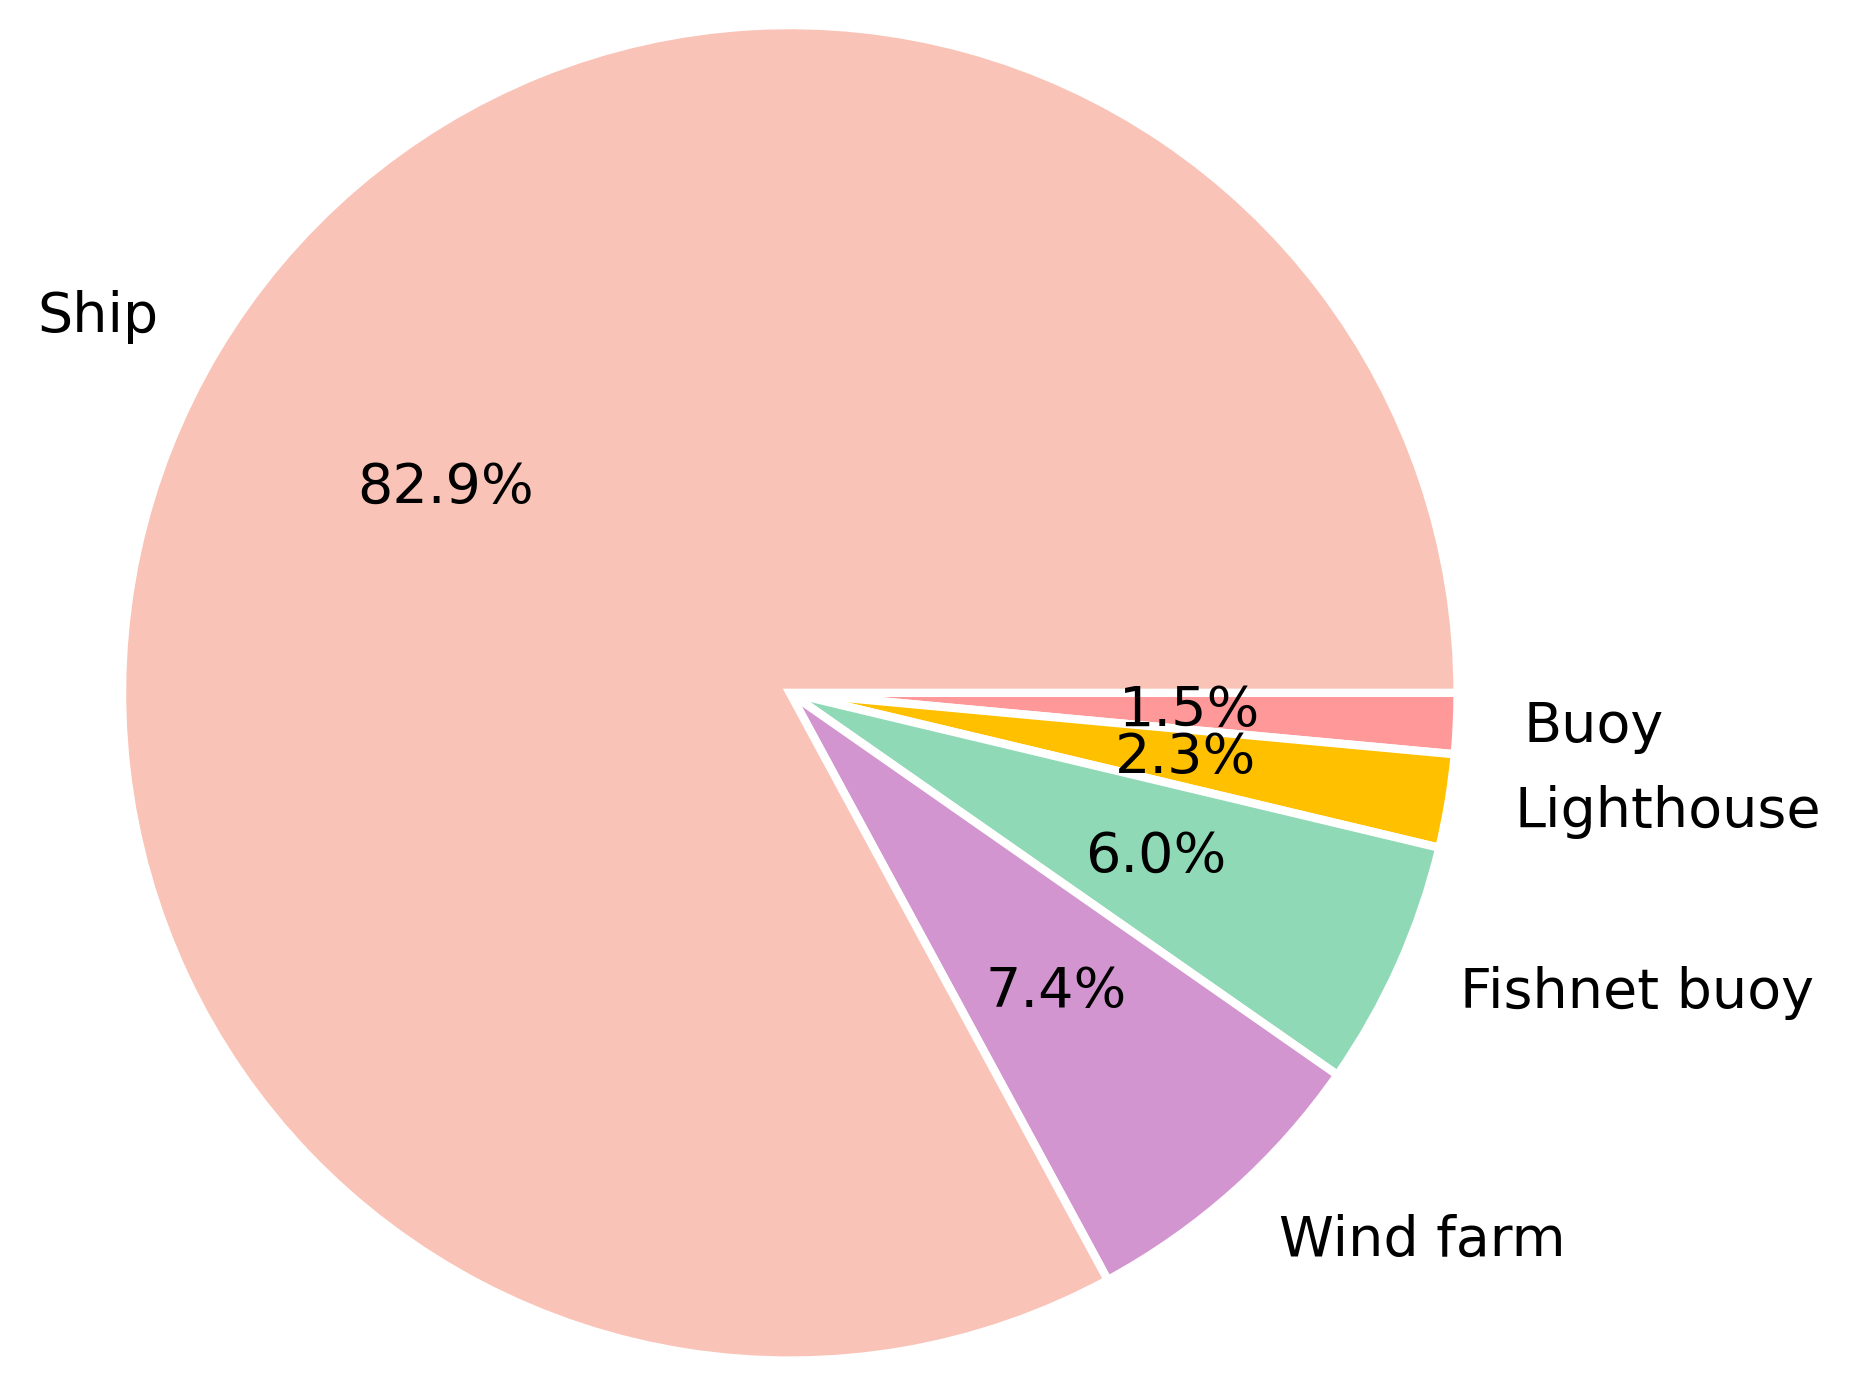
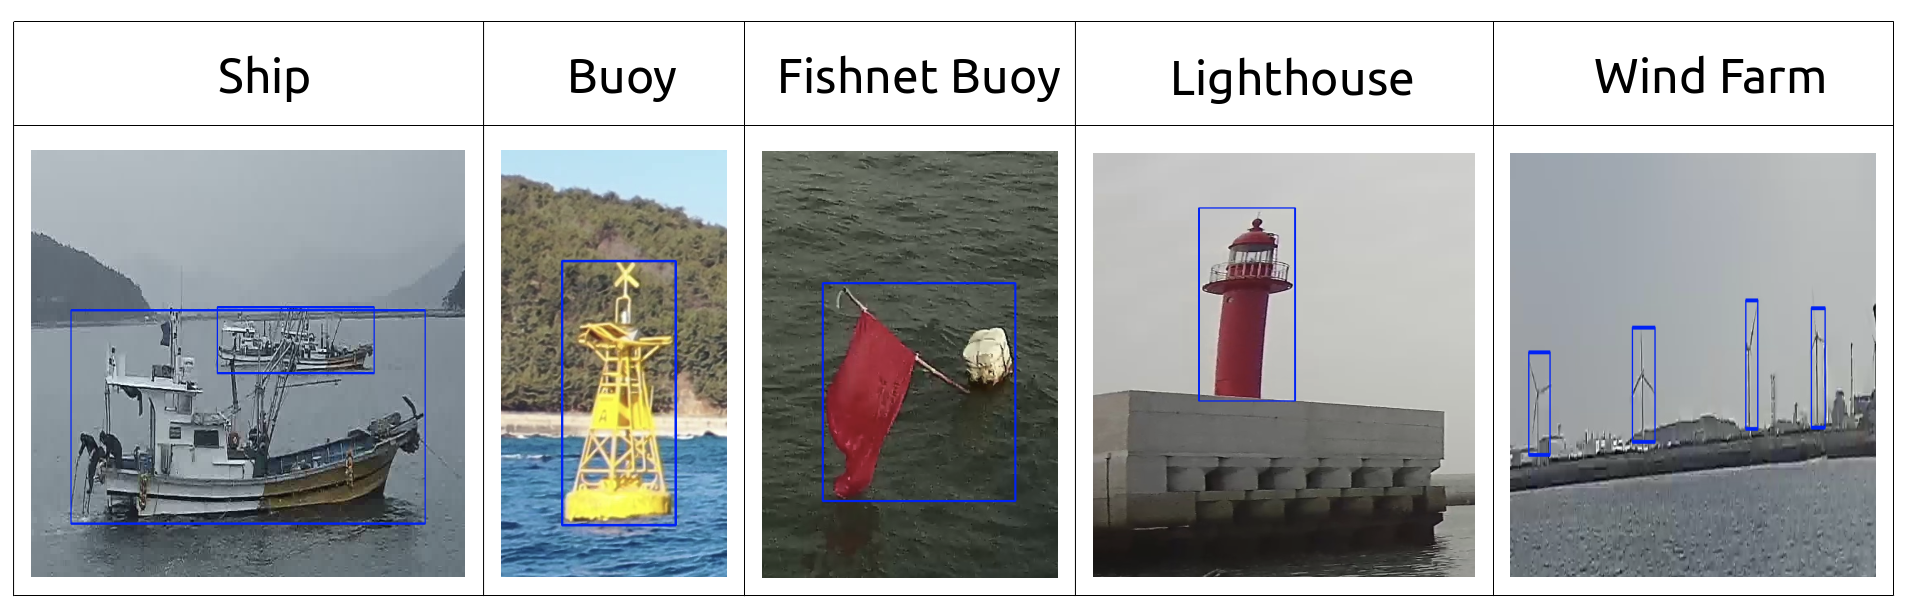
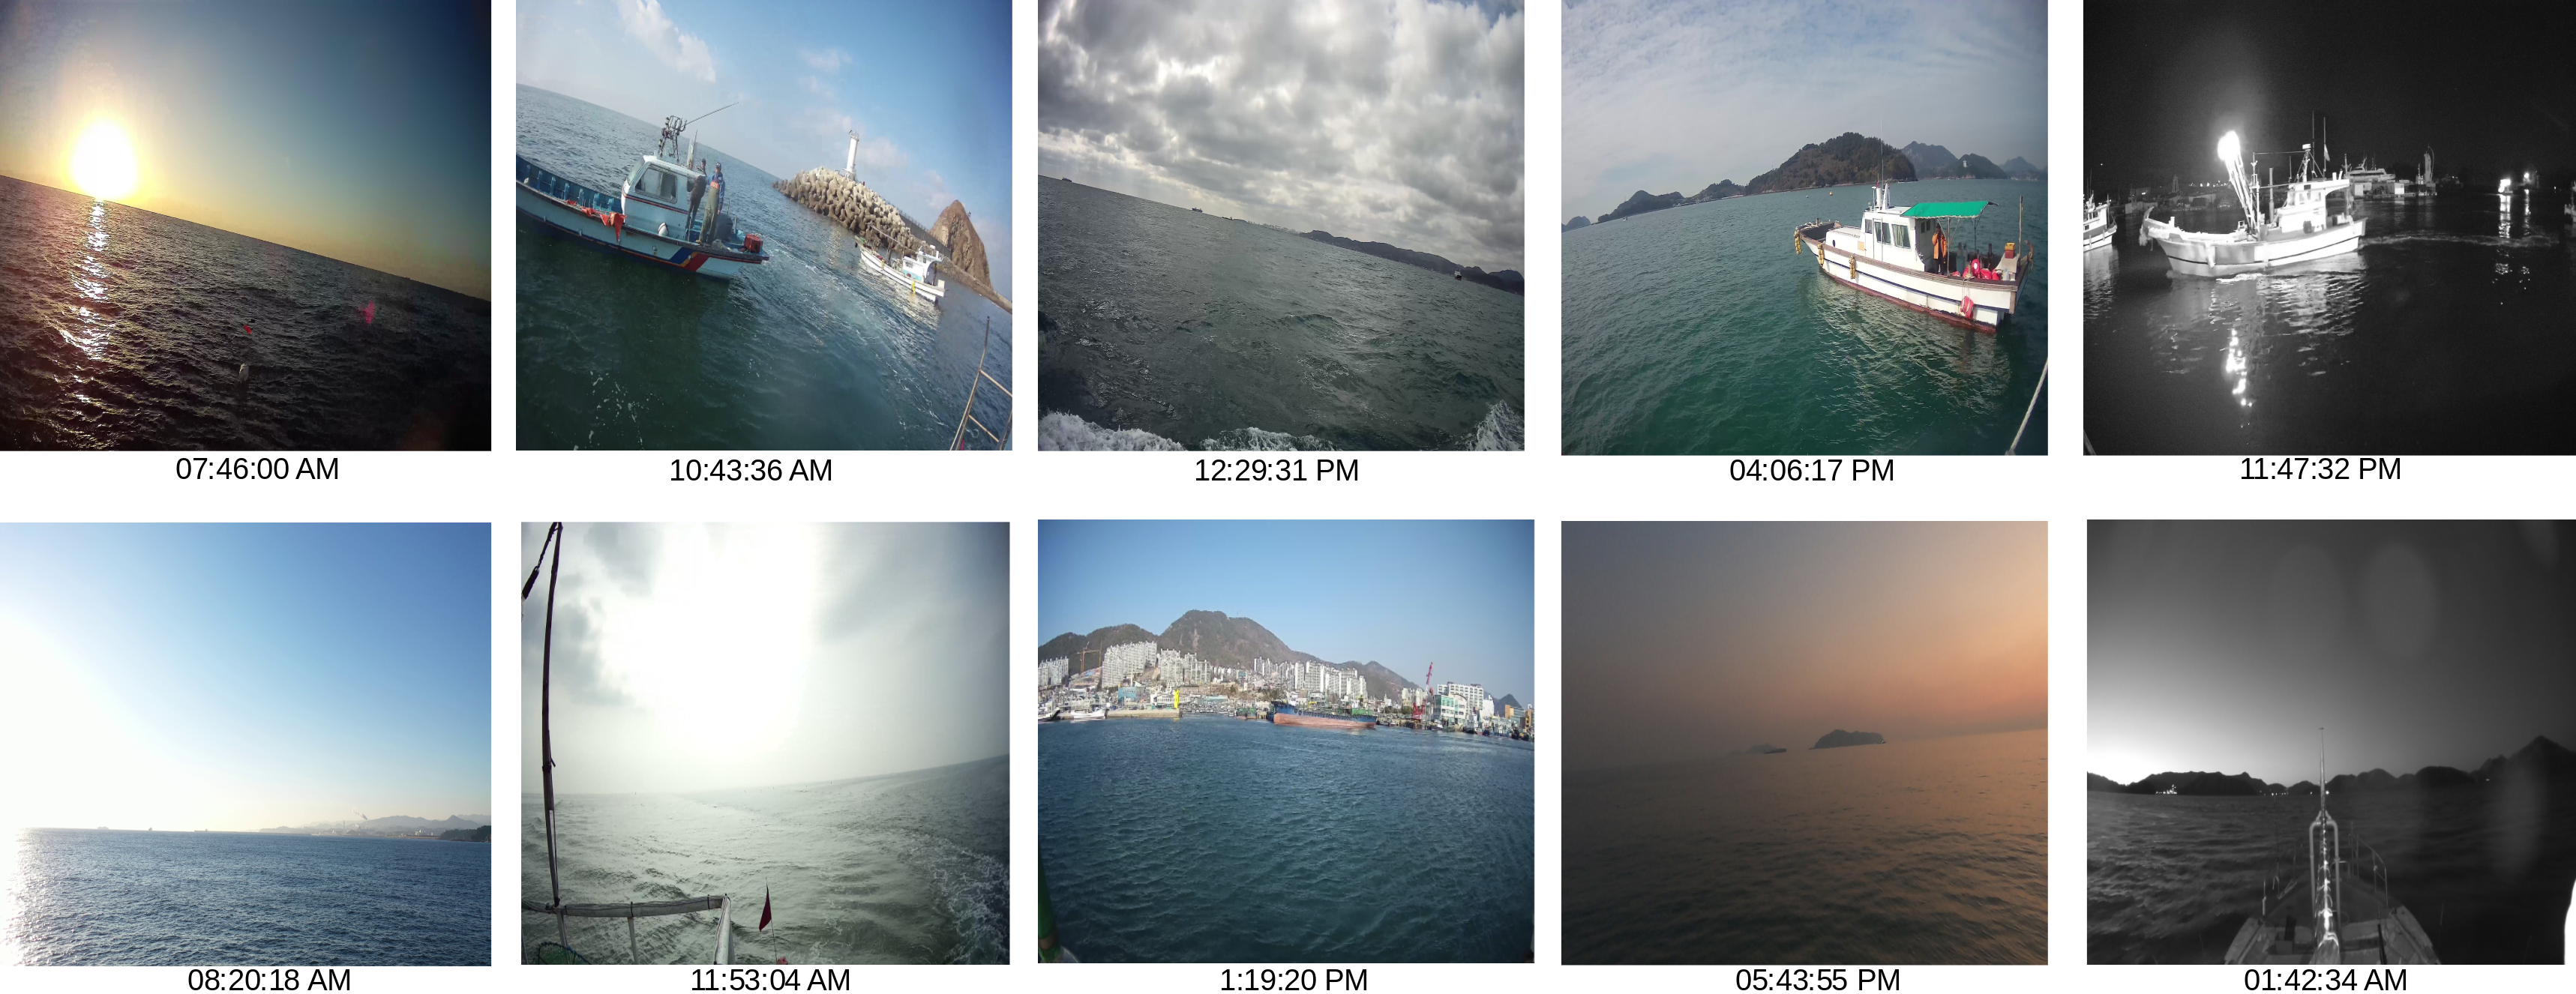
Class-wise representation of the number of objects in the dataset is shown in Figure 4. It also shows image samples containing objects from the five classes. We present a dataset that can be used to develop robust and reliable deep learning models for real-time use. However, real-time sea environment contains wide variations in illumination, background and viewpoint. These large variations in test data compared to that of training data can be challenging for a deep learning model as the model becomes biased towards the learned training data. Therefore, we collected data during different times of the day like sunrise, daytime, sunset and night time from various locations and camera angles to gather images with illumination, background and viewpoint variation.
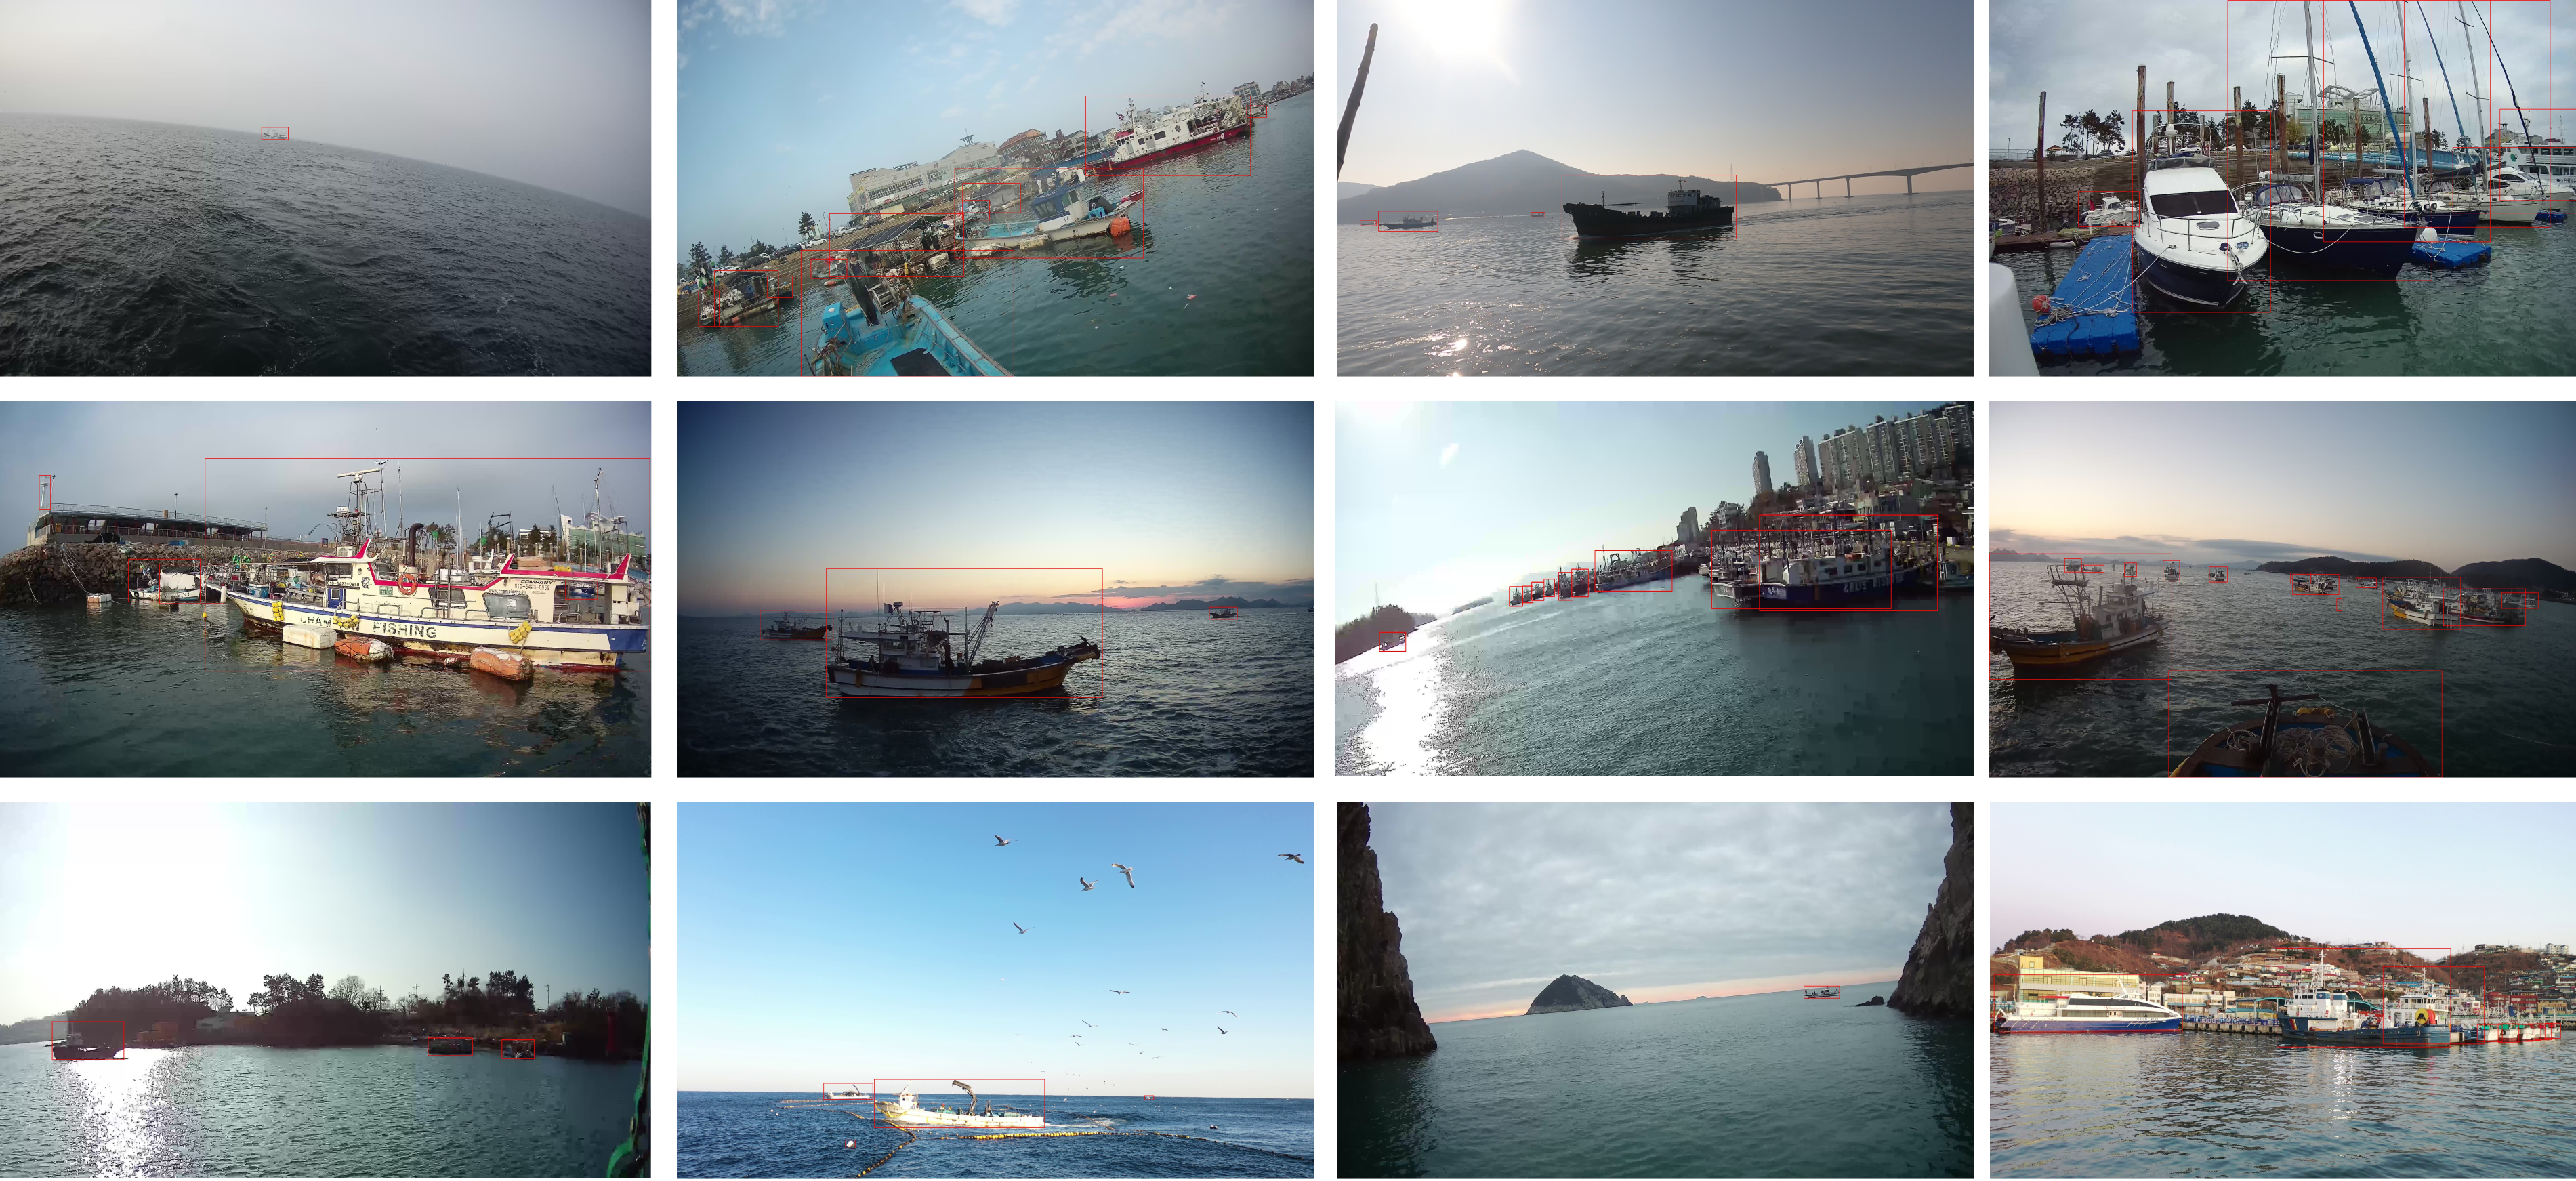
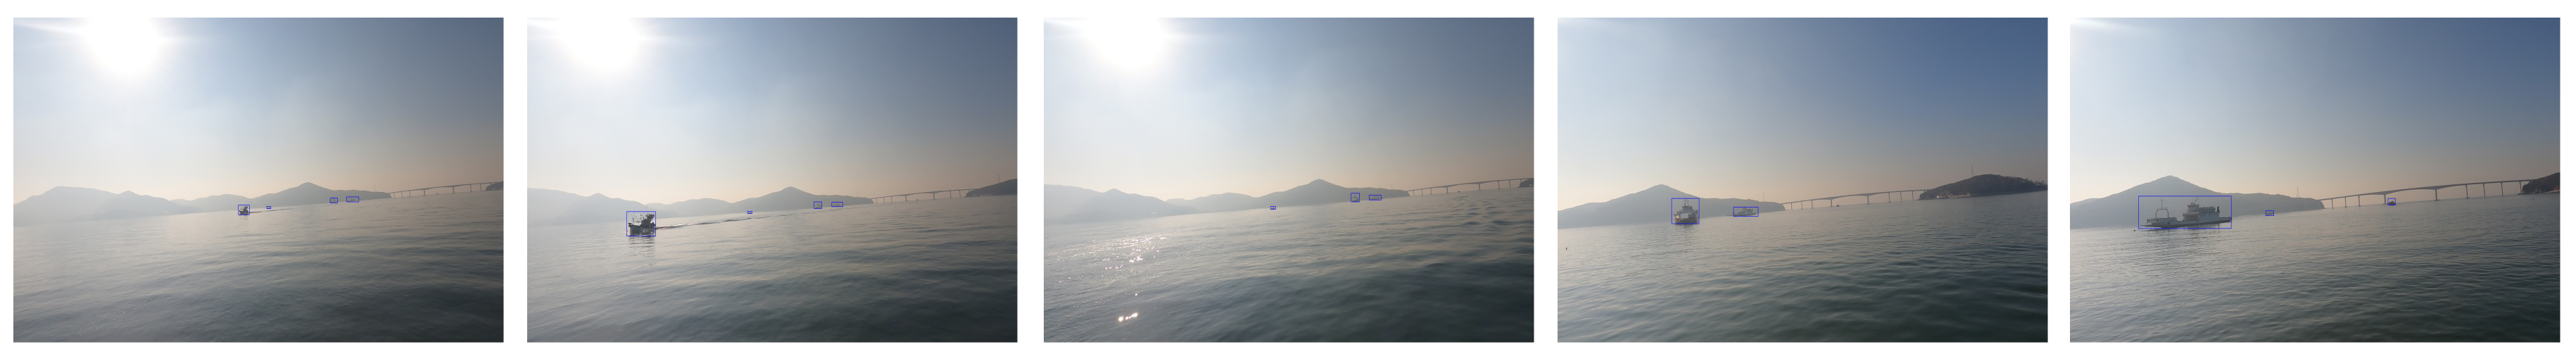
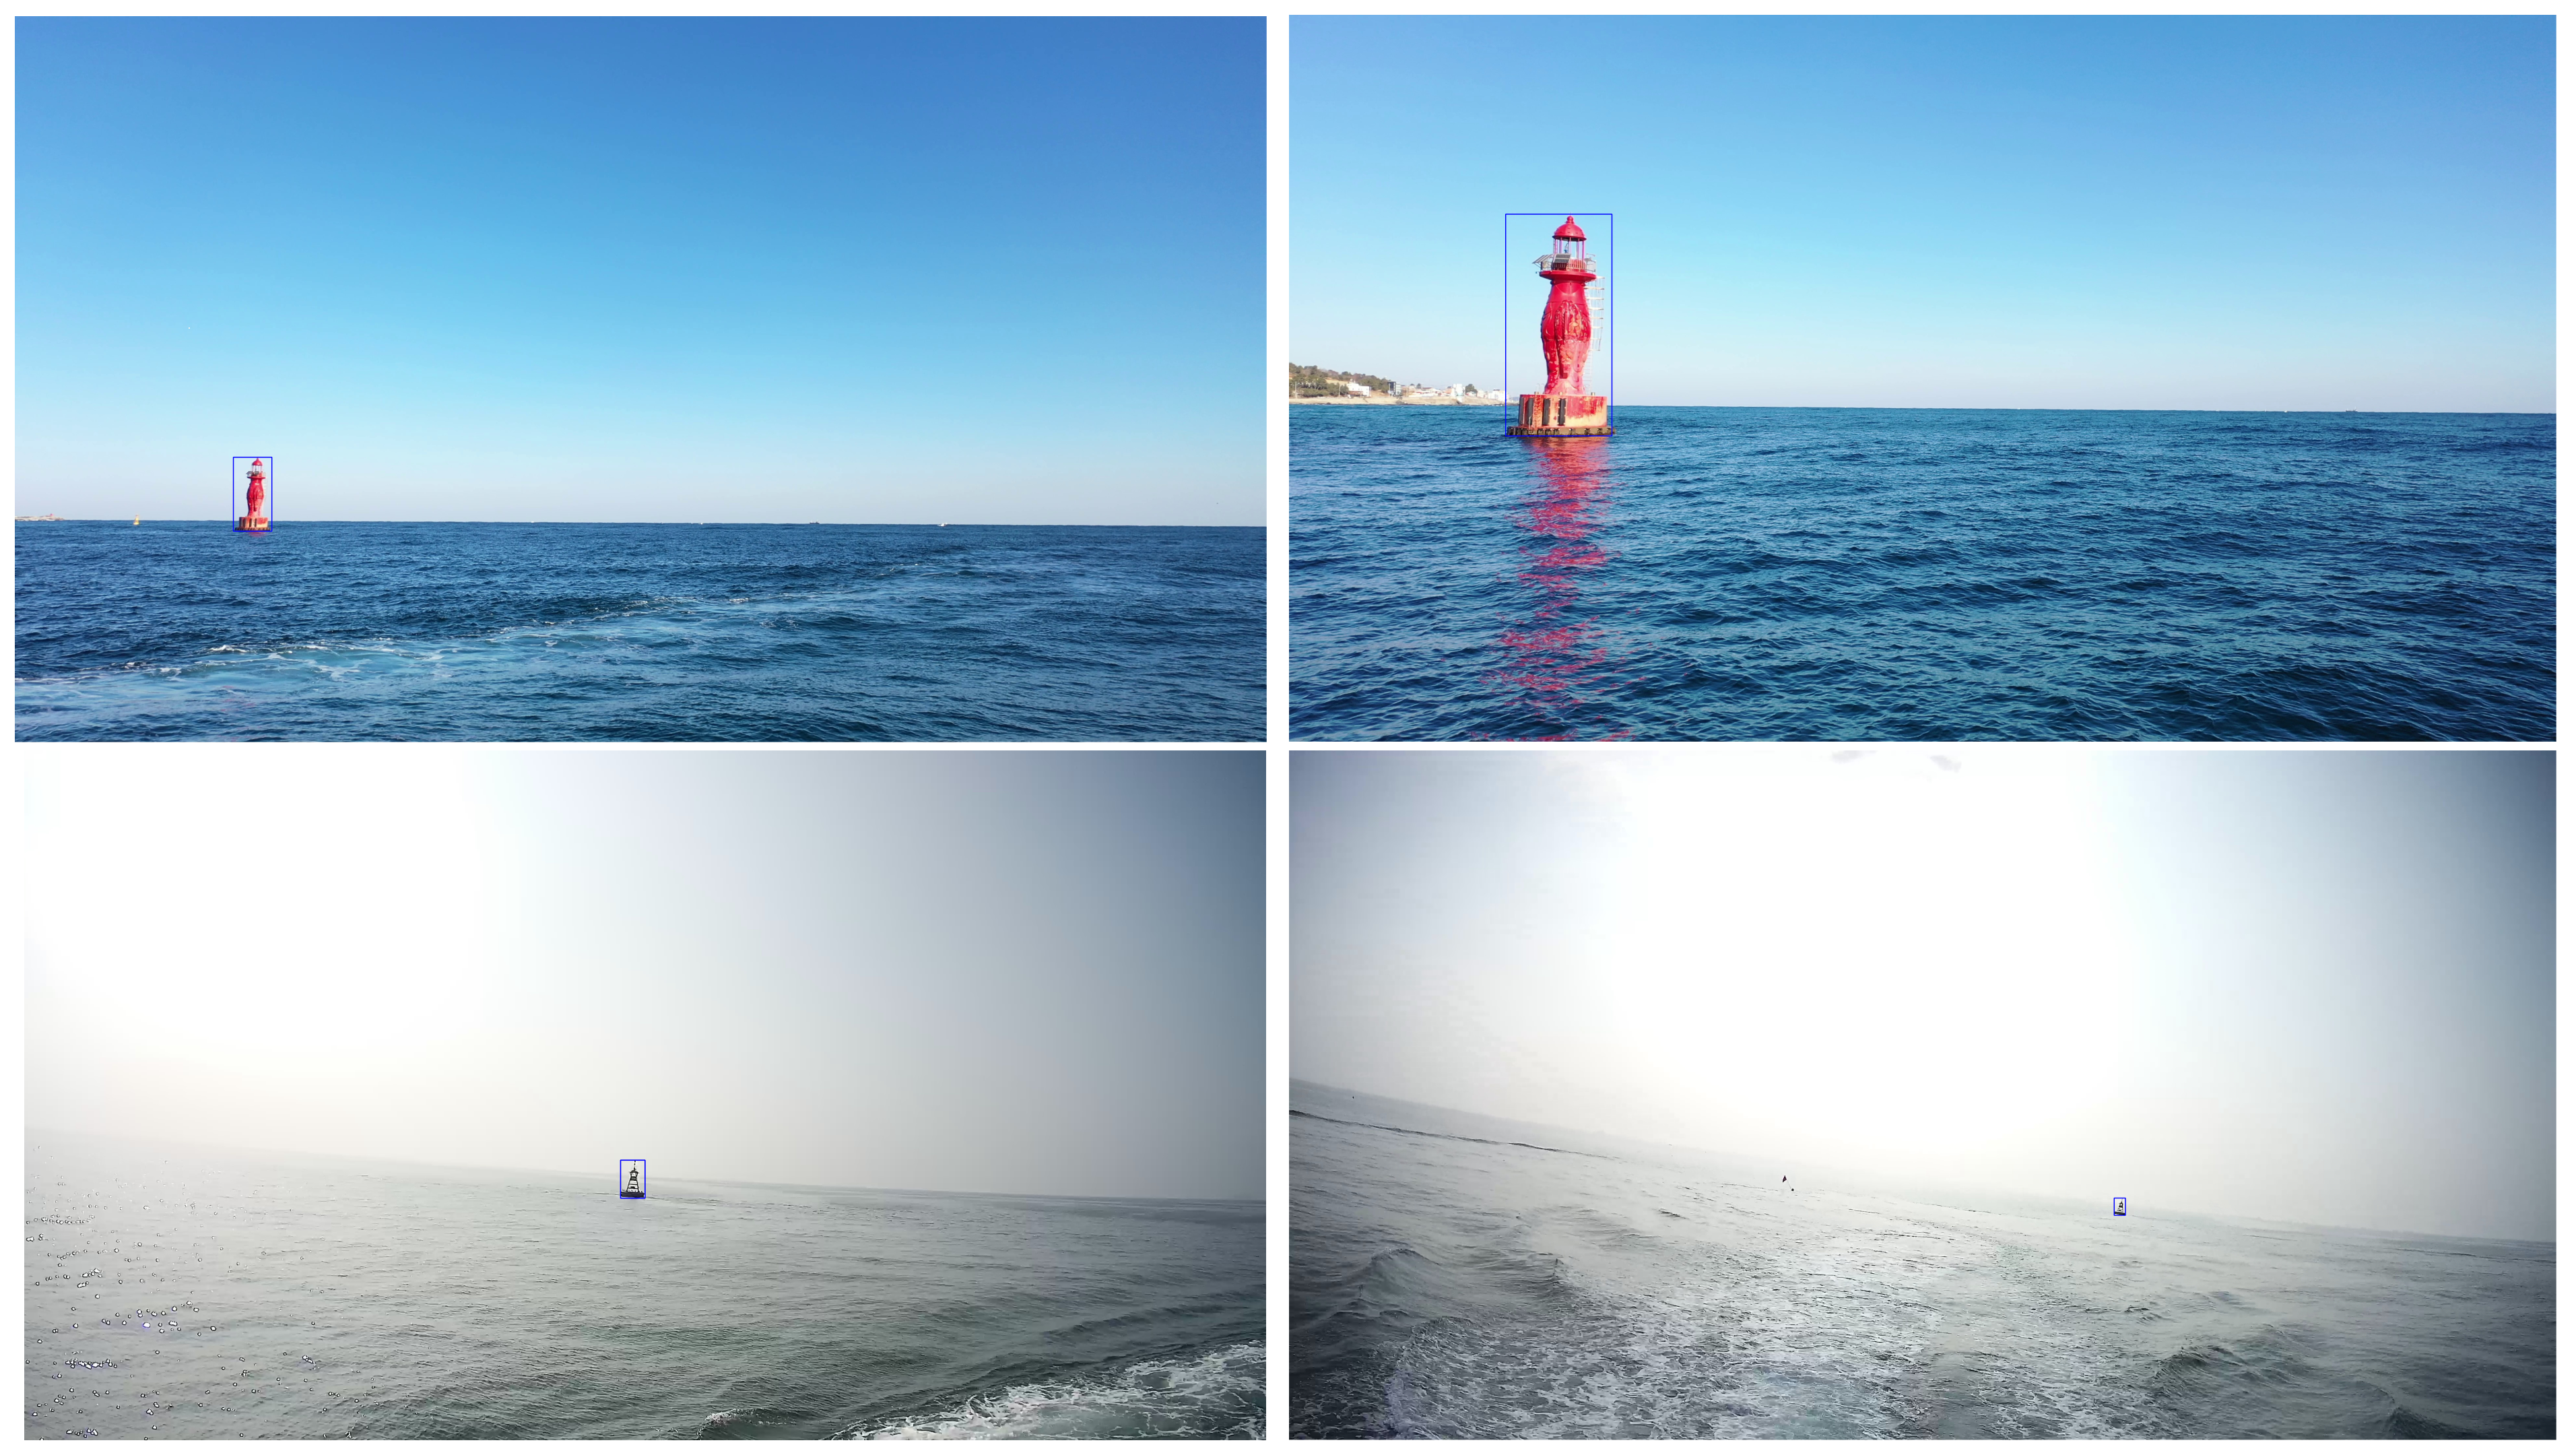
In terms of practical utilization for a deep learning model, it is important to collect data containing various situations. The KOLOMVERSE has images with varied background information as the dataset is collected from 21 different territorial waters of Korea. In addition, even objects seen from far away are dangerous at the sea, so very small objects should be recognized effectively. However, most object detection datasets are not suitable for use in real-world environments because they have only medium to large scale objects. Therefore, the KOLOMVERSE is built with high resolution images and contains objects seen from far away. In the KOLOMVERSE, many objects have occlusions, ranging from sparse occlusion to heavy occlusion. These variations in occclusions make the KOLOMVERSE a robust dataset for discriminative learning. In addition, proportion variation in our dataset is also an important factor to note. The annotations in our dataset do not only contain fully visible parts of the objects but also meaningful semi or partially visible objects. Inclusion of such objects create occlusion and proportion varied samples in our dataset. These variations in illumination, viewpoint, occlusion, background, scale and proportion make object detectors trained with the KOLOMVERSE more suitable for real-time applications. Complete proofs of the variations in the KOLOMVERSE is provided in Appendix A.
5 Experiments on the KOLOMVERSE
Implementation details. The YOLO object detection series [16, 17, 18, 19] is a one-stage object detection model series that has versions ranging from YOLOv1 upto v5 and a few other variations with high accuracy and speed in the benchmark datasets. Using GPU, YOLO can be trained as a super fast and accurate object detector. Therefore, in this paper, we show our data efficiency in the newer versions of YOLO namely YOLOv3 and v4. We trained our dataset KOLOMVERSE with the YOLOv3 and YOLOv4 models using this repository 111https://github.com/AlexeyAB/darknet. For fast implementation of object detectors, Huang et al. [33] released the TensorFlow Object Detection API that supports TenforFlow2(TF2). The API contains codes for training models such as, SSD [20] with MobileNet [34], RetinaNet [35], FRCNN [22], Mask R-CNN [24] as well as SSD with EfficientDet [36] and CenterNet [25]. We trained SSD, CenterNet and FRCNN on the KOLOMVERSE using this repository 222https://github.com/tensorflow/models/tree/master/research/objectdetection. SSD is a single shot multibox detector which completely eliminates proposal generation and computates everything in a single network [20] and EfficientDet is a new family of object detectors, which consistently achieve much better efficiency than prior architectures [36]. We performed experiments on SSD with EfficientDet architecture as backbone. CenterNet is a simple and effective anchor-free architecture that considers an object as the center point of its bounding box. It is differentiable, faster, and better than other similar detectors [25]. We performed experiments on CenterNet with Resnet101 architecture [37] as backbone. The FRCNN [22] is a two-stage architecture and is a state-of-the-art object detection tool based on a region proposal along with a fast R-CNN [21] network. Two-stage architectures slide a window through a feature map to localize objects, classify them and regress bounding boxes. In this study, we performed experiments on our dataset on the FRCNN network with Resnet50 as backbone [37] .
Experimental settings. To train YOLO models with our dataset, we first converted our dataset into the YOLO format. We did not change much of the pre-trained architectures except that we modified the last fully connected layers from MS COCO’s 80 classes [1] to 5 classes for our 5-class dataset as the pretrained models were trained on the MS COCO dataset. Also, we converted the configuration file of YOLO to be trained on a five classes dataset. In the configuartion file of YOLO models, we set the maximum batches to 10000 (number of classes*2000) and therefore, don’t use any other early stopping methods. To train the YOLO architectures, we resized the input size to 416416. We fine-tuned the YOLO architectures with a stochastic gradient optimizer and learning rate of 0.0001. Similar to the YOLO preprocessing, we firstly converted our dataset to train it on the FRCNN model. We resized the input size to 640640 and we finetuned the FRCNN with a momentum optimizer and a cosine decay learning rate of base 0.0004. For the CenterNet model, we resized the images to 512512 and finetuned the model with ADAM optimizer and a cosine decay learning rate of base 1e-6. Moreover, for training SSD with EfficientDet-D0, images were resized to input size 512512 and for training with backbone EfficientDet-D1, images were resized to 640640. The SSD models were finetuned with a momentum optimizer and a cosine decay learning rate of base 8e-4 for SSD with backbone EfficientDet-D0 and 8e-5 for SSD with backbone EfficientDet-D1. We apply early stopping for the models trained with TF2 to avoid overfitting. After training, we performed evaluations on both our validation and our test set. We performed our experiments using Tensorflow (YOLOv3,YOLOv4) and TF2 (SSD, CenterNet and FRCNN) and we deployed an NVIDIA RTX 6000 GPU with 40GB memory for the experiments.
Data sampling for training and evaluation. As KOLOMVERSE is huge, training the complete dataset is time-consuming and wastes a lot of resources such as electricity and memory. Therefore, we sampled our dataset to efficiently perform the experiments in this paper. As ship objects account for about 80 of our dataset, it is difficult to randomly sample the dataset as the generated set may contain only ship objects and completely miss samples from other classes. We first considered only the ship objects that co-occur with other objects in each image rather than the image that only contain ship objects. In addition, we sampled data from all the 21 environments and considered the balance among these environments. We performed our experiments on the sampled dataset with 149,175 number of training images, 18,643 number of validation images and 18,601 number of test images. Moreover, the object instances per class for the experiments are ship (393,936 instances), buoy (34,080 instances), fishnet buoy (95,815 instances), lighthouse (60,362 instances) and wind farm (147,846 instances). The sampled dataset is also available to download following the Github link in Section 1.
Detection results. Table 2 shows the evaluation results of the state-of-the-art detectors when trained and evaluated on our dataset. The results showed mean average precision (mAP) at Intersection over union (IOU) at 0.50 of both the validation (val) and the test set. IOU defines the overlap over union degree of two bounding boxes. From the Table 2, we observed that the CenterNet with Resnet101 performed better than any other detectors. Moreover, in Table 3 we provide a class-wise performance on both the validation and the test set using the various object detectors. We observe that the ship class has the best performance among all the five classes as even after sampling it has relatively more instances. We also observe that FRCNN performs best for ship class with mAP of 82.83 in the validation set and mAP of 82.59 in the test set. As the samples of fishnet buoy are very small, it is difficult to accurately detect these objects. Therefore, fishnet buoy class has the least mAP among all the 5 classes. CenterNet performs best for fishnet buoy class with mAP of 47.44 on the validation set and mAP of 48.04 on the test set.
| Model | Backbone | mAP50() val | mAP50() test |
|---|---|---|---|
| SSD | EfficientDet-D0 [36] | 46.61 | 46.64 |
| SSD | EfficientDet-D1 [36] | 52.11 | 52.09 |
| YOLOv3 | Darknet53 [18] | 59.87 | 59.57 |
| YOLOv4 | CSPDarknet53 [19] | 60.51 | 59.99 |
| FRCNN | Resnet50 [37] | 60.85 | 61.28 |
| CenterNet | Resnet101 [37] | 61.40 | 61.86 |
| Model | Evaluation Set | mAP50() | ||||
|---|---|---|---|---|---|---|
| Ship | Buoy | Fishnet Buoy | Lighthouse | Wind Farm | ||
| SSD(EfficientDet-D0) | val | 69.03 | 49.48 | 25.76 | 47.57 | 41.21 |
| test | 68.60 | 49.25 | 25.67 | 47.87 | 41.83 | |
| SSD(EfficientDet-D1) | val | 74.15 | 56.27 | 28.82 | 51.60 | 49.73 |
| test | 73.95 | 55.13 | 28.80 | 52.36 | 50.22 | |
| YOLOv3(Darknet53) | val | 78.08 | 64.70 | 35.04 | 64.14 | 57.40 |
| test | 77.35 | 63.59 | 34.61 | 64.71 | 57.55 | |
| YOLOv4(CSPDarknet53) | val | 78.74 | 64.93 | 38.08 | 65.48 | 55.33 |
| test | 77.99 | 63.84 | 36.13 | 66.16 | 55.84 | |
| FRCNN(Resnet50) | val | 82.83 | 59.21 | 46.41 | 59.08 | 56.71 |
| test | 82.59 | 58.16 | 46.76 | 61.04 | 57.85 | |
| CenterNet(Resnet101) | val | 77.67 | 65.92 | 47.44 | 64.69 | 51.26 |
| test | 77.34 | 65.77 | 48.04 | 65.50 | 52.66 |
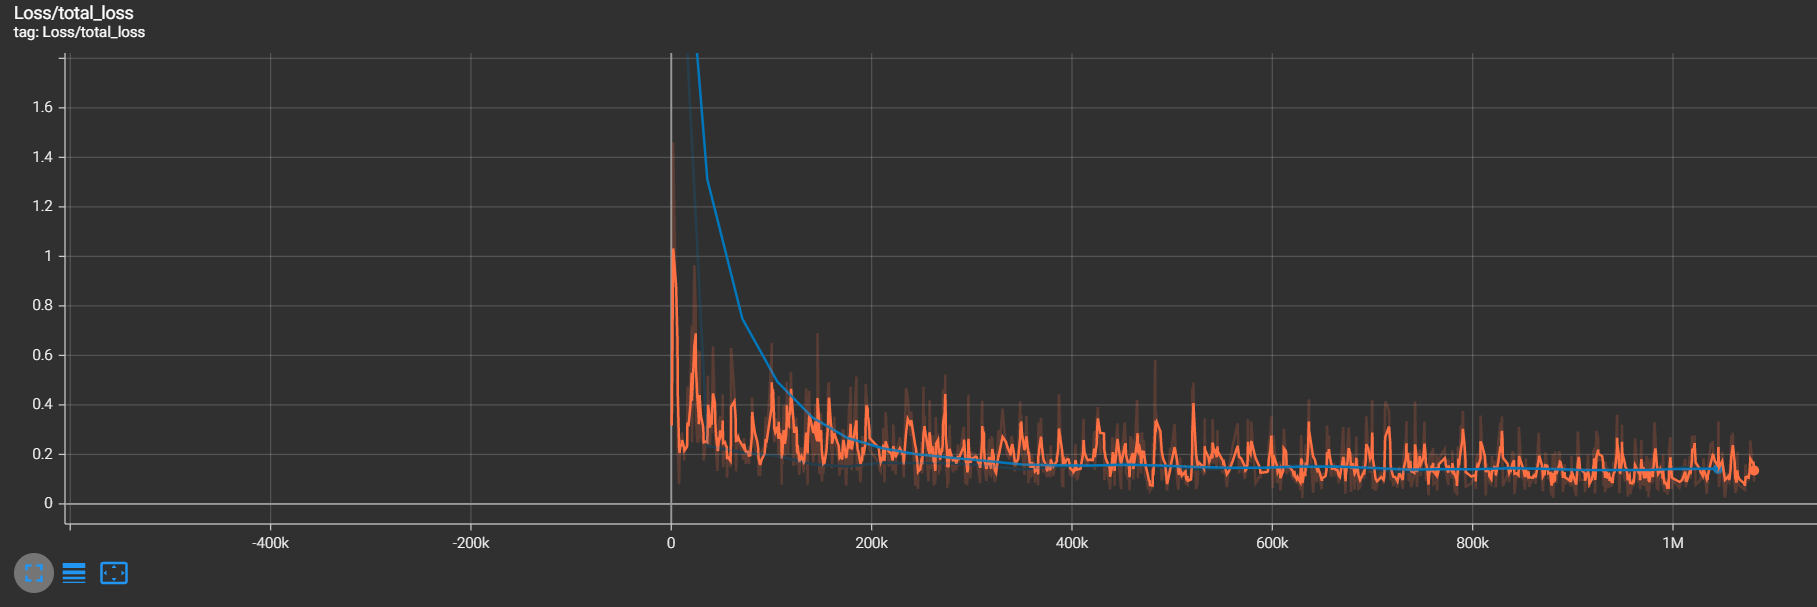
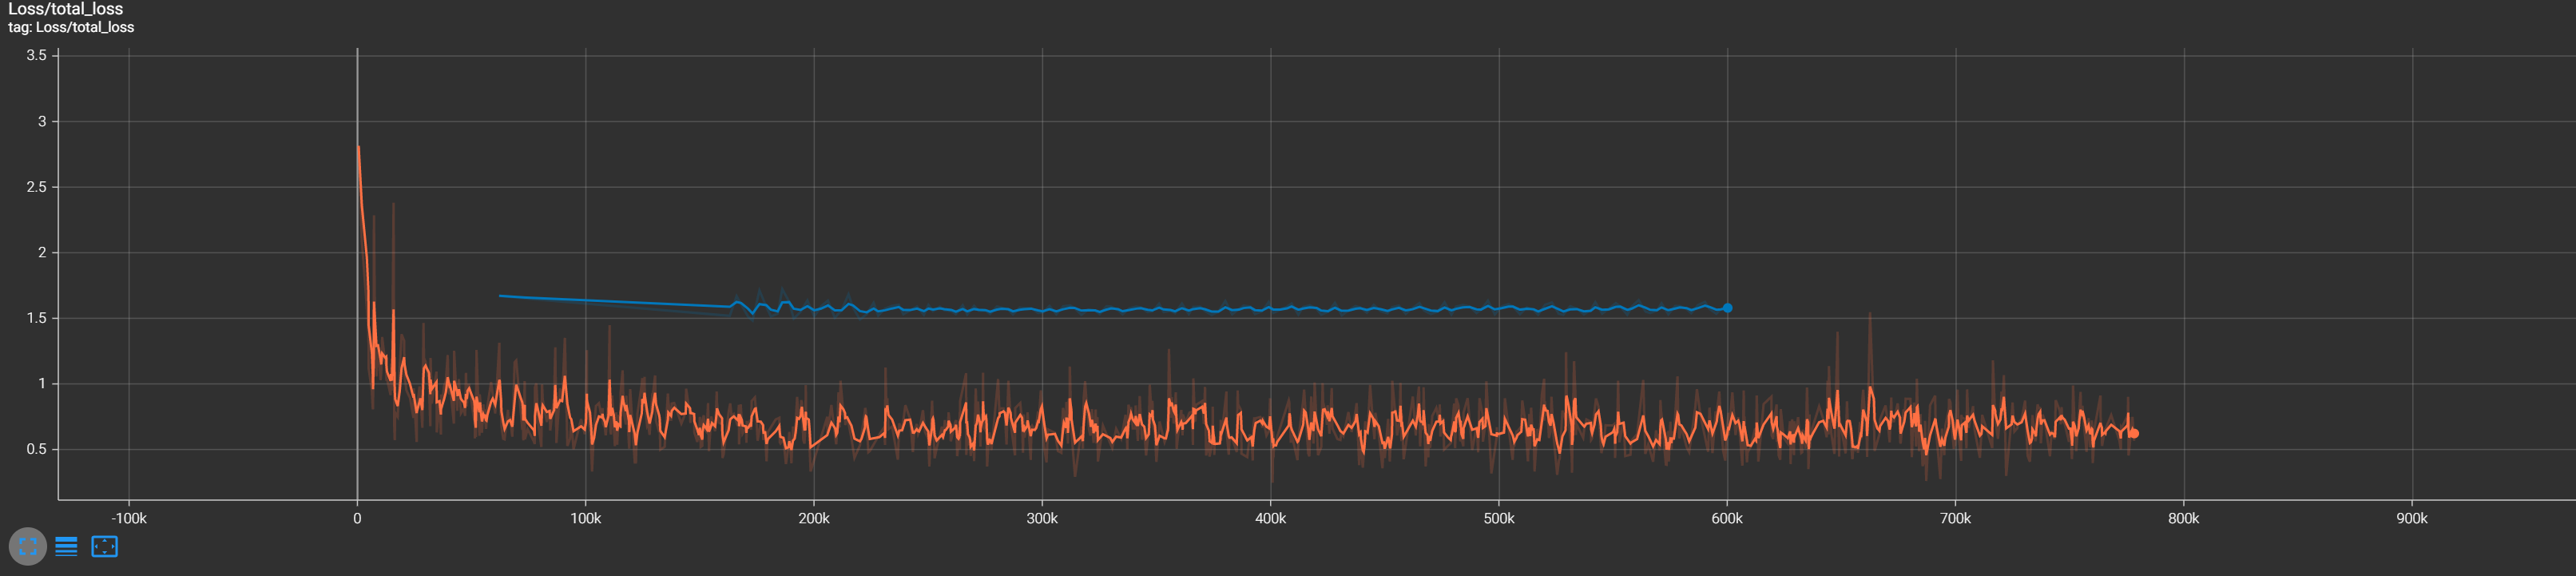
We also present the loss graphs of the two best performing models trained on the KOLOMVERSE. Figure 5 shows the loss graphs of FRCNN (Resnet50) and CenterNet (Resnet101) models trained on the KOLOMVERSE.
6 Discussions and Future Work
Ethics and social impact. Currently, we are carrying out an RD project with a goal to build a large-scale publicly available maritime dataset in South Korea. The dataset is collected directly by us, and therefore, there is no copyright issue. In addition, the name of the ships and human faces if visible in the data cannot be distinguished because we have blurred such objects in the dataset. Moreover, we recruited annotators using crowdsourcing and established an environment to work on a web-based annotation platform through training courses for platform use and annotation work. Finally, we presented the KOLOMVERSE, a large-scale dataset annotated in the maritime domain. The results of this research will be valuable in the development of various intelligent marine systems such as autonomous navigation systems, e-Navigation systems, search and rescue systems, and unmanned maritime monitoring systems and there is no negative societal impact in our dataset.
Data availability. KOLOMVERSE can be downloaded after filling the google form provided in the Github page (see Section 1). For ethical use of the KOLOMVERSE, we go through the google form answers and make an informed decision before sharing the dataset. Moreover, we aim to update the KOLOMVERSE by gathering suggestions from users and release the updated versions.
Limitations and future work. There still is some room for improvement in this research. The KOLOMVERSE was built with images of objects detected through voyages of ships and contains most of the objects recognized at sea. However, since data were collected through ship navigation, there are more ship data than other categories. Therefore, it is necessary to resolve the data imbalance by collecting data for other categories in the future. Moreover, there are mostly fishing boats in the KOLOMVERSE. We aim to resolve this in the future by adding different types of ship objects.
7 Conclusion
We presented a publicly available large-scale object detection dataset in the maritime domain. Through this dataset, we aim to overcome the lack of large-scale datasets for object detection in the maritime domain. Our dataset contains 2,151,470 4K images with five maritime object classes for detection. Moreover, compared to other datasets, we have more diverse and difficult categories crucial to maritime object detection. We trained and evaluated our data on pre-trained state-of-the-art object detectors and achieved high accuracies. Our experiments demonstrated that our dataset performs better in two-stage detectors. Moreover, we show that our dataset can be used as a benchmark in the maritime domain for object detection. We aim to further expand our research to broader areas such as object detection, classification and image segmentation. Finally, we hope that this work will help researchers build more effective detectors in the maritime domain.
Acknowledgments and Disclosure of Funding
This research was supported by the project titled “Development of Open Platform Technologies for Smart Maritime Safety and Industries” funded by the Korea Research Institute of Ships and Ocean Engineering (PES4450).
References
- [1] Lin, T.-Y., M. Maire, S. Belongie, et al. Microsoft coco: Common objects in context. In European conference on computer vision, pages 740–755. Springer, 2014.
- [2] Everingham, M., L. Van Gool, C. K. Williams, et al. The pascal visual object classes (voc) challenge. International journal of computer vision, 88(2):303–338, 2010.
- [3] Deng, J., W. Dong, R. Socher, et al. Imagenet: A large-scale hierarchical image database. In 2009 IEEE conference on computer vision and pattern recognition, pages 248–255. IEEE, 2009.
- [4] Krasin, I., T. Duerig, N. Alldrin, et al. Openimages: A public dataset for large-scale multi-label and multi-class image classification. Dataset available from https://github. com/openimages, 2(3):18, 2017.
- [5] Hjelmås, E., B. K. Low. Face detection: A survey. Computer vision and image understanding, 83(3):236–274, 2001.
- [6] Dollár, P., C. Wojek, B. Schiele, et al. Pedestrian detection: A benchmark. In 2009 IEEE Conference on Computer Vision and Pattern Recognition, pages 304–311. IEEE, 2009.
- [7] Friedland, B. Optimum steady-state position and velocity estimation using noisy sampled position data. IEEE transactions on Aerospace and Electronic Systems, AES-9(6):906–911, 1973.
- [8] Wen, L.-H., K.-H. Jo. Fast and accurate 3d object detection for lidar-camera-based autonomous vehicles using one shared voxel-based backbone. IEEE Access, 9:22080–22089, 2021.
- [9] Wang, W., Y. Li, X. Luo, et al. Ocean image data augmentation in the usv virtual training scene. Big Earth Data, 4(4):451–463, 2020.
- [10] Elkins, L., D. Sellers, W. R. Monach. The autonomous maritime navigation (amn) project: Field tests, autonomous and cooperative behaviors, data fusion, sensors, and vehicles. Journal of Field Robotics, 27(6):790–818, 2010.
- [11] Liu, R. W., J. Nie, S. Garg, et al. Data-driven trajectory quality improvement for promoting intelligent vessel traffic services in 6g-enabled maritime iot systems. IEEE Internet of Things Journal, 8(7):5374–5385, 2020.
- [12] Shao, Z., W. Wu, Z. Wang, et al. Seaships: A large-scale precisely annotated dataset for ship detection. IEEE transactions on multimedia, 20(10):2593–2604, 2018.
- [13] Ray, C., R. Dréo, E. Camossi, et al. Heterogeneous integrated dataset for maritime intelligence, surveillance, and reconnaissance. Data in brief, 25:104141, 2019.
- [14] Ramos, M. A., I. B. Utne, A. Mosleh. Collision avoidance on maritime autonomous surface ships: Operators’ tasks and human failure events. Safety science, 116:33–44, 2019.
- [15] Piccioli, G., E. De Micheli, P. Parodi, et al. Robust method for road sign detection and recognition. Image and Vision Computing, 14(3):209–223, 1996.
- [16] Redmon, J., S. Divvala, R. Girshick, et al. You only look once: Unified, real-time object detection. In Proceedings of the IEEE conference on computer vision and pattern recognition, pages 779–788. 2016.
- [17] Redmon, J., A. Farhadi. Yolo9000: better, faster, stronger. In Proceedings of the IEEE conference on computer vision and pattern recognition, pages 7263–7271. 2017.
- [18] —. Yolov3: An incremental improvement. arXiv preprint arXiv:1804.02767, 2018.
- [19] Bochkovskiy, A., C.-Y. Wang, H.-Y. M. Liao. Yolov4: Optimal speed and accuracy of object detection. arXiv preprint arXiv:2004.10934, 2020.
- [20] Liu, W., D. Anguelov, D. Erhan, et al. Ssd: Single shot multibox detector. In European conference on computer vision, pages 21–37. Springer, 2016.
- [21] Girshick, R. Fast r-cnn. In Proceedings of the IEEE international conference on computer vision, pages 1440–1448. 2015.
- [22] Ren, S., K. He, R. Girshick, et al. Faster r-cnn: Towards real-time object detection with region proposal networks. Advances in neural information processing systems, 28:91–99, 2015.
- [23] Dai, J., Y. Li, K. He, et al. R-fcn: Object detection via region-based fully convolutional networks. Advances in neural information processing systems, 29, 2016.
- [24] He, K., G. Gkioxari, P. Dollár, et al. Mask r-cnn. In Proceedings of the IEEE international conference on computer vision, pages 2961–2969. 2017.
- [25] Zhou, X., D. Wang, P. Krähenbühl. Objects as points. arXiv preprint arXiv:1904.07850, 2019.
- [26] Prasad, D. K., D. Rajan, L. Rachmawati, et al. Video processing from electro-optical sensors for object detection and tracking in a maritime environment: A survey. IEEE Transactions on Intelligent Transportation Systems, 18(8):1993–2016, 2017.
- [27] Zhang, M. M., J. Choi, K. Daniilidis, et al. Vais: A dataset for recognizing maritime imagery in the visible and infrared spectrums. In Proceedings of the IEEE Conference on Computer Vision and Pattern Recognition Workshops, pages 10–16. 2015.
- [28] Soloviev, V., F. Farahnakian, L. Zelioli, et al. Comparing cnn-based object detectors on two novel maritime datasets. In 2020 IEEE International Conference on Multimedia & Expo Workshops (ICMEW), pages 1–6. IEEE, 2020.
- [29] Patino, L., T. Cane, A. Vallee, et al. Pets 2016: Dataset and challenge. In Proceedings of the IEEE Conference on Computer Vision and Pattern Recognition Workshops, pages 1–8. 2016.
- [30] Bloisi, D. D., L. Iocchi, A. Pennisi, et al. Argos-venice boat classification. In 2015 12th IEEE International Conference on Advanced Video and Signal Based Surveillance (AVSS), pages 1–6. IEEE, 2015.
- [31] Kristan, M., V. S. Kenk, S. Kovačič, et al. Fast image-based obstacle detection from unmanned surface vehicles. IEEE transactions on cybernetics, 46(3):641–654, 2015.
- [32] Shorten, C., T. M. Khoshgoftaar. A survey on image data augmentation for deep learning. Journal of big data, 6(1):1–48, 2019.
- [33] Huang, J., V. Rathod, C. Sun, et al. Speed/accuracy trade-offs for modern convolutional object detectors. In Proceedings of the IEEE Conference on Computer Vision and Pattern Recognition (CVPR). 2017.
- [34] Howard, A. G., M. Zhu, B. Chen, et al. Mobilenets: Efficient convolutional neural networks for mobile vision applications. arXiv preprint arXiv:1704.04861, 2017.
- [35] Lin, T.-Y., P. Goyal, R. Girshick, et al. Focal loss for dense object detection. In Proceedings of the IEEE International Conference on Computer Vision (ICCV). 2017.
- [36] Tan, M., R. Pang, Q. V. Le. Efficientdet: Scalable and efficient object detection. In Proceedings of the IEEE/CVF Conference on Computer Vision and Pattern Recognition (CVPR). 2020.
- [37] He, K., X. Zhang, S. Ren, et al. Deep residual learning for image recognition. In Proceedings of the IEEE conference on computer vision and pattern recognition, pages 770–778. 2016.
Appendix A Appendix
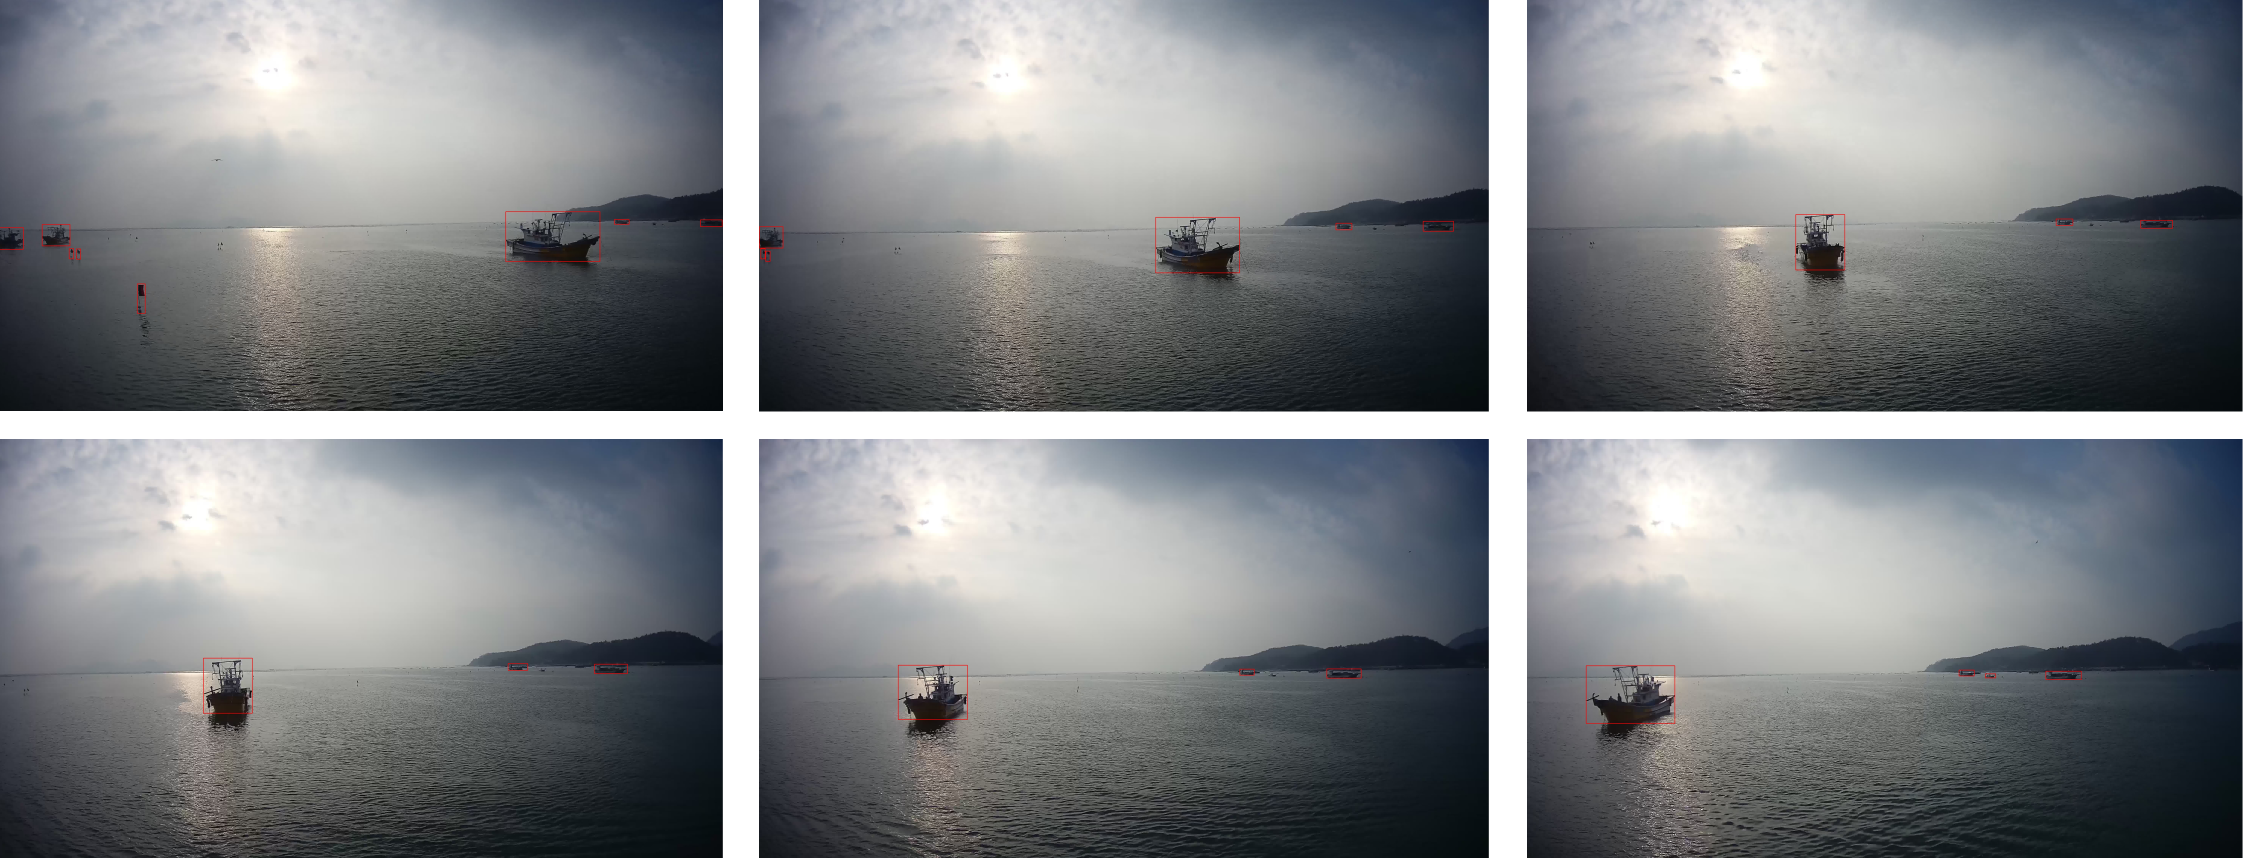
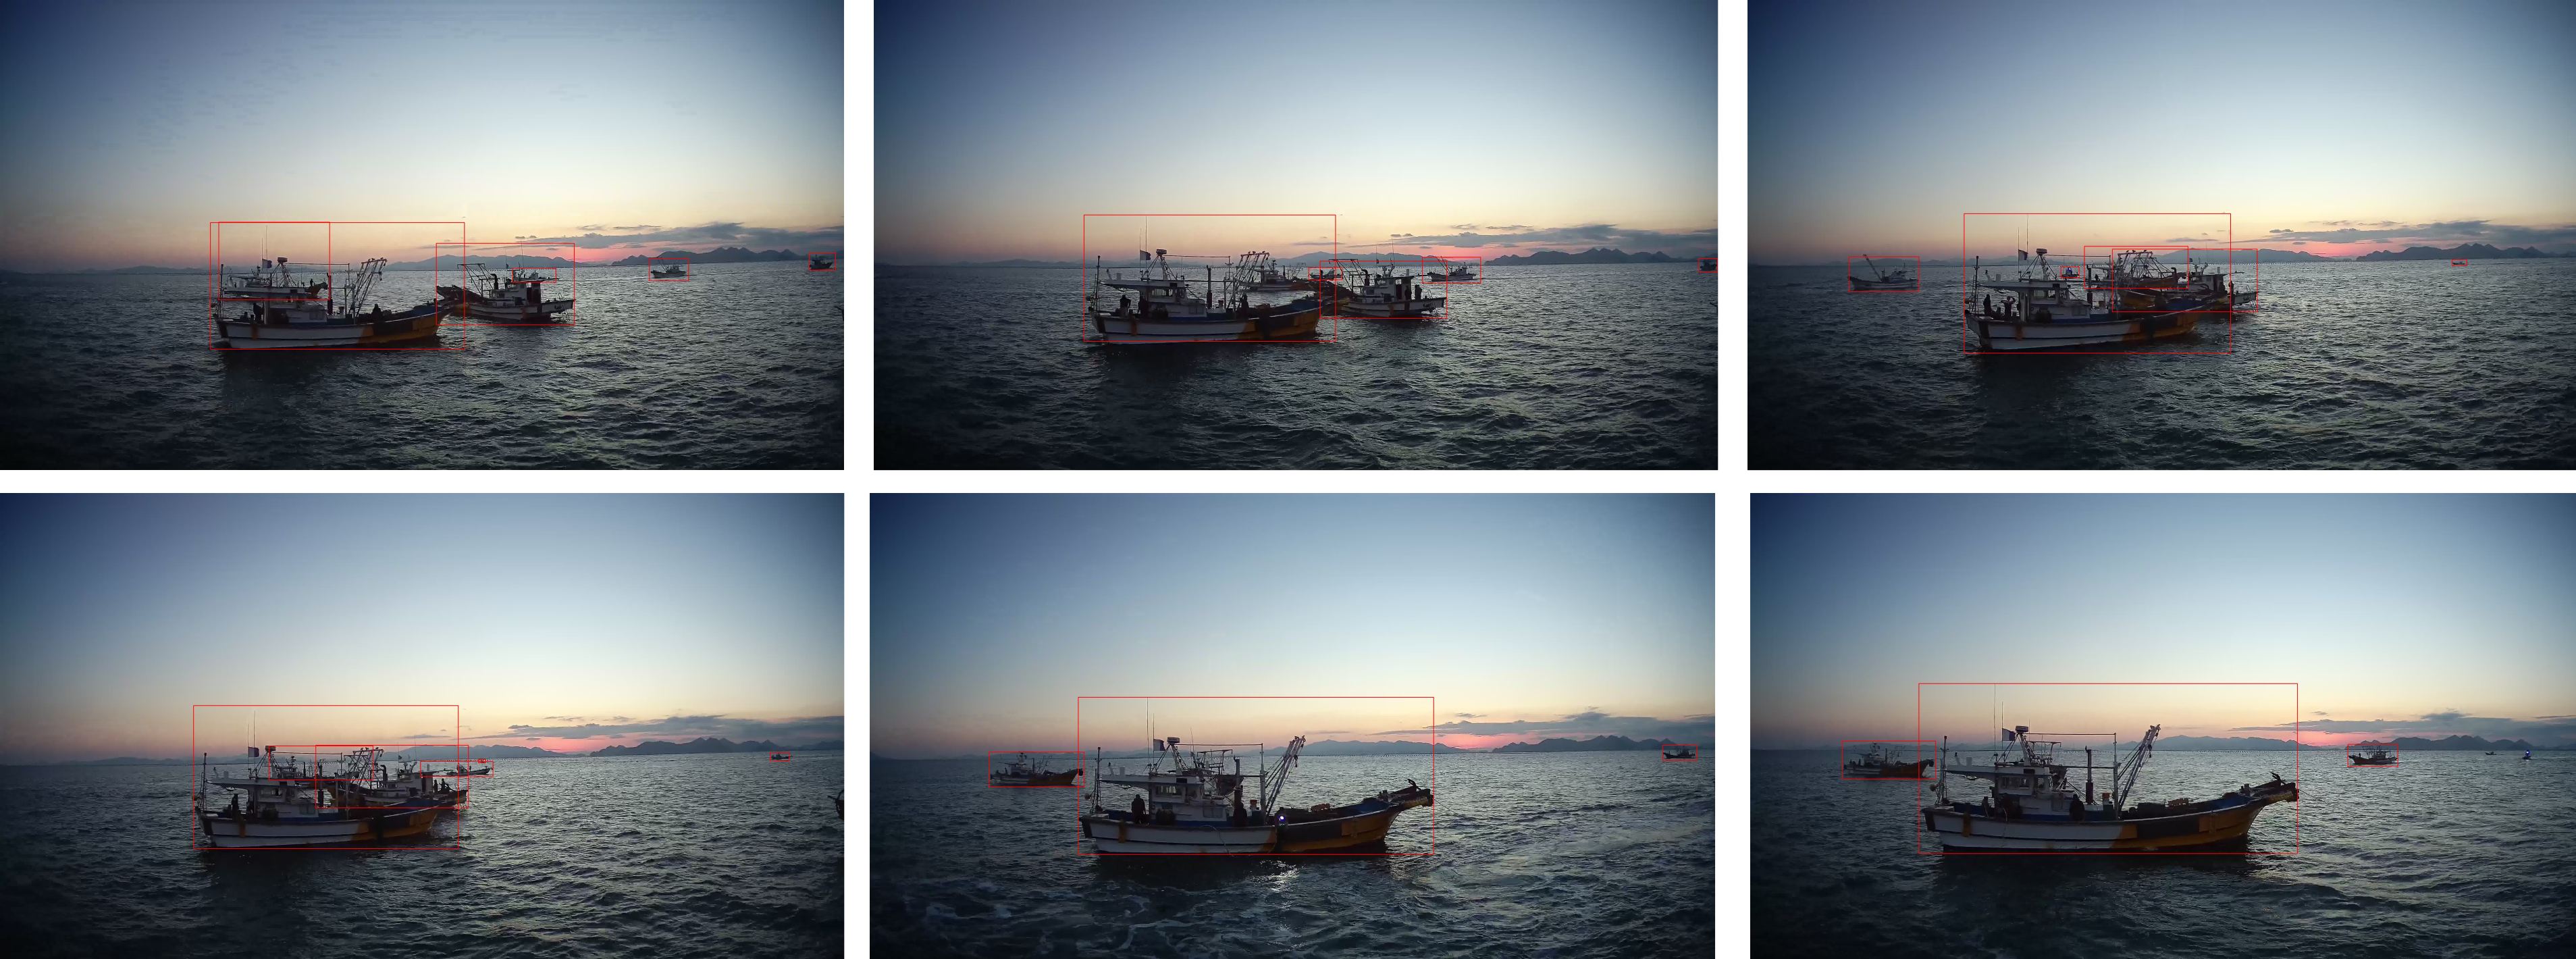
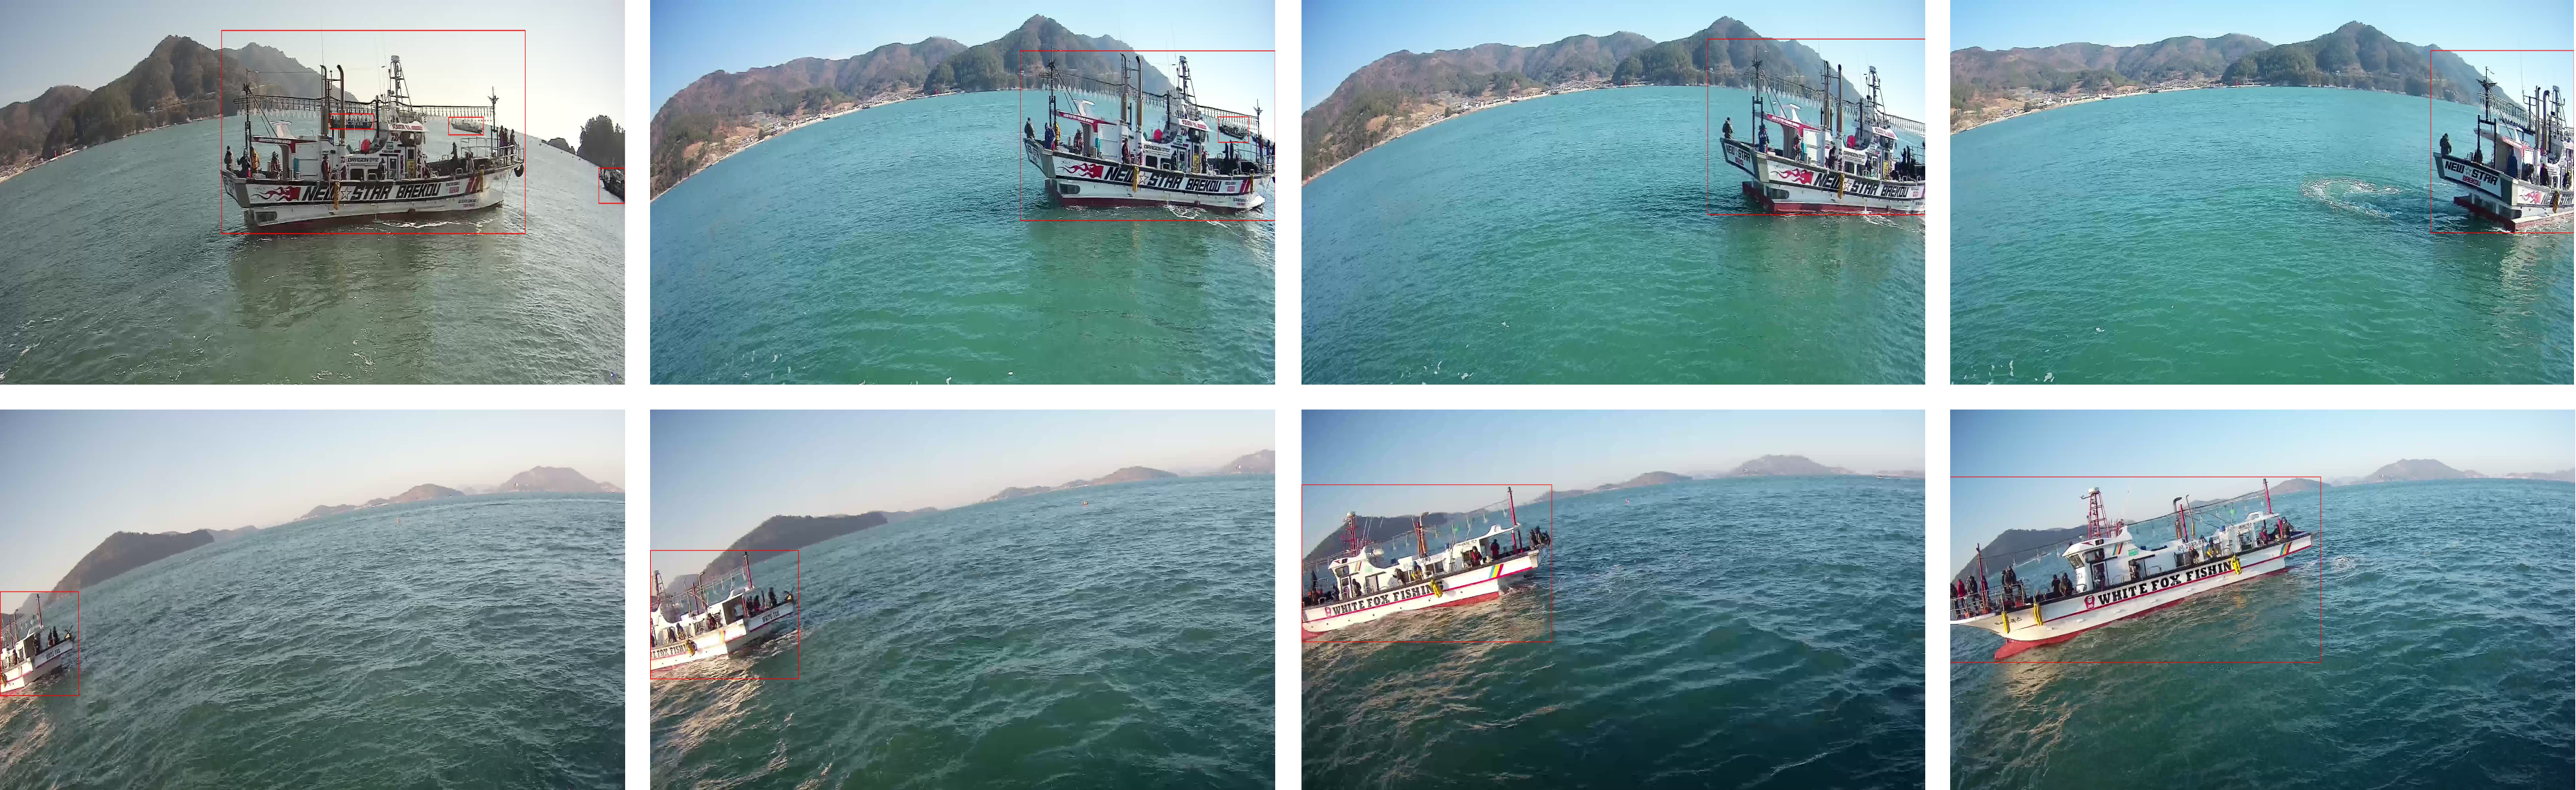
KOLOMVERSE has variations in illumination, viewpoint, occlusion, background, scale and proportion that makes object detectors trained with the KOLOMVERSE more suitable for real-time applications. Figure 6 shows image samples with illumination variation. Figure 7 shows image samples with background variation. Figure 8 shows image samples with scale variation in ship objects. Figure 9 shows image samples with scale variation in buoy objects. Figure 10 shows image samples with viewpoint variation. Figure 11 shows image samples with occlusion variation. Figure 12 shows image samples with proportion variation.