Pressure effects on the electronic structure, phonons, and superconductivity of noncentrosymmetric ThCoC2
Abstract
The electronic structure, phonons, electron-phonon coupling, and superconductivity are theoretically studied in noncentrosymmetric superconductor ThCoC2 as a function of pressure, in the pressure range 0 - 20 GPa. We found that the electronic band splitting induced by the spin-orbit coupling is enhanced under pressure. In spite of the overall stiffening of the crystal lattice, the electron-phonon coupling constant increases with pressure, from 0.583 at 0 GPa to 0.652 at 20 GPa. If the isotropic Eliashberg electron-phonon coupling theory is used to simulate the effect on the critical temperature , such an increase in results in a substantial increase of from 2.5 K at 0 GPa to 4 K at 20 GPa. This shows that examining the effect of pressure offers a chance to resolve the pairing mechanism in ThCoC2.
I Introduction
ThCoC2 is a low-temperature noncentrosymmetric superconductor with the critical temperature K Grant et al. (2014) and a puzzling nature of the superconducting state. The pairing mechanism has not been resolved yet, and the thermodynamic properties of the superconducting phase strongly deviate from the predictions of the Bardeen-Cooper-Shrieffer theory (BCS) Bardeen et al. (1957). Among them, we may list: (i) a non-exponential temperature dependence of the electronic specific heat , with the reduced specific heat jump of , much lower than the BCS value of 1.43 Grant et al. (2014); (ii) the positive curvature of the temperature dependence of the upper critical magnetic field ; (iii) a non-s-wave temperature dependence of the magnetic field penetration depth Bhattacharyya et al. (2019). The measured was fitted Bhattacharyya et al. (2019) assuming a wave nodal superconducting gap. Moreover, spin fluctuations were suggested to be the pairing mechanism in ThCoC2 Bhattacharyya et al. (2019).
Very interesting results were also obtained when the material was doped with nickel Grant et al. (2017). Critical temperature in ThCo1-xNixC2 increased with reaching K for , with no signs of magnetism and a gradual suppressing of the non-BCS features of the superconducting phase towards a more conventional fully gapped superconductor Grant et al. (2017).
To shed more light on the nature of superconductivity in ThCoC2, we have recently presented two theoretical works Kuderowicz et al. (2021); Kuderowicz and Wiendlocha (2022). The electronic structure, phonons and the electron-phonon coupling were computed in Ref. Kuderowicz et al. (2021) using the density functional perturbation theory Giannozzi et al. (2009, 2017); Baroni et al. (2001). We found that strong spin-orbit coupling combined with the lack of inversion symmetry leads to a large band splitting with an average value of 150 meV, comparable to that observed in the triplet superconductors CePt3Si and Li2Pt3B (see Smidman et al. (2017) and references therein). That indicates that the conventional -wave gap symmetry will be strongly perturbed, as the pairing inside the spin-split bands in the strong spin-orbit coupling limit requires the odd parity of the gap with respect to the Samokhin et al. (2004). As far as the pairing mechanism is concerned, the computed electron-phonon coupling constant was large enough to propose the electron-phonon interaction to be responsible for superconductivity in ThCoC2 Kuderowicz et al. (2021). However, our calculations within the isotropic Eliashberg formalism Eliashberg (1960) did not explain the experimental non-BCS features of ThCoC2, supporting the non--wave picture of its superconductivity, but with the possibility of the electron-phonon coupling mechanism Kuderowicz et al. (2021).
Electron-phonon coupling hypothesis was further strengthened by calculations of the effect of Ni doping presented in Ref. Kuderowicz and Wiendlocha (2022). Using the simplified rigid muffin-tin approximation (RMTA), the evolution of the electron-phonon coupling constant in ThCo1-xNixC2 was analyzed. Although due to the usage of the RMTA approach, the calculated values of were systematically underestimated when compared to the experimental estimates, the strong increase of was found, which remained in a qualitative agreement with the experimental observation of the increase in under the assumption of the electron-phonon coupling mechanism of superconductivity in ThCo1-xNixC2.
In this work, we study the effects of pressure on the electronic structure, phonons, electron-phonon interaction, and superconductivity in ThCoC2, which should help to determine the pairing interaction if the experimental studies are undertaken. In this context, it is important to recall the interesting pressure dependence of superconductivity in the sister isostructural superconductor . The external pressure initially increases the critical temperature from 2.8 K at 0 GPa to 3.8 at 4 GPa and later decreases to suppress superconductivity above 7 GPa Katano et al. (2014). The calculated electron-phonon coupling parameter and critical temperature , on the other hand, were found to monotonously increase with pressure Wiendlocha et al. (2016), in agreement with the initial increase in but showing the non-phononic origin of the suppression of superconductivity at larger pressures.
II Computational details
Calculations were done for p = 5, 10, 15, and 20 GPa, and to be consistent with our earlier work for ambient pressure, all computational details were kept unchanged. Some of the results for p = 0 GPa are recalled here for a convenient comparison. The Quantum Espresso package Giannozzi et al. (2009, 2017) was used, with the Perdew-Burke-Ernzerhof (PBE) generalized gradient approximation for the exchange-correlation functional Perdew et al. (1996) and the Rappe-Rabe-Kaxiras-Joannopoulos (RRKJ) ultrasoft pseudopotentials ThC ; Dal Corso (2014). Electronic structure was calculated in the scalar-relativistic and fully relativistic way (i.e., including the spin-orbit coupling). Phonons and electron-phonon coupling functions were calculated in the scalar-relativistic way, as the inclusion of SOC had no important effect on the phonon structure nor on the electron-phonon interaction Kuderowicz et al. (2021).
| p (GPa) | a (Å) | b (Å) | c (Å) | u | v | y | z |
|---|---|---|---|---|---|---|---|
| 0 | 3.8214 | 4.5376 | 6.0708 | -0.0014 | 0.6041 | 0.1561 | 0.3007 |
| 5 | 3.7781 | 4.5120 | 6.0219 | -0.0011 | 0.6037 | 0.1569 | 0.3007 |
| 10 | 3.7392 | 4.4885 | 5.9786 | -0.0009 | 0.6034 | 0.1575 | 0.3007 |
| 15 | 3.7031 | 4.4670 | 5.9408 | -0.0006 | 0.6032 | 0.1581 | 0.3007 |
| 20 | 3.6705 | 4.4467 | 5.9063 | -0.0004 | 0.6030 | 0.1586 | 0.3007 |
Crystal unit cell parameters and atomic positions were theoretically optimized, starting from the p = 0 GPa experimental values Gerss and Jeitschko (1986). Electronic structure was then calculated using a Monkhorst-Pack grid of k-points, whereas the Fermi surface was calculated on a mesh. Wavefunction energy and charge density cutoffs were set to Ry and Ry, respectively. Dynamical matrices were calculated on a 4x4x4 q-point mesh and the interatomic force constants (IFC) and phonon dispersion relations were computed using the Fourier interpolation technique. Finally, the Eliashberg electron-phonon interaction functions were computed using the self-consistent first order variation of the crystal potential Baroni et al. (2001). The spectral functions were then used to determine the pressure dependence of the electron-phonon coupling (EPC) parameter . The thermodynamic properties of the superconducting phase were determined using the isotropic Eliashberg formalism to see how they evolve under pressure, but one has to be aware that the superconducting state in ThCoC2 at p = 0 GPa could not be accurately described within this formalism. The isotropic theory is used here to simulate the trend in , as well as to prepare the grounds for a discussion of future experimental results.
| p | C1 - | C2 - | C2 - | Co1 - | Co1 - | Th1 - | Th2 - |
|---|---|---|---|---|---|---|---|
| C2 | Th1 | Th2 | C2 | C3 | Co1 | Co1 | |
| 0 | 1.4165 | 2.7442 | 2.7412 | 1.9646 | 1.9734 | 3.0641 | 3.0345 |
| 5 | 1.4156 | 2.7184 | 2.7152 | 1.9504 | 1.9571 | 3.0384 | 3.0094 |
| 10 | 1.4142 | 2.6954 | 2.6920 | 1.9377 | 1.9428 | 3.0154 | 2.9868 |
| 15 | 1.4128 | 2.6746 | 2.6705 | 1.9260 | 1.9306 | 2.9949 | 2.9659 |
| 20 | 1.4108 | 2.6555 | 2.6513 | 1.9153 | 1.9194 | 2.9759 | 2.9469 |
| -0.0057 | -0.0887 | -0.0899 | -0.0493 | -0.0540 | -0.0882 | -0.0876 | |
| -0.0003 | -0.0044 | -0.0045 | -0.0025 | -0.0027 | -0.0044 | -0.0044 |
III Results and discussion
III.1 Crystal structure
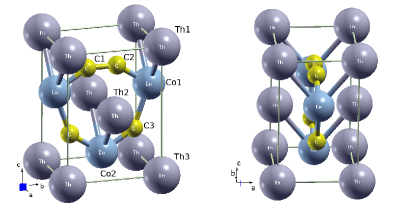
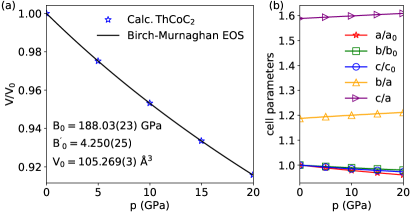
ThCoC2 crystallizes in the base-centered orthorhombic structure Amm2, spacegroup no. 38, shown in Fig. 1. In the structure we may distinguish the layers of Th separated by the layers of Co-C rings, stacked along axis. Evolution of the unit cell parameters is presented in Table 1 and Fig. 2. The strongest compression of the unit cell under pressure is seen in the direction, i.e. perpendicular to the aforementioned Th and Co-C layers, whereas the most resistant to pressure is direction, along the covalent Co-C and C-C bonds. As a consequence, and ratios increase with pressure. Atomic positions change only slightly, and to illustrate how the crystal structure evolved, the distances between neighboring atoms are shown in Table 2. The carbon-carbon bond is the stiffest as its bond length shortens an order of magnitude less than in the other pairs. Distances between cobalt and carbon decrease roughly two times less than for the carbon - thorium and thorium - cobalt pairs.
The change in the unit cell volume with pressure is shown in Fig. 2(a) where it is fitted using the Birch-Murnaghan equation of state Birch (1947). The computed bulk modulus is equal to GPa.
III.2 Electronic structure
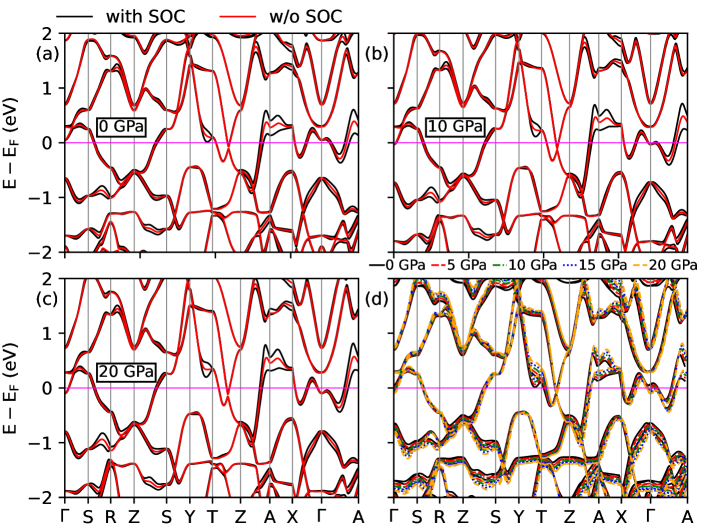
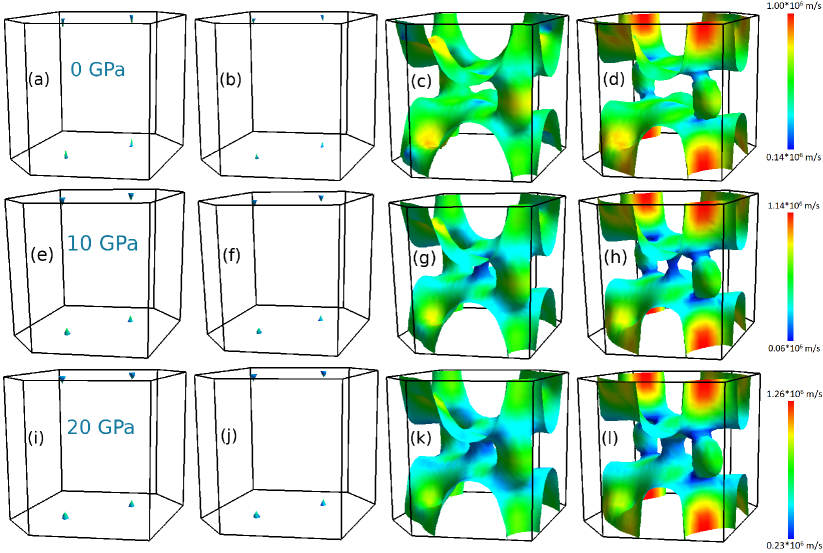
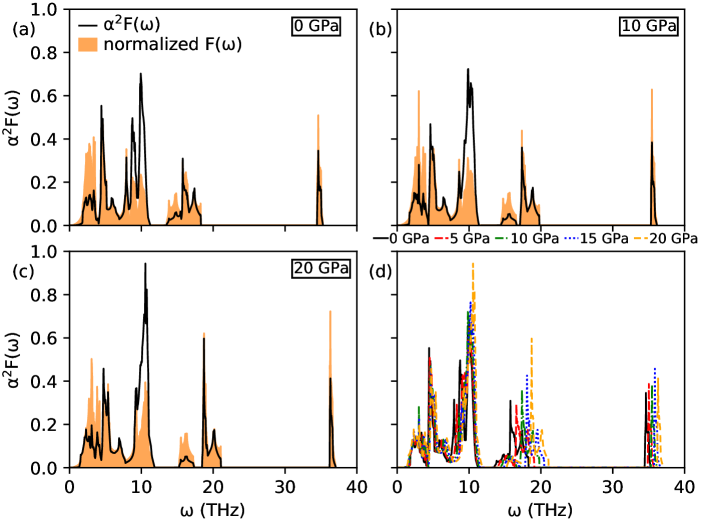
Evolution of the electronic dispersion relations in ThCoC2 with pressure is presented in Fig. 3. Panels (a-c) show dispersion relations for 0, 10 and 20 GPa, while panel (d) gathers all results in one graph to visualize their relative differences. In a similar way we will present changes in electronic densities of states, phonon dispersions, phonon densities of states and Eliashberg functions. As discussed in Kuderowicz et al. (2021), at ambient pressure in the scalar-relativistic case, two bands cross the Fermi level forming two sheets of the Fermi surface (FS), with one large, dominating FS sheet and the other consisting of two small electron pockets. When the spin-orbit coupling is taken into account, due to the lack of the inversion center, the band structure is split, forming four FS sheets, shown for p = 0, 10, and 20 GPa in Fig. 4. The largest change in relation due to pressure is observed near and T points. The electron band at , which is just above for p = 0 GPa, is pushed down and eventually crosses the Fermi level, contributing to FS by forming an additional tube along direction, seen in Fig. 4 for p = 10 GPa.
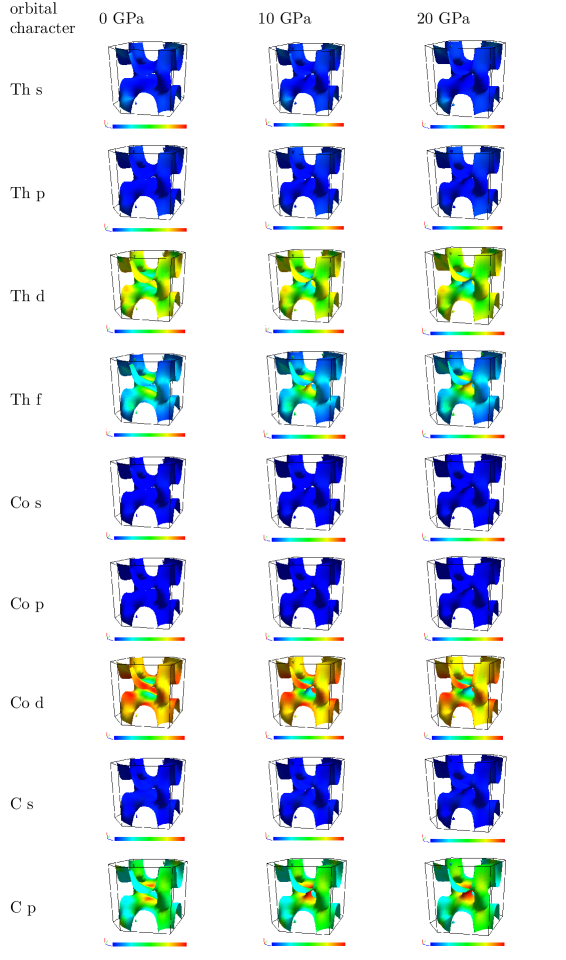
Orbital characters of the main Fermi surface sheet for pressures of 0, 10 and 20 GPa are shown in Supplemental Material sup . Contribution to Fermi surface is mostly from Th-6d, Co-3d and C-2p orbitals, with some contribution from Th-f states, in agreement with contributions to total DOS at discussed below (see Fig. 5). The anisotropy of orbital character of FS is moderate and is enhanced under pressure – the tube which is formed in the central part of FS above 10 GPa has mostly C-p and Th-f character, which were more uniformly distributed at ambient pressure. That may enhance the anisotropic properties of the superconducting phase under pressure in ThCoC2.
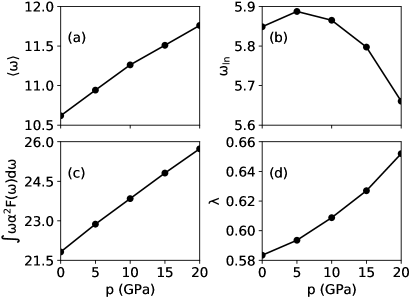
The average value of splitting due to SOC for the states located around the Fermi level as a function of pressure is shown in Fig. 6(b). The starts to increase above 5 GPa when the additional, -centered tube starts to contribute to FS. The growth is approximately linear with the a rate of 1.5 meV/GPa, reaching 185 meV at 20 GPa111The average splitting at p = 0 GPa reported here is 162 meV is slightly larger than the (rounded down) value of 150 meV reported in Ref.Kuderowicz et al. (2021) due to a denser -mesh used to calculate the average.. That suggests that the unconventional features of superconductivity in ThCoC2, likely driven by the strong antisymmetric spin-orbit coupling, should be even more pronounced under elevated pressure.
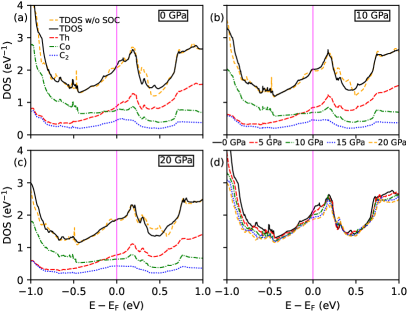
The electronic density of states (DOS) near the Fermi level is presented in Fig. 5 and the change of DOS() with pressure in Fig. 6(a) and Table 3. Under the pressure, the DOS curve around is flattened, due to pressure-enhanced hybridization we can observe lowering of maxima and rising of minima of DOS(). The DOS() gradually decreases with pressure with a ratio of eVGPa which compares to eVGPa in LaNiC2 Wiendlocha et al. (2016), thus, the effect is much stronger in ThCoC2. The largest contributions to the total DOS at the Fermi level are from the 6d Th, 3d Co, and 2p C states, with a noticeable contribution from 5f states of Th. The major contributors to DOS do not change with pressure, however the relative importance of Th-5f states is growing with increasing pressure, due to the above-mentioned increase in the Fermi surface area with the Th-5f orbital character.
| p | 0 | 5 | 10 | 15 | 20 | |
|---|---|---|---|---|---|---|
| (GPa) | ||||||
| w/o SOC | total | 2.07 | 2.02 | 2.00 | 1.91 | 1.85 |
| with SOC | total | 2.14 | 2.04 | 2.03 | 1.92 | 1.86 |
| Th-6d | 0.59 | 0.55 | 0.53 | 0.50 | 0.48 | |
| Th-5f | 0.25 | 0.26 | 0.27 | 0.26 | 0.25 | |
| Co-3d | 0.76 | 0.72 | 0.69 | 0.66 | 0.64 | |
| C2-2p | 0.44 | 0.44 | 0.45 | 0.43 | 0.42 |
III.3 Phonons and electron-phonon coupling
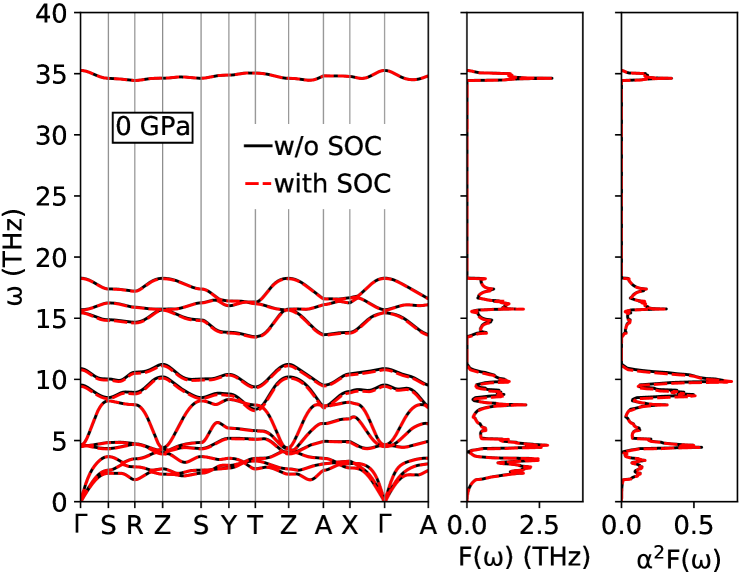
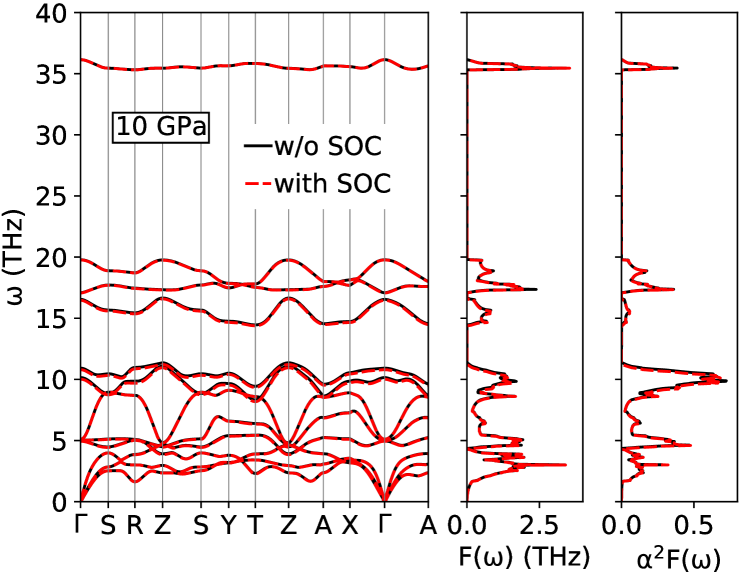
As we found for the zero pressure case Kuderowicz et al. (2021), spin-orbit coupling makes no significant changes for the phonon spectrum of ThCoC2, as well as for the electron-phonon interactions. The computed scalar-relativistic value of the EPC constant for p = 0, , is only slightly smaller than the relativistic . Because of this, we restricted our calculations of the pressure evolution of the dynamic properties and EPC in ThCoC2 to the scalar-relativistic case. To make sure that SOC may be also neglected for phonons under pressure, giving the correct evolution of , calculations including SOC were done for a single case of p = 10 GPa and also here no important differences were found (see Supplemental Material sup for further details). Similarly to the p = 0 case, at 10 GPa the scalar-relativistic is slightly smaller than the relativistic . The relative effect of pressure on the EPC parameter between 10 GPa and 0 GPa, , is 4.7% increase, when computed with SOC, and 4.5% increase, when SOC is neglected, thus the scalar-relativistic approximation is sufficient to drive conclusions for the evolution of with pressure.
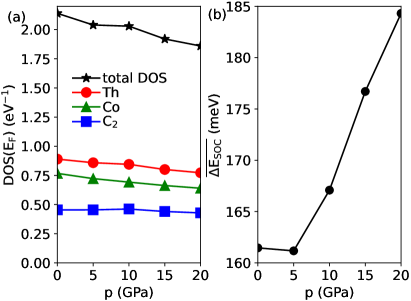
Figure 7 presents the phonon dispersion curves and the phonon density of states for selected pressures. The characteristic structure of the phonon spectrum, driven by the large difference in atomic masses between Th, Co, and C, is the separation into three regions, seen in the partial plots. The lowest-frequency part has the majority of Th vibrations, next Co phonon branches dominate and the high frequency part is contributed by carbon atoms. The highest single mode near THz (p = 0 GPa) is contributed by the C-C bond-stretching mode.
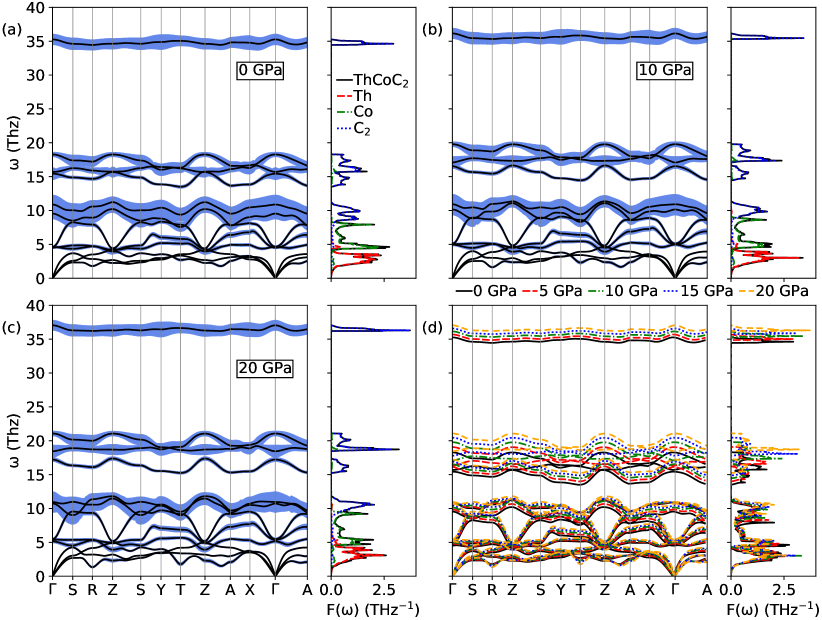
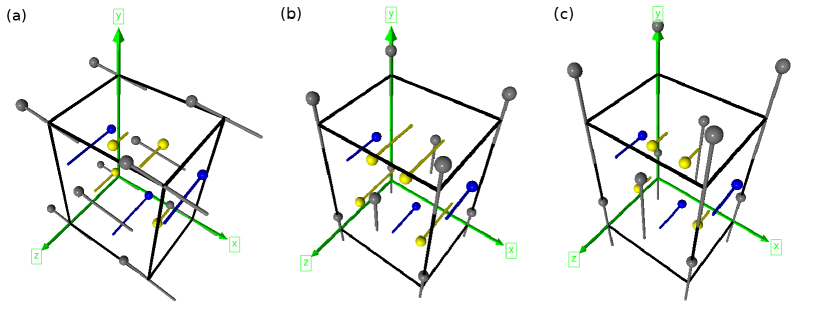
Under elevated pressure, most of the phonon branches move towards higher frequencies, which is especially visible for carbon modes. The average phonon frequency increases with an approximate rate of 0.057 THz/GPa, reaching 11.76 THz at 20 GPa, as shown in Fig. 8(a). On the other hand, near R, T, and Z points, the lowest acoustic mode is softened. Similar softening was found in LaNiC2 Wiendlocha et al. (2016). The real-space atomic displacements for these phonon modes are visualized in the Supplemental Material sup . In T point, where the effect is the strongest, Th vibrates along the axis, whereas Co and C move out of phase, along .
Before moving to the discussion of the electron-phonon coupling, it is worth to recall how the quantities important for the interaction strength depend on the phonon frequencies. The electron-phonon coupling matrix elements are defined as Wierzbowska et al. (2005); Heid et al. (2010); Giustino (2017)
| (1) |
where enumerates atoms in the unit cell, are band indexes, is the atomic mass, is a change of electronic potential calculated in self-consistent cycle due to the displacement of an atom , is the -th phonon polarization vector and is the electronic wave function. In eq.(1) phonon frequency appears under the square root in the denominator. The square of matrix elements are integrated over the Fermi surface and multiplied by frequency to contribute to the phonon linewidths : Wierzbowska et al. (2005); Grimvall (1981); Giustino (2017):
| (2) |
This multiplication cancels the direct frequency dependence, thus the linewidths do not directly depend on , rather than on the wavefunction matrix elements, which enter eq.(1).
The summation of the phonon linewidths divided by frequency gives the Eliashberg function :
| (3) |
which is then inversely proportional to . Finally, the EPC constant is calculated as the integral of the Eliashberg function, again divided by frequency Grimvall (1981),
| (4) |
which results in the proportionality of , thus for majority of the electron-phonon superconductors pressure-induced lattice stiffening (increase in ) dominates, reducing .
| p (GPa) | |||||||||||||
|---|---|---|---|---|---|---|---|---|---|---|---|---|---|
| 0 | 0.5835 | 0.0755 | 0.0396 | 0.0420 | 0.0856 | 0.0658 | 0.0398 | 0.0814 | 0.1020 | 0.0104 | 0.0166 | 0.0184 | 0.0064 |
| 20 | 0.6521 | 0.1391 | 0.0412 | 0.0457 | 0.0974 | 0.0607 | 0.0395 | 0.1017 | 0.0806 | 0.0079 | 0.0152 | 0.0167 | 0.0064 |
| 0.0686 | 0.0636 | 0.0016 | 0.0037 | 0.0118 | -0.0051 | -0.0003 | 0.0203 | -0.0214 | -0.0025 | -0.0014 | -0.0017 | 0.00 | |
| p (GPa) | |||||||||||||
| 0 | 10.6188 | 2.3185 | 2.6588 | 3.3310 | 4.6398 | 5.4076 | 7.2053 | 8.9207 | 10.1717 | 14.5968 | 16.0684 | 17.3748 | 34.7618 |
| 20 | 11.7611 | 2.4635 | 2.9604 | 3.8626 | 5.0101 | 6.1745 | 8.3831 | 10.1379 | 10.6632 | 16.1909 | 18.7990 | 20.1257 | 36.4349 |
To have a convenient single-number parameter which shows how the electronic contribution to the electron-phonon coupling changes with pressure, cutting off the direct dependence on the phonon frequency, one might calculate the sum of all phonon linewidths. The more straightforward way to do it is to calculate the integral of the Eliashberg function multiplied by frequency:
| (5) |
as it carries similar physical information. Substituting eq.(1-3) to the above formula, one can see that does not explicitly depend on phonon frequency Gutowska et al. (2021):
| (6) |
In Fig. 7 we see that some of the phonon linewidths are increasing with pressure, especially for the softened acoustic part of the spectrum between T, Z, and A points, which shows that the softening is associated with the enhanced electron-phonon coupling. On the other hand, for the optic Co and C modes, e.g., in the X- direction, are decreasing. Eliashberg functions for selected pressures are presented in Fig. 9 and an increase in the lower-frequency part can be seen. The overall effect on the electron-phonon coupling is the resultant of competing factors: the increase of the ”electronic” integral, plotted in Fig. 8(c), and increase in the average phonon frequency, shown in Fig. 8(a). The tendency towards stronger coupling takes over and the EPC constant is increasing with pressure with a rate of about /GPa, as shown in Fig. 8(d). This is 20% slower than found for LaNiC2, where it was equal to /GPa Wiendlocha et al. (2016).
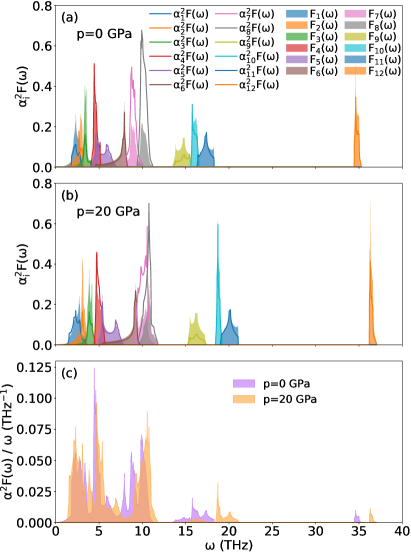
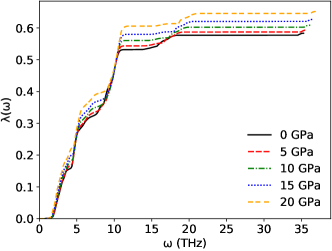
Analyzing the increase in in more details, Fig. 10 additionally compares the p = 0 and 20 GPa Eliashberg functions decoupled over all the phonon modes [panels (a,b)], as well as in panel (c). The substantial increase of the Eliashberg function for the first acoustic mode is well visible. For other modes generally the increase in phonon frequencies is accompanied by the increase in values due to the larger phonon linewidths. This gives a larger function, whose integral determines the value of via eq.(4). Electron-phonon coupling constants for each of the 12 phonon modes , computed based on the data presented in Fig. 10(a,b) are collected in Table 4. The pressure changes in the cumulative electron-phonon coupling constant are shown in Fig. 11. What we can conclude is that the increase in is mainly driven by the increase in which is contributed by the lowest acoustic phonon mode, the one which softens under pressure in some regions of the Brillouin zone. As a consequence, the average frequency of this mode (see in Table 4) increases only a little, allowing for the increase in . Changes in of the other modes generally compensate each other when summed over, thus the change in is a key factor for the enhancement. The increase in will tend to increase the critical temperature .
The second important parameter in terms of is the characteristic phonon frequency, which sets the energy window for the electron-phonon interaction, and to which is proportional to. That is the Debye frequency in the BCS theory and in the McMillan formula McMillan (1968). The pressure-induced increase in the average phonon frequency suggests that this parameter should increase as well. However, in the more accurate Allen-Dynes formula:
| (7) |
which is an analytic approximated solution of the isotropic Eliashberg gap equations Allen and Dynes (1975), the characteristic frequency is the ”logarithmic average”, defined on the basis of the Eliashberg function:
| (8) |
Increases in both the average phonon frequency and the EPC constant results in a non-monotonic evolution of , shown in Fig. 8(b). Logarithmic average increases at low pressures, reaches maximum at 5 GPa and then decreases.
III.4 Superconductivity
The results obtained in the preceding sections allow to simulate the pressure effects on superconductivity in ThCoC2 for the electron-phonon coupling scenario. As we have discussed in Ref. Kuderowicz et al. (2021), the experimental value of the critical temperature at zero pressure can be obtained from the calculated Eliashberg function and the standard Allen-Dynes eq.(7), if the Coulomb pseudopotential parameter is set to . The need of using this higher than typical (0.10 - 0.13) value is most likely related to the more complex nature of the superconducting phase than covered by the Allen-Dynes formula, derived based on the isotropic Eliashberg formalism. Similarly, by direct numerical solving the isotropic Eliashberg equations, we have reproduced Kuderowicz et al. (2021) the experimental value of for when computed with SOC was used.222The value of used for solving the Eliashberg gap equations, if is to be compared to the parameter used with the Allen-Dynes formula, has to be re-scaled due to the dependence of on the numerical cutoff frequency: . That gives , see Refs. Allen and Dynes (1975); Kuderowicz et al. (2021) for further details. This and the deviation of the calculated thermodynamic properties of the superconducting phase (temperature dependence of the electronic specific heat, magnetic field penetration depth, and critical field) pointed to the conclusion that the superconductivity in ThCoC2 goes beyond the isotropic Eliashberg picture, nevertheless with a high probability of the electron-phonon coupling mechanism Kuderowicz et al. (2021). As we are, however, able to reproduce the magnitude of at p = 0 accepting the enhanced values, we may simulate the pressure effect on by keeping the zero-pressure that reproduces the initial .
Starting with computed using the Allen-Dynes formula, increases almost linearly with pressure, as shown in Fig. 12 (blue squares). is used here, as it reproduces the experimental K at 0 GPa when SOC is neglected. In spite of the decline of the density of state , in general detrimental to superconductivity, we observe increase of the critical temperature with a pressure, caused by the enhancement of EPC. The increase in takes over the decrease in observed above 5 GPa, thus the critical temperature increases monotonically with an approximately constant ratio of 0.073 K/GPa, reaching 3.11 K at 10 GPa and 4.01 K at 20 GPa. That is quite a strong pressure effect, experimentally accessible for verification even under moderate pressures of several GPa. Following the trend in , the magnitude of the pressure-induced change in in ThCoC2 is lower comparing to that computed for LaNiC2 Wiendlocha et al. (2016), where the ratio was 0.129 K/GPa.
Further on, we simulate how the and other thermodynamic properties would change with pressure when computed using the Eliashberg isotropic gap equations. That will allow to conclude on the deviations of superconductivity in ThCoC2 under pressure from the isotropic state once the experimental works are reported. A full description of the applied theoretical model with mathematical formulas can be found in Ref. Kuderowicz et al. (2021). Here we keep the same numerical parameters used in solving the Eliashberg equations, i.e., the cut-off frequency Carbotte (1990) and the number of Matsubara frequencies . As mentioned, the Coulomb pseudopotential has been chosen in a way to reproduce the critical temperature K for p = 0. In the model without the spin-orbit coupling, this is , which corresponds to re-scaled Allen-Dynes formula value Allen and Dynes (1975); Kuderowicz et al. (2021) , still above the commonly used approximations of Morel and Anderson (1962). The changes of the critical temperature under pressure are presented in Fig. 12 (red dots), and are slightly smaller, comparing to predictions from the Allen-Dynes formula (rate of 0.64 K/GPa), nevertheless the substantial increase in is predicted as well.
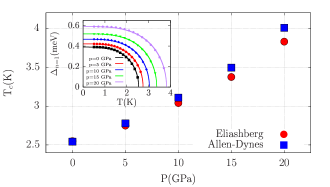
The temperature dependence of for different pressures are presented in the inset of Fig. 12 and undergo the following formula
| (9) |
with which only slightly depends on p, , remaining close to that predicted from the BCS theory, . When increasing the pressure, the dimensionless ratio changes in the range , being close to the BCS value of .
The self-consistent solution of the Eliashberg equations can then be used to calculate the electronic specific heat in the superconducting state Kuderowicz et al. (2021). Above , the specific heat of the normal state is given by . The temperature dependences of the specific heat for different pressure values are presented in Fig. 13.
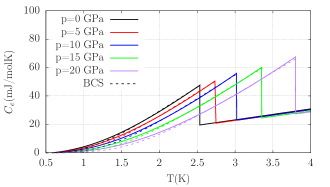
For comparison, by dashed lines, we have also marked the BCS curves, which predict the exponential behavior of the specific heat at low temperatures. In this regime, as shown in Fig. 13, the Eliashberg solutions slightly deviate from the BCS curves and do not exhibit the dependence. At high temperatures, is close to BCS relation, reaching the jump of reduced specific heat at , from for p = 0 to for GPa, almost equal to the weak-coupling BCS limit of .
Although electronic specific heat exhibits a temperature dependence close to ordinary BCS theory, the London penetration depth behaves differently. In Fig. 14 we present calculated from the Eliashberg formalism Kuderowicz et al. (2021); Carbotte (1990). Regardless of pressure, significantly deviates from the BCS prediction, which is an effect of the retardation processes included in the Eliashberg theory.
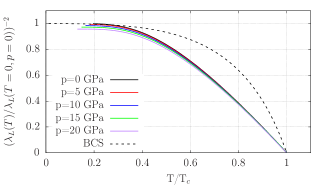
With increasing pressure, the London penetration depth decreases slightly in the low temperature regime.
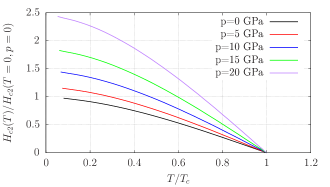
Finally, we have also analyzed how the upper critical field, , changes within the pressure, if evaluated within the Eliashberg model Kuderowicz et al. (2021); Carbotte (1990). Our calculations for zero pressure Kuderowicz et al. (2021) showed that ThCoC2 was close to the clean limit, thus in present calculations we use the clean limit, assuming zero scattering rate.
The obtained temperature dependence of the upper critical field normalized to at and p = 0 is shown in Fig. 15. In opposite to the penetration depth which does not change significantly with the pressure, the upper critical field increases more than twice when the pressure changes from to GPa. Similarly as in the case of the critical temperature, it results from the increase of the EPC induced by pressure.
IV Summary
We have analyzed the pressure evolution of the electronic structure, phonons and the electron-phonon coupling in ThCoC2 in the range p = 0 - 20 GPa. Calculations showed that the density of states at the Fermi level slowly decreases with p. The band splitting induced by the spin-orbit coupling increases with p, reaching the value of 185 meV at 20 GPa. This suggests that under elevated pressure the non-BCS features in the thermodynamic properties of the superconducting phase in ThCoC2 may be even more pronounced than at ambient pressure. The electron-phonon coupling is enhanced under pressure due to the increase in the phonon linewidths. The overall EPC parameter increases from 0.583 at 0 GPa to 0.652 at 20 GPa, which is strongly related to the softening of the lowest acoustic phonon mode. If the superconducting pairing in ThCoC2 is based on the electron-phonon coupling, this should raise the superconducting critical temperature and the upper magnetic critical field. When the isotropic Eliashberg formalism is used to calculate , enhancement of the electron-phonon coupling strength results in a significant increase of , with a rate of 0.064 - 0.073 K/GPa.
Acknowledgements
This work was supported by the National Science Centre (Poland), project no. 2017/26/E/ST3/00119 and in part by the PL-Grid infrastructure.
References
- Grant et al. (2014) T Grant, A J S Machado, D J Kim, and Z Fisk, “Superconductivity in non-centrosymmetric ThCoC2,” Superconductor Science and Technology 27, 035004 (2014).
- Bardeen et al. (1957) J. Bardeen, L. N. Cooper, and J. R. Schrieffer, “Theory of Superconductivity,” Phys. Rev. 108, 1175–1204 (1957).
- Bhattacharyya et al. (2019) A. Bhattacharyya, D. T. Adroja, K. Panda, Surabhi Saha, Tanmoy Das, A. J. S. Machado, O. V. Cigarroa, T. W. Grant, Z. Fisk, A. D. Hillier, and P. Manfrinetti, “Evidence of a Nodal Line in the Superconducting Gap Symmetry of Noncentrosymmetric ,” Phys. Rev. Lett. 122, 147001 (2019).
- Grant et al. (2017) T. W. Grant, O. V. Cigarroa, P. F. S. Rosa, A. J. S. Machado, and Z. Fisk, “Tuning of superconductivity by Ni substitution into noncentrosymmetric ,” Phys. Rev. B 96, 014507 (2017).
- Kuderowicz et al. (2021) Gabriel Kuderowicz, Paweł Wójcik, and Bartlomiej Wiendlocha, “Electronic structure, electron-phonon coupling, and superconductivity in noncentrosymmetric from ab initio calculations,” Phys. Rev. B 104, 094502 (2021).
- Kuderowicz and Wiendlocha (2022) Gabriel Kuderowicz and Bartlomiej Wiendlocha, “The effect of Ni doping on the electronic structure and superconductivity in the noncentrosymmetric ThCoC2,” Journal of Magnetism and Magnetic Materials 546, 168688 (2022).
- Giannozzi et al. (2009) Paolo Giannozzi, Stefano Baroni, Nicola Bonini, Matteo Calandra, Roberto Car, Carlo Cavazzoni, Davide Ceresoli, Guido L Chiarotti, Matteo Cococcioni, Ismaila Dabo, Andrea Dal Corso, Stefano de Gironcoli, Stefano Fabris, Guido Fratesi, Ralph Gebauer, Uwe Gerstmann, Christos Gougoussis, Anton Kokalj, Michele Lazzeri, Layla Martin-Samos, Nicola Marzari, Francesco Mauri, Riccardo Mazzarello, Stefano Paolini, Alfredo Pasquarello, Lorenzo Paulatto, Carlo Sbraccia, Sandro Scandolo, Gabriele Sclauzero, Ari P Seitsonen, Alexander Smogunov, Paolo Umari, and Renata M Wentzcovitch, “QUANTUM ESPRESSO: a modular and open-source software project for quantum simulations of materials,” Journal of Physics: Condensed Matter 21, 395502 (2009).
- Giannozzi et al. (2017) P Giannozzi, O Andreussi, T Brumme, O Bunau, M Buongiorno Nardelli, M Calandra, R Car, C Cavazzoni, D Ceresoli, M Cococcioni, N Colonna, I Carnimeo, A Dal Corso, S de Gironcoli, P Delugas, R A DiStasio Jr, A Ferretti, A Floris, G Fratesi, G Fugallo, R Gebauer, U Gerstmann, F Giustino, T Gorni, J Jia, M Kawamura, H-Y Ko, A Kokalj, E Kucukbenli, M Lazzeri, M Marsili, N Marzari, F Mauri, N L Nguyen, H-V Nguyen, A Otero de-la Roza, L Paulatto, S Ponce, D Rocca, R Sabatini, B Santra, M Schlipf, A P Seitsonen, A Smogunov, I Timrov, T Thonhauser, P Umari, N Vast, X Wu, and S Baroni, “Advanced capabilities for materials modelling with QUANTUM ESPRESSO,” Journal of Physics: Condensed Matter 29, 465901 (2017).
- Baroni et al. (2001) Stefano Baroni, Stefano de Gironcoli, Andrea Dal Corso, and Paolo Giannozzi, “Phonons and related crystal properties from density-functional perturbation theory,” Rev. Mod. Phys. 73, 515–562 (2001).
- Smidman et al. (2017) M Smidman, M B Salamon, H Q Yuan, and D F Agterberg, “Superconductivity and spin-orbit coupling in non-centrosymmetric materials: a review,” Reports on Progress in Physics 80, 036501 (2017).
- Samokhin et al. (2004) K. V. Samokhin, E. S. Zijlstra, and S. K. Bose, “ An unconventional superconductor without inversion center,” Phys. Rev. B 69, 094514 (2004).
- Eliashberg (1960) G. M. Eliashberg, “Interactions between electrons and lattice vibrations in a superconductor,” Soviet Physics-JETP 11, 696 (1960).
- Katano et al. (2014) Susumu Katano, Hideya Nakagawa, Kazuyuki Matsubayashi, Yoshiya Uwatoko, Hideto Soeda, Takahiro Tomita, and Hiroki Takahashi, “Anomalous pressure dependence of the superconductivity in noncentrosymmetric : Evidence of strong electronic correlations,” Phys. Rev. B 90, 220508(R) (2014).
- Wiendlocha et al. (2016) B. Wiendlocha, R. Szczȩśniak, A. P. Durajski, and M. Muras, “Pressure effects on the unconventional superconductivity of noncentrosymmetric ,” Phys. Rev. B 94, 134517 (2016).
- Perdew et al. (1996) John P. Perdew, Kieron Burke, and Matthias Ernzerhof, “Generalized Gradient Approximation Made Simple,” Phys. Rev. Lett. 77, 3865–3868 (1996).
- (16) Pseudopotential were accessed from https://www.quantum-espresso.org/pseudopotentials. The following files were used: Th.pbe-spfn-rrkjus_psl.1.0.0.UPF, Th.rel-pbe-spfn-rrkjus_psl.1.0.0.UPF, Co.pbe-spn-rrkjus_psl.0.3.1.UPF, Co.rel-pbe-spn-rrkjus_psl.0.3.1.UPF and C.pbe-n-rrkjus_psl.1.0.0.UPF.
- Dal Corso (2014) Andrea Dal Corso, “Pseudopotentials periodic table: From H to Pu,” Computational Materials Science 95, 337 – 350 (2014).
- Kokalj (2003) Anton Kokalj, “Computer graphics and graphical user interfaces as tools in simulations of matter at the atomic scale,” Computational Materials Science 28, 155 – 168 (2003).
- Gerss and Jeitschko (1986) M.H. Gerss and W. Jeitschko, “The crystal structures of ternary actinoid iron (cobalt, nickel) carbides with composition 1:1:2,” Materials Research Bulletin 21, 209 – 216 (1986).
- Birch (1947) Francis Birch, “Finite elastic strain of cubic crystals,” Phys. Rev. 71, 809–824 (1947).
- Kawamura (2019) Mitsuaki Kawamura, “Fermisurfer: Fermi-surface viewer providing multiple representation schemes,” Computer Physics Communications 239, 197 – 203 (2019).
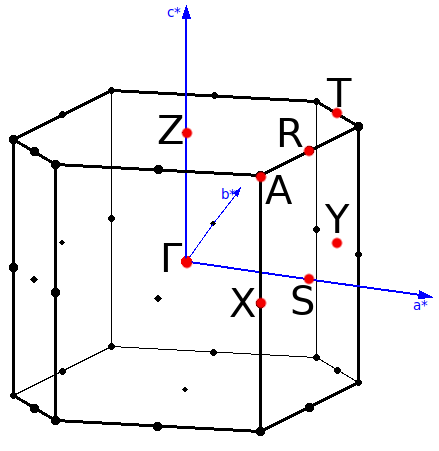
- (22) See Supplemental Materials for Fig. S1 with the Brillouin zone, Figs. S2-S3 where the full-relativistic and scalar-relativistic phonons are compared, Fig. S4 with the real-space atomic displacements for the first acoustic phonon mode at R, T and Z q-points, and Fig. S5 with the orbital character of Fermi surface.
- Wierzbowska et al. (2005) Malgorzata Wierzbowska, Stefano de Gironcoli, and Paolo Giannozzi, “Origins of low-and high-pressure discontinuities of Tc in niobium,” arXiv preprint cond-mat/0504077 (2005).
- Heid et al. (2010) R. Heid, K.-P. Bohnen, I. Yu. Sklyadneva, and E. V. Chulkov, “Effect of spin-orbit coupling on the electron-phonon interaction of the superconductors Pb and Tl,” Phys. Rev. B 81, 174527 (2010).
- Giustino (2017) Feliciano Giustino, “Electron-phonon interactions from first principles,” Rev. Mod. Phys. 89, 015003 (2017).
- Grimvall (1981) G. Grimvall, The electron-phonon interaction in metals (North-Holland, Amsterdam, 1981).
- Gutowska et al. (2021) Sylwia Gutowska, Karolina Górnicka, Paweł Wójcik, Tomasz Klimczuk, and Bartlomiej Wiendlocha, “Strong-coupling superconductivity of and : Phonon engineering of metallic Ir and Rh,” Phys. Rev. B 104, 054505 (2021).
- McMillan (1968) W. L. McMillan, “Transition Temperature of Strong-Coupled Superconductors,” Phys. Rev. 167, 331–344 (1968).
- Allen and Dynes (1975) P. B. Allen and R. C. Dynes, “Transition temperature of strong-coupled superconductors reanalyzed,” Phys. Rev. B 12, 905–922 (1975).
- Carbotte (1990) J. P. Carbotte, “Properties of boson-exchange superconductors,” Rev. Mod. Phys. 62, 1027–1157 (1990).
- Morel and Anderson (1962) P Morel and P W Anderson, “Calculation of the superconducting state parameters with retarded electronphonon interaction,” Phys. Rev. 125, 1263 (1962).
V Supplemental Material
Supplemental Material contains:
Fig. 16 of the Brillouin zone with the high symmetry points.
Fig. 17 which compares phonon dispersion relations, phonon density of states and Eliashberg function of ThCoC2 computed for p = 0 GPa with and without spin-orbit coupling (SOC).
Fig. 18 which compares phonon dispersion relations, phonon density of states and Eliashberg function of ThCoC2 computed for p = 10 GPa with and without spin-orbit coupling (SOC).
Fig. 19 with the displacement patterns of atoms vibrating in the first acoustic phonon mode at R, T anz Z points at p = 0 GPa. Amplitude of vibrations is exaggerated. Atomic displacements remain similar for larger pressures.
Fig. 20
Figures 17 and 18 show that the spin-orbit coupling have a minor effect on the phonon dispersion relations and Eliashberg functions of ThCoC2 also under elevated pressure.
Orbital characters of the main Fermi surface sheet for pressures of 0, 10 and 20 GPa are shown in Fig. 20. Contribution to Fermi surface is mostly from Th-6d, Co-3d and C-2p orbitals, with some contribution from Th-f states, in agreement with contributions to total DOS at discussed in the main text. The anisotropy of orbital character of FS is moderate and is enhanced under pressure – the tube which is formed in the central part of FS above 10 GPa has mostly C-p and Th-f character, which were more uniformly distributed at ambient pressure. Also the relative contribution to FS from 5f states of Th is growing under pressure. That may enhance anisotropy of the superconducting properties of ThCoC2.