1 Auton Lab, School of Computer Science, Carnegie Mellon University, Pittsburgh, PA; 2 Wallace H. Coulter Department of Biomedical Engineering; Georgia Institute of Technology, Atlanta, GA; 3 School of Medicine, University of Pittsburgh, Pittsburgh, PA
Weakly Supervised Classification of Vital Sign Alerts as Real or Artifact
Abstract
A significant proportion of clinical physiologic monitoring alarms are false. This often leads to alarm fatigue in clinical personnel, inevitably compromising patient safety. To combat this issue, researchers have attempted to build Machine Learning (ML) models capable of accurately adjudicating Vital Sign (VS) alerts raised at the bedside of hemodynamically monitored patients as real or artifact. Previous studies have utilized supervised ML techniques that require substantial amounts of hand-labeled data. However, manually harvesting such data can be costly, time-consuming, and mundane, and is a key factor limiting the widespread adoption of ML in healthcare (HC). Instead, we explore the use of multiple, individually imperfect heuristics to automatically assign probabilistic labels to unlabeled training data using weak supervision. Our weakly supervised models perform competitively with traditional supervised techniques and require less involvement from domain experts, demonstrating their use as efficient and practical alternatives to supervised learning in HC applications of ML.
Introduction
Intensive care patients who are at risk of cardiorespiratory instability (CRI) undergo continuous monitoring of vital sign (VS) parameters such as electrocardiography, plethysmography, pulse oximetry, and impedance pneumography. Recent advances in commercial bedside monitoring devices have made the sustained tracking of the physical state and health of a connected patient a real possibility. Without these devices, it would be practically impossible for medical practitioners to continually and attentively observe fast-evolving and heterogeneous VS parameters. However, even modern commercial devices have surprisingly inadequate support for identifying abnormal physiological variables in the form of simple exceedances of pre-determined normality thresholds [1]. Moreover, it is not uncommon for patients to have atypical VS parameters due to occasional movement, electrical interference, or loose sensors [2].

Indeed, numerous studies have shown a large percentage of these VS alerts to be false, or more formally, artifact [3] - either of mechanical, electrical, or physiological nature [2, 4]. Additionally, medical practitioners may be exposed to up to 1,000 alarms per Intensive Care Unit (ICU) shift [5]. The sheer amount of alarms in tandem with the high rate of artifacts can quickly lead to alarm desensitization and burnout in healthcare professionals. Multiple studies have concluded that the resulting alarm fatigue can have severe negative consequences for patient safety, with several incidents resulting in preventable harm or even death of a subject [3, 5, 6]. Furthermore, studies have shown that medical practitioners unintentionally respond to noisy work environments created by the loud and frequent blaring of artifactual clinical alarms, by becoming less engaging and empathetic towards patients [7, 8, 9].
In addition to the added stress placed on medical practitioners, frequent alerts can also lead to increased physiological stress in the patient, metabolic impairment, sleep disturbance and even death [6]. Moreover, these frequent artifacts preclude the continuous monitoring of VS in postoperative ward patients, leading to the early warning signs of impending cardiorespiratory arrest to go unnoticed and untreated until it is too late [10]. Not counting these many lives lost, the U.S. Food and Drug Administration (FDA) has reported over alarm-fatigue related patient deaths in the short span of five years [5].
Previous attempts to combat alarm fatigue have relied on advancements in adaptive filtering or explored the use of various Machine Learning (ML) paradigms, particularly supervised and active learning [2, 11]. However, these methodologies require varying quantities of manually and pointilistically labelled data. Labeling alerts as real or artifact is not only time-intensive, but also a laborious, expensive, and mundane task that pulls experienced clinicians away from their patients. Furthermore, traditional ML paradigms do not easily adapt to evolving clinical expertise and changing problem definitions due to their reliance on pointillisticaly annotated data which must be re-labeled to accommodate each such problem redefinition. For example, sepsis is one of the most sought-after clinical conditions to predict. However, with the constantly evolving definition of sepsis, the labeling process is frequently affected, causing many annotations to become inconsistent with current guidelines [12].
As an alternative, Weak Supervision (WS) involves harvesting general heuristics that clinicians would normally use to label the data by hand, and collectively using them to probabilistically reconstruct the labels for even vast amounts of unlabeled reference data. The hope is that downstream models trained with such automatically annotated data would perform as well as the models trained on data labeled in a point-by-point fashion, while greatly reducing the human effort and time needed to develop such models. This allows clinicians to focus where it matters, while enabling the development of accurate and efficient ML models, paving the way for materializing a significant social impact in healthcare. Recent work suggests that the proposed WS methodology can indeed accomplish such goals in some HC applications [13, 14]. In this paper, we demonstrate the potential utility of WS to adjudicate bedside alerts as real vs. artifact using high-density waveform VS data collected in intensive care settings.
Related Work
Alarm Fatigue
Alarm fatigue caused by high rates of artifact VS alerts is a widely-studied problem and a variety of techniques have been adopted to combat it in previous research. Most approaches fall into two main categories: () artifact reduction, and () artifact detection. The former approach attempts to reduce the number of artifact alerts produced through internal improvements within the vital sign monitors and other biosignal-measuring devices. Advancements in adaptive filtering and other techniques to reduce artifacts in real time within the monitor itself have been developed [15, 16, 17, 18, 19, 20]. But, due to the wide ranges of signal frequency and the diverse nature and causes of artifact alerts [21, 22], the problem of alarm fatigue still persists [2]. This work aims to tackle alarm fatigue and the high rates of artifact alarms through the latter approach, which focuses on post-measurement artifact detection and alert adjudication.
Clinical Settings
A large body of research has been produced on post-measurement artifact detection in the past, but most approaches either look at ambulatory settings or are in the context of wearable devices and smartphones – settings which are fundamentally different from the acute care clinical setting due to differences in physiological states of subjects, data quality, rates of motion and noise artifact, amount and type of available data, a priori likelihood of artifacts, and primary differences in the types of artifact that need to be detected [23, 24, 25].
Machine Learning Paradigms
Prior research on artifact detection strictly in the clinical setting has been conducted, but most papers combat alarm fatigue through the use of traditional ML pipelines such as fully-supervised (FS), active and federated learning [2, 11, 26]. These efforts yielded great strides in VS alert classification capabilities, but require substantial amounts of expert-annotated reference data to train efficient and accurate classifiers. A distinct lack of analysis remains on classifiers trained in data- and label-scarce environments using models expressly suited for this application. To the best of our knowledge, our work is the first to apply weak supervision to the problem of VS alert classification.
Methodology
Problem Formulation
Broadly, given an alert, our goal is to classify it as a real or artifact. We specify each alert as a -tuple , where pid is a unique alert ID, is the alert type, and are the starting time and duration of the alert. We assume that each alert is associated with an unobserved true class label , where denotes real and denotes an artifact; and that for the duration of the alert, we have access to time series data which includes both waveforms such as electrocardiogram (ECG) leads II and III and numerics, such as heart rate (HR), potentially sampled at different frequencies. We aim to use clinical intuition and expert knowledge encoded in several heuristics to obtain labels to train an downstream classification model . We define each heuristic, alternatively called a labeling function (LF), denoted by directly on timeseries data. A LF either abstains {} or votes for a particular class {} given an alert and its associated waveform data . While we do not expect any individual LF to have perfect accuracy or recall, we do expect them to have better than random accuracy whenever they do not abstain from voting. Starting with alerts and labeling functions , our goal is to learn a label model which assigns a probabilistic label to each alert in .
The label model learns from the overlaps, conflicts and (optionally) dependencies between the LFs using a factor graph as shown in Fig. 1. In this work, we assume the LFs to be independent given the true class label. While this assumption may not always stand, most prior work [14, 13, 27] has shown that this simple label model may work well in practice. Let denote the vector of unobserved ground truth labels, and let be the vote of the LF on the data point. We then define LF accuracy and propensity as , and , respectively. Following Ratner et al.[28], we define the model of the joint distribution of and as:
where is a normalizing constant and are the canonical parameters for the LF accuracy and propensity. We use Snorkel [29] to learn by minimizing the negative log marginal likelihood given the observed . Finally, given a set of training alerts we want to train an end model classifier such that .
Vital Sign Data
In this work we use a large single-center database comprising of vital sign data of patients admitted to critical care units of a large tertiary care research and teaching hospital. The data was curated and de-identified at the institution, whose Institutional Review Board deemed this research did not qualify as human subjects research. Cardiorespiratory vital sign alert data consisting of a variety of waveforms and numerics were collected with the Philips IntelliVue MX800 Monitor from a mix of ICU and Step Down Unit (SDU) patients. The data comprised of approximately monitoring hours with around hours of data from each patient. Numerics, including respiratory rate (RR), HR, oxygen saturation (SpO2), and telemetric oxygen saturation (SpO2T) were sampled at 1 Hz. Waveform data, including ECG lead II and lead III, plethysmographs (pleth), telemetric plethysmographs (plethT), arterial pressure waveforms (ART) derived from an indwelling arterial catheter, and respiratory waveforms (resp) from impedance pneumography, were all sampled at various frequencies. ECG lead II and lead III were sampled at both 250 Hz and 500 Hz. Pleth, plethT, and ART were all sampled at 125 Hz, and the resp waveform was sampled at 62.5 Hz.
Vital Sign Alert Events
We determined both RR and SpO2/SpO2T vital sign alerts by analyzing the RR numeric and SpO2/SpO2T numeric, respectively, on factors: () duration - at least minutes of the respective numeric data was present, () persistence - at least of the numeric values exceeded respective thresholds (< breaths per minute or > breaths per minute for RR and < 90% for SpO2/SpO2T), () tolerance of 5 minutes suggesting that consecutive alerts < 5 minutes apart were combined, and () density expectation of of numeric values present at a Hz sampling frequency. These factors ensured that the VS alerts we analyzed contained continuous spaced anomalies with minimal interruption and were sufficiently long to have clinical relevance. Inspired by prior work by Chen et al.[2] and Hravnak et al.[11], we only used the first minutes of each alert event for both RR and SpO2/SpO2T alert classification. Additionally, we broke each minute alert window into three minute windows, primarily as a way to artificially boost the sample size. The ground truth label for each of the alert windows was assumed to be the same as that of the parent event. In the rest of this paper, RR or SpO2/SpO2T alerts refer to these minute alert event windows. We analyzed RR alerts ( events), comprising of real alerts and artifacts, and SpO2/SpO2T alerts ( events), comprising of real alerts and artifacts. Of these SpO2/SpO2T alerts, were telemetric alerts ( real, artifact), and are non-telemetric ( real, artifact).
Expert Knowledge Informing Alert Classification
Manually classifying artifact VS alerts is an arduous, repetitive, yet sufficiently objective process, largely governed by a set of guiding principles or “business rules” based on visual distinction and clinical intuition [11]. In this work, we utilized business rules which were developed during an iterative, multi-professional process of manual review and annotation of a subset of VS alerts by a committee of expert clinicians with decades of emergency-care experience. This review was followed by group discussions that involved adjudication and recognition of visual commonalities which were later translated into natural language rules upon consensus.
Most business rules are based on the apparent disagreement between numerics recorded by the monitor, and corresponding numerics derived from recorded waveform data. For instance, most business rules to distinguish between real and artifact RR alerts are based on discrepancy of observed RR and the RR numeric derived from the resp, pleth, plethT, and ART waveforms. In this study, however, we were unable to derive RR from the plethT and ART waveforms after finding a large portion of the data for these waveforms to be missing or incomplete. Similarly, SpO2/SpO2T alerts are more likely to be artifacts when the observed HR does not match HR derived from the pleth/plethT waveforms. Our label model leveraged the overlaps and conflicts between labeling functions built on different core methodologies to probabilistically label training data. Some business rules compared the HR derived from ECG lead III to that computed from the pleth waveform, and another examined whether patients are experiencing tachypnea (rapid breathing, with RR > 20) during an oxygen saturation alert. To improve reliability, some business rules also checked whether resp and pleth waveforms were too low or displayed a lack of pulsatility.
From Expert Knowledge to Labeling Functions

Since most business rules relied on RR and HR numerics derived from the recorded waveforms, we developed multiple core methodologies with wide ranging accuracy, to compute these numerics. For most business rules relying on derivations of RR and HR, it was important to be able to compute the primary/secondary harmonics and locate peaks in different waveforms. For instance, the RR closely corresponds to the median number of peaks and the primary harmonic of a clean resp waveform. We compute the former using a modified version of the Python SciPy package’s peak detection algorithm [30] and extrema extraction algorithm proposed in Khodadad et al.[31] as implemented in Neurokit2 [32]. We computed the primary harmonic of the resp waveform by locating the highest peak of a periodogram modified by the Bohman windowing function. Prior to using the resp waveform, we processed it by linear detrending followed by a fifth order 2Hz low-pass IIR Butterworth filter [31]. To derive RR from the pleth and ART waveforms, we first processed them via a different, novel, multi-step methodology, which involved interpolating the tips of the peaks found using SciPy’s peak detection algorithm via spline interpolation. This was done to derive a new waveform designed to emulate the periodicity of the resp waveform, from which RR can be extracted via the same core methodologies. For SpO2/SpO2T alerts, we derived the HR numeric from ECG lead II and III using the same core methodologies, after employing an ECG cleaning technique proposed in Neurokit2 [32].
Finally, we translated our business rules into labeling functions, building on the aforementioned core methodologies. As an example, Figure 2 illustrates one such LF, comparing the observed median RR (waveform.medRR) with the RR derived from resp using the methods proposed in Khodadad et al.[31] and implemented in Neurokit2 (waveform.respNK1). We implemented a total of and noisy heuristics for the binary classification of RR alerts and SpO2/SpO2T alerts, respectively.
From Labeling Functions to Alert Classifier
We trained the label model defined in the previous section using LFs for respective VS alerts, to obtain probabilistic labels for our training data. We used the label model implementation in Snorkel [29] for the same. Samples not covered by any LF were filtered out, and the remaining probabilistic labels produced by the label model were translated into crisp binary training labels, which were then used to train a Random Forest (RF) model [33] to classify VS alerts as real versus artifact. RFs have been widely used in literature to learn complex decision boundaries for various classification problems [34, 35] and have also been shown to be effective for learning discriminative models of real versus artifact VS alert classification [2]. We trained RF models with decision trees having a maximum depth of implemented using scikit-learn [36].
Experimental setup
Featurization
In order to train the RF models, we utilized the features computed for use by our LFs such as the RR derived from a modified periodogram of the resp waveform (respFFT), wave amplitude of the pleth and plethT waveforms (pulsatility and pulsatilityT, respectively), etc., but we also extracted features from the raw waveforms and numerics themselves by computing a set of aggregate statistics (mean, standard deviation, kurtosis, skewness, median, 1st and 3rd quartile). For the RR alerts, we subsequently dropped the features calculated from the ART, plethT, and ECG lead III waveforms, and the SpO2T numerics, due to more than of the alerts missing this data. For SpO2/SpO2T alerts, we dropped features calculated from the ART waveform, for the same reason. Next, we replaced any missing values remaining in the data after incomplete features were removed with either a or depending on the nominal ranges of the feature values.
Baselines and Evaluation
We compared our weakly supervised RF model (Weak Sup.) with its fully supervised counterpart trained using ground truth labels (Fully Sup.), probabilistic labels produced by the label model (Prob. Labels), and RF models trained using majority vote (Majority Vote) instead of the data programming label model. The majority vote model predicts what the majority of LFs voted for. All models were trained in a leave-one-patient-out (LOPO) cross-validation setting, where the models were trained on data from all but one patient, and tested on the held-out patient’s data. This setting ensures that the models do not inadvertently fit to patient specific characteristics to prevent artificially inflating their performance.
We compared all the models using a few different performance metrics including accuracy and AUC***The code for our experiments will be made publicly available at www.github.com/--anonymous-- upon acceptance. We also computed metrics of practical utility such as the false positive rate at true positive rate (FPR 50% TPR), true positive rate at FPR (TPR 1% FPR), etc. All models and LFs were implemented using Python programming language (version ), and experiments were carried out on a computing cluster with CPUs equipped with AMD Opteron processors having a total of GB RAM.
Additional Research Questions
In addition to examining the efficacy of WS models for VS alert classification, we aimed to answer the following research questions.
(1) What patterns are our RF models learning? Interpretability is important when ML models are deployed in clinical settings, especially when using complex models such RFs. We used Gini importance (GI) [33] and permutation feature importance (PFI) [37] to determine features which our weakly supervised model relied on the most while making label predictions (Figure 3). Since GI can be inflated for high-cardinality features, PFI was also analyzed to reliably understand feature importance, in line with prior work conducted in different settings [35]. GI and PFI were evaluated by accessing the feature importance for a trained scikit-learn RF classifier, and using the permutation_feature_importance function in scikit-learn, respectively.
(2) How useful is the waveform data? Since most of the previous work (e.g., Chen et al.[2] and Hravnak et al.[11]) on VS alert classification did not utilize high-density VS waveform data, we were curious about the predictive utility of waveform data for classifying VS alerts. Consequently, we conducted ablation experiments by withholding waveform features while training and validating our weakly and fully supervised models using the same LOPO cross-validation procedure. However, we must note that the LFs informing the weakly supervised RF still had access to requisite waveform data, and therefore these experiments were not completely indicative of settings with a lack of waveform data.
Results
| Respiratory Rate Alerts | Oxygen Saturation Alerts | |||||||||||
| Accuracy | AUC | FPR 50% TPR | FNR 50% TNR | TPR 1% FPR | TNR 1% FNR | Accuracy | AUC | FPR 50% TPR | FNR 50% TNR | TPR 1% FPR | TNR 1% FNR | |
| Weak Sup. | 0.915 | 0.951 | 0.012 | 0.008 | 0.428 | 0.567 | 0.881 | 0.940 | 0.011 | 0.009 | 0.382 | 0.630 |
| Majority Vote | 0.855 | 0.952 | 0 | 0.015 | 0.551 | 0.409 | 0.899 | 0.951 | 0.011 | 0.007 | 0.458 | 0.630 |
| Fully Sup. | 0.886 | 0.898 | 0.07 | 0.023 | 0.038 | 0.304 | 0.903 | 0.964 | 0.016 | 0.007 | 0.345 | 0.582 |
| Prob. Labels | 0.894 | 0.936 | 0.006 | 0.002 | 0.577 | 0.550 | 0.844 | 0.902 | 0.016 | 0.037 | 0.151 | 0.143 |
| WS w/o WF | 0.887 | 0.918 | 0.035 | 0.010 | 0.031 | 0.474 | 0.709 | 0.754 | 0.111 | 0.197 | 0.012 | 0.032 |
| Sup. w/o WF | 0.838 | 0.871 | 0.053 | 0.019 | 0.004 | 0.146 | 0.730 | 0.825 | 0.037 | 0.106 | 0.002 | 0.243 |
| Maj. w/o WF | 0.792 | 0.899 | 0.07 | 0.019 | 0.080 | 0.199 | 0.702 | 0.779 | 0.058 | 0.167 | 0.025 | 0.069 |
| GI | PFI | ||||
| Alert | WS | Fully Sup. | WS | Fully Sup. | |
| RR | std_resp | q1_rr | std_rr | respHeight | |
| respHeight | respHeight | q1_resp | std_resp | ||
| mean_rr | mean_rr | respFFT | std_rr | ||
| q1_rr | std_resp | skew_rr | q3_resp | ||
| med_rr | med_rr | respNK1 | q1_resp | ||
| SpO2 | plethFFT | kurt_pleth | med_rr | plethTINT | |
| plethINT | plethFFT | q1_rr | plethTNK1 | ||
| plethNK1 | plethINT | q3_rr | plethFFT | ||
| kurt_pleth | q3_pleth | plethNK1 | plethTFFT | ||
| plethHeight | plethNK1 | skew_pleth | med_SpO2T | ||
Performance Metrics
For the RR alerts, the various performance metrics shown in Table 1 highlight our WS model’s surprising, but superior performance over its FS counterpart. On the other hand, analysis on the models’ performance on SpO2/SpO2T alerts yielded more expected results, with the FS model performing slightly better than the WS. However, the WS model’s performance is still noteworthy considering that the FS model had the immense advantage of accessing ground truth labels for training. The results also indicate that our models performed better at classifying RR alerts than SpO2/SpO2T alerts, consistent with prior work by Chen et al.[2]. However, the performance gap we found between the two alert types was slimmer, likely due to the inclusion of waveform data in our work.
ROC Analysis
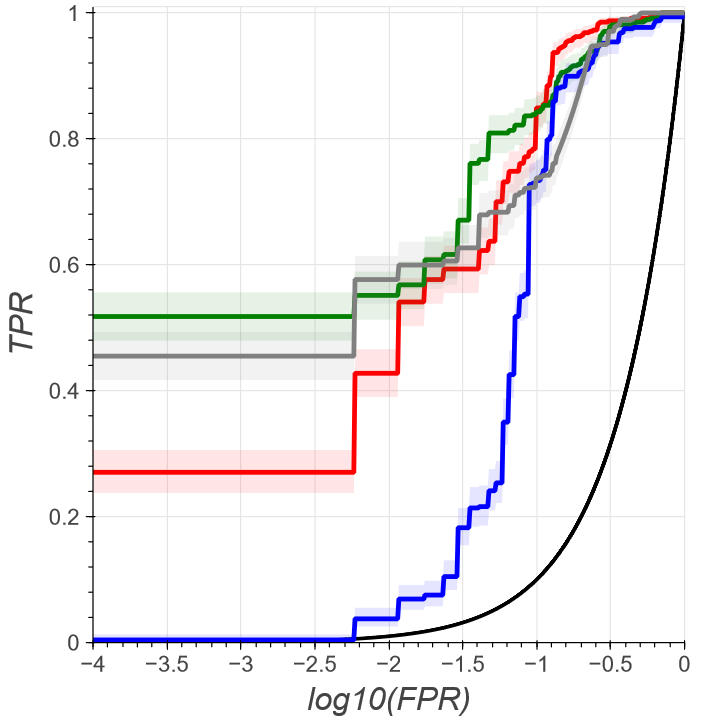
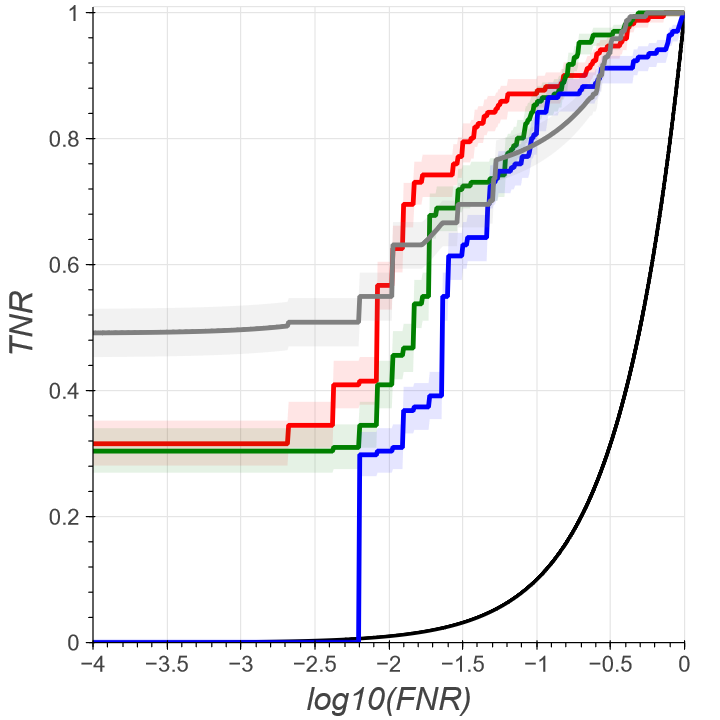
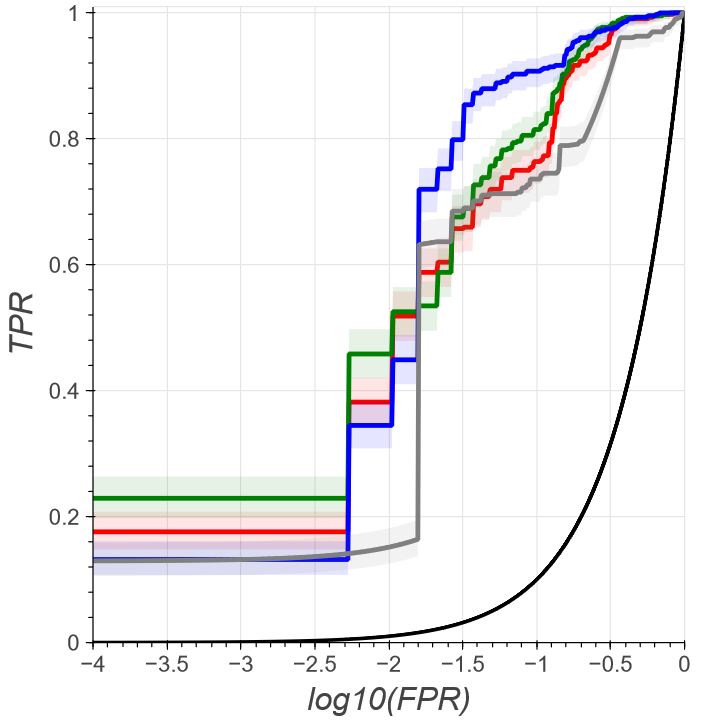
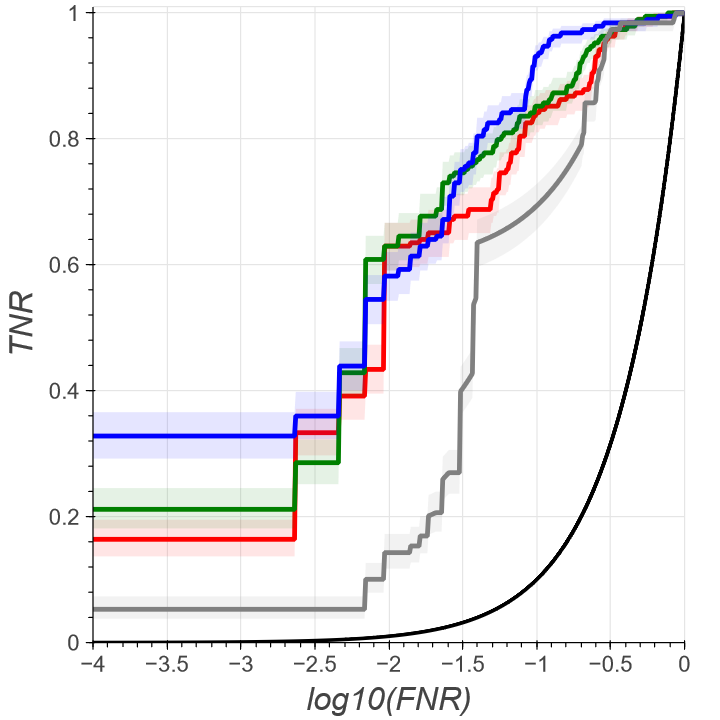
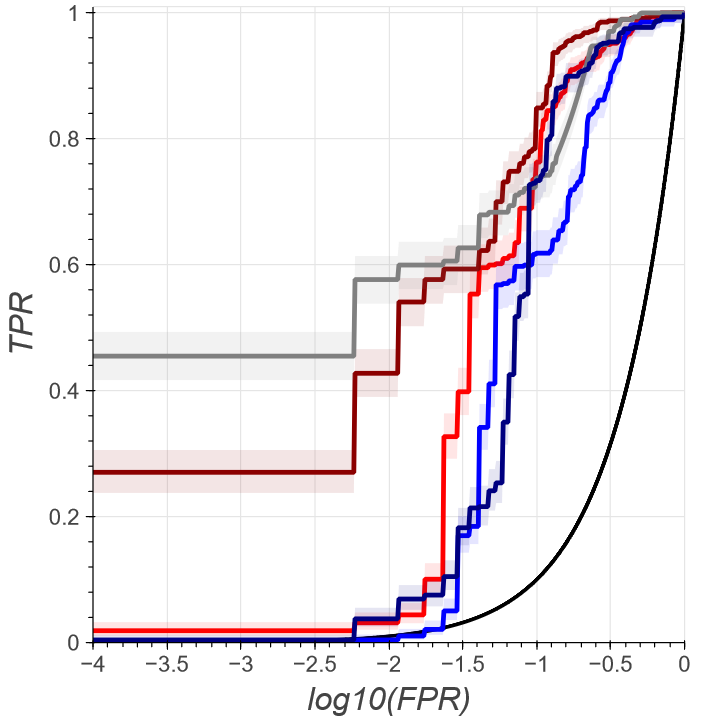
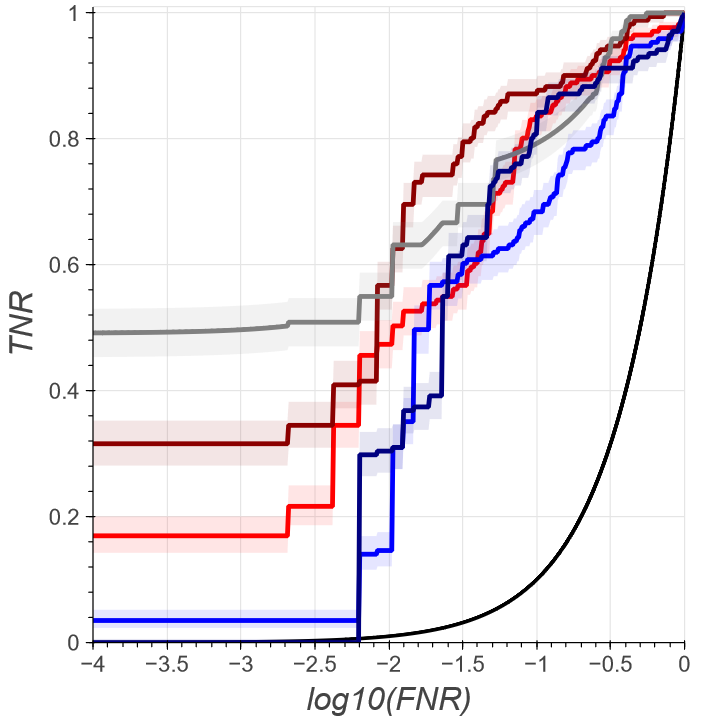
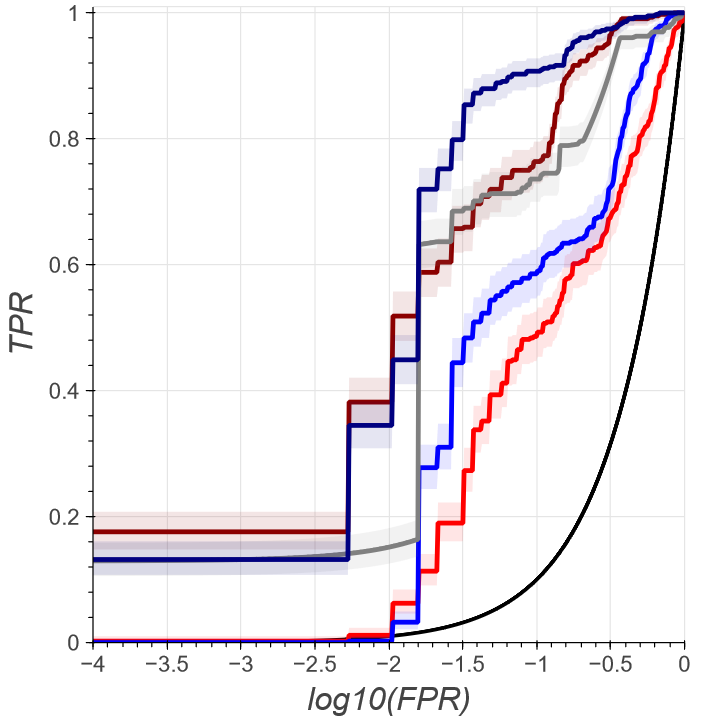
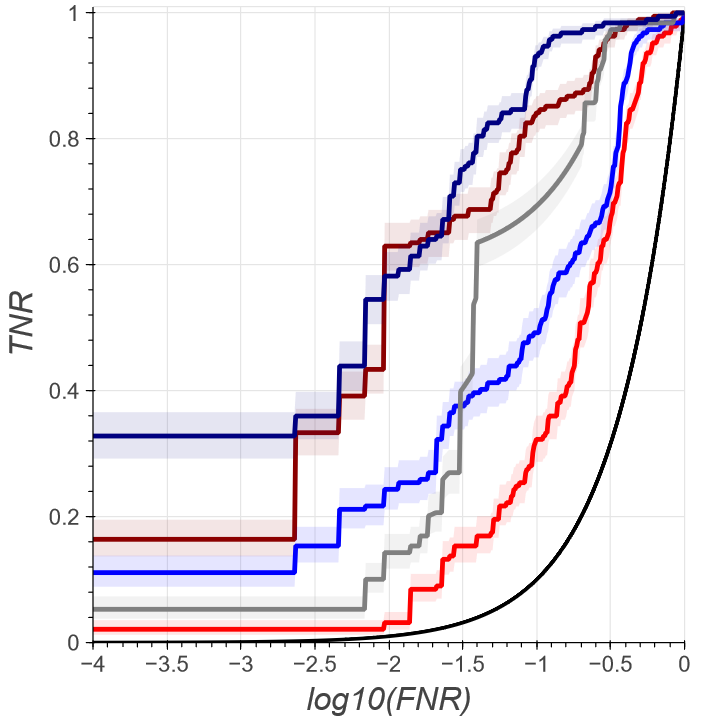
In Figures 4 and 5 we plot pairs of Receiver Operating Characteristic (ROC) diagrams for each experimental configuration in logarithmic scale of the horizontal axis, to help focus the interpretation of the results on the low error rate settings which are of practical relevance in clinical decision support scenarios. One plot in each pair shows true positive rate as a function of logarithmically scaled false positive rate, the other shows the other end of the ROC plot by presenting the same data in the coordinates of true negative rate as a function of logarithmically scaled false negative rate. Each plot includes a random model line in solid dark grey for viewers’ reference
From ROC plots for RR alerts shown in Figure 4 (i & ii), it is clear that our WS model has a higher TPR and TNR at nearly every FPR and FNR setting, respectively. For SpO2/SpO2T (Plots iii & iv in Figure 4), that is not the case. Nonetheless, WS still performs comparably to FS, despite not having access to ground truth labels, underscoring the impressive capabilities of weak supervision as applied to VS alert classification.
 |
 |
| (i) | (ii) |
 |
 |
| (iii) | (iv) |
Answers to Additional Research Questions
Our weakly and fully supervised RF models are learning similar patterns. We found considerable overlap between important features for our weakly and fully supervised RF classifiers, despite some minor differences in the feature importance ranking. For example for RR alerts, our models found the standard deviation (std_resp) and the height of the resp waveform (respHeight) to be the most important. For SpO2/SpO2T alerts, we found the HR derived from the primary harmonic of the pleth (plethFFT), and by counting its peaks (plethINT)†††Specifically, plethINT is based on the number of common peaks found using the peak finding functions of sciPy and Neurokit2. to be high-ranking across both models in terms of GI and PFI. The apparent discrepancies in rankings may be due to the different ways in which GI and PFI compute feature importance. Nevertheless, the large overlap in high-ranking features for both alert types, across both types of models, and for both feature importance metrics, indicates that the weakly and fully supervised RF models may be learning similar patterns for both VS alert types.
 |
 |
| (i) | (ii) |
 |
 |
| (iii) | (iv) |
Waveform data is helpful for RR alerts, but almost essential for SpO2/SpO2T alerts. The log-scale ROC plots in Figure 5 neatly visualize the predictive utility of waveform data for both the RR and SpO2/SpO2T alerts. For RR alerts, the plots show some separation between models with and without access to waveform data, indicating the slight usefulness of waveform data for RR alert classification. In contrast, the plots for oxygen saturation alerts show a much larger gap, with models having access to waveform data performing much better than those without. The significant predictive utility of waveform data for oxygen saturation alert classification is further substantiated by the ubiquity of waveform features in the top echelon of feature importance rankings, as highlighted previously and shown in Table 3.
Discussion
This work has five main takeaways: (1) The novel core methodologies we developed to derive VS numeric values from time series waveform data were reliable, and have meaningful applications beyond the scope of this project. (2) Both the fully and weakly supervised pipelines - when validated on unseen data from a unique patient - remained robust and performed well, with AUC values ranging from 0.898 to 0.964 for all the models. (3) The predictive utility of waveform data was found to be only slight for RR alerts, but significantly important for SpO2/SpO2T alerts. (4) The WS models were shown to perform on par with their FS counterparts, and for the RR alerts, even outperform them. (5) Perhaps most importantly, the WS models could be built within a span of a few hours, and without the significant involvement or time of domain experts, streamlining the process of building accurate and efficient VS alert classifiers. Overall, this work demonstrates the efficacy of weak supervision as a framework to streamline the process for building ML models for HC applications in a scalable fashion, contributing to a broadening of the social impact of powerful machine learning methodologies.
Limitations & Future Work
There are a few limitations of this work. Firstly, it assumes a priori knowledge of approximate real versus artifact class balances of vital sign alerts. However, domain experts often already have this knowledge, so these models can still be built to accomplish their goals. Secondly, due to the design of our study, the WS model is currently best used as a “fact-checker” that lends a secondary opinion on archived vital sign alert data. In the future, analysis should be carried out to measure the speed and latency of the classification algorithm, before eventually optimizing the design to create and implement a real-time artifact alert adjudication system. Despite these limitations, the promising results indicate that a trained WS model could eventually serve as an effective tool for medical practitioners to combat alarm fatigue in the acute and intensive care settings.
Acknowledgements
This work was partially supported by a fellowship from Carnegie Mellon University’s Center for Machine Learning and Health to M.G.
References
- [1] Abraham Otero, Paulo Félix, Senén Barro, and Francisco Palacios. Addressing the flaws of current critical alarms: a fuzzy constraint satisfaction approach. Artificial intelligence in medicine, 47(3):219–238, 2009.
- [2] Lujie Chen, Artur Dubrawski, Donghan Wang, Madalina Fiterau, Mathieu Guillame-Bert, Eliezer Bose, Ata M Kaynar, David J Wallace, Jane Guttendorf, Gilles Clermont, et al. Using supervised machine learning to classify real alerts and artifact in online multi-signal vital sign monitoring data. Critical care medicine, 44(7):e456, 2016.
- [3] Sue Sendelbach and Marjorie Funk. Alarm fatigue: a patient safety concern. AACN advanced critical care, 24(4):378–386, 2013.
- [4] George Takla, John H Petre, D John Doyle, Mayumi Horibe, and Bala Gopakumaran. The problem of artifacts in patient monitor data during surgery: a clinical and methodological review. Anesthesia & Analgesia, 103(5):1196–1204, 2006.
- [5] Keith J Ruskin and Dirk Hueske-Kraus. Alarm fatigue: impacts on patient safety. Current Opinion in Anesthesiology, 28(6):685–690, 2015.
- [6] Marilyn Hravnak, Tiffany Pellathy, Lujie Chen, Artur Dubrawski, Anthony Wertz, Gilles Clermont, and Michael R Pinsky. A call to alarms: current state and future directions in the battle against alarm fatigue. Journal of electrocardiology, 51(6):S44–S48, 2018.
- [7] Katarzyna Lewandowska, Magdalena Weisbrot, Aleksandra Cieloszyk, Wioletta Mędrzycka-Dąbrowska, Sabina Krupa, and Dorota Ozga. Impact of alarm fatigue on the work of nurses in an intensive care environment—a systematic review. International Journal of Environmental Research and Public Health, 17(22):8409, 2020.
- [8] Shu-Fen Wung, Daniel C Malone, and Laura Szalacha. Sensory overload and technology in critical care. Critical care nursing clinics of North America, 30(2):179–190, 2018.
- [9] Rachel R Vitoux, Catherine Schuster, and Kevin R Glover. Perceptions of infusion pump alarms: Insights gained from critical care nurses. Journal of Infusion Nursing, 41(5):309, 2018.
- [10] Ashish K Khanna, Sanchit Ahuja, Robert S Weller, and Timothy N Harwood. Postoperative ward monitoring–why and what now? Best Practice & Research Clinical Anaesthesiology, 33(2):229–245, 2019.
- [11] Marilyn Hravnak, Lujie Chen, Artur Dubrawski, Eliezer Bose, Gilles Clermont, and Michael R Pinsky. Real alerts and artifact classification in archived multi-signal vital sign monitoring data: implications for mining big data. Journal of clinical monitoring and computing, 30(6):875–888, 2016.
- [12] Daniele Roberto Giacobbe, Alessio Signori, Filippo Del Puente, Sara Mora, Luca Carmisciano, Federica Briano, Antonio Vena, Lorenzo Ball, Chiara Robba, Paolo Pelosi, et al. Early detection of sepsis with machine learning techniques: a brief clinical perspective. Frontiers in medicine, 8, 2021.
- [13] Khaled Saab, Jared Dunnmon, Christopher Ré, Daniel Rubin, and Christopher Lee-Messer. Weak supervision as an efficient approach for automated seizure detection in electroencephalography. NPJ digital medicine, 3(1):1–12, 2020.
- [14] Mononito Goswami, Benediky Boecking, and Artur Dubrawski. Weak supervision for affordable modeling of electrocardiogram data. In AMIA Annual Symposium Proceedings. American Medical Informatics Association, 2022.
- [15] Ruchika Sinhal, Kavita Singh, and MM Raghuwanshi. An overview of remote photoplethysmography methods for vital sign monitoring. Computer Vision and Machine Intelligence in Medical Image Analysis, pages 21–31, 2020.
- [16] JM Graybeal and MT Petterson. Adaptive filtering and alternative calculations revolutionizes pulse oximetry sensitivity and specificity during motion and low perfusion. In The 26th Annual International Conference of the IEEE Engineering in Medicine and Biology Society, volume 2, pages 5363–5366. IEEE, 2004.
- [17] Mi He, Yongjian Nian, and Yushun Gong. Novel signal processing method for vital sign monitoring using fmcw radar. Biomedical Signal Processing and Control, 33:335–345, 2017.
- [18] Joseph S Paul, M Ramasubba Reddy, and V Jagadeesh Kumar. A transform domain svd filter for suppression of muscle noise artefacts in exercise ecg’s. IEEE Transactions on Biomedical Engineering, 47(5):654–663, 2000.
- [19] C Marque, C Bisch, R Dantas, S Elayoubi, V Brosse, and C Perot. Adaptive filtering for ecg rejection from surface emg recordings. Journal of electromyography and kinesiology, 15(3):310–315, 2005.
- [20] Guohua Lu, John-Stuart Brittain, Peter Holland, John Yianni, Alexander L Green, John F Stein, Tipu Z Aziz, and Shouyan Wang. Removing ecg noise from surface emg signals using adaptive filtering. Neuroscience letters, 462(1):14–19, 2009.
- [21] Jinseok Lee, David D McManus, Sneh Merchant, and Ki H Chon. Automatic motion and noise artifact detection in holter ecg data using empirical mode decomposition and statistical approaches. IEEE Transactions on Biomedical Engineering, 59(6):1499–1506, 2011.
- [22] Ricardo Couceiro, P Carvalho, Rui Pedro Paiva, Jorge Henriques, and Jens Muehlsteff. Detection of motion artifacts in photoplethysmographic signals based on time and period domain analysis. In 2012 Annual international conference of the IEEE engineering in medicine and biology society, pages 2603–2606. IEEE, 2012.
- [23] Syed Khairul Bashar, Dong Han, Apurv Soni, David D McManus, and Ki H Chon. Developing a novel noise artifact detection algorithm for smartphone ppg signals: Preliminary results. In 2018 IEEE EMBS International Conference on Biomedical & Health Informatics (BHI), pages 79–82. IEEE, 2018.
- [24] David Pollreisz and Nima TaheriNejad. Detection and removal of motion artifacts in ppg signals. Mobile Networks and Applications, pages 1–11, 2019.
- [25] Takunori Shimazaki, Shinsuke Hara, Hiroyuki Okuhata, Hajime Nakamura, and Takashi Kawabata. Cancellation of motion artifact induced by exercise for ppg-based heart rate sensing. In 2014 36th Annual International Conference of the IEEE Engineering in Medicine and Biology Society, pages 3216–3219. IEEE, 2014.
- [26] S Caldas, V Jeanselme, G Clermont, MR Pinsky, and A Dubrawski. A case for federated learning: Enabling and leveraging inter-hospital collaboration. In C33. QUALITY, PROCESSES, AND OUTCOMES IN ACUTE AND CRITICAL CARE, pages A4790–A4790. American Thoracic Society, 2020.
- [27] Jason A Fries, Paroma Varma, Vincent S Chen, Ke Xiao, Heliodoro Tejeda, Priyanka Saha, Jared Dunnmon, Henry Chubb, Shiraz Maskatia, Madalina Fiterau, et al. Weakly supervised classification of aortic valve malformations using unlabeled cardiac mri sequences. Nature communications, 10(1):1–10, 2019.
- [28] Alexander J Ratner, Christopher M De Sa, Sen Wu, Daniel Selsam, and Christopher Ré. Data programming: Creating large training sets, quickly. Advances in neural information processing systems, 29:3567–3575, 2016.
- [29] Alexander Ratner, Stephen H Bach, Henry Ehrenberg, Jason Fries, Sen Wu, and Christopher Ré. Snorkel: Rapid training data creation with weak supervision. In Proceedings of the VLDB Endowment. International Conference on Very Large Data Bases, volume 11, page 269. NIH Public Access, 2017.
- [30] Pauli Virtanen, Ralf Gommers, Travis E Oliphant, Matt Haberland, Tyler Reddy, David Cournapeau, Evgeni Burovski, Pearu Peterson, Warren Weckesser, Jonathan Bright, et al. Scipy 1.0: fundamental algorithms for scientific computing in python. Nature methods, 17(3):261–272, 2020.
- [31] Davood Khodadad, Sven Nordebo, Beat Müller, Andreas Waldmann, Rebecca Yerworth, Tobias Becher, Inez Frerichs, Louiza Sophocleous, Anton Van Kaam, Martijn Miedema, et al. Optimized breath detection algorithm in electrical impedance tomography. Physiological measurement, 39(9):094001, 2018.
- [32] Dominique Makowski, Tam Pham, Zen J Lau, Jan C Brammer, François Lespinasse, Hung Pham, Christopher Schölzel, and SH Annabel Chen. Neurokit2: A python toolbox for neurophysiological signal processing. Behavior Research Methods, pages 1–8, 2021.
- [33] Leo Breiman. Random forests. Machine learning, 45(1):5–32, 2001.
- [34] Mononito Goswami, Lujie Chen, and Artur Dubrawski. Discriminating cognitive disequilibrium and flow in problem solving: A semi-supervised approach using involuntary dynamic behavioral signals. In Proceedings of the AAAI Conference on Artificial Intelligence, volume 34, pages 420–427, 2020.
- [35] Mononito Goswami, Minkush Manuja, and Maitree Leekha. Towards social & engaging peer learning: Predicting backchanneling and disengagement in children. arXiv preprint arXiv:2007.11346, 2020.
- [36] Lars Buitinck, Gilles Louppe, Mathieu Blondel, Fabian Pedregosa, Andreas Mueller, Olivier Grisel, Vlad Niculae, Peter Prettenhofer, Alexandre Gramfort, Jaques Grobler, Robert Layton, Jake VanderPlas, Arnaud Joly, Brian Holt, and Gaël Varoquaux. API design for machine learning software: experiences from the scikit-learn project. In ECML PKDD Workshop: Languages for Data Mining and Machine Learning, pages 108–122, 2013.
- [37] André Altmann, Laura Toloşi, Oliver Sander, and Thomas Lengauer. Permutation importance: a corrected feature importance measure. Bioinformatics, 26(10):1340–1347, 2010.