Laser-induced electron dynamics and surface modification in ruthenium thin films
Abstract
We performed the experimental and theoretical study of the heating and damaging of ruthenium thin films induced by femtosecond laser irradiation. Results of an optical pump-probe thermoreflectance experiment with rotating sample allowing to significantly reduce heat accumulation in irradiated spot are presented. We show the evolution of surface morphology from growth of a heat-induced oxide layer at low and intermediate laser fluences to cracking and grooving at high fluences. Theoretical analysis of pump-probe signal allows us to relate behavior of hot electrons in ruthenium to the Fermi smearing mechanism. The analysis of heating is performed with the two-temperature modeling and molecular dynamics simulation, results of which demonstrate that the calculated melting threshold is higher than experimental damage threshold. We attribute it to heat-induced surface stresses leading to cracking which accumulates to more severe damage morphology. Our results provide an upper limit for operational conditions for ruthenium optics and also direct to further studies of the Fermi smearing mechanism in other transition metals.
1 Introduction
Ultrashort lasers have become versatile tools for manipulation of material properties at the nanoscale. A unique ability of such lasers to deliver enormous amount of energy into a sample on a femtosecond timescale creates extreme strongly non-equilibrium states which upon relaxation lead to altered material properties. Ultrashort lasers are used for surface nanostructuring [1] and nanofabrication [2, 3, 4], as well as for reversible switching of material structure between crystal and amorphous phases for applications in data storage [5]. Alternatively to these high intensity laser applications, ultrashort lasers with relatively low intensity are used in various metrology and probing techniques [6, 7, 8]. In this context, contrarily to the previous examples, laser-induced damage must be avoided. In both scenarios of desired and undesired material modifications, a precise control of the output of laser-matter interaction is crucial, and can only be achieved with a deep understanding of the fundamental physical processes involved. This work aims at such understanding on an example of ruthenium (Ru) thin films exposed to optical femtosecond laser pulses.
Ru and Ru oxides are indispensable materials for various catalysis applications [9, 10]. Controlling the surface properties of Ru such as oxidation state, as well as the shape and structure of Ru nanocrystals, provides additional efficient functionalities [11]. Ultrathin films of Ru are used as protective capping layers in extreme ultraviolet optics, due to high transmissivity in EUV range and low surface oxidation [12]. Ru is also considered as a high Z material for grazing incidence hard X-ray optics [13].
In our previous studies we focused on severe damage of Ru thin films in single- [14, 15, 16] and multi-shot regimes [17], as well as on a long-term exposure of Ru at fluences significantly below the single-shot ablation threshold [18]. Such sub-threshold investigation of material degradation is challenging since the processes involved are elusive to be detected post-mortem. Dynamical data must be collected to provide insights into how laser-induced evolution of Ru results in final damage. Therefore, in this work we continue investigating Ru interaction with ultrashort laser pulses in an all-optical pump-probe scheme with rotating sample to reduce heat accumulation effects. After the irradiation, Ru surfaces are examined with various surface-sensitive characterization techniques.
To interpret experimental results we perform theoretical analysis of Ru optical response to ultrashort laser irradiation. When an ultrafast laser pulse illuminates a metallic target, its energy is absorbed by the conduction band electrons, which leads to evolution of initially equilibrium electron distribution to a non-equilibrium one. It is often assumed that the thermalization of an electron gas to an equilibrium Fermi distribution occurs on a timescale of fs, which is comparable to a pulse duration [19, 20, 21, 22]. Thus, it is convenient to consider the probed optical response of a metallic target in terms of the electron temperature elevated with respect to the atomic one . However, a reliable model for -dependent optical constants is required for a direct analysis of optical pump-probe experiments. The widely used Drude model is limited in applicability to the case of simple metals [23]. In the case of noble metals, the optical response can be successfully described by Fermi smearing mechanism, assuming that reflectivity change is proportional to the derivative of the Fermi distribution with respect to the electron temperature [24, 25, 26].
In contrast, in a transition metal with a complex band structure such as Ru, the optical constants are formed by a sum of inter- and intraband contributions within a combined d-s/p conduction band and to date could not be reasonably approximated with a simple analytical model. Instead, -dependence may be extracted from first-principles simulations of the complex dielectric function of a material in, e.g., random-phase approximation (RPA) [27, 28, 29, 30].
We test to what extent a simple Fermi smearing analysis can be applied to Ru. Absorption of the laser energy by the electrons and coupling of electrons to the lattice is modelled with the two-temperature model (TTM). The calculated melting threshold is compared with the experimental surface modification observations.
2 Experimental setup
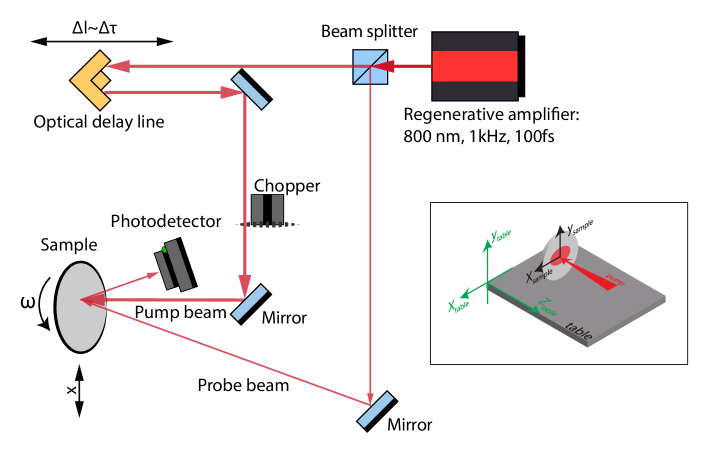
For the pump-probe thermoreflectance experiments, we employed pump-probe set-up based on ultrafast 1 kHz repetition rate Ti:Sapphire laser Fig. 1. The experiment was carried out under atmospheric conditions. The beam profile was characterized by a knife-edge method along the horizontal direction. Additional post mortem analysis of Ru ablation craters revealed an ellipticity of a Gaussian profile. The value of the semi-major axis was (@ ) whereas the value of the semi-minor axis was 1.4 times smaller. The peak incindent fluence was calculated as follows:
| (1) |
Here is an energy value of pump pulse, and are values of semi-major and semi-minor axes of ellipse, respectively. The sample was positioned slightly before the focal spot to avoid air ionization and consequent aberration of the beam quality at the sample. The angles of incidence (AOI) were set close to normal ( and off-sample normal for pump and probe pulses, respectively). To continuously control the laser fluence we used an attenuator consisting of a half-wave plate and a polarizer located in the pump path. We characterized the laser pulse duration by placing an autocorrelator just before the sample with typical measured values to be (FWHM). P- and s-polarizations with respect to the optical bench were used for the pump and the probe pulse, respectively.
As a studied material, we used ruthenium (Ru) polycrystalline thin metal film. The Ru films of various thickness between 17 and 125 nm were deposited by magnetron spattering on top of (100) single-crystal Si substrates wafers with 3-inch diameter. Ru thickness was measured using X-ray reflectivity technique. To reduce the effect of heat accumulation, samples were mounted on a rotational stage. The rotational frequency was set to . Such a scheme ensured an effective reduction of the repetition rate, without changes of the laser source. However, after several rotations laser pulses start hitting previously exposed surface, therefore accumulation of irreversible changes induced by pump pulses is expected at high pump fluences. For each sample we measured transient reflectivity change induced by pump pulses of various fluences. For each fluence value a different position on a sample was measured. Since the position variation was small compared to the radius at which the set of measurements was performed, a slightly different level of accumulation of irreversible changes for different fluences within each sample can be neglected.
Before the actual measurement of thermoreflectance curve, several pump and probe pulses arrive to the sample surface at negative delays between the pump and the probe resulting in a weak signal. We have a pronounced step in this signal at negative delays from -15 to 0 ps (see Fig. 2). We explain it by a partial split of the pump signal in the beamsplitter: a small part of the pump comes to the sample just before the next probe and serves as a weak excitation. Analyzing thermoreflectance data, we aligned the signal to the values taken from delays .
3 Experimental results
3.1 Fluence-dependent transient thermoreflectance
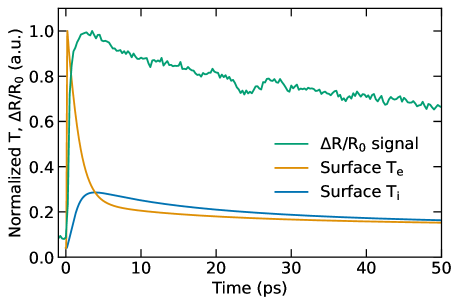
A set of pump-probe transient reflectivity data for 37 nm thick Ru film is shown in Fig. 2. It demonstrates that in all measured curves the reflected probe intensity sharply increases during the first few ps resulting in a pronounced peak followed by a slow decay. The very sharp increase at timescales is primarily associated with the increase of the electron temperature induced by the absorbed pump pulse. At timescale, a slower signal increase can be attributed to the coupling of the electrons to the lattice and thereby induced lattice heating. A slow decay over tens of picoseconds corresponds to heat diffusion from the surface region deeper into the sample [31]. This is confirmed by the TTM simulations of the surface electron and lattice temperatures shown in Fig. 3.
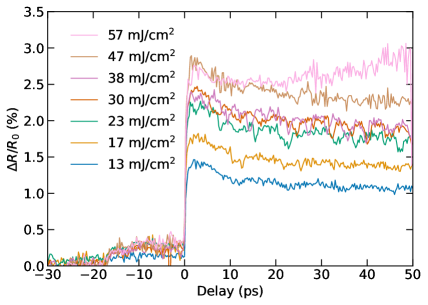
At high pump pulse fluences above we observe qualitatively different behavior of signal at time delay compared to lower fluences. We see the change of trend from a slow decay to an increase. For every thickness, we were able to extract the time when signal starts to increase by calculating time derivative of a signal using regularization algorithm for noisy signals [32]. We determined the time and fluence values when a derivative of a signal changes its sign from negative to positive, and stored them in section 3.1. For 17 nm Ru film, we could not extract any values, because the pump-probe curves exhibit strong oscillations for high fluence values. For 125 nm Ru film, we did not observe an increase of the signal within the fluence and time delay ranges considered, and thus put the highest measured fluence into the table. We use these data later in Section 4.3 when discussing thickness-dependent damage threshold in Ru.
| thickness, | |||
|---|---|---|---|
| nm | incident fluence, | ||
| absorbed fluence, | |||
| delay, | |||
| ps | |||
| 17 | - | - | - |
| 30 | 51.2 3.8 | 14.1 1.0 | 25.5 |
| 37 | 54.6 4.0 | 16.7 1.2 | 36.0 |
| 50 | 60.9 4.5 | 21.7 1.6 | 21.5 |
| 75 | 67.2 4.9 | 25.9 1.9 | 21.8 |
| 125 | 77.0 5.7 | 29.9 2.2 | - |
The measured data in Fig. 3 show that the peak reflectivity change reached at for each curve increases with the fluence and saturates at a certain fluence value. Similar sets of pump-probe thremoreflectance curves were obtained for various thicknesses of Ru films. The overview of measured data for all film thicknesses is stored in the supplementary materials.
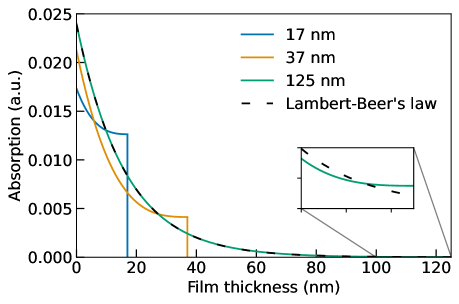
In Fig. 4 we provide the peak values of as a function of the pump pulse fluence for three different thicknesses of Ru corresponding to three absorption regimes. The optical penetration depth in Ru for 800 nm light is 16 nm. Therefore, for 17 nm film, multiple reflections of absorbed light at a Ru-Si interface change the absorption profile considerably compared to the Lambert-Beer law. For 37 nm, deviations from the Lambert-Beer profile are visible but not dramatic, whereas 125 nm film optically behaves like a bulk material, see Fig. 5. We see that with increasing fluence the peak of reflectivity linearly increases and saturates at a particular value for each Ru thickness.
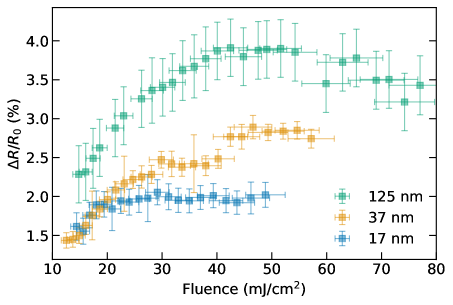
In the case of 37 nm Ru, we see a jump in the peak reflectivity values around . Further analysis does not reveal any sharp changes at this fluence, and such a jump is not present in the data obtained from other samples. Therefore, we consider it to be a measurement artefact. In the case of 125 nm Ru, we observe a drop of reflectivity peak at the highest fluences. We also detected a similar drop at another thickness, 75 nm. We attribute these drops to strong accumulated damage of a film at high fluences. This is confirmed by SEM observations in Section 3.2, where we observed strong damage of sample surfaces at high fluences.
3.2 Analysis of the surface morphology
Since the experiment is carried out with rotation of samples with unsynchronized rotation frequency and laser repetition rate, the pump laser generates not individual spots, but almost continuous lines. Every line corresponds to a particular laser fluence, so we can easily trace possible morphology changes caused by the pump using ex-situ SEM analysis.
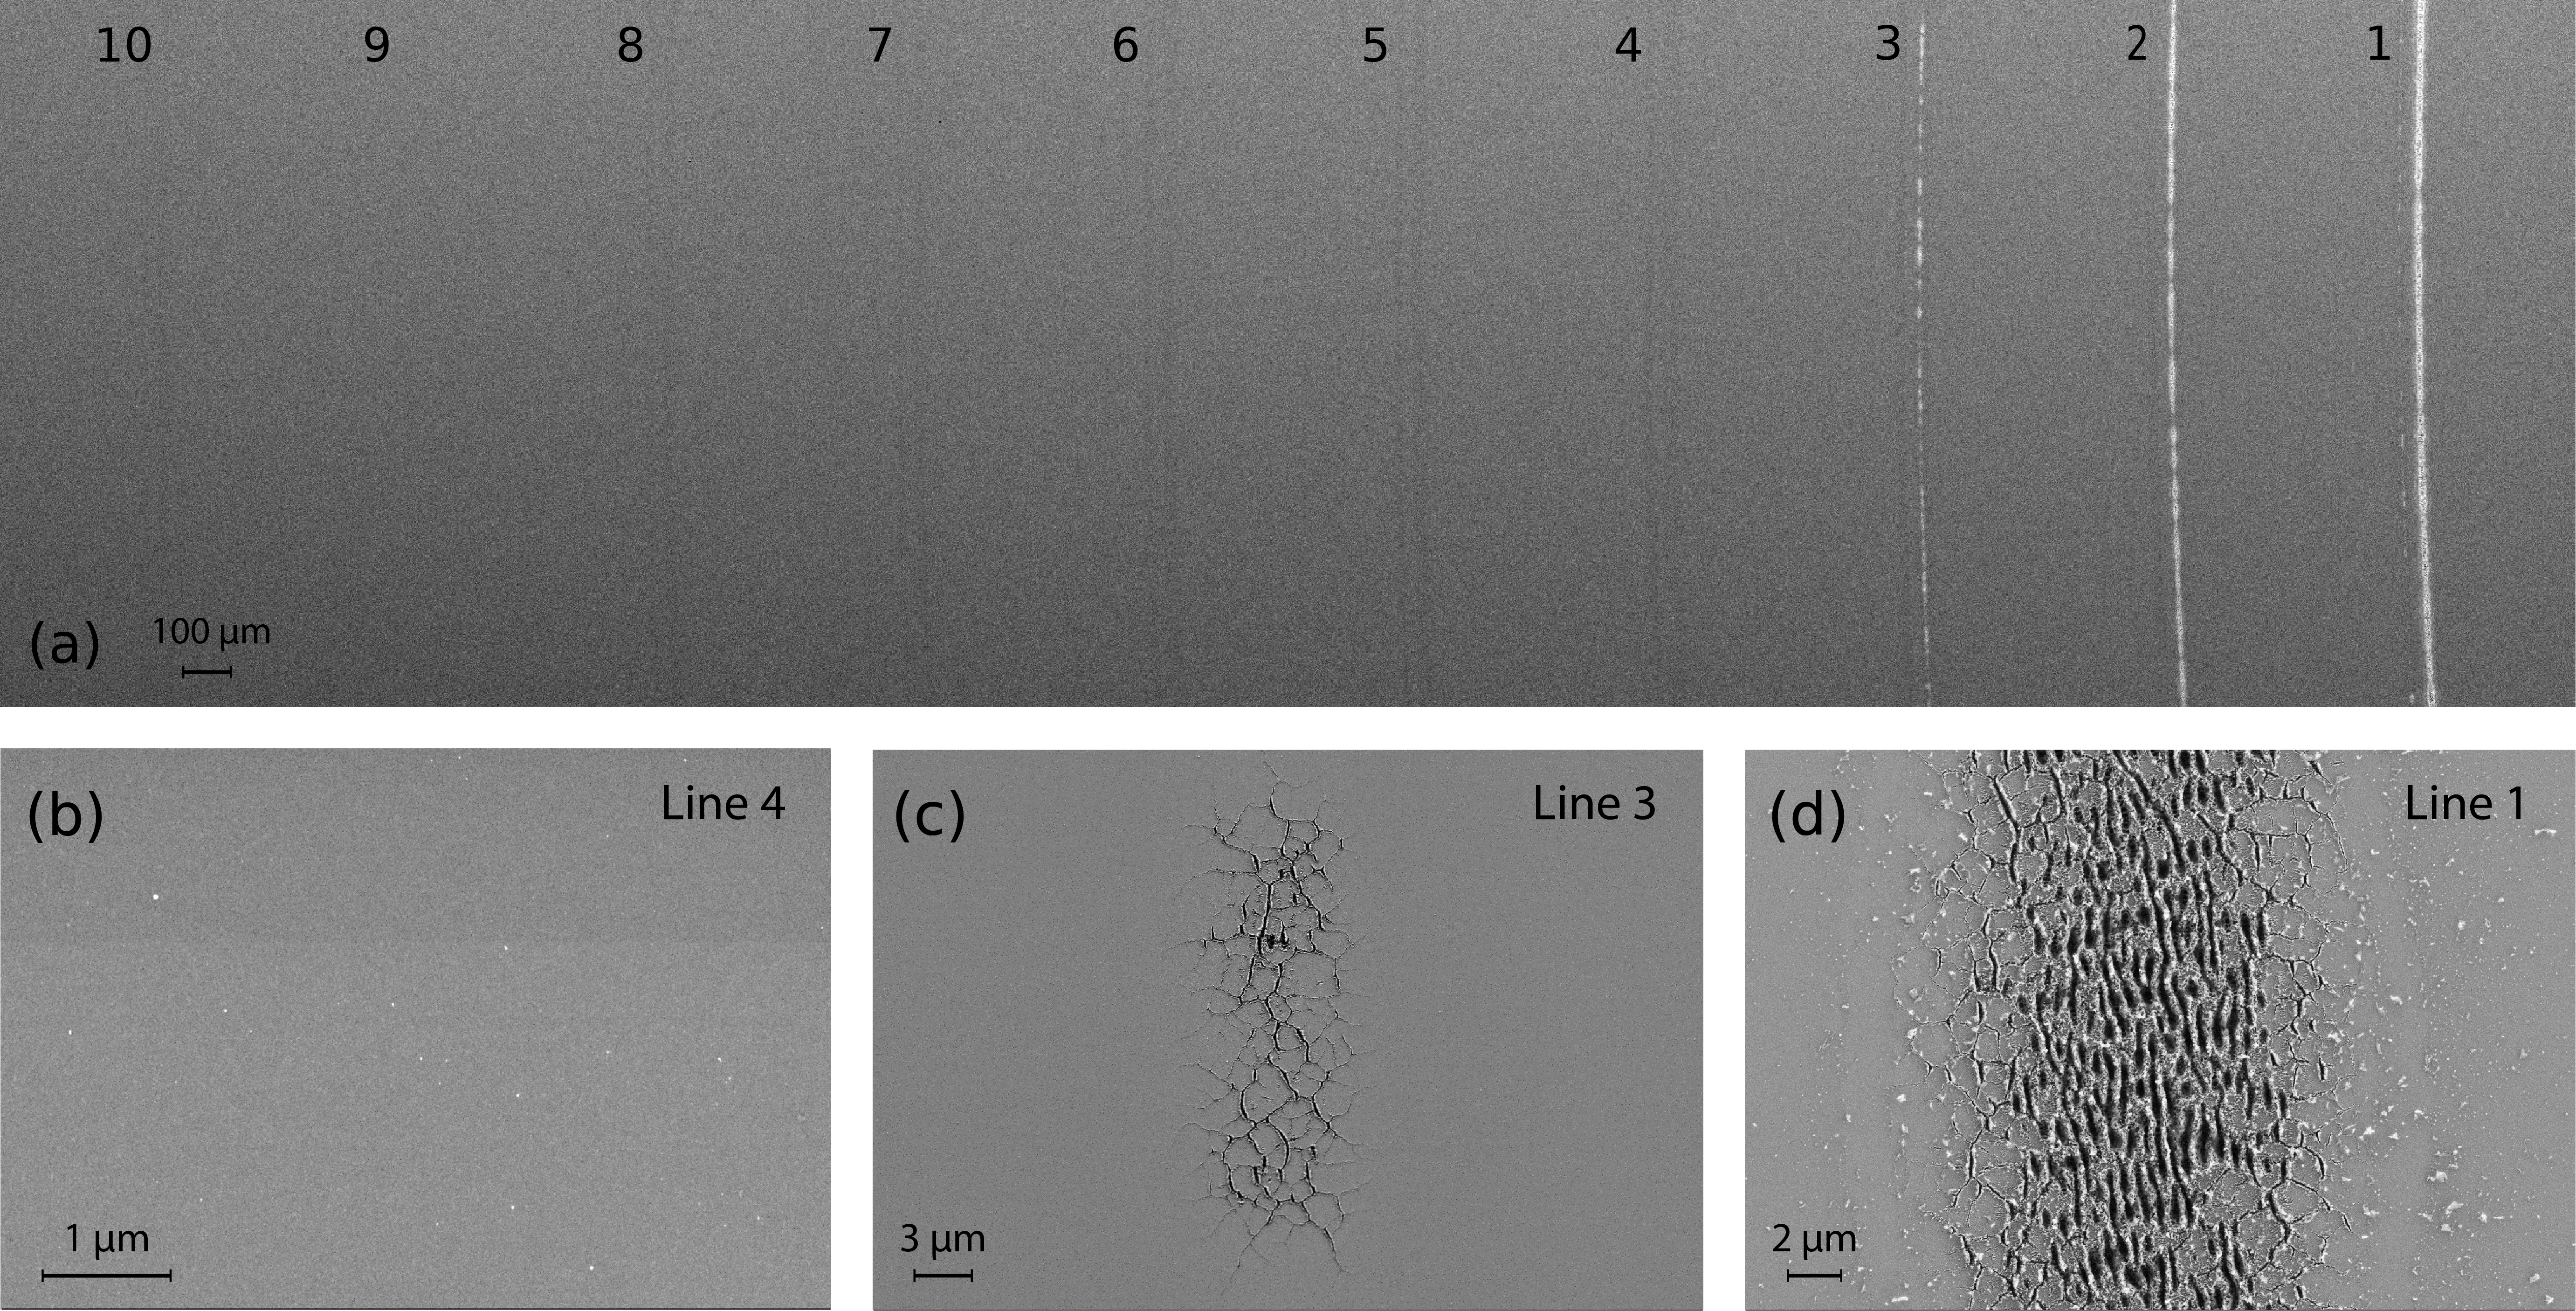
In Fig. 6 we show SEM images of a 37 nm thick Ru film surface after laser exposure. Fig. 6(a) shows the overview SEM image of exposed lines. The line 1 corresponds to the highest peak fluence of , the last visible line (line 10) corresponds to the peak fluence of ). Note that before actual damage of the surface, several lines look like shadows. In Fig. 6(b) we show the magnified view of line 4 (peak fluence is ). At those irradiation conditions, SEM was not able to resolve any morphology changes of the surface. Starting from line 3 we see a clear indication of damage: the surface is covered with cracks (Fig. 6(c)). Further increase of the peak fluence leads to the severe damage of the surface having a shape of periodic grooves.
For the analysis of a shadow on line 4, we performed additional combination of Auger electron spectroscopy (AES), X-ray photoelectron spectroscopy (XPS) and atomic force microscopy (AFM) characterization techniques. AES indicated times increase of oxygen concentration on the ’shadow’ lines, comparing to reference area outside the exposure zones. A more detailed measurement of the oxide thickness done with angle-resolved XPS indicated only 0.4 nm growth of the oxide layer above the thickness of a native oxide of 0.8 nm. The AFM indicated times increased RMS roughness in these exposed areas from 0.187 nm to 0.280 nm. It is unlikely that such small structural changes can explain the formation of ”shadows” on the SEM image. We can assume possible light-induced carbon growth that could explain such shadows. However, growth of small amounts of C on Ru cannot be reliably quantified by AES and XPS, because carbon and ruthenium emission spectra overlap on Auger electron/X-ray photo-emission spectra. The XPS spectra in the exposed spot showed an increase of the intensity at the energy of the Ru3d3/2 peak relative to the Ru3d5/2 intensity (compared to outside the exposed area). This is a qualitative indication of an increased carbon content, but the difference compared to the unexposed area is too small for a reliable quantification by peak fitting. Hence, we can claim that the darkness on an irradiated path is a result of heat-induced surface chemistry. We found that the darkness is a result of minor increase of the oxide thickness as well as slight carbonization. However, we could not resolve the exact stoichiometry of the compound since the carbon signal was too weak to quantify.
4 Theoretical analysis
4.1 Two-temperature modeling
For the analysis of laser-induced ultrafast heating and melting of Ru thin films, we applied the two-temperature model (TTM) [34]. The TTM equations that govern heat dynamics of electron and lattice subsystems are:
| (2) |
Here , and are the temperature, heat capacity and thermal conductivity of Ru electrons (subscript e) and lattice (subscript l), respectively; is the temperature-dependent electron-phonon coupling factor, and is the heat source representing a laser pulse. Lattice thermal conductivity is considered to be negligible compared to the electron one. The thermal parameters are provided below in Appendix A. To account for solid-liquid phase transition at the melting temperature , we used an effective lattice heat capacity containing a delta-function term corresponding to the latent heat of fusion , as was initially proposed in [35] for ns-laser heating, and latter extended in [36] to TTM approach and fs pulses. The melting threshold was considered to be reached when at least one computational cell came to a liquid state.
The heat source is a product of a temporal Gaussian pulse and in-depth absorbed energy profile as follows:
| (3) |
Here is an incident fluence, is a pulse duration, and is an absorbed energy profile. For bulk materials and films much thicker than the photons absorption length, can be described by the Lambert-Beer absorption law. However, in the case of multilayer structures and thin films with the thickness comparable to the absorption length of photons, Lambert-Beer law breaks down (see Fig. 5). To account for the deviations of the absorption profile from the Lambert-Beer’s law in the heat source, in our code we implemented the matrix algorithm for the fields calculation [33].
4.2 Fermi smearing mechanism in Ru
To relate experimentally measured change of reflectivity and TTM-calculated temperatures , , one needs to know how optical constants depend on temperatures in two-temperature regime. -dependence of optical properties is often neglected as far as heating of lattice subsystem does not cause any significant changes in electronic structure. In this work, we assume that the transient optical response of the electron system in Ru can be described in terms of the electron temperature , same as in other transition metals [31, 37]. However, a seek of an approximate form of -dependence of Ru optical constants is a challenging task. Due to the complexity of Ru band structure near the Fermi level, a simple but widely accepted Drude model would not provide reliable results, whereas accurate DFT-based optical constants would require a set of computationally heavy calculations. Nevertheless, some qualitative information about optical response in Ru can be obtained if one recognizes a similarity in band structures of Ru and gold in the vicinity of Fermi level.
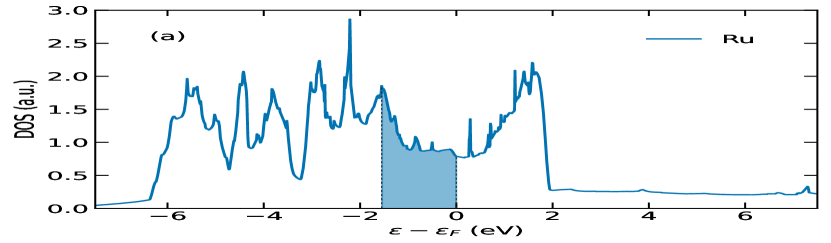
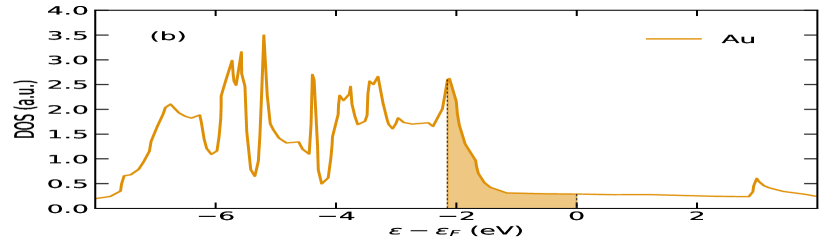
We found out that the electron density of states (DOS) of Ru (Fig. 7 (a)) has a pseudo-gap near the Fermi level ranging from -1.5 to 1 eV, similarly to the gap between the majority of the d-band and the Fermi level in gold (Fig. 7 (b)). As was pointed out in [38], for photon energies within this pseudo-gap area, the interband contribution to the optical transitions is weak, and at a qualitative level a temperature dependence of the reflectivity change in Ru may be explained via the Fermi smearing mechanism like in noble metals.
The Fermi smearing mechanism assumes that the reflectivity change is proportional to the change of Fermi distribution with increasing electron temperature, Eq. 4 [24, 25].
| (4) |
| (5) |
Here is the energy of incindent photons equal to 1.55 eV, is the difference between the energy level from which an electron is excited and the Fermi level of Ru, and are the elevated and the initial electron temperatures, respectively. In our case, is a priory unknown free parameter assumed to be constant for all temperatures, so has a meaning of an averaged energy level participating in optical transition.
The Fermi smearing mechanism works in the regime when the photon energy is close to the interband transition energy , which in the case of Ru we attribute to the lower boundary of the pseudo-gap. If we have fixed value and variable parameter , we can try to fit temperature-dependent reflectivity points by Eq. 4 with respect to . Then comparing the fitted value with the lower pseudo-gap boundary taken from Ru DOS will allow us to estimate to what extent the Fermi smearing is valid in Ru.
The -dependence of the peak reflectivity changes in Ru (Fig. 4) can be taken from the TTM model (Eq. 2) with given incident fluence. For every peak reflectivity point we got two temperature values: one is the temperature value at ps after the laser pulse as in the real experiment, and the other is the maximal temperature on a surface taken under assumption that the position of the peak reflectivity change corresponds to the maximal heating of the electronic system and not to the process of electron-lattice equilibration. The result of fitting for 37 nm Ru film is shown in Fig. 8.
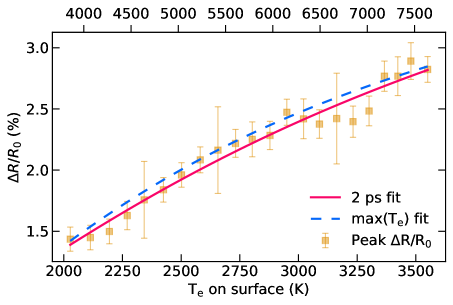
The fitted averaged energy level turned out to be for at 2 ps. This value is close to the expected -1.5 eV, and thus may indicate the validity of Fermi smearing explanation of the electron temperature dependence of Ru optical properties. For the max , the value is , which is quite far from the lower boundary of the pseudo-gap. This deviation might confirm our suggestion to attribute the peak reflectivity to the electron-lattice equilibration (reaching of maximal lattice temperature, see Fig. 3). Nevertheless, the applicability of Fermi smearing mechanism to Ru seems to be limited since the interband contribution to optical transitions is weak but non-vanishing. A more accurate quantitative explanation requires first-principles simulations of Ru in similar manner to [38] and will be provided in the future works.
4.3 Damage threshold in Ru
In this section, we investigated the thickness-dependent damage thresholds. Having the SEM images (similar to Fig. 6) for all of the samples, we were able to extract thickness-dependent data by attributing the onset of damage to surface cracking. To elaborate on the mechanism of damage we start our analysis with calculations of laser-induced melting threshold.
We provided the calculating of melting threshold in Ru irradiated by fs laser using two approaches. The first is a series of TTM simulations (section 4.1) for the different Ru thicknesses. The second is the two-temperature – molecular dynamics (TTM-MD) simulation for 75, 100 and 120 nm Ru films to stay far from the effects of multiple reflections in absorption profile. In both performed approaches, the melting threshold was determined as fluence at which a surface layer of becomes liquid. In TTM simulations a layer is considered to be liquid when its lattice temperature reaches required for complete melting of the layer, where is enthalpy of melting, and is heat capacity. In TTM-MD we trace a modified centrosymmetric parameter [41] averaged for atoms within the surface layer. It is known that the perfect hcp crystal has , whereas melting happens when drops below , which is assumed to be a threshold for disordered atom configurations in a liquid phase. The results of simulations and their comparison with SEM-thresholds are shown in Fig. 9.
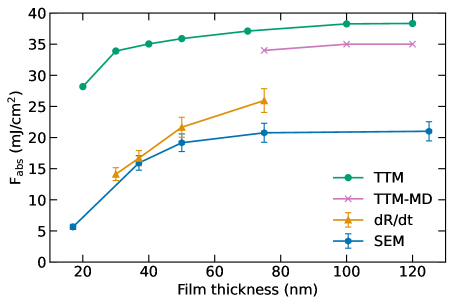
The discrepancy between threshold taken from SEM and fluences when pump-probe singal starts to increase indicate the pump-probe signal stays stable under minor surface changes such as cracks formation. Meanwhile, a factor two difference between experimentally determined threshold and theoretically predicted melting threshold most likely indicates that surface cracking occurs before melting and reduces threshold fluences below single-shot melting. The surface cracking can be caused by generation of heat-induced shear stresses in thin film. The critical shear stress may be estimated from TTM-MD calculation done for absorbed fluence equal to and is about 6-8 GPa in a surface layer. This amplitude may be attributed to the shear strength of ruthenium dioxide within a thin surface layer, which is comparable with the shear strengths of ceramics damaged by shock loading [42].
Albeit the theoretically predicted and experimentally observed thickness-dependent thresholds seem to attribute to different damaging mechanisms, the follow a common trend. Thresholds increase together with an increasing thickness of a film until some critical value around 75 nm after which they saturate. This critical thickness is associated with change of absorption from thin-film regime to bulk described by Lambert-Beer’s law.
Higher threshold values in the TTM than in the TTM-MD can be explained by the absence of the real surface in the TTM. The latent heat of fusion used in the TTM is taken for the bulk material, and thus does not reproduce the properties of the surface. In contrary, molecular dynamics natively takes into account the weaker bonding of surface atoms and thus describes the process of surface melting in a more natural way. It uses the EAM potential constructed specifically for Ru under intense ultrafast laser excitation [16]. The melting temperature predicted by this potential is 2787 K, which is 7 % higher than the experimental value being 2607 K. This leads to a few percent higher threshold values than one would expect from the experiment, but does not have a major impact on the obtained results.
5 Conclusion
We presented measurements of transient pump-probe thermoreflectance in Ru thin films as a function of incident fluence and Ru layer thickness in near-threshold regime. We applied rotational scheme to reduce heat accumulation in a target. An analysis of the measured thermoreflectance signal allowed us to extract information about behavior of hot electrons as well as the threshold of irreversible changes in Ru thin films.
The results of hot electrons analysis indicated similarity of electron system response to laser irradiation for noble metals with fully occupied d-bands and Ru with half-filled d-band. We attributed this result to the presence of a pseudo-gap in Ru DOS around the energy of incident photons. Inside this pseudo-gap, interband transitions are weak, and Ru response may be qualitatively described via Fermi smearing mechanism. A similar effect is expected for other metals with pseudo-gap in d-band (e.g. Cr, W) and may be a scope for a dedicated research.
We demonstrated occurrence of three well-separated stages of surface changes during ultrafast laser heating of Ru film: darkening of an irradiation line, surface cracking and grooves formation. Our ex-situ surface analysis associated appearance of the darkness with increasing oxidation or carbonization of the surface, however, we were unable to discriminate between the two possibilities.
We compared the cracks formation threshold to the two-temperature and molecular dynamics simulations of the melting threshold. We found that the crack formation threshold is two times lower than theoretical predictions for single-shot melting threshold. This led us to the conclusion that the basic mechanism of cracking is formation of heat-induced stresses on a thin film surface. Our results may serve as the upper limit of operational conditions for optic devices based on Ru thin films.
6 Acknowledgements
FA is grateful to H. van der Velde for fruitful discussions and technical assistance. AK and SS are grateful to C. Berkhout and A. Toonen for technical support. FA, IMi, JS, IMa and MA acknowledge the Industrial Partnership Program ‘X-tools’, project number 741.018.301, funded by the Netherlands Organization for Scientific Research, ASML, Carl Zeiss SMT, and Malvern Panalytical.
For XTANT calculations, computational resources were supplied by the project ”e-Infrastruktura CZ” (e-INFRA LM2018140) provided within the program Projects of Large Research, Development and Innovations Infra-structures. NM gratefully acknowledges financial support from the Czech Ministry of Education, Youth and Sports (Grants No. LM2018114, LTT17015 and No. EF16_013/0001552).
Appendix A Two-temperature parametrization of Ru
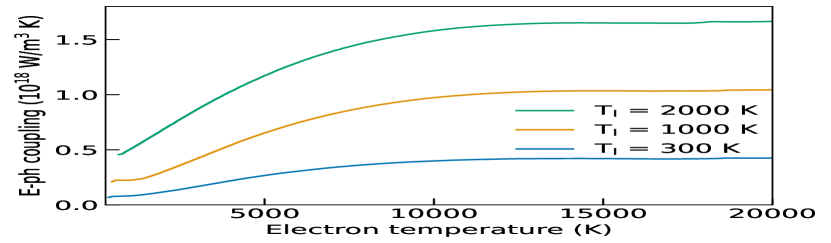
For electron-phonon coupling factor in Ru, we used parametrization provided by XTANT calculations [43] based on the nonadiabatic tight-binding molecular dynamics approach. In such a scheme, electron-phonon coupling depends on the electron and lattice temperatures and (as well as atomic structure and density). As has been shown in [43], the dependence on is approximately linear until exceeds some value . In the case of Ru, the dependence is illustrated in Fig. A.1 (a) and may be parametrized as follows:
| (A.1) |
Here is the lattice temperature at normal conditions (room temperature).
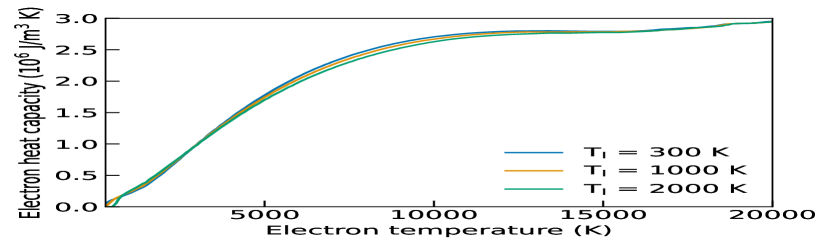
Electron heat capacity was also extracted from XTANT simulations, see Fig. A.1 (b). It demonstrated independence of the lattice temperature, at least below the melting point. The electron thermal conductivity was taken from ab initio calculations [39], and that is the most accurate data available to the best of our knowledge.
Appendix B Periodic features on pump-probe reflectivtiy curves
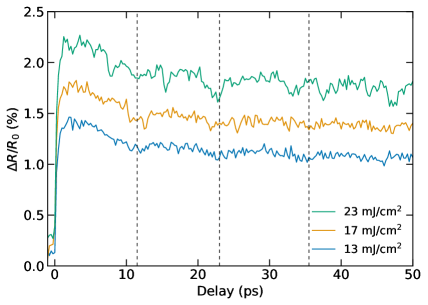
Fluence-dependent curves exhibit oscillations especially pronounced at low fluences where signal is less noisy, approximately indicated with dashed lines in Fig. B.1. Such a behavior of pump-probe reflectivity was previously reported in other works, e.g. [44, 45], and is caused by a stress wave generated upon ultrafast heating with a laser pulse. The wave travels back and forth in Ru reflecting at the interfaces with air and Si and partially transmitting into Si (see Fig. 4 in [16] as an example of stress wave dynamics in Ru). The amplitude of such a wave is decreasing after each transmission into Si due to the difference in acoustic impedance between Ru and Si, which is confirmed with disappearance of dips after a few travels. Each time the pressure wave comes to a front surface, it changes the temperature and density of Ru, hence transiently changing the measured reflectivity. The period can be expressed as a ratio of the distance that the stress wave travels (two film thicknesses) and a speed of sound in Ru. Therefore, a speed of sound can be estimated from the measured periods. For 37 nm thick film period is , and the corresponding estimation of the speed of sound value is , what is close to the reported value 5970 m/s [46].
References
- [1] J. Bonse, J. Krüger, S. Höhm, and A. Rosenfeld. Femtosecond laser-induced periodic surface structures. Journal of Laser Applications, 24(4):042006, 9 2012.
- [2] Makoto Murakami, Bing Liu, Zhendong Hu, Zhenlin Liu, Yuzuru Uehara, and Yong Che. Burst-mode femtosecond pulsed laser deposition for control of thin film morphology and material ablation. Applied Physics Express, 2(4):0425011–0425013, 2009.
- [3] Weina Han, Lan Jiang, Xiaowei Li, Qingsong Wang, Shaojun Wang, Jie Hu, and Yongfeng Lu. Controllable Plasmonic Nanostructures induced by Dual-wavelength Femtosecond Laser Irradiation. Scientific Reports, 7(1):1–11, 2017.
- [4] Dongshi Zhang, Bilal Gökce, and Stephan Barcikowski. Laser Synthesis and Processing of Colloids: Fundamentals and Applications. Chemical Reviews, 117(5):3990–4103, 2017.
- [5] Qiusong Yang, Zhilong Cai, Yang Wang, Huan Huang, and Yiqun Wu. Controllable crystallization of Ge2Sb2Te5 phase-change memory thin films driven by multiple femtosecond laser pulses. Materials Science and Engineering B: Solid-State Materials for Advanced Technology, 193(C):189–197, 2015.
- [6] Stephen Edward, Hao Zhang, Stefan Witte, and Paul C. M. Planken. Laser-induced ultrasonics for detection of low-amplitude grating through metal layers with finite roughness. Optics Express, 28(16):23374, 2020.
- [7] Lijie Zhao, Chunbo Zhao, Chuanqing Xia, Zhen Zhang, Tengfei Wu, and Haiyun Xia. Nanometer Precision Time-Stretch Femtosecond Laser Metrology Using Phase Delay Retrieval. Journal of Lightwave Technology, 39(15):5156–5162, 2021.
- [8] Jeong Seok Oh and Seung-Woo Kim. Femtosecond laser pulses for surface-profile metrology. Optics Letters, 30(19):2650, 2005.
- [9] Herbert Over. Surface chemistry of ruthenium dioxide in heterogeneous catalysis and electrocatalysis: From fundamental to applied research. Chemical Reviews, 112(6):3356–3426, 2012.
- [10] D. W. Goodman, C. H.F. Peden, and M. S. Chen. CO oxidation on ruthenium: The nature of the active catalytic surface. Surface Science, 601(19):18–20, 2007.
- [11] M. Rosa Axet and Karine Philippot. Catalysis with Colloidal Ruthenium Nanoparticles. Chemical Reviews, 120(2):1085–1145, 2020.
- [12] Saša Bajt, N. V. Edwards, and Theodore E. Madey. Properties of ultrathin films appropriate for optics capping layers exposed to high energy photon irradiation. Surface Science Reports, 63(2):73–99, 2008.
- [13] A. Aquila, R. Sobierajski, C. Ozkan, V. Hájková, T. Burian, J. Chalupský, L. Juha, M. Störmer, S. Bajt, M. T. Klepka, P. Dłużewski, K. Morawiec, H. Ohashi, T. Koyama, K. Tono, Y. Inubushi, M. Yabashi, H. Sinn, T. Tschentscher, a. P. Mancuso, and J. Gaudin. Fluence thresholds for grazing incidence hard x-ray mirrors. Applied Physics Letters, 106(24):241905, 6 2015.
- [14] Igor Milov, Igor A Makhotkin, Ryszard Sobierajski, Nikita Medvedev, Vladimir Lipp, Jaromir Chalupský, Jacobus M Sturm, Kai Tiedtke, Gosse de Vries, Michael Störmer, Frank Siewert, Robbert van de Kruijs, Eric Louis, Iwanna Jacyna, Marek Jurek, Libor Juha, Věra Hájková, Vojtěch Vozda, Tomáš Burian, Karel Saksl, Bart Faatz, Barbara Keitel, Elke Plönjes, Siegfried Schreiber, Sven Toleikis, Rolf Loch, Martin Hermann, Sebastian Strobel, Han-Kwang Nienhuys, Grzegorz Gwalt, Tobias Mey, Hartmut Enkisch, and Fred Bijkerk. Mechanism of single-shot damage of Ru thin films irradiated by femtosecond extreme UV free-electron laser. Optics Express, 26(15):19665, 7 2018.
- [15] I. Milov, V. Lipp, D. Ilnitsky, N. Medvedev, K. Migdal, V. Zhakhovsky, V. Khokhlov, Yu. Petrov, N. Inogamov, S. Semin, A. Kimel, B. Ziaja, I.A. Makhotkin, E. Louis, and F. Bijkerk. Similarity in ruthenium damage induced by photons with different energies: From vis1. I. Milov, V. Lipp, D. Ilnitsky, N. Medvedev, K. Migdal, V. Zhakhovsky, V. Khokhlov, Y. Petrov, N. Inogamov, S. Semin, A. Kimel, B. Ziaja, I. A. Makhotkin, E. Louis, and . Applied Surface Science, 501(October 2019):143973, 1 2020.
- [16] I. Milov, V. Zhakhovsky, D. Ilnitsky, K. Migdal, V. Khokhlov, Yu Petrov, N. Inogamov, V. Lipp, N. Medvedev, B. Ziaja, V. Medvedev, I. A. Makhotkin, E. Louis, and F. Bijkerk. Two-level ablation and damage morphology of Ru films under femtosecond extreme UV irradiation. Applied Surface Science, 528(February):146952, 2020.
- [17] Igor A. Makhotkin, Igor Milov, Jaromir Chalupský, Kai Tiedtke, Hartmut Enkisch, Gosse de Vries, Frank Scholze, Frank Siewert, Jacobus M. Sturm, Konstantin V. Nikolaev, Robbert W. E. van de Kruijs, Mark A. Smithers, Henk A. G. M. van Wolferen, Enrico G. Keim, Eric Louis, Iwanna Jacyna, Marek Jurek, Dorota Klinger, Jerzy B. Pelka, Libor Juha, Věra Hájková, Vojtěch Vozda, Tomáš Burian, Karel Saksl, Bart Faatz, Barbara Keitel, Elke Plönjes, Siegfried Schreiber, Sven Toleikis, Rolf Loch, Martin Hermann, Sebastian Strobel, Rilpho Donker, Tobias Mey, and Ryszard Sobierajski. Damage accumulation in thin ruthenium films induced by repetitive exposure to femtosecond XUV pulses below the single-shot ablation threshold. Journal of the Optical Society of America B, 35(11):2799, 2018.
- [18] Igor A. Makhotkin, Ryszard Sobierajski, Jaromir Chalupský, Kai Tiedtke, Gosse de Vries, Michael Störmer, Frank Scholze, Frank Siewert, Robbert W. E. van de Kruijs, Igor Milov, Eric Louis, Iwanna Jacyna, Marek Jurek, Dorota Klinger, Laurent Nittler, Yevgen Syryanyy, Libor Juha, Věra Hájková, Vojtěch Vozda, Tomáš Burian, Karel Saksl, Bart Faatz, Barbara Keitel, Elke Plönjes, Siegfried Schreiber, Sven Toleikis, Rolf Loch, Martin Hermann, Sebastian Strobel, Han-Kwang Nienhuys, Grzegorz Gwalt, Tobias Mey, and Hartmut Enkisch. Experimental study of EUV mirror radiation damage resistance under long-term free-electron laser exposures below the single-shot damage threshold. Journal of Synchrotron Radiation, 25(1):77–84, 1 2018.
- [19] W. S. Fann, R. Storz, H. W.K. Tom, and J. Bokor. Electron thermalization in gold. Physical Review B, 46(20):13592–13595, 1992.
- [20] C. K. Sun, F. Vallée, L. H. Acioli, E. P. Ippen, and J. G. Fujimoto. Femtosecond-tunable measurement of electron thermalization in gold. Physical Review B, 50(20):15337–15348, 1994.
- [21] S.-S. Wellershoff, J Hohlfeld, J. Gudde, and E Matthias. The role of electron-phonon coupling in femtosecond laser damage of metals. Applied Physics A Materials Science & Processing, 69(1):S99–S107, 12 1999.
- [22] B. Rethfeld, K. Sokolowski-Tinten, D. Von Der Linde, and S. I. Anisimov. Timescales in the response of materials to femtosecond laser excitation. Applied Physics A: Materials Science and Processing, 79(4-6):767–769, 2004.
- [23] Baerbel Rethfeld, Dmitriy S. Ivanov, Martin E. Garcia, and Sergei I. Anisimov. Modelling ultrafast laser ablation. Journal of Physics D: Applied Physics, 50(19), 2017.
- [24] W Lynch and R Rosei. Thermomodulation Spectra of Al, Au, and Cu. Physical Review B, 5(10):3883–3894, 1972.
- [25] R. W. Schoenlein, W. Z. Lin, J. G. Fujimoto, and G. L. Eesley. Femtosecond studies of nonequilibrium electronic processes in metals. Physical Review Letters, 58(16):1680–1683, 1987.
- [26] G de Haan, J Hernandez-Rueda, and P C M Planken. Femtosecond time-resolved pump-probe measurements on percolating gold in the ablation regime. Optics Express, 28(8):12093, 4 2020.
- [27] O. Gunnarsson, P. Gies, W. Hanke, and O. K. Andersen. Ab initio method for calculating response functions in transition metals. Physical Review B, 40(18):12140–12146, 1989.
- [28] I. G. Gurtubay, J. M. Pitarke, Wei Ku, A. G. Eguiluz, B. C. Larson, J. Tischler, P. Zschack, and K. D. Finkelstein. Electron-hole and plasmon excitations in 3d transition metals: Ab initio calculations and inelastic x-ray scattering measurements. Physical Review B - Condensed Matter and Materials Physics, 72(12):1–11, 2005.
- [29] Claudia Ambrosch-Draxl and Jorge O. Sofo. Linear optical properties of solids within the full-potential linearized augmented planewave method. Computer Physics Communications, 175(1):1–14, 7 2006.
- [30] Marco Cazzaniga, Lucia Caramella, Nicola Manini, and Giovanni Onida. Ab initio intraband contributions to the optical properties of metals. Physical Review B - Condensed Matter and Materials Physics, 82(3):1–7, 2010.
- [31] J Hohlfeld, S-S Wellershoff, J Güdde, U Conrad, V Jähnke, and E Matthias. Electron and lattice dynamics following optical excitation of metals. Chemical Physics, 251(1-3):237–258, 2000.
- [32] Rick Chartrand. Numerical Differentiation of Noisy, Nonsmooth Data. ISRN Applied Mathematics, 2011:1–11, 2011.
- [33] UDCM-Group. AbsorptionTMM, 2019.
- [34] S.I. Anisimov, B.L. Kapeliovich, and T.L. Perel-man. Electron emission from metal surfaces exposed to ultrashort laser pulses. Journal of Experimental and Theoretical Physics, 1974.
- [35] S. P. Zhvavyi and G. D. Ivlev. Influence of the Initial Temperature of Silicon on Crystallization of a Layer Melted by Nanosecond Laser Heating. Journal of Engineering Physics and Thermophysics, 69(5):790–793, 1997.
- [36] N. M. Bulgakova, R. Stoian, A. Rosenfeld, I. V. Hertel, W. Marine, and E. E.B. Campbell. A general continuum approach to describe fast electronic transport in pulsed laser irradiated materials: The problem of Coulomb explosion. Applied Physics A: Materials Science and Processing, 81(2):345–356, 2005.
- [37] Pamela M. Norris, Andrew P. Caffrey, Robert J. Stevens, J. Michael Klopf, James T. McLeskey, and Andrew N. Smith. Femtosecond pump-probe nondestructive examination of materials (invited). Review of Scientific Instruments, 74(1 II):400–406, 2003.
- [38] E. Bévillon, R. Stoian, and J. P. Colombier. Nonequilibrium optical properties of transition metals upon ultrafast electron heating. Journal of Physics Condensed Matter, 30(38), 2018.
- [39] Yu Petrov, K. Migdal, N. Inogamov, V. Khokhlov, D. Ilnitsky, I. Milov, N. Medvedev, V. Lipp, and V. Zhakhovsky. Ruthenium under ultrafast laser excitation: Model and dataset for equation of state, conductivity, and electron-ion coupling. Data in Brief, 28:104980, 2 2020.
- [40] A. Blumenstein, E. S. Zijlstra, D. S. Ivanov, S. T. Weber, T. Zier, F. Kleinwort, B. Rethfeld, J. Ihlemann, P. Simon, and M. E. Garcia. Transient optics of gold during laser irradiation: From first principles to experiment. Physical Review B, 101(16):1–9, 2020.
- [41] Semen Murzov, Sergey Ashitkov, Evgenia Struleva, Pavel Komarov, Vasily Zhakhovsky, Victor Khokhlov, and Nail Inogamov. Elastoplastic and polymorphic transformations of iron at ultra-high strain rates in laser-driven shock waves. Journal of Applied Physics, 130(24), 2021.
- [42] S Yu. Grigoryev, S A Dyachkov, A N Parshikov, and V V Zhakhovsky. Failure model with phase transition for ceramics under shock loading. Journal of Applied Physics, 131(12):125106, 2022.
- [43] N Medvedev and I. Milov. Electron-phonon coupling in metals at high electronic temperatures. Physical Review B, 102(6):064302, 8 2020.
- [44] G. Tas, R. J. Stoner, H. J. Maris, G. W. Rubloff, G. S. Oehrlein, and J. M. Halbout. Noninvasive picosecond ultrasonic detection of ultrathin interfacial layers: CFx at the Al/Si interface. Applied Physics Letters, 61(15):1787–1789, 1992.
- [45] H. N. Lin, H. J. Maris, L. B. Freund, K. Y. Lee, H. Luhn, and D. P. Kern. Study of vibrational modes of gold nanostructures by picosecond ultrasonics. Journal of Applied Physics, 73(1):37–45, 1993.
- [46] G V Samsonov. Handbook of the Physicochemical Properties of the Elements. Springer US, 2012.