Phase Separating Electrode Materials – Chemical Inductors?
We discover presence of chemical inductive effects in phase separating ion intercalation energy storage materials, specifically in lithium iron phosphate (LFP) and also lithium titanate oxide (LTO). These materials features fast (de)intercalation and slow diffusion relaxation phenomena which are prerequisites for observing such inductive effects. Presented finding is supported by the mechanistic model and analytical reasoning indicating that all equilibrium states that lay inside the miscibility gap of the phase separating material exhibit strong inductive response in the low frequency part of spectrum. We also explain why such inductive effects are not observed outside the miscibility gap. This letter presents the first mechanistic reasoning of previously reported electrode level experimental observation of inductance during impedance measurements at low currents.
![[Uncaptioned image]](/html/2206.08089/assets/GraphicalAbstrac.png)
Electrochemical impedance spectroscopy (EIS) is a powerful yet simple non-destructive experimental method that offers profound insight in the dynamic properties of studied system. It is widely used in the fields of chemistry, biology and material science [1, 2, 3]. Accurate and precise physical model of the investigated system is crucial to utilize full potential of interpreting EIS spectra [4, 5]. Without credible underlying models, interpretation of EIS spectrum can be questionable, especially when interpreting or discovering unconventional features in the spectrum.
Recently several inspiring articles reported a strong inductive response of different systems at very low frequencies (in the range of mHz), refereed to as ”low frequency inductive loop” or ”low frequency hook” [6]. Reproducibility of these results for many different systems show that this is not a measuring artefact but rather an indication of general phenomena met in several different systems [6]. Due to the lack of the underlying accurate physical models, interpretation of underlying processes remained challenging.
Among several other systems, inductive effect was also measured in the low frequency part of spectrum also in lithium iron phosphate (LFP), intercalation cathode material for Li-ion batteries [7]. Due to the lack of plausible explanation of this measurement the published result was not given a significant attention. Inductive behaviour was later reported again on specific lithium - ion intercalation electrodes [8, 9]. However, article [8] clearly reasons that presented inductive and negative capacitance loop in Swagelok type cells originates from springs, reference electrodes, drift, and corrosion, which are fundamentally different processes compared to inductive effects in ion intercalation energy storage materials.
Klotz et al [6] reviewed published experiments that observed inductive effects in low frequency part of EIS spectrum, summarizing two possible explanations that were prior given by [10, 11] and proposed a plausible empirical equivalent circuit model. Very recently it was proposed [12] that chemical behaviour can also induce inductive effect if a system couples a fast conduction mode and a slowing down element. Based on this finding, authors of [12] provide a generalised description of a generic system that exhibits chemical capacitance in a low frequency part of spectra. They coined the term ”chemical inductor” and provided a basic mathematical formulation, requiring interaction of fast and slow phenomena, representing a necessary condition for a system to be a chemical inductor. Two articles following, by these authors, linked previously measured possible chemical inductive behaviours to the mathematical formulation presented in [12] for halide perovskite memristors [13], FitzHugh–Nagumo neuron, the Koper–Sluyters electrocatalytic system, and potentiostatic oscillations of a semiconductor device [14].
In this letter, we present a fundamental discovery on existence of chemical inductive effects in phase separating ion intercalation energy storage materials. In addition, we provide, for the first time, analytical reasoning and mechanistic model elucidating the entire causal chain from material specific properties of phase separating materials to its inductive effects. With this systematic analysis we reveal that phase separating energy storage materials exhibit significant inductive properties in the low frequency part of spectrum for all states within the miscibility gap. Specifically, inductive properties are demonstrated on the lithium iron phosphate (LFP) material, which is the only intercalation material where chemical induction was experimentally observed on the electrode level during impedance measurements at low currents [7], whereas simulation results of lithium titanate Oxide (LTO) are also presented in Supplementary Information section S3 to demonstrate generality of the discovered phenomena.
In addition to simulated results, we also provide analytical reasoning, why coupling slow phase boundary stabilization diffusion process, modelled by Cahn-Hilliard equation [15, 16], and fast destabilizing (de)intercalation, modelled by Butler-Volmer equation, e.g., [17], fulfill condition for a system to be a chemical inductor, when using parameters usually encountered in phase separating energy storage materials. Presented findings not only explain experimentally observed inductive behaviour of LFP in low frequency part of spectrum [7] but also answer a long standing fundamental question first asked by Srinivasan and Newman [18]: ”What is an impedance of phase separating electrode material inside miscibility gap?”
For the simulation of the spectra presented in this letter, a phase field model of phase separation (spinodal decomposition) [15, 16] was chosen, that is widely applied and validated and accepted by society as accurate [19, 20, 21, 22, 23]. Both materials were simulated by a widely utilized coupled Cahn-Hilliard equations [15, 16], to model intra-particle diffusion, and Butler-Volmer equation, e.g., [17], to model (de)intercalation process solved in two dimensions. Results clearly reveal that only intermediate lithiation levels - inside miscibility gap - exhibit chemical induction characteristics. This is analytically and numerically supported by the fact that two competing processes with significantly different characteristic times are present in the system - fast destabilizing (de)intercalation and slow phase boundary stabilization diffusion process.
Key governing equations of the model are summarized below, while detailed description is given in Supplementary material section S1. Spatial and temporal intra-particle fields of Li concentration and chemical potential are modelled with an established phase field approach [19, 20, 21, 22, 23] consisting of coupled equations 1 to 7. This is realized by coupling the Cahn-Hilliard equation (eq. 1) [15], equation for modelling chemical potential (eq. 2) [16] incorporating terms for regular solution entropy and mixing enthalpy, phase field gradient penalty and strain energy, and appropriate boundary conditions (equations 3, 4 and 5)
| (1) |
| (2) |
System of equations 1 and 2 was solved on the two dimensional domain, since diffusion in LFP is much faster along (010) crystallographic direction compared to other directions. This approach is consistent with published articles [19, 21], while selection of model dimensionality does not limit generality of reported findings.
Dimensionality of the model, also influences formulation of boundary conditions. Consequently, (de)intercalation process of lithium across the particle faces perpendicular to (010) crystallographic direction, i.e., source term in equation 1, was described using Butler-Volmer flux, driven by potential difference () between the LFP material and the surrounding electrolyte
| (3) |
In the directions perpendicular to the (010) crystalographic direction, periodic boundary conditions were used.
| (4) |
| (5) |
To derive a credible model for modeling EIS, double layer effects need to be considered in addition to (de)intercalation processes. Therefore, in addition to (de)intercalation flux (source term in equation 1) also contribution of a flux into (out of) the double layer is considered. This is realized via the equation proposed and elaborated in references [24, 25]
| (6) |
where denotes the double layer capacitance per surface area.
Consequently, a total flux of Li and thus also electrons equals
| (7) |
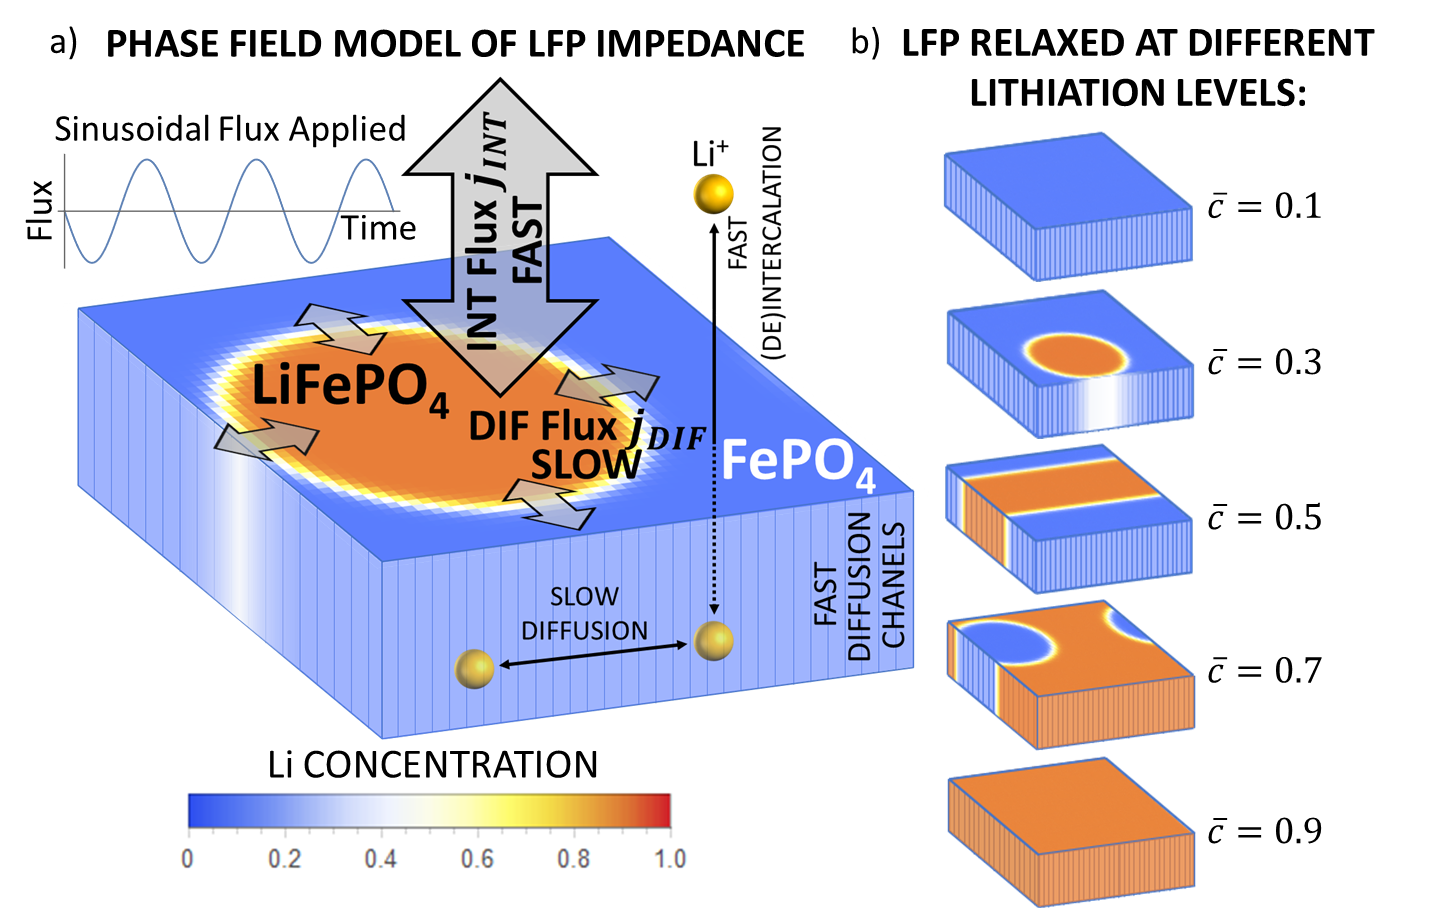
Simulations were performed, consistent with experimental EIS procedure, by applying periodic sinusoidal flux () with low amplitude to the relaxed LFP structures and solved on two dimensional domain as presented in Figure 1.
Impedance of the system was calculated as the ratio of potential difference response of the system () and imposed electric current corresponding to applied flux as
| (8) |
All the symbols used in equations are listed in Table 1.
| Symbol | Units | Physical Significance |
|---|---|---|
| m2 | computational domain area | |
| - | charge transfer coefficient | |
| Pa | strain coefficient | |
| mol/m3 | molar concentration of lithium | |
| mol/m3 | average molar concentration of lithium | |
| F/m2 | double layer specific capacitance | |
| mol/m3 | maximal molar concentration of lithium in LFP | |
| m2/s | diffusivity tensor | |
| m | domain thickness | |
| As/mol | Faraday constant | |
| V | potential difference between LFP and electrolyte | |
| mol/m2s | Butler-Volmer exchange flux density | |
| mol/m2s | diffusion flux density | |
| mol/m2s | (de)intercalation flux density | |
| mol/m2s | double layer flux density | |
| J/m | gradient penalty parameter | |
| m | domain size | |
| J/mol | chemical potential | |
| m | position vector | |
| J/mol K | gas constant | |
| mol/m3s | source term | |
| s | time | |
| K | temperature | |
| impedance | ||
| J/mol | regular solution parameter |
Impedance spectra of the LFP active material were simulated in the frequency interval from to , for nine different lithiation levels of LFP material. These lithiation levels were selected in a way to yield concentrations inside and outside of the miscibility gap.
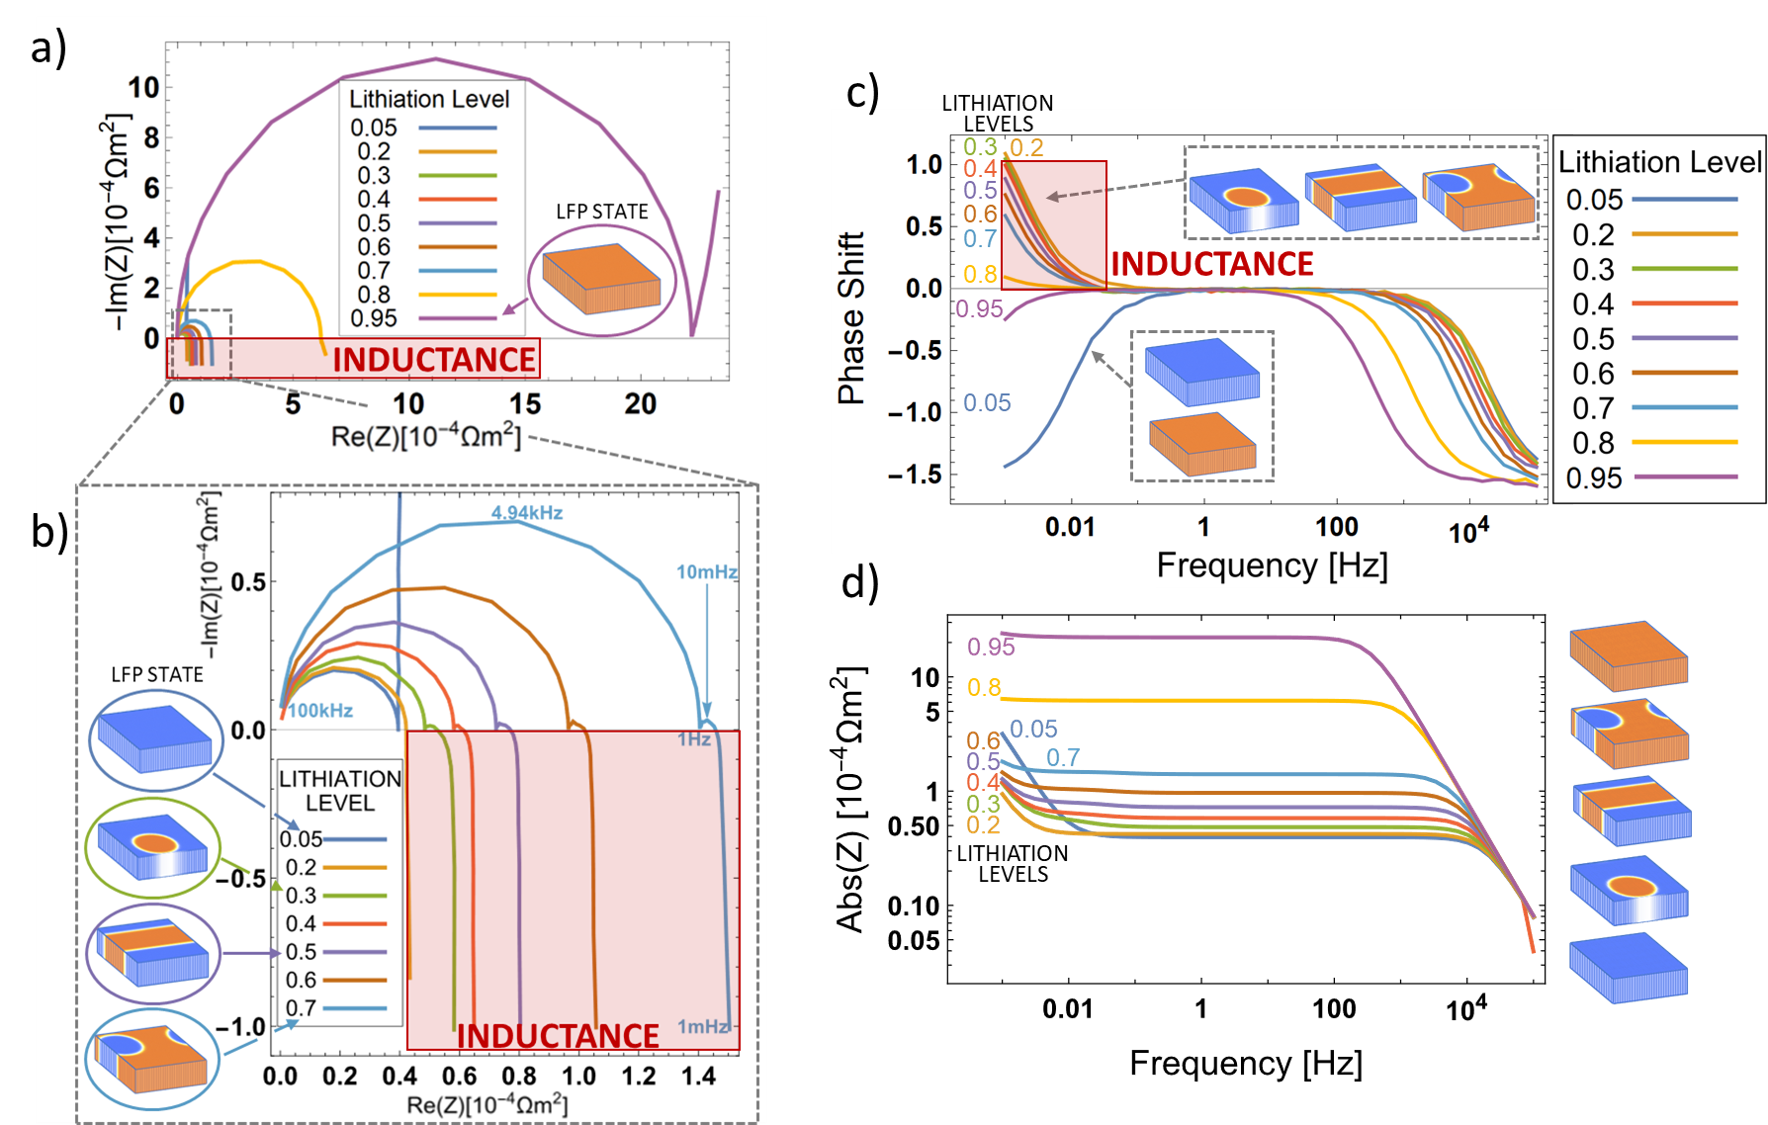
Results of EIS are presented in Figure 2. Figure clearly reveals expected capacitive arcs in the high frequency part of the spectra. These capacitive arcs are a consequence of the double layer response. At the low frequency part of spectra, strong inductive effects are seen in simulation result for all lithiation levels inside the miscibility gap, while the two lithiation levels outside the miscibility gap, i.e., 0.05 and 0.95, do not feature inductive effects.
According to [12] the necessary condition for the system to exhibit chemical induction are two competing processes: fast destabilizing and slow stabilizing process. In the case of phase separation in intercalation electrode, these two processes correspond to fast destabilizing (de)intercalation and slow phase boundary stabilization diffusion process, where phase boundary is established due to uphill diffusion, which is in the present case modelled with the Cahn-Hilliard equation 1. The influence of both described processes on the system impedance can be seen from expression defining total current in to the domain, obtained by reformulating the total flux equation 7 and written in the limit of small harmonic perturbation as:
| (9) |
where symbol over the variable denotes the small perturbation (detailed derivation is provided in Supplementary material S2). First term on the right-hand side of the equation 9 arises from double layer equation 6 and the second and the third terms are linearised and integrated (de)intercalation flux from equation 3. These two terms describe the fast, destabilising process in the system with a characteristic time of few milliseconds. Slow stabilizing process with the characteristic time of few seconds is described with the last term on the right hand side of the equation 9, defined with integral of chemical potential which adapts with the long characteristic time of phase boundary stabilization diffusion process. The time dependence of this term and corresponding slow dynamics can be seen from reformulated form of equation 1, which provides the integro-differential equation defining the chemical potential surface integral from equation 9. Integration of the equation 1 together with Leibniz integral rule and taking into account that and gives
| (10) |
Equation 10 provides key insight into observing inductive effects due to the interaction between both competing processes. Terms with the chemical potential gradient () describe phase boundary stabilization diffusion and the source term describes (de)intercalation. When LFP material is relaxed inside miscibility gap (presented cases for lithiation levels from 0.2 to 0.8 in Figure 1 b)) it phase separates. Application of external flux to the phase separated LFP state, result in (de)intercalation source term that is not constant across the whole domain but rather governed by in-homogeneous concentration field. This produces chemical potential gradients in the system and slow diffusion of lithium across the domain that stabilizes phase boundaries follows as a direct consequence of fast destabilizing (de)intercalation process. These processes explain the occurrence of inductive effect in the low part of spectrum for LFP inside miscibility gap. This observation can also be confirmed by the fact that system of equations 9 and 10 satisfy mathematical condition for chemical inductor postulated in [12] for lithiation levels within the miscibility gap.
Outside miscibility gap (cases for lithiation level 0.05 and 0.95 in Figure 1 b)) chemical potential and concentration fields are homogeneous in the relaxed state, since the system is in the solid solution state (Figure 3). Consequently, applied (de)intercalation flux is (nearly fully) homogeneous, preserving gradient-free chemical potential and, hence, yielding no redistribution of lithium in the domain. Therefore, no stabilising slow diffusion process accompany fast (de)intercalation in this regime. Consequently, the two terms with chemical potential gradient () in equation 10 limit towards zero. System of equations 9 and 10 transforms in such a manner that they do not satisfy the condition for the chemical inductor [12], which is also fully consistent with simulated results 2.
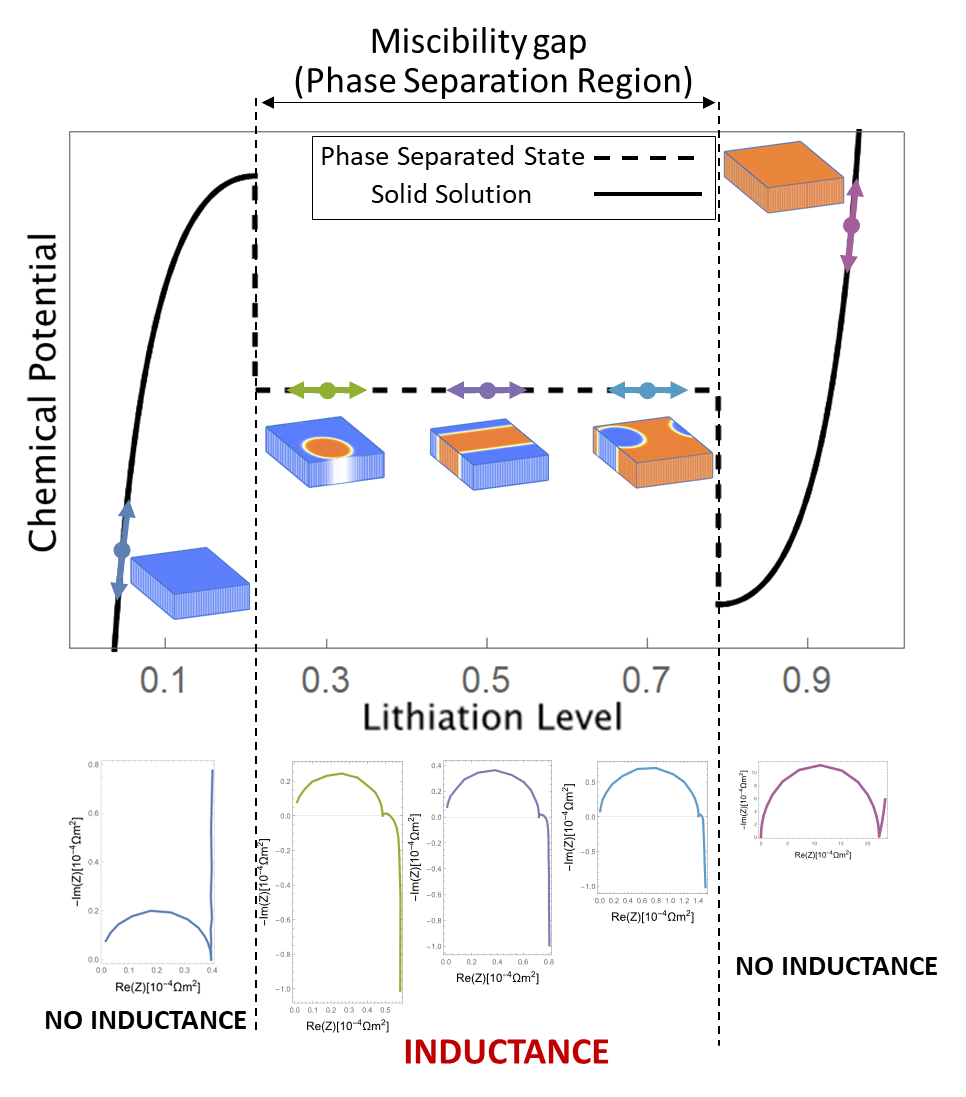
Presented results and analytic derivations clearly indicate that phase separating nature of the LFP is of the crucial importance for its behaviour as the chemical inductor. The reason for chemical induction to exist in such a system namely arises from a significant difference between the characteristic times for fast lithium (de)intercalation and slow in-plane diffusion that stabilizes phase boundaries. In a similar system without phase separation, no slow stabilizing diffusion process would take place during EIS analysis, which removes the long relaxation time scale of the system, as presented in Figure 2. Figure 2 thus clearly shows that for the case of lithiation levels outside miscibility gap (lithiation levels 0.05 and 0.95) the system exhibits capacitive nature at low frequencies instead of inductive nature due to absence of phase separation.
Similar inductive behaviour, as disclosed for the LFP material, can be anticipated also in other electrode materials with phase separation that are characterized by fast destabilizing (de)intercalation and slow phase boundary stabilizing diffusion relaxation (e.g. LiMnPO4 [29], NaFePO4 [30], Li4Ti5O (LTO) [31]). In the Supplementary Information section S3 inductor behaviour of such materials and thus generality of the observed phenomena is demonstrated also for the LTO, which confirms that phase separation is a key phenomenon to observe inductor behaviour. Electrode materials that undergo structural phase transitions during (de)lithiation (e.g. NMC and NCA [32]) do namely not feature inductor effects. Crystal structure phase transitions, which do not result in a separation to Li-poor and Li-rich domains, do not represent a necessary condition for material to be chemical inductor as discussed above, as slow diffusion relaxation associated with movement of the phase boundary is not present.
This letter for the first time associates and reasons interrelation between necessary condition to exhibit inductive phenomena [12] and real processes in energy storage materials establishing a causal interrelation between material specific properties and inductive effects. Thereby, it solves long lasting challenge about the impedance of phase separating materials inside miscibility gap [18]. Results presented in this letter show that impedance response of a single phase separating particle exhibits inductive effect inside miscibility gap which is the first mechanistic reasoning of previously reported electrode level experimental observation [7] during impedance measurements at low currents.
References
- [1] Byoung-Yong Chang and Su-Moon Park. Electrochemical impedance spectroscopy. Annual Review of Analytical Chemistry, 3:207–229, 2010.
- [2] Mark E Orazem and Bernard Tribollet. Electrochemical impedance spectroscopy. New Jersey, pages 383–389, 2008.
- [3] Andrzej Lasia. Electrochemical impedance spectroscopy and its applications. In Modern aspects of electrochemistry, pages 143–248. Springer, 2002.
- [4] Miran Gaberšček. Understanding li-based battery materials via electrochemical impedance spectroscopy. Nature Communications, 12(1):1–4, 2021.
- [5] Francesco Ciucci. Modeling electrochemical impedance spectroscopy. Current Opinion in Electrochemistry, 13:132–139, 2019.
- [6] Dino Klotz. Negative capacitance or inductive loop?–a general assessment of a common low frequency impedance feature. Electrochemistry Communications, 98:58–62, 2019.
- [7] Miran Gaberscek, Robert Dominko, and Janez Jamnik. The meaning of impedance measurements of lifepo4 cathodes: A linearity study. Journal of Power Sources, 174(2):944–948, 2007.
- [8] Harald Brandstätter, Ilie Hanzu, and Martin Wilkening. Myth and reality about the origin of inductive loops in impedance spectra of lithium-ion electrodes—a critical experimental approach. Electrochimica acta, 207:218–223, 2016.
- [9] QUANCHAO Zhuang, T Wei, GUOZHEN Wei, QUANFENG Dong, and SHIGANG Sun. Electrochemical impedance spectroscopic studies of insertion and deinsertion of lithium ion in spinel limn2o4. Acta Chim Sinica, 67:2184–2192, 2009.
- [10] Juan Bisquert, Germà Garcia-Belmonte, Ángeles Pitarch, and Henk J Bolink. Negative capacitance caused by electron injection through interfacial states in organic light-emitting diodes. Chemical Physics Letters, 422(1-3):184–191, 2006.
- [11] S Taibl, G Fafilek, and J Fleig. Impedance spectra of fe-doped srtio 3 thin films upon bias voltage: inductive loops as a trace of ion motion. Nanoscale, 8(29):13954–13966, 2016.
- [12] Juan Bisquert and Antonio Guerrero. Chemical inductor. Journal of the American Chemical Society, 2022.
- [13] Mariana Berruet, José Carlos Pérez-Martínez, Beatriz Romero, Cedric Gonzales, Abdullah M Al-Mayouf, Antonio Guerrero, and Juan Bisquert. Physical model for the current–voltage hysteresis and impedance of halide perovskite memristors. ACS Energy Letters, 7(3):1214–1222, 2022.
- [14] Juan Bisquert. Hopf bifurcations in electrochemical, neuronal, and semiconductor systems analysis by impedance spectroscopy. Applied Physics Reviews, 9(1):011318, 2022.
- [15] John W Cahn. On spinodal decomposition. Acta metallurgica, 9(9):795–801, 1961.
- [16] John W Cahn and John E Hilliard. Free energy of a nonuniform system. i. interfacial free energy. The Journal of chemical physics, 28(2):258–267, 1958.
- [17] John Newman and Karen E Thomas-Alyea. Electrochemical systems. John Wiley & Sons, 2012.
- [18] Venkat Srinivasan and John Newman. Existence of path-dependence in the lifepo4 electrode. Electrochemical and solid-state letters, 9(3):A110, 2006.
- [19] Peng Bai, Daniel A Cogswell, and Martin Z Bazant. Suppression of phase separation in lifepo4 nanoparticles during battery discharge. Nano letters, 11(11):4890–4896, 2011.
- [20] Martin Z Bazant. Phase-field theory of ion intercalation kinetics. arXiv preprint arXiv:1208.1587, 2012.
- [21] Klemen Zelič and Tomaž Katrašnik. Thermodynamically consistent derivation of chemical potential of a battery solid particle from the regular solution theory applied to lifepo4. Scientific reports, 9(1):1–13, 2019.
- [22] Michael Fleck, Holger Federmann, and Evgeny Pogorelov. Phase-field modeling of li-insertion kinetics in single lifepo4-nano-particles for rechargeable li-ion battery application. Computational Materials Science, 153:288–296, 2018.
- [23] Fan Wang, Kaiqi Yang, Mingyuan Ge, Jiajun Wang, Jun Wang, Xianghui Xiao, Wah-Keat Lee, Linsen Li, and Ming Tang. Reaction heterogeneity in lifepo4 agglomerates and the role of intercalation-induced stress. ACS Energy Letters, 7:1648–1656, 2022.
- [24] John Newman and William Tiedemann. Porous-electrode theory with battery applications. AIChE Journal, 21(1):25–41, 1975.
- [25] Jeremy P Meyers, Marc Doyle, Robert M Darling, and John Newman. The impedance response of a porous electrode composed of intercalation particles. Journal of The Electrochemical Society, 147(8):2930, 2000.
- [26] Tomaz Katrasnik, Joze Moskon, Klemen Zelic, Igor Mele, Francisco Ruiz-Zepeda, and Miran Gaberscek. Entering voltage hysteresis in phase separating materials: revealing the thermodynamic origin of a newly discovered phenomenon and its impact on the electric response of a battery. arXiv preprint arXiv:2201.044940, 2022.
- [27] Rahul Malik, Aziz Abdellahi, and Gerbrand Ceder. A critical review of the li insertion mechanisms in lifepo4 electrodes. Journal of the electrochemical society, 160(5):A3179, 2013.
- [28] Yiyang Li, Farid El Gabaly, Todd R Ferguson, Raymond B Smith, Norman C Bartelt, Joshua D Sugar, Kyle R Fenton, Daniel A Cogswell, AL Kilcoyne, Tolek Tyliszczak, et al. Current-induced transition from particle-by-particle to concurrent intercalation in phase-separating battery electrodes. Nature materials, 13(12):1149–1156, 2014.
- [29] Vanchiappan Aravindan, Joe Gnanaraj, Yun-Sung Lee, and Srinivasan Madhavi. Limnpo 4–a next generation cathode material for lithium-ion batteries. Journal of Materials Chemistry A, 1(11):3518–3539, 2013.
- [30] Seung-Min Oh, Seung-Taek Myung, Jusef Hassoun, Bruno Scrosati, and Yang-Kook Sun. Reversible nafepo4 electrode for sodium secondary batteries. Electrochemistry communications, 22:149–152, 2012.
- [31] Yang Sun, Zhenzhong Yang, Lin Gu, Yong Chen, Haoshen Zhou, et al. Electrochemical oscillation in li-ion batteries. Joule, 2(7):1265–1277, 2018.
- [32] Debasish Mohanty, Kevin Dahlberg, David M King, Lamuel A David, Athena S Sefat, David L Wood, Claus Daniel, Subhash Dhar, Vishal Mahajan, Myongjai Lee, et al. Modification of ni-rich fcg nmc and nca cathodes by atomic layer deposition: preventing surface phase transitions for high-voltage lithium-ion batteries. Scientific reports, 6(1):1–16, 2016.