X-ray timing and spectral analysis of reverberating active galactic nuclei
Abstract
We use the publicly available XMM-Newton archive to select a sample of 20 active galactic nuclei (AGN) known to exhibit reverberation signatures caused by the reflection of X-rays from the corona off the accretion disc that feeds the central black hole engine. Inverse Compton scattering by energetic electrons, coupled with accretion disc fluctuations give rise to the highly variable observed X-ray spectrum, the behaviour of which is still not fully understood. We use 121 observations in 3 – 4 distinct spectral states for each source and calculate the time lags as a function of frequency. We fit the relativistic reflection model RELXILL and explore parameter correlations. The known scaling relationship between the black hole mass and time lag is well recovered and the continuum flux is coupled strongly to the disc reflection flux. We also find that 1H 0707-495 and IRAS 13224-3809 are well described using reflection and absorption modelling in a variety of flux states. The reflection fraction is strongly coupled to the power law photon index and may be linked to dynamics of the emitting region. The data reveals hints of the power law evolutionary turnover when the 2 – 10 keV Eddington fraction is , the origin of which is not fully understood. Finally, we report the covering fraction is inversely correlated with the flux and power law photon index in IRAS 13224-3809. These findings support recent studies of 1H 0707-495 where the covering fraction may contribute to the observed variability via flux modulations from non-uniform orbiting clouds.
keywords:
X-rays: individual: 1H 0707-495; X-rays: individual: IRAS13224-3809; galaxies: active – galaxies:1 Introduction
Active galactic nuclei (AGN) are thought to be powered by an optically thick, geometrically thin accretion disk (Shakura & Sunyaev, 1973) which releases gravitational energy as multi-temperature black body radiation, peaking in the optical and UV regions of the spectrum. The spectra of AGN are known to be composed of direct continuum emission, however, cold gas can can absorb and reflect some of the X-ray continuum. Evidence for this was first reported from Ginga observations of multiple Seyfert galaxies (Pounds et al., 1990). The cold, optically thick and high column density material seen through fluorescence and reflection confirms the presence of an accretion disk and this phenomenon can also explain the observed iron K line (George & Fabian, 1991). The X-ray continuum is produced by inverse Compton (IC) scattering by a hot optically-thin electron population (i.e. the hot corona) which increases photon energies up to X-ray energy levels. These high energy X-rays are often reflected off the accretion disk with a modified spectrum which leads to the fluorescence of Fe K lines at 6.4 keV.
The first relativistically broadened Fe K line was discovered in MCG-6-30-15 (Tanaka et al., 1995), where the intrinsically narrow 6.4 keV Fe line was broadened and skewed to lower energies by Doppler and relativistic effects. Later, the first hint of reflection or reprocessed time-delay was seen in XMM-Newton observations of Ark564 (McHardy et al., 2007). X-ray reverberation lags were robustly first discovered in 1H0707-495 (Fabian et al., 2009) where the soft energy band (0.3 – 1 keV) lagged behind the hard band (1 – 4 keV) by 30s. Many reverberation lags have since been discovered (e.g. Emmanoulopoulos et al., 2011; Kara et al., 2013b; Zoghbi et al., 2013; De Marco et al., 2013; Kara et al., 2016).
The current understanding of the soft negative time lag is the signature of relativistic reflection that ‘reverberates’ or responds to continuum fluctuations and have been interpreted as the averaged light crossing time from the source to the reflecting region (De Marco et al., 2013). The hard positive lags observed at lower frequencies have been explained by fluctuations of the accretion rate propagating from outer to inner radii, causing the hard X-rays produced at smaller radii to respond after soft X-rays produced at larger radii (e.g. Kotov et al., 2001; Arévalo & Uttley, 2006; Arévalo et al., 2008; Jin et al., 2017). These hard lags were well known to exist in X-ray binaries before they were discovered in AGN (e.g. Nowak et al., 1999).
The X-ray spectrum of AGN contains several components which have been subject to many recent studies. The continuum radiation arising from IC scattering of lower energy photons emerges from a compact corona or extended X-ray region located on the rotational axis of the central black hole, which can be approximated by a power law continuum of where the photon index is determined by corona properties such as the optical depth and electron temperature (Rybicki, G. B. and Lightman, A. P., 2004). The exact origin of this power law remains unclear, however Haardt & Maraschi (1991) cite earlier models from the 1970s where the spectrum depends on temperature and optical depth thus the spectral shape could be reproduced by applying an ‘ad-hoc’ choice of these parameters. They explored progression of this paradigm by suggesting a two phase ‘coupled’ model where optically thick emission of the cool layers inject soft photons for Comptonisation and hard Comptonised photons contribute to the increase in temperature. Variations in luminosity are a result of fluctuations in the mass accretion rate. Propagation of perturbations in the accretion flow in the inward radial direction on viscous timescales cause the observed variation in X-ray flux (Kotov et al., 2001). AGN with a high accretion rate can produce soft X-rays that contribute to Compton cooling of the harder X-rays leading to a steeper spectrum at high energies and a larger value of , for example, see Pounds et al. (1995). This relationship suggests that the accretion disc and X-ray corona are connected and there is clear evidence of a strong correlation between the UV/optical and X-ray luminosity also suggests the existence of a regulated mechanism between the disc and corona (e.g., Liu et al., 2002; Grupe et al., 2010; Connolly et al., 2016). Furthermore, there are strong correlations between the hard X-ray photon index and the Eddington ratio () where is the Eddington luminosity and is the bolometric luminosity (see e.g., Brightman et al., 2013; Yang et al., 2015).
Reverberation lags can be modelled using ray-tracing techniques which follow photon trajectories along Kerr geodesics to calculate the time of arrival of the direct continuum and the reflected photons (e.g. Karas et al., 1992; Reynolds et al., 1999; Chainakun & Young, 2012; Wilkins et al., 2016). Wilkins & Fabian (2013) developed general relativistic ray tracing simulations of the propagation of X-rays from both point-like and extended coronae, modelling the frequency dependence of the lag which provided the height of a point like corona above the accretion disc or its radial extent. The model included the travel time difference of the ray in general relativity to that in classical Euclidean space. Cackett et al. (2014) built on this analysis by considering the frequency and energy dependence of the Fe K reverberation lags from an X-ray point source in NGC 4151 and found that the energy dependence of the lags in the Fe K line region depends on the height of the X-ray source and the black hole mass. Their findings indicated a source height of , where the gravitational radius (where is the gravitational constant, is the black hole mass and is the speed of light) using the lamppost model. However the authors argued that this may be too simplistic in approach and that models considering radial and vertical components in an extended X-ray corona scenario would be more realistic. There have been many subsequent studies of the lamppost model (e.g. Emmanoulopoulos et al., 2014; Kara et al., 2014b; Chainakun & Young, 2015; Epitropakis et al., 2016; Caballero-García et al., 2018; Ingram et al., 2019; Alston et al., 2020) and the extended corona scenario (e.g. Wilkins et al., 2016; Chainakun & Young, 2017; Chainakun et al., 2019).
Hinkle & Mushotzky (2021) have studied the fundamental parameters of the X-ray corona using a multi-observatory approach, using XMM-Netwon, NuSTAR and the Swift-BAT telescopes to cover the 0.3–195 keV energy ranges for a sample of 33 AGN that have simultaneous observations from each observatory. They investigated correlations between the corona parameters and the physical properties of AGN such as the black hole mass, and Eddington ratio. Despite recovering the relationship between the reflection coefficient and the photon index and the X-ray Baldwin-effect, they found no strong correlations between the compactness, black hole mass or coronal temperatures. Whilst admitting that the result was ‘puzzling’, yet remained consistent with previous work and concluded that the fundamental physics of the parameters is not yet understood.
Since the X-ray spectrum of AGN contains components of direct and reflected emission arising from the accretion disc and irradiation of a fraction of the primary X-rays on the accretion disc, the strength of the reflection can be established from the ratio of direct and reflected flux. This was developed in the relativistic reflection model RELXILL (García et al., 2014) which combines XILLVER reflection code and the relativistic line profiles code RELLINE (Dauser et al., 2016), where the reflection fraction, RF, is defined at the ratio of photons that hit the disk to those that reach infinity. The accretion disk ranges from the marginally stable radius to and relativistic light bending effects can lead to the appearance of a warped disk. RELXILL is the standard relativistic reflection model, modelling irradiation of accretion by a broken power law emissivity. Ionization of the accretion disk ranges from (neutral) to (heavily ionised) and the iron abundance of the material in the accretion disc is in units of solar abundance.
Parker et al. (2021) have successfully described the variability of 1H 0707-495 using a series of publicly available phenomenological models to build on previous findings of the physical processes driving the observed variability from the accretion flow and from the line-of-sight absorption. Using the fractional variance and energy dependence of the variability in low and high frequency regimes, they found that the soft variance is driven by partial covering and the higher frequency changes are intrinsic to the source where the absorption and intrinsic variability are evident on longer timescales.
This study utilises a sample selection informed by the work of De Marco et al. (2013), who first reported that the time lags scale with black hole mass and scale inversely with the frequency at which the lags occur. In addition, most of the sources have been previously studied by Kara et al. (2016) who investigated the time lags in the Fe K band (between the 3 – 4 and 5 – 7 keV bands) and found that although the time lags were well correlated with the black hole mass, a stronger correlation was evident in the Fe K lag frequency. In this paper we use XMM-Newton archival data, adding several more recent observations to our sample (e.g. for IRAS 13224-3809, NGC 4395 and NGC 5548) to explore the time lags as a function of frequency and investigate the disc reflection component using the RELXILL reflection model for 20 AGN known to exhibit reverberation signatures. We seek to confirm the basic properties such as their lag profiles and to look for correlations between the time lags, mass, accretion rate and other parameters such as the disc ionisation. We aim to contribute to the understanding of the observed variability. This work was carried out prior to an exploration of the extended corona scenario (paper in prep) by redeveloping the ‘two-blob’ approach first presented by Chainakun & Young (2017).
2 Observations and data reduction
The sample was selected from well studied AGN known to exhibit reverberation signatures with a preference for observations ks. These AGN and basic data are listed in the Appendix Table 3 and the full sample is listed in Table LABEL:table:obs_log. Each observation was downloaded from the XMM-Newton archive and we select only the EPIC pn data due to the higher S/N in the 0.3–10 keV energy range and processing was conducted using XMM Science Analysis System software version 18.0.0. Following the standard methods, the data were cleaned of background flaring activity which can lead to spurious results. This was conducted by creating the 10–12 keV light curve with PATTERN==0 in 100 s bins, and removing high particle flaring from the beginning and end of each observation which slightly reduced the effective duration. The light curves were then generated in 0.3–0.8 and 1–4 keV with FLAG==0 and PATTERN<=4. These energy ranges were chosen because of the higher signal to noise ratio at lower energies and for comparison with the existing literature. We also note that moderate background flares do not significantly degrade the S/N ratio in the relatively soft bands we are considering here, so we have not removed intra-observation observation flares. Even if we were to completely disregard the few observations with some moderate intra-observation flaring, this would not change our conclusions. Each source was examined and source counts extracted using a radius of 35 arcsecs. The associated background was selected with the same radius far from the source, whilst remaining on the same CCD chip to create background subtracted soft and hard photon light curves. The photon Redistribution Matrix File (RMF) and Ancillary Response File (ARF) were calculated for all spectra using the rmfgen and arfgen tools and grouped to a minimum of 25 counts per spectral bin using the GRPPHA package.
| Source | Obs ID | Core exclusion |
|---|---|---|
| 1H 0707-495 | 0511580101 | 8" |
| 0511580301 | 12" | |
| 0653510401 | 13" | |
| 0653510501 | 12" | |
| 0653510601 | 12" | |
| Ark 564 | 0006810101 | 5" |
| 0206400101 | 5" | |
| 0670130201 | 5" | |
| 0670130501 | 6" | |
| 0670130801 | 8.5" | |
| 0670130901 | 8.5" | |
| PG 1211+143 | 0112610101 | 9" |
| 0208020101 | 5" | |
| 0502050101 | 10" | |
| 0745110301 | 15" | |
| 0745110401 | 4" | |
| 0745110501 | 5" | |
| 0745110601 | 10" | |
| 0745110701 | 5" | |
| REJ 1034+396 | 0506440101 | 21" |
The soft and hard corrected light curves were then created using the task epiclccorr for the soft and hard energy bands. Background and source spectrum were then generated before running the BACKSCALE task. The SAS epatplot was employed to check each observation for photon pileup which can lead to spurious results. Several observations in the sample did show some mild-to-significant pileup and this was dealt with by removing the core at the centre of the source, increasing in size until the pileup fraction was negligible. Table LABEL:pileup_obs_log lists all data requiring action for pileup issues and includes the radius of core removal in arc seconds. For the more interested reader, full details of this ‘reproducible’ analysis is also available via online logbooks (Hancock, 2019).
3 THE UNFOLDED SPECTRA OF AGN
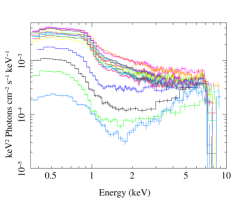
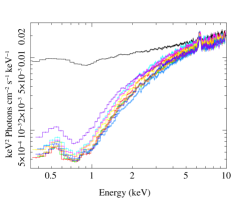
We begin by providing an overview of the variability of these AGN by inspecting the background subtracted unfolded energy spectrum, that is, photon counts cm-2 s-1 keV-1 as a function of energy for the full 0.3 – 10 keV energy range. The observations for all AGN were then grouped into similar spectral states as seen in Figure 2. For example, the unfolded spectra of 1H 0707-495 revealed three distinct groupings of low, intermediate and high energy count rates. The high flux spectral group was taken from the tightly packed group at the upper region consisting of 11 observations where the soft energy photon count rate was s-1. Working down the photon count rate, the medium flux state was taken from the next two observations (seen in blue and black) below the high flux group and the low flux group was taken from the two lower observations (green and indigo). Final lags were calculated from the fully combined spectrum. This is a crude method of grouping similar flux states, however the main idea is to capture various similar spectral profile groups which will provide us multiple ‘snapshots’ of the observed variability for each source.
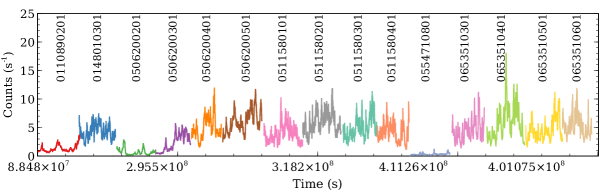
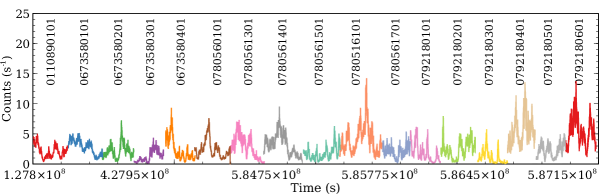
In order to capture lag profiles of the high and low photon count rate epochs, further examination was conducted by considering the background subtracted light curves in the full 0.3 – 10 keV energy range as shown in Figure 3 for 1H 0707-495 and IRAS 13224-3809, demonstrating their strong variability. Subsequent inspection revealed that two of the observations in the lowest spectral group namely 0506200201 (green) and 0554710801 (indigo) contained some of the highest count rates not immediately obvious from the unfolded spectra, hence two further groups were created to encompass the observations containing a count rate above and below 5 cts s-1. The same method was also applied to IRAS 13224-3809 as shown in Figure 3, however for the remainder of AGN in the sample only the combined, low flux and high flux epochs were taken, with an additional medium flux state where deemed appropriate from the inspection of the unfolded flux (see e.g. Mrk 766 and NGC 3516). All AGN groups and the additional groups discussed above are listed against their specific observations in Table LABEL:table:obs_log.
4 Estimating the time lags
The time lags between the soft light curve and the hard light curve were computed using discrete Fourier transform (DFT) methods as outlined by Nowak et al. (1999) and Uttley et al. (2014). The DFT of a light curve with contiguous time bins is given by
| (1) |
where is the discrete Fourier transform at each Fourier frequency, , for , is the segment duration, and is the time corresponding to the bin of the light curve. The minimum frequency is the inverse of the time duration and the maximum frequency is the Nyquist frequency where is the 10 s time bin size. The Fourier cross spectrum between two lightcurves and with DFTs and was calculated using the real and imaginary components by . The use of the complex conjugate means that the phase of the cross spectrum gives the phase lag between the light curves and can be written , where and are the absolute amplitudes of the Fourier transform. Considering M segments and K frequencies per segment, the coherence may be used to calculate the errors on the phase lag by
| (2) |
The time lag error can be calculated by , thus the time lag was finally calculated by .
We adhere to the most accurate method of lag estimation (Epitropakis et al., 2016; Epitropakis & Papadakis, 2016), therefore all time lags were taken from pairs of light curves with the same duration using segments with duration 20 ks, having a Gaussian distribution with known errors. They were calculated at frequencies where the coherence is equal to which reduces the effects of the Poisson noise on the true value of the time lags. The results of the lag-frequency estimates are presented in Appendix Table LABEL:table:lag_results, listing the maximum amplitudes of soft reverberation lags found and the frequencies where they occur. For swift reproduction, appropriate FITS files and code can be downloaded from the web pages111http://www.star.bris.ac.uk/steff/downloads.html. In addition, all lags produced for this study are presented online in the timing analysis results222http://www.star.bris.ac.uk/steff/timing_results.html and are also presented in the Supplementary material (online).
4.1 Checking consistency of the time lags
We checked that our lag estimates are consistent with those in the literature using robust lag production procedures. Specifically, our combined lag-frequency estimates for 1H 0707-495, MCG–6-30-15, Ark 564, Mrk 335, Mrk 766, Mrk 841, NGC 3516, NGC 4051, NGC 4395, NGC7469, PG1211+143 and REJ 1034+396 are consistent with the soft reverberation frequencies and amplitudes found by De Marco et al. (2013, DM13 hereafter). The lags found for NGC 5548 are much lower amplitude (but in the same frequency range) than those found by DM13 due to combining observations from 2013 and 2014 not available at the time of the DM13 study; the single observation (Obs ID: 0089960301) conducted in 2001 which is the sole higher spectral flux observation used here, hence the larger amplitude high-flux lags of s at identical frequencies reported by DM13. The spectrum of this source changed dramatically between 2001 and 2014 and it should be noted that the low flux spectra group contains all observations except the 2001 observation and the lag frequency found was more comparable to the amplitude reported by DM13 although at a lower frequency. This apparent discrepancy is a consequence of averaging highly variable spectra and supports the grouping methods used throughout this paper. The single observation for NGC 6860 first produced a soft negative lag of s at Hz and was generally inconsistent with the results reported by DM13, however a revised look at this data using their soft and hard energy bands (0.3-1 and 1-5 keV) reproduced a consistent result where the soft negative lag was found with amplitude s at Hz. IRAS 13224-3809 was checked multiple times against some earlier literature and the lags found in the combined observations from 2002 – 2011 were consistent with Fabian et al. (2013) and all lags to include the observations taken in 2016 were strongly comparable to Alston et al. (2020). For Ark 564 and Mrk 335, the lag-frequency was also found to be consistent with Kara et al. (2013b) and the data for PG 1244+026 was checked against Kara et al. (2014a) to find a comparable soft lag to that presented in the literature. The lags found in NGC 1365, NGC 4151 and NGC 7314 are comparable to those found by Kara et al. (2016). Finally, the lag-frequency for PG 1247+267 has no clear comparison in the literature and it should be noted that whilst the full sample contains AGN at low redshift , PG 1247+267 is an ultra luminous source at (Bechtold et al., 2002).
5 Spectral analysis
Spectral analysis was conducted using the Interactive Spectral Interpretation System (ISIS) version 1.6.2-27 (Houck & Denicola, 2000). When needed, multiple datasets were combined in ISIS using combine_datasets which is conceptually similar to summing the datasets but with the models for the individual datasets being treated consistently and folded through the responses for each individual observation. The individual ARF and RMF files were not combined. The summed data are shown in the plots for clarity. The relativistic reflection model RELXILL was applied to all spectra and galactic absorption was obtained using the Colden Galactic Neutral Hydrogen Density Calculator (The Chandra X-Ray Center, 2018) and applied via the interstellar medium absorption model for each source (Wilms et al., 2000). Fitting was conducted systematically to each individual observation to include Galactic absorption and reflection components by adding the RELXILL model, initially in the general form (tbabs*(powerlaw+relxill)) in the 0.3–10 keV range. During the fitting procedure we explored the addition of a redshifted partial covering model which significantly improved the statistical results. The RELXILL cut off energy was fixed at 300 keV and the radius where emissivity changes from Index 1 to Index 2 was allowed to vary. The redshift was set to known values from literature for each AGN as outlined in Table 3. The black hole spin, , can affect the accretion flow and spin-dependent locations such as the innermost stable circular orbit around black holes (see detailed review by Reynolds, 2021) and a large number of accreting supermassive black holes have been found to be rapidly spinning. We find that 15/20 AGN in this sample have , therefore in order to reduce the number of free parameters we aligned this value for the subsequent reverberation model to be explored (Hancock et al. in prep) by fixing this parameter for a maximally spinning black hole. The inclination angle was also initially set to known values but was allowed to vary throughout the fitting procedure. Initial statistically poor fits were improved via the investigation of models similar to those used in literature for each AGN as detailed below. This was done to avoid an ad-hoc approach whilst using the wide range of model components available in XSPEC. This method was tested until good statistical descriptions were achieved, essentially building on known environmental parameters for each source.
5.1 Focusing on 1H 0707-495 and IRAS 13224-3809
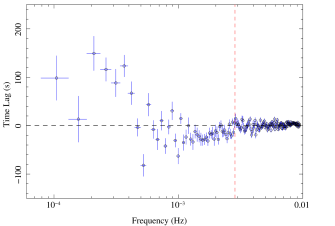
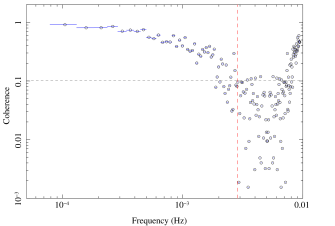
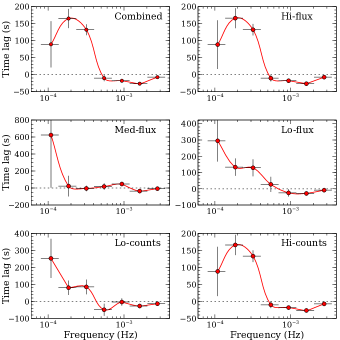
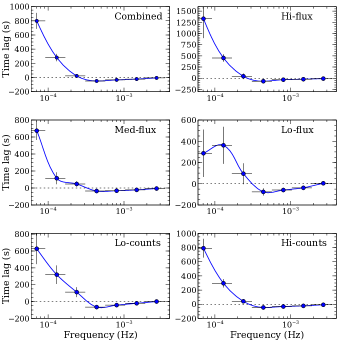
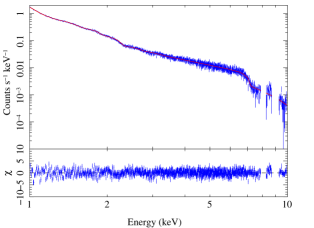
1H 0707-495 and IRAS 13224-3809 are both highly variable AGN that have been well studied with an abundance of long observations available. Furthermore, they have remarkably similar spectra as we will see below from the spectral analysis therefore we examine these sources in greater detail before moving on to the remainder of the sample. Some spectra show evidence of absorption features around 8 keV. However, Katayama et al. (2004) pointed out the potential for false detection of an absorption feature at this energy as a result of spatial variation in the instrument background, and in particular the strong Cu K emission lines around 8 keV. We followed the approach of Parker et al. (2017) to compare the spectra with and without the background. We found that the putative absorption features around 8 keV could be mostly explained by the instrument background. While weaker absorption features may remain after a careful analysis (e.g., Dauser et al., 2012; Parker et al., 2017), since these lines are not the focus of this paper we have chosen to exclude the energy ranges 7.9–8.25 keV and 8.7–9.25 keV for 1H 0707-495 and 7.95–8.25 keV for IRAS 13224-3809. Excluding these energy ranges does not significantly change our best fit parameters. For 1H 0707-495 the fully combined lags were calculated up to a maximum frequency where the coherence value was 0.10, yielding = Hz and this method is represented in Figure 4. The same method was applied to IRAS 13224-3809 using 84 segments where the coherence value was 0.07 corresponding to = Hz. We begin by calculating the lags of the groups as outlined in Table LABEL:table:obs_log and the lag-frequencies obtained are presented in Figures 5 and 6 . The lag-frequencies for all other AGN are presented in the Supplementary material (online).
5.2 1H 0707-495
This AGN has been well documented to be dominated by relativistically blurred reflection at a moderate inclination angle (see e.g. Dauser et al., 2012; Fabian et al., 2009; Kara et al., 2013a; Zoghbi et al., 2010). The spectrum has also been suggested to be modified by absorption and contain a highly ionised outflow of up to (Dauser et al., 2012). Alternative models have been explored and have similar qualitative results suggesting the spectral shape is absorption dominated (Miller et al., 2010) and may also be subject to variable partial covering whereby the continuum spectrum is covered by two ionised absorption layers (Mizumoto et al., 2014).
We combine all 15 observations and add photo-electric absorption, power law, relxill and a disk-black body component in the 0.3 - 10 keV energy range. The statistical fits were poor. Soft excess dominates the region below 1 keV and above 7 keV the spectrum is dominated by a sharp absorption-like feature and there is insufficient data in this region to achieve a tightly constrained model fit. We use two absorption edges at 6.9 and 7.8 keV respectively to achieve at best . The model was then fit between 1 – 10 keV to exclude the soft excess band and added a red-shifted partial covering model and shifting the edge energies to 7.0 and 7.8 keV and reducing the absorption depth to 0.95 and 1.03 respectively and allowing them to vary. The redshift was tied to zpcfabs to achieve a best statistical fit where . The model described the accretion disc environment to be mildly ionised with a high reflection fraction where the column density and the partial covering fraction is at an inclination angle of . This model, zpcfabs*relxill*edge(1)*edge(2), was then used on all other spectral groups obtaining good fits and estimates of the 90% confidence intervals for the fit parameters. It should be noted that the sharp absorbing regions above 7 keV have been well described by ultrafast outflow (UFO) modelling, (see e.g. Dauser et al., 2012; Kosec et al., 2018). The model provided a reasonably good statistical fit. All groups showed steep photon indices from from the lowest to highest counts rates respectively. We note that the inclination angle returned by the model is comparable with the findings of Fabian et al. (2011). Full results are presented in Table 2 and the combined fitted spectra are shown in Figure 7.
5.3 IRAS 13224-3809
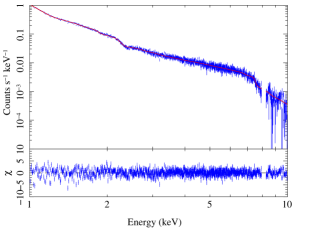
The unfolded spectra of the 17 observations as seen in Figure 2 contain two well grouped spectra at the higher count rate in red and blue consisting of observations 0792180401 and 0792180601. The medium-counts group was taken from the top green down to bottom light green and consisted of 13 obs in total as outlined in Table LABEL:table:obs_log and the two low-counts spectra at the bottom in blue and grey contain observations 0673580301 and 0792180301 was used for the low counts group. The associated lag-frequency was calculated for these groups and is presented in Figure 6. The first striking feature is the large amplitude of the low frequency disc fluctuation lags extending s in contrast to the moderate fluctuations of s as seen in 1H 0707-495 in Figure 5. The soft reverberation lags however were comparable and both AGN exhibited larger reverberation lags when the photon count rate is lowest. The light curves for all IRAS 13224-3809 observations are shown in Figure 3 in the 0.3 – 10 keV energy range. Thanks to the long observations conducted by XMM-Newton, this represents an effective total observation time of over 1.9 Ms. Although the x-axis is not to scale, these light curves demonstrate the large amplitude of the variability of this AGN, often containing large photon count-rate spikes a few ks in duration. The spectral modelling for IRAS 13224-3809 was conducted using similar methods to those outlined above for 1H 0707-495. Once more we combine all spectra and apply a partial covering and RELXILL and also include absorption edges around the steep drop off at keV. The best model fit was containing absorbed column density with a covering fraction of . Only one absorbing edge was required at keV. The reflection fraction tended to the model maximum and the disc inclination was . All other groups results are presented in Table 2 and the combined fitted spectrum is shown in Figure 7.
5.4 Other AGN in the sample
All remaining AGN in the sample were inspected via the combined, high-flux and low-flux data groups except in cases where clear medium groupings were evident as seen in Mrk 766 and NGC 3516. Whilst most AGN were well fitted with the addition of the partial covering model, this was not required for Ark 564, Mrk 335, Mrk 841, MCG–6-30-15, PG 1211+143, PG 1244+026 and REJ 1034+396. Mrk 766 on the other hand required partial covering for the combined and low-flux groups only, fitting statistically better without this in the medium and high-flux groups. The 2 – 10 keV luminosity was calculated in each case using the spectral model flux , where where is the luminosity distance obtained from NED (2019) in cgs units with NED’s default cosmology, , , . We find PG 1247+267 the most luminous of the sample where erg s-1. The strongest reflection was seen in Mrk 335, NGC 1365, NGC 4051 and NGC 4151 where the reflection fraction reached the maximum allowed by the model. Statistically good descriptions were obtained for all data groups and the reduced value was generally in the range 1.0 – 2.5. All resultant parameters were initially plotted against to explore the model behaviour. The full spectral modelling results for these AGN are presented in the Supplementary material (online). Several correlations were evident within the RELXILL components, power law flux, power law , reflection fraction and covering fraction that may help to explain the variability observed in AGN. These correlations are explored in more detail and are discussed in turn below.
| Source | Group | RF | Cvr Frac | / d.o.f. | |||||
|---|---|---|---|---|---|---|---|---|---|
| 1H 0707-495 | Comb | 1533/683 | |||||||
| Hi | 1382/646 | ||||||||
| Hi > 5 cts s-1 | 995/690 | ||||||||
| Med | 446/411 | ||||||||
| Lo | 539/437 | ||||||||
| Lo < 5 cts s-1 | 1251/680 | ||||||||
| IRAS 13224-3809 | Comb | 2199/1281 | |||||||
| Hi | 1237/1000 | ||||||||
| Hi cts s-1 | 1558/1353 | ||||||||
| Med | 1699/1455 | ||||||||
| Lo | 834/799 | ||||||||
| Lo cts s-1 | 1579/1275 |
6 Parameter correlations
6.1 Continuum and reflection flux
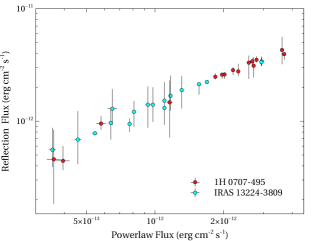
We inspect the dependence of the continuum flux and reflection flux by obtaining these components during this fitting phase to within the 90% confidence limit in the 0.3–10 keV energy range. Focusing initially on 1H 0707-495 and IRAS 13224-3809 we find the Spearman’s rank correlation with a -value of . The slope and intercept was 1.11 and 2.72 respectively. The reflection scenario expects reflection component to correlate positively with the power-law component. These results are shown in Figure 8 (left panel), accompanied by the same inspection for all other AGN groups (right panel) where the Spearman’s rank correlation = 0.99 with a -value of . The slope and intercept was 0.98 and 2.63 respectively.
6.2 Time lags and black hole mass
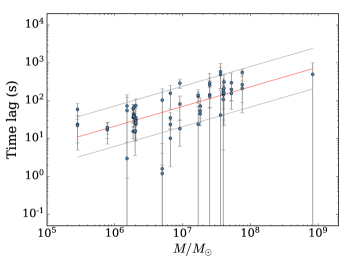
All groups and the associated lag-frequency results reported in Table LABEL:table:lag_results were plotted against the black hole mass. The time lags correlated strongly with the mass where the Spearman’s rank coefficient = 0.72 and . This correlation can be seen in the left panel in Figure 9, shown with a best fit in red and the 1 region shown by the grey lines. The right panel of this figure presents the frequencies where these lags were found, which also correlates strongly with mass, having and . These findings provide further support the mass and soft lag scaling relationship discovered by De Marco et al. (2013). We also take the lags as a function of the 2–10 keV luminosity and find that there is a moderate correlation with = 0.49 and .
6.3 Photon index , luminosity and ionisation
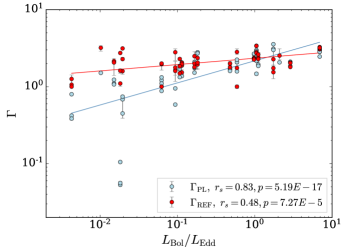
We examine two regimes of photon index . One from the continuum via a power law model photon index and one from the independent RELXILL model fitting where the reflection fraction is set to -1 in order to return only the reflection component and associated power law photon index . Note that we do not require which could represent an extended continuum source with a different continuum spectrum reaching infinity and being responsible for disc reflection (see, e.g., Chainakun & Young, 2017). Inspection of the power law photon index and reflection photon index yielded a correlation with the Eddington ratio (). The correlated strongly with where the Spearman’s rank coefficient = 0.83 and . The mean was 1.82 where . For however, the correlation was much flatter and a moderate = 0.483 and was returned along with mean value of 2.20 where . These relationships can be seen in Figure 10, showing both the and fitted with a best line fit and the sigma regions are omitted for clarity.
We also inspected the behaviour of the ionisation parameter against the luminosity in the 0.3–10 keV energy range for all data and found no correlation. However, inspection of the combined data revealed a weak correlation between the reflection flux and ionisation where = 0.28 and and between the power law flux and ionisation where = 0.30 and and .
6.4 Photon index and covering fraction
All data groups were inspected for behaviour of the and against the covering fraction and we find that the covering fraction is moderately inversely correlated with . The strongest relationship was found in the high-flux data where the Spearman’s rank coefficient and . The mean covering was 0.63 where . Moderate but weaker inverse correlations were found in the combined and low-flux data. For however, no significant correlations were found.
To investigate this further we explore all individual observations for 1H 0707-495 and IRAS 13224-3809 where the covering fraction was applied during the fitting procedure. For 1H 0707-495 we found weak anti-correlations between the covering fraction and . The 0.3–10 keV flux and 2–10 keV luminosity correlated weakly with the covering fraction where was around and the value was in both cases. However, the inspection of IRAS 13224-3809 revealed a strong correlation between the covering fraction and where and the -value was . We note that the mean covering fraction here was 0.60 where 1 was 0.17 and the errors are large as seen in top panel of Figure 11. If the covering fraction contributes to the variability of the spectrum then we also expect it to correlate with the flux and luminosity. Further exploration revealed the 0.3 – 10 keV flux correlated strongly with the covering fraction where and the -value was . Again we note the large errors on the covering fraction as presented in the bottom panel of Figure 11. The reflection flux also correlated strongly with the covering fraction where and the -value was .

6.5 The reflection fraction (RF)
We examined the reflection fraction (RF) in all data groups and the individual observation spectra and find a significant correlation with the power law flux where and -value was for the IRAS 13224-3809 data. RF also correlated strongly with the reflection flux where and the -value was . For 1H 0707-495, the revealed a similar correlation between RF and the covering fraction of and -value of . These correlations are discussed below and presented in Figure 13. The mean RF for 1H 0707-495 was 2.71 and and IRAS 13224-3809 had mean RF of 2.80 and . Examination of both AGN also revealed a moderate positive correlation between RF and the covering fraction where and the -value was . These correlations do not hold when investigated using the full grouped sample results, but rather they are intrinsic to each source.
6.6 Global correlations across the AGN sample
Further analysis was conducted to check if the correlations described above hold across the AGN sample. This final stage was completed by independently running a similar phenomenological model to include Galactic absorption in the form ‘tbabs*powerlaw*zpcfabs*relxill’. The model was systematically fitted to all data groups and identical correlations were obtained. We find that all correlations hold with very similar Spearman rank values, hence the correlations reported here for all data groups appear to be globally obtained throughout the AGN sample. Fitting this model without the zpcfabs components did not significantly change the luminosity.
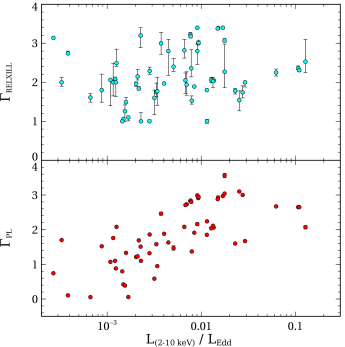
We present one final interesting correlation between the Eddington fraction and the two photon indices and . Both spectral models returned consistent correlation values and we consider the model relationships shown in Figure 12, where correlates strongly with the Eddington fraction where and -value and correlates moderately with and -value . There tentatively appears to be a difference between the power law photon indices when the 2 – 10 keV Eddington fraction is , in this case corresponding to a luminosity of erg s-1.
7 Discussion
The soft reverberation lags for around 50% of the AGN sample varied by a few tens of seconds when calculated between the combined, high and low flux states. The largest changes between these groups of s were found in Mrk 335, Mrk 766, Mrk 841, NGC 4151, NGC 5548, NGC 7314, 7469 and PG 1211+143. The largest time lags s were found in Mrk 841, NGC 4151 and PG 1247+267 and we have seen that these lags generally increase with the black hole mass and AGN luminosity. The correlations found between the mass and time lag and the frequency supports the findings of DM13 when using a different sample set where the black hole mass estimates were sourced from reverberation mapping techniques whenever possible (Bentz & Katz, 2015). Furthermore, most of these sources and similar mass estimates to this work have been previously reported by Kara et al. (2016). Nevertheless, Kara et al. (2016) reported that the correlation of the frequency–mass relation is stronger than that of the lag–mass relation using the Fe K band lags between the 3 – 4 keV and 5 – 7 keV bands. Therefore they suggested using the frequency–mass relation to determine the black hole mass of AGN from the Fe K band lags. Interestingly, by grouping the data into similarly observed spectral states, we find that the lag–mass relation has a stronger correlation coefficient than the frequency–mass relation. The difference of these results arise due to the different averaging schemes used in our work and by DM13 and Kara et al. (2016). However, Chainakun et al. (2022) suggested that the lag–mass correlation coefficient can decrease with the increasing number of newly-discovered reverberating AGNs. This could happen, for example, under the extended corona framework if the amplitude of the lags are more strongly affected by the coronal properties (e.g. being diluted due to the effects of coronal temperature and compactness). If this is the case, it might be still better to use the frequency–mass relation to determine the mass, keeping in mind that the dilution factor does not significantly change the frequency where the negative lags appear.
While the reverberation lag is thought to be caused by the light travel distance between the corona and the disc, the flux in the reflection-dominated band also includes a component of continuum emission and vice-versa and these are subject to dilution effects that will reduce the time lags (e.g. Wilkins & Fabian, 2013; Chainakun & Young, 2015, 2017). Furthermore, Wilkins et al. (2020) investigated reverberation lags taking into account the effects of returning radiation and found that the soft X-ray lag could increase by percent. The source height implied by the standard lamppost model would then be overestimated if the returning radiation plays an important role. Due to the dilution and returning radiation effects, it is not appropriate to assume the lag amplitude directly corresponds to the distance of the X-ray source or corona above the disc. In fact, we will investigate the relations of the lags and the source geometry in our subsequent study of the extended corona scenario (in prep).
From the dependency of the lag-frequency seen in Figures 5 and 6, the soft lag amplitudes of 1H 0707-495 are generally small at s at frequencies Hz, implying the corona is reasonably compact in agreement current literature (e.g. Szanecki et al., 2020). In the case of IRAS 13224-3809, the result is comparable with Caballero-García et al. (2020) where they analysed the combined spectral-timing data and found the trend of increasing source height with increasing luminosity. However, the clear trend of changing both amplitude and frequency where the maximal soft lag is found with changing flux states that relate to the dynamic of the corona (Kara et al., 2019) is not observed. In fact, by considering only the distinct high and low flux states in Table LABEL:table:lag_results, we find of the sources whose maximum lag amplitude decreases when the source changes from high to low flux states, while the frequency of the maximum lag amplitude increases in of the sources. There was no clear correlation between the time lags and the spectral model parameters.
The disc fluctuation lags varied highly throughout the sample with the most extreme variations seen in IRAS 13224-3809 and REJ 1034+396 where the positive fluctuations lags extend up to s. A similar lag profile is seen in PG 1244+026 between s although not so highly variable between groups. The lag-frequency profile for these three AGN are very similar and their spectra contain heavy absorption in the 7 – 10 keV energy range. Whilst this higher energy absorption feature is also evident in 1H 0707-495 and PG 1211+143 the lag-frequency does do not follow the same profile. This has been discussed by Kara et al. (2016) where the absence of hard lags in NGC1365, Mrk 841 and NGC 3516 is also found here in this study. We find a similar profile in PG 1247+267, however the relatively short duration prevents lag estimation down to lower frequencies. This supports the need for more long observations ( ks).
We find that spectral fitting can be well constrained using both reflection and absorption modelling. The spectral analysis has shown that the reflection flux is strongly connected to the power law flux as expected in the reflection scenario. This is well constrained for all data in the sample and a focus into this relationship for 1H 0707-495 and IRAS 13224-3809 reveals a hint the reflection flux flattens out when the power law flux is higher (see Figure 8). Although this was not tested for all AGN due to the insufficient data, it has been suggested to be a consequence of light bending effects closer to the black hole (Zoghbi et al., 2010).
The also correlated strongly with the Eddington ratio in line with previous studies such as Sarma et al. (2015) and references therein. The correlation was much flatter for the range 0.003 – 8.0 as seen in red in Figure 10. We note 3 outliers where is very low (0.11, 0.56 and 0.53 respectively) as found in NGC 4151 that may be a hint of the - anti-correlation found in lower luminosity AGN (e.g. Gu & Cao, 2009) yet this was still a well constrained moderate correlation. One would expect these correlations to be parallel to each other given the acute relationship between the different power law and reflection flux, however there appears to be no clear relationship between the photon index and luminosity for different sources, possibly due to changes in the accretion rate and/or disc geometry. The has been found to significantly correlate with the Eddington fraction whilst testing the claim that can serve as an accretion rate indicator (Shemmer et al., 2008) concluding that that the accretion rate largely determines the hard X-ray spectral slope across 4 orders of magnitude in AGN luminosity. Whilst we find much wider values of than reported by Shemmer et al. (2008), we also find that the is much stronger correlated than against the Eddington fraction and the same is seen against the Eddington ratio. This suggests the accretion rate is largely determined by the spectral slope of the continuum and the spectrum softens with increasing luminosity due to cooling via reprocessed emission of the hot plasma. The reflection component however, has an overall softer and flatter spectral profile and may be more determined by physical properties of the corona and a harder X-ray component that remains roughly constant during the observed timescales (see McHardy et al., 1999).
The addition of a partial covering absorption improved the fitting procedures for 13/20 of AGN in the sample and was not required for Ark 564, MCG-6-30-15, Mrk335, Mrk 841, PG 1211+143, PG 1244+026 and REJ 1034+396. There is evidence that the covering fraction increases with a decrease in the in the high flux data and this is also moderately evident in the combined and low flux data. Despite the large error bars, this suggests that the covering fraction may also be inversely connected to the power law and hence the reflection flux. Partial covering has been previously explored to help explain the large flux changes of AGN without the large changes in luminosity and inner disc temperature. In particular the flux changes seen in 1H 0707-495 have been explained by a changing covering fraction due to the motion of non-uniform orbiting clouds where the local minimum of the covering corresponds to flares or flux peaks. This explanation could modulate the observed flux without changing the spectral profile (Tanaka et al., 2004) and is clearly evident in most of the AGN explored in this study and has been supported by subsequent studies (e.g. Mizumoto et al., 2014; Risaliti et al., 2009). Further investigation revealed that whilst this is not significant in a sample of AGN, strong correlations were found in the IRAS 13224-3809 covering fraction as a function of the and the spectral model flux (Figure 11). Findings in this study supports the suggestion that the variability seen in IRAS 13224-3809 is also due to non-uniform orbiting absorbing structures (Boller et al., 1997). Therefore, both variability that is intrinsic to the source and that caused by absorption should play an important role in IRAS 13224-3809. Perhaps, they dominate on different timescales and vary among different flux states, such as what was seen in 1H 0707-495 (Parker et al., 2021). On the other hand, it does not explain the variability seen in 7/20 AGN where the covering fraction was negligible and deemed unnecessary, hence alternative mechanisms must be in play.
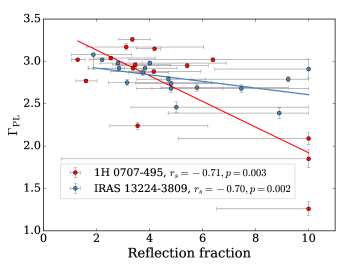
The area of the reflecting region and the location of the X-ray source or emitter can influence the amount of observed reflection. For example, photons emitted from an X-ray source close to the black hole will be gravitationally focused towards the inner regions and unable to escape to infinity and contribute to the strength of the continuum leading to a higher reflection fraction (Fabian et al., 2011). Wilkins & Gallo (2015) found that a low RF may be observed when a patchy or flaring covering fraction is <0.85 and Compton scatters the reflection at the ISCO. The highest RF was seen in NGC 1365 and PG 1247+267 where this parameter reached its maximum in all data groups. This dominance was absent in Ark564, Mrk 766, NGC 7314, PG1211+143, and the smallest RF was evident in NGC 7469. The significant correlations reported above are consistent with recent findings reported by Ezhikode et al. (2020), where a significant correlation between RF and the in a sample of 14 AGN (including 3 from this study) as observed by NuSTAR. They explained the scenario where the rate of cooling of the corona is directly linked to the slope of the power law as a higher input of seed photons from a large area of the accretion disc enters the corona and enables stronger cooling the plasma and hence the steeper power law. This leads to a higher fraction of X-ray illumination on the same region of the disc producing a higher value of RF. The observed reflection fraction depends on the geometry of the accretion disc, therefore correlations between RF and may be driven by changes in the disc and corona geometry. Figure 13 shows the correlations between RF and the for 1H 0707-495 shown in red with a linear best fit where the slope and intercept was -0.15 and 3.44 respectively. This relationship for IRAS 13224-3809 is shown in blue with a linear fit where the slope and intercept was -0.04 and 2.99 respectively. It is clear that a better understanding can be gained by considering the individual orbits rather than combining spectra into groups.
Furthermore, previous literature showed that the lag-frequency profiles of 1H 0707-495 and IRAS 13224-3809 exhibited a wavy-like feature on their negative lags (e.g. Caballero-García et al., 2018). Although its presence is less noticeable in this work, which is probably due to a large bin size, we can still observe hints of this feature in both AGN towards high frequencies before the phase wrapping occurs (Figure 5). The wavy feature on negative lags is likely produced by an extended corona (see, e.g Chainakun et al., 2019; Caballero-García et al., 2020, and discussion therein). This, together with RF and correlation derived here (Figure 13), strongly suggests that the variability of 1H 0707-495 and IRAS 13224-3809 could be driven by the dynamics of an extended corona, perhaps simplified by two co-axial X-ray sources varying in height and luminosity (Chainakun & Young, 2017; Chainakun, 2019), rather than the evolution of the lamppost scenario.
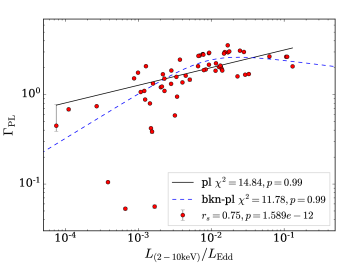
Both and increase as the luminosity increases until the 2 – 10 keV Eddington fraction is , after which the spectral indices decrease as the luminosity continues to increase, suggesting variations of the inner regions and accretion flow. However when and are plotted against the Eddington ratio, the downturn in the photon index is not clearly evident as seen in Figure 10. We investigate the Eddington fraction turnover further by fitting a power law and a broken-power law, obtaining values of 14.84 and 11.78 respectively as shown in Figure 14. Whilst the data are marginally better fit by a broken power law, but this difference is not statistically significant. Nevertheless, this turnover point is still clearly evident in a small fraction of the luminosity for all AGN groups, furthermore the same significantly correlated – Eddington fraction profile is evident in the individual observations of 1H 0707-495 and IRAS 13224-3809. We investigated the JED-SAD framework and two-phase accretion scenario as reported in GBHBs, where the turnover at has been found (e.g. Marcel et al., 2021; Yang et al., 2015; Sobolewska et al., 2011). However, this evolution cannot be clearly seen in the reverberating AGN samples. In contrast, we find hints of the turnover at , the origin of which remains unclear. We suggest that this turnover point could be consequential of accretion rate changes and/or modification of the inner geometry of the accretion disc and corona.
8 Conclusions
We have presented the time lag estimates as a function of frequency for 20 AGN in a variety of flux states and recovered the lag amplitude and black hole mass scaling relationship first discovered by DM13. In addition, these lags are positively correlated to the luminosity. We have shown that modelling the same varied flux states as used in the lag analysis can provided a good description of the observed data using both reflection and absorption modelling. There is a very strong correlation between the disc reflection and power law flux and a moderate correlation between the covering fraction and for all AGN. We also find significant correlations with the covering fraction and flux in IRAS 13224-3809 in particular, suggesting that orbiting clouds may play a significant role in the observed spectral variability without changing the spectral profile. Whilst this phenomenon is not strongly evident across the sample, there are hints this could help explain the variability of AGN where the spectral shape remains constant and modulated by non-uniform orbiting clouds.
We also find strong correlations between the reflection fraction RF and and also the reflected flux which may be linked to the changing disc-corona geometry. However, we acknowledge that different components may be required to achieve global descriptions of observed AGN variability and the dynamics of AGN are best studied using long duration individual (single-orbit) observations for each source.
Finally we have confirmed all grouped correlations are evident across the AGN sample via independent modelling and retrieved hints of a evolutionary turnover point in the AGN sample. We suggest this turnover point could be due to changes in the accretion rate and/or modification of the inner geometry of the accretion disc and corona.
Acknowledgements
This research has made use of software provided by the High Energy Astrophysics Science Archive Research Center (HEASARC) and has also used the NASA/IPAC Extragalactic Database (NED). This work was carried out using the computational facilities of the Advanced Computing Research Centre, University of Bristol – http://www.bristol.ac.uk/acrc/. SH would like to thank the STFC for funding and the Bristol, Cardiff & Swansea CDT Team for support. PC acknowledges funding support from (i) Suranaree University of Technology (SUT), (ii) Thailand Science Research and Innovation (TSRI), and (iii) National Science Research and Innovation Fund (NSRF), project no. 160355. We wish to thank the anonymous reviewer for comments and suggestions which has improved the quality of this manuscript.
Data availability
The data underlying this article were accessed from XMM-Newton Observatory (http://nxsa.esac.esa.int). The derived data generated in this research can be downloaded via http://www.star.bris.ac.uk/steff/hancock.html. This data is also available via Github pages (in development) at https://github.com/Steff075.
References
- Alston et al. (2020) Alston W. N., et al., 2020, Nature Astronomy, 4, 597
- Arévalo & Uttley (2006) Arévalo P., Uttley P., 2006, MNRAS, 367, 801
- Arévalo et al. (2008) Arévalo P., McHardy I. M., Summons D. P., 2008, MNRAS, 388, 211
- Baumgartner et al. (2013) Baumgartner W. H., Tueller J., Markwardt C. B., Skinner G. K., Barthelmy S., Mushotzky R. F., Evans P. A., Gehrels N., 2013, ApJS, 207, 19
- Bechtold et al. (2002) Bechtold J., Dobrzycki A., Wilden B., Morita M., Scott J., Dobrzycka D., Tran K.-V., Aldcroft T. L., 2002, The Astrophysical Journal Supplement Series, 140, 143
- Bentz & Katz (2015) Bentz M. C., Katz S., 2015, PASP, 127, 67
- Bentz et al. (2009) Bentz M. C., et al., 2009, ApJ, 705, 199
- Bian & Zhao (2003) Bian W., Zhao Y., 2003, MNRAS, 343, 164
- Blustin et al. (2003) Blustin A. J., et al., 2003, A&A, 403, 481
- Boller et al. (1997) Boller T., Brandt W. N., Fabian A. C., Fink H. H., 1997, MNRAS, 289, 393
- Brandt et al. (1994) Brandt W. N., Fabian A. C., Nandra K., Reynolds C. S., Brinkmann W., 1994, MNRAS, 271, 958
- Brightman et al. (2013) Brightman M., et al., 2013, MNRAS, 433, 2485
- Caballero-García et al. (2018) Caballero-García M. D., Papadakis I. E., Dovčiak M., Bursa M., Epitropakis A., Karas V., Svoboda J., 2018, MNRAS, 480, 2650
- Caballero-García et al. (2020) Caballero-García M. D., Papadakis I. E., Dovčiak M., Bursa M., Svoboda J., Karas V., 2020, MNRAS, 498, 3184
- Cackett et al. (2014) Cackett E. M., Zoghbi A., Reynolds C., Fabian A. C., Kara E., Uttley P., Wilkins D. R., 2014, MNRAS, 438, 2980
- Cerruti et al. (2011) Cerruti M., Ponti G., Boisson C., Costantini E., Longinotti A. L., Matt G., Mouchet M., Petrucci P. O., 2011, A&A, 535, A113
- Chainakun (2019) Chainakun P., 2019, ApJ, 878, 20
- Chainakun & Young (2012) Chainakun P., Young A. J., 2012, MNRAS, 420, 1145
- Chainakun & Young (2015) Chainakun P., Young A. J., 2015, MNRAS, 452, 333
- Chainakun & Young (2017) Chainakun P., Young A. J., 2017, MNRAS, 465, 3965
- Chainakun et al. (2019) Chainakun P., Watcharangkool A., Young A. J., Hancock S., 2019, MNRAS, 487, 667
- Chainakun et al. (2022) Chainakun P., Fongkaew I., Hancock S., Young A. J., 2022, MNRAS, 513, 648
- Connolly et al. (2016) Connolly S. D., McHardy I. M., Skipper C. J., Emmanoulopoulos D., 2016, MNRAS, 459, 3963
- Dauser et al. (2012) Dauser T., et al., 2012, MNRAS, 422, 1914
- Dauser et al. (2016) Dauser T., García J., Wilms J., 2016, Astronomische Nachrichten, 337, 362
- De Marco et al. (2013) De Marco B., Ponti G., Cappi M., Dadina M., Uttley P., Cackett E. M., Fabian A. C., Miniutti G., 2013, MNRAS, 431, 2441
- Done et al. (2012) Done C., Davis S. W., Jin C., Blaes O., Ward M., 2012, MNRAS, 420, 1848
- Emmanoulopoulos et al. (2011) Emmanoulopoulos D., McHardy I. M., Papadakis I. E., 2011, MNRAS, 416, L94
- Emmanoulopoulos et al. (2014) Emmanoulopoulos D., Papadakis I. E., Dovčiak M., McHardy I. M., 2014, MNRAS, 439, 3931
- Epitropakis & Papadakis (2016) Epitropakis A., Papadakis I. E., 2016, A&A, 591, A113
- Epitropakis et al. (2016) Epitropakis A., Papadakis I. E., Dovčiak M., Pecháček T., Emmanoulopoulos D., Karas V., McHardy I. M., 2016, A&A, 594, A71
- Ezhikode et al. (2020) Ezhikode S. H., Dewangan G. C., Misra R., Philip N. S., 2020, MNRAS, 495, 3373
- Fabian et al. (2009) Fabian A. C., et al., 2009, Nature, 459, 540
- Fabian et al. (2011) Fabian A. C., et al., 2011, MNRAS, 419, 116
- Fabian et al. (2013) Fabian A. C., et al., 2013, MNRAS, 429, 2917
- García et al. (2014) García J., et al., 2014, ApJ, 782, 76
- George & Fabian (1991) George I. M., Fabian A. C., 1991, MNRAS, 249, 352
- Giacchè et al. (2014) Giacchè S., Gilli R., Titarchuk L., 2014, A&A, 562, A44
- González-Martín & Vaughan (2012) González-Martín O., Vaughan S., 2012, A&A, 544, A80
- Grupe et al. (2010) Grupe D., Komossa S., Leighly K. M., Page K. L., 2010, The Astrophysical Journal Supplement Series, 187, 64
- Gu & Cao (2009) Gu M., Cao X., 2009, MNRAS, 399, 349
- Haardt & Maraschi (1991) Haardt F., Maraschi L., 1991, ApJ, 380, L51
- Hancock (2019) Hancock S., 2019, X-ray Reverberation in Active Galactic Nuclei, http://www.star.bris.ac.uk/steff/hancock.html
- Hinkle & Mushotzky (2021) Hinkle J. T., Mushotzky R., 2021, MNRAS, 506, 4960
- Houck & Denicola (2000) Houck J. C., Denicola L. A., 2000, in Manset N., Veillet C., Crabtree D., eds, Astronomical Society of the Pacific Conference Series Vol. 216, Astronomical Data Analysis Software and Systems IX. p. 591
- Ingram et al. (2019) Ingram A., Mastroserio G., Dauser T., Hovenkamp P., van der Klis M., García J. A., 2019, MNRAS, 488, 324
- Jin et al. (2017) Jin C., Done C., Ward M., 2017, MNRAS, 468, 3663
- Kara et al. (2013a) Kara E., Fabian A. C., Cackett E. M., Steiner J. F., Uttley P., Wilkins D. R., Zoghbi A., 2013a, MNRAS, 428, 2795
- Kara et al. (2013b) Kara E., Fabian A. C., Cackett E. M., Uttley P., Wilkins D. R., Zoghbi A., 2013b, MNRAS, 434, 1129
- Kara et al. (2014a) Kara E., Cackett E. M., Fabian A. C., Reynolds C., Uttley P., 2014a, MNRAS, 439, L26
- Kara et al. (2014b) Kara E., et al., 2014b, MNRAS, 445, 56
- Kara et al. (2016) Kara E., Alston W. N., Fabian A. C., Cackett E. M., Uttley P., Reynolds C. S., Zoghbi A., 2016, MNRAS, 462, 511
- Kara et al. (2019) Kara E., et al., 2019, Nature, 565, 198
- Karas et al. (1992) Karas V., Vokrouhlicky D., Polnarev A. G., 1992, MNRAS, 259, 569
- Katayama et al. (2004) Katayama H., Takahashi I., Ikebe Y., Matsushita K., Freyberg M. J., 2004, A&A, 414, 767
- Keel (1996) Keel W. C., 1996, AJ, 111, 696
- Kosec et al. (2018) Kosec P., Buisson D. J. K., Parker M. L., Pinto C., Fabian A. C., Walton D. J., 2018, MNRAS, 481, 947
- Kotov et al. (2001) Kotov O., Churazov E., Gilfanov M., 2001, MNRAS, 327, 799
- Lanzuisi et al. (2016) Lanzuisi G., et al., 2016, A&A, 590, A77
- Liu et al. (2002) Liu B. F., Mineshige S., Shibata K., 2002, The Astrophysical Journal, 572, L173
- Marcel et al. (2021) Marcel G., et al., 2021, arXiv e-prints, p. arXiv:2109.13592
- Marconi et al. (2008) Marconi A., Axon D. J., Maiolino R., Nagao T., Pastorini G., Pietrini P., Robinson A., Torricelli G., 2008, ApJ, 678, 693
- McHardy et al. (1999) McHardy I., Papadakis I., Uttley P., 1999, Nuclear Physics B - Proceedings Supplements, 69, 509
- McHardy et al. (2007) McHardy I. M., Arévalo P., Uttley P., Papadakis I. E., Summons D. P., Brinkmann W., Page M. J., 2007, MNRAS, 382, 985
- Miller et al. (2010) Miller L., Turner T. J., Reeves J. N., Braito V., 2010, MNRAS, 408, 1928
- Mizumoto & Ebisawa (2017) Mizumoto M., Ebisawa K., 2017, MNRAS, 466, 3259
- Mizumoto et al. (2014) Mizumoto M., Ebisawa K., Sameshima H., 2014, PASJ, 66, 122
- NED (2019) NED 2019, NASA/IPAC Extragalactic database, http://ned.ipac.caltech.edu/
- Nowak et al. (1999) Nowak M. A., Vaughan B. A., Wilms J., Dove J. B., Begelman M. C., 1999, ApJ, 510, 874
- Parker et al. (2017) Parker M. L., et al., 2017, Nature, 543, 83
- Parker et al. (2021) Parker M. L., et al., 2021, MNRAS, 508, 1798
- Ponti et al. (2012) Ponti G., Papadakis I., Bianchi S., Guainazzi M., Matt G., Uttley P., Bonilla N. F., 2012, A&A, 542, A83
- Pounds & Page (2006) Pounds K. A., Page K. L., 2006, MNRAS, 372, 1275
- Pounds et al. (1990) Pounds K. A., Nandra K., Stewart G. C., George I. M., Fabian A. C., 1990, Nature, 344, 132
- Pounds et al. (1995) Pounds K. A., Done C., Osborne J. P., 1995, MNRAS, 277, L5
- Reynolds (2021) Reynolds C. S., 2021, ARA&A, 59
- Reynolds et al. (1999) Reynolds C. S., Young A. J., Begelman M. C., Fabian A. C., 1999, ApJ, 514, 164
- Risaliti et al. (2009) Risaliti G., et al., 2009, MNRAS, 393, L1
- Rybicki, G. B. and Lightman, A. P. (2004) Rybicki, G. B. and Lightman, A. P. 2004, Radiative Process in Astrophysics. Wiley-VCH.
- Sarma et al. (2015) Sarma R., Tripathi S., Misra R., Dewangan G., Pathak A., Sarma J. K., 2015, MNRAS, 448, 1541
- Schulz et al. (1994) Schulz H., Knake A., Schmidt-Kaler T., 1994, A&A, 288, 425
- Shakura & Sunyaev (1973) Shakura N. I., Sunyaev R. A., 1973, A&A, 24, 337
- Shemmer et al. (2008) Shemmer O., Brandt W. N., Netzer H., Maiolino R., Kaspi S., 2008, The Astrophysical Journal, 682, 81
- Sobolewska et al. (2011) Sobolewska M. A., Papadakis I. E., Done C., Malzac J., 2011, MNRAS, 417, 280
- Szanecki et al. (2020) Szanecki M., Niedźwiecki A., Done C., Klepczarek Ł., Lubiński P., Mizumoto M., 2020, A&A, 641, A89
- Tanaka et al. (1995) Tanaka Y., et al., 1995, Nature, 375, 659
- Tanaka et al. (2004) Tanaka Y., Boller T., Gallo L., Keil R., Ueda Y., 2004, PASJ, 56, L9
- The Chandra X-Ray Center (2018) The Chandra X-Ray Center 2018, Proposal Planning Toolkit, http://cxc.harvard.edu/toolkit/colden.jsp
- Uttley et al. (2014) Uttley P., Cackett E. M., Fabian A. C., Kara E., Wilkins D. R., 2014, A&ARv, 22, 72
- Vaughan & Fabian (2004) Vaughan S., Fabian A. C., 2004, MNRAS, 348, 1415
- Vaughan et al. (2005) Vaughan S., Iwasawa K., Fabian A. C., Hayashida K., 2005, MNRAS, 356, 524
- Vestergaard (2002) Vestergaard M., 2002, ApJ, 571, 733
- Wilkins & Fabian (2013) Wilkins D. R., Fabian A. C., 2013, MNRAS, 430, 247
- Wilkins & Gallo (2015) Wilkins D. R., Gallo L. C., 2015, MNRAS, 448, 703
- Wilkins et al. (2016) Wilkins D. R., Cackett E. M., Fabian A. C., Reynolds C. S., 2016, MNRAS, 458, 200
- Wilkins et al. (2020) Wilkins D. R., García J. A., Dauser T., Fabian A. C., 2020, MNRAS, 498, 3302
- Wilms et al. (2000) Wilms J., Allen A., McCray R., 2000, ApJ, 542, 914
- Woo & Urry (2002) Woo J.-H., Urry C. M., 2002, ApJ, 579, 530
- Yang et al. (2015) Yang Q.-X., Xie F.-G., Yuan F., Zdziarski A. A., Gierliński M., Ho L. C., Yu Z., 2015, MNRAS, 447, 1692
- Zoghbi et al. (2010) Zoghbi A., Fabian A. C., Uttley P., Miniutti G., Gallo L. C., Reynolds C. S., Miller J. M., Ponti G., 2010, MNRAS, 401, 2419
- Zoghbi et al. (2012) Zoghbi A., Fabian A. C., Reynolds C. S., Cackett E. M., 2012, MNRAS, 422, 129
- Zoghbi et al. (2013) Zoghbi A., Reynolds C., Cackett E. M., Miniutti G., Kara E., Fabian A. C., 2013, ApJ, 767, 121
Appendix A AGN basic data
Source Redshift (9) (erg s-1) (erg s-1) () pc 1H 0707-495 0.0411(1) (2) 1.05 (3) Ark 564 0.024(4) (2) 0.976 (5) IRAS 13224-3809 0.0406(6) (2) 6.91 (29) MCG-6-30-15 0.007749(8) (9) 0.478 (11) Mrk 335 0.0285(10) (2) 0.588 (11) Mrk 766 0.01293(12) (28) 0.233 (11) Mrk 841 0.0365(13) (14) 0.166 (30) NGC 1365 0.0045(7) (2) 0.0195 (7) NGC 3516 0.00886(15) (14) 0.0623 (11) NGC 4051 0.0023(16) (2) 0.0107 (11) NGC 4151 0.0033(17) (2) 0.0182 (11) NGC 4395 0.0011(18) (19) 0.00423 (11) NGC 5548 0.01718(12 (2) 0.0937 (11) NGC 6860 0.0149(20) (2) 0.0102 (11) NGC 7314 0.0048(21) (2) 0.0151 (21) NGC 7469 0.0164(22) (9) 1.11 (11) PG 1211+143 0.0809(23) (9) 2.88 (5) PG 1244+026 0.0482(25) (2) 0.182 (24) PG 1247+267 2.043 (31) (9) 2.09 (26) REJ 1034+396 0.04(27) (2) 0.660 (27)
Appendix B AGN sample selection
| Source | Obs ID | Year | Exposure [eff] (ks) | Total counts | Group |
| 1H0707-495 | 0110890201 | 2000 | 46[41] | 4.22 | med(lc) |
| 0148010301 | 2002 | 80[76] | 2.66 | hi(hc) | |
| 0506200201 | 2007 | 41[38] | 2.45 | lo(lc) | |
| 0506200301 | 41[39] | 7.12 | med(hc) | ||
| 0506200401 | 43[41] | 1.63 | hi(hc) | ||
| 0506200501 | 47[41] | 2.02 | hi(hc) | ||
| 0511580101 | 2008 | 124[111] | 4.13 | hi(hc) | |
| 0511580201 | 124[93] | 4.54 | hi(hc) | ||
| 0511580301 | 123[84] | 4.12 | hi(hc) | ||
| 0511580401 | 122[81] | 2.78 | hi(hc) | ||
| 0653510301 | 2010 | 117[112] | 4.06 | hi(hc) | |
| 0653510401 | 128[118] | 6.58 | hi(hc) | ||
| 0653510501 | 128[93] | 4.16 | hi(hc) | ||
| 0653510601 | 129[105] | 5.50 | hi(hc) | ||
| 0554710801 | 2011 | 98[86] | 2.68 | lo(lc) | |
| Ark 564 | 0006810101 | 2000 | 35[10] | 3.90 | hi |
| 0206400101 | 2005 | 102[96] | 2.68 | hi | |
| 0670130201 | 2011 | 60[59] | 2.65 | hi | |
| 0670130301 | 56[55] | 1.39 | hi | ||
| 0670130401 | 64[55] | 1.40 | hi | ||
| 0670130501 | 67[67] | 2.42 | hi | ||
| 0670130601 | 61[53] | 1.41 | hi | ||
| 0670130701 | 64[41] | 6.42 | lo | ||
| 0670130801 | 58[57] | 1.83 | hi | ||
| 0670130901 | 56[56] | 2.30 | hi | ||
| IRAS13224-3809 | 0110890101 | 2002 | 64[61] | 1.01 | med(lc) |
| 0673580101 | 2011 | 133[49] | 1.09 | med(lc) | |
| 0673580201 | 132[99] | 1.74 | med(hc) | ||
| 0673580301 | 129[82] | 8.89 | lo(lc) | ||
| 0673580401 | 135[113] | 8.89 | med(hc) | ||
| 0780560101 | 2016 | 141[141] | 6.86 | med(hc) | |
| 0780561301 | 141[127] | 2.81 | med(hc) | ||
| 0780561401 | 141[126] | 2.11 | med(hc) | ||
| 0780561501 | 141[126] | 1.76 | med(hc) | ||
| 0780561601 | 141[137] | 4.08 | med(hc) | ||
| 0780561701 | 141[123] | 2.23 | med(hc) | ||
| 0792180101 | 141[123] | 1.83 | med(hc) | ||
| 0792180201 | 141[129] | 2.51 | med(hc) | ||
| 0792180301 | 141[129] | 1.08 | lo(lc) | ||
| 0792180401 | 141[120] | 5.22 | hi(hc) | ||
| 0792180501 | 138[122] | 2.19 | med(lc) | ||
| 0792180601 | 136[122] | 5.38 | hi(hc) | ||
| MCG-6-30-15 | 0029740101 | 2001 | 89[80] | 1.37 | hi |
| 0029740701 | 129[122] | 2.26 | hi | ||
| 0029740801 | 130[124] | 2.10 | hi | ||
| 0111570101 | 2000 | 46[43] | 3.96 | lo | |
| 0111570201 | 66[41] | 5.06 | lo | ||
| 0693781201 | 2013 | 134[121] | 2.70 | hi | |
| 0693781301 | 134[130] | 1.71 | lo | ||
| 0693781401 | 49[49] | 4.72 | lo | ||
| Mrk 335 | 0306870101 | 2006 | 133[120] | 1.80 | hi |
| 0600540501 | 2009 | 83[80] | 2.73 | lo | |
| 0600540601 | 132[107] | 2.44 | lo | ||
| Mrk 766 | 0096020101 | 2000 | 59[27] | 2.45 | med |
| 0109141301 | 2001 | 130[104] | 1.79 | hi | |
| 0304030101 | 2005 | 96[78] | 2.22 | lo | |
| 0304030301 | 99[98] | 5.97 | med | ||
| 0304030401 | 99[92] | 7.36 | med | ||
| 0304030501 | 96[73] | 7.31 | med | ||
| 0304030601 | 98[85] | 7.07 | med | ||
| 0304030701 | 34[29] | 2.08 | med | ||
| Mrk 841 | 0070740101 | 2001 | 123[108] | 1.26 | hi |
| 0070740301 | 148[122] | 1.41 | hi | ||
| 0205340201 | 2005 | 73[43] | 1.62 | lo | |
| 0205340401 | 30[18] | 8.91 | lo | ||
| NGC 1365 | 0151370101 | 2003 | 19[13] | lo | |
| 0151370201 | 11[2] | lo | |||
| 0151370701 | 11[8] | lo | |||
| 0205590301 | 2004 | 60[48] | lo | ||
| 0205590401 | 69[33] | lo | |||
| 0505140201 | 2007 | 129[38] | lo | ||
| 0505140401 | 2007 | 131[107] | lo | ||
| 0505140501(1) | 2007 | 131[88] | lo | ||
| 0505140501(2) | 2007 | 131[53] | lo | ||
| 0692840201 | 2012 | 139[101] | lo | ||
| 0692840301 | 126[44] | hi | |||
| 0692840401 | 2013 | 134[87] | hi | ||
| 0692840501(1) | 135[64] | lo | |||
| 0692840501(2) | 135[34] | lo | |||
| NGC 3516 | 0107460601 | 2001 | 128[114] | 4.34 | lo |
| 0107460701 | 130[121] | 2.83 | lo | ||
| 0401210401 | 2006 | 52[51] | 8.95 | hi | |
| 0401210501 | 69[61] | 9.82 | hi | ||
| 0401210601 | 68[62] | 5.39 | med | ||
| 0401211001 | 68[58] | 9.07 | hi | ||
| NGC 4051 | 0109141401 | 2001 | 122[106] | 1.90 | hi |
| 0157560101 | 2002 | 52[42] | 1.71 | lo | |
| 0606320101 | 2009 | 46[45] | 3.21 | lo | |
| 0606320201 | 46[42] | 4.81 | hi | ||
| 0606320301 | 46[21] | 2.92 | hi | ||
| 0606320401 | 45[18] | 6.25 | hi | ||
| 0606321301 | 33[30] | 4.86 | hi | ||
| 0606321401 | 42[35] | 3.62 | lo | ||
| 0606321501 | 42[36] | 3.72 | hi | ||
| 0606321601 | 42[39] | 7.76 | hi | ||
| 0606321701 | 45[28] | 1.43 | lo | ||
| 0606321801 | 44[40] | 2.99 | lo | ||
| 0606321901 | 45[36] | 1.34 | lo | ||
| 0606322001 | 40[37] | 2.58 | lo | ||
| 0606322101 | 44[24] | 4.89 | lo | ||
| 0606322201 | 44[36] | 1.34 | lo | ||
| 0606322301 | 43[35] | 2.65 | lo | ||
| NGC 4151 | 0112310101 | 2000 | 33[30] | 1.31 | lo |
| 0112830201 | 62[57] | 3.07 | lo | ||
| 0112830501 | 23[20] | 1.06 | lo | ||
| 0143500101 | 2003 | 19[19] | 2.90 | hi | |
| 0143500201 | 19[18] | 2.94 | hi | ||
| 0143500301 | 19[19] | 3.75 | hi | ||
| 0402660101 | 2006 | 40[40] | 1.56 | lo | |
| 0402660201 | 53[34] | 2.06 | lo | ||
| NGC 4395 | 0142830101 | 2003 | 113[90] | 9.22 | hi |
| 0744010101 | 2014 | 54[52] | 1.57 | lo | |
| 0744010201 | 53[48] | 3.03 | lo | ||
| NGC 5548 | 0089960301 | 2001 | 96[84] | 1.24 | hi |
| 0720110801 | 2013 | 58[52] | 1.56 | lo | |
| 0720110901 | 57[55] | 1.51 | lo | ||
| 0720111001 | 57[53] | 1.47 | lo | ||
| 0720111101 | 57[35] | 1.26 | lo | ||
| 0720111201 | 57[56] | 1.88 | lo | ||
| 0720111301 | 57[50] | 1.59 | lo | ||
| 0720111401 | 57[52] | 1.39 | lo | ||
| 0720111501 | 57[53] | 1.35 | lo | ||
| 0720111601 | 2014 | 57[56] | 2.03 | lo | |
| NGC 6860 | 0552170301 | 2009 | 123[117] | 8.36 | – |
| NGC 7314 | 0111790101 | 2001 | 45[43] | 2.72 | hi |
| 0311190101 | 2006 | 84[74] | 3.46 | lo | |
| 0725200101 | 2013 | 140[122] | 1.30 | lo | |
| 0725200301 | 132[128] | 1.09 | lo | ||
| NGC 7469 | 0112170101 | 2000 | 19[18] | 2.18 | lo |
| 0112170301 | 25[23] | 3.46 | hi | ||
| 0207090101 | 2004 | 85[85] | 1.30 | hi | |
| 0207090201 | 79[78] | 1.09 | lo | ||
| PG1211+143 | 0112610101 | 2001 | 56[53] | 1.96 | lo |
| 0208020101 | 2004 | 60[46] | 1.91 | lo | |
| 0502050101 | 2007 | 65[45] | 3.60 | hi | |
| 0502050201 | 51[35] | 2.23 | hi | ||
| 0745110101 | 2014 | 87[78] | 3.02 | hi | |
| 0745110201 | 104[98] | 2.61 | lo | ||
| 0745110301 | 102[54] | 2.19 | lo | ||
| 0745110401 | 100[91] | 4.36 | hi | ||
| 0745110501 | 58[55] | 3.35 | hi | ||
| 0745110601 | 95[92] | 5.41 | hi | ||
| 0745110701 | 99[96] | 4.35 | hi | ||
| PG1244+026 | 0675320101 | 2011 | 124[123] | 7.40 | hi |
| 0744440101 | 2014 | 119[108] | 4.01 | lo | |
| 0744440201 | 120[92] | 4.23 | lo | ||
| 0744440301 | 122[121] | 5.87 | lo | ||
| 0744440401 | 129[127] | 5.34 | lo | ||
| 0744440501 | 2015 | 120[118] | 4.54 | lo | |
| PG1247+267 | 0143150201 | 2003 | 34[32] | 8.16 | – |
| REJ1034+396 | 0506440101 | 2007 | 93[84] | 5.78 | lo |
| 0561580201 | 2009 | 70[54] | 2.41 | hi | |
| 0655310101 | 2010 | 52[45] | 1.50 | lo | |
| 0655310201 | 54[50] | 1.64 | lo |
Appendix C The lag-frequency results
| Source | Group | Flux) | Lag (s) | Lag-frequency (Hz) |
| 1H0707-495 | Combined | |||
| hi | ||||
| hi-cts>5 | ||||
| Med | ||||
| lo | ||||
| lo-cts<5 | ||||
| Ark 564 | Combined | |||
| hi | ||||
| lo | ||||
| IRAS 13224-3809 | Combined | |||
| hi | ||||
| hi-cts>5 | ||||
| med | ||||
| lo | ||||
| lo-cts<5 | ||||
| MCG-6-30-15 | Combined | |||
| hi | ||||
| lo | ||||
| Mrk 335 | Combined | |||
| hi | ||||
| lo | ||||
| Mrk 766 | Combined | |||
| hi | ||||
| med | ||||
| lo | ||||
| Mrk 841 | Combined | |||
| hi | ||||
| lo | ||||
| NGC 1365 | Combined | |||
| hi | ||||
| lo | ||||
| NGC 3516 | Combined | |||
| hi | ||||
| med | ||||
| lo | ||||
| NGC 4051 | Combined | |||
| hi | ||||
| lo | ||||
| NGC 4151 | Combined | |||
| hi | ||||
| lo | ||||
| NGC 4395 | Combined | |||
| hi | ||||
| lo | ||||
| NGC 5548 | Combined | |||
| hi | ||||
| lo | ||||
| NGC 6860 | 2009 | |||
| NGC 7314 | Combined | |||
| hi | ||||
| lo | ||||
| NGC 7469 | Combined | |||
| hi | ||||
| lo | ||||
| PG 1211+143 | Combined | |||
| hi | ||||
| lo | ||||
| PG 1244+026 | Combined | |||
| hi | ||||
| lo | ||||
| PG 1247+267 | 2003 | |||
| REJ 1034+396 | Combined | |||
| hi | ||||
| lo |